1. Introduction
Electrowetting-on-dielectric (EWOD) is a phenomenon to adjust reproducibly and reversibly the liquid-solid contact angle with appropriate electrical signals applied at the liquid–solid interface [
1,
2]. For a reliable variation of the contact angle yet a simple configuration of a device, EWOD has been widely exploited as an actuating force to manipulate liquids for optoelectrical and biomedical applications [
3,
4,
5,
6,
7,
8]. To characterize the actuating force of EWOD in various situations, an analysis of the voltage-dependent contact angle is essential. An optical system to capture the profile of a sessile droplet on a solid surface is the most common way to measure the contact angle [
9,
10,
11,
12], but, because an optical goniometer requires a clear and well-focused interface for direct observation, it is impractical under conditions in which the sessile droplet is immersed in an opaque medium or a medium with a refractive index similar to that of the droplet. In many applications, aqueous droplets are driven by EWOD in an immiscible liquid environment to improve the actuation performance and to avoid evaporation and contamination [
13,
14,
15]. A more generic method to measure the variation of the contact angle with EWOD of a sessile droplet in an optically incompatible medium is hence important.
To complement the inability of an optical goniometer under these conditions, we investigated a quartz-crystal microbalance (QCM) as an alternative method to determine the variation of the contact angle of a sessile droplet with EWOD. A QCM is a well-developed mass sensor commonly used to monitor the deposition of a thin film and for an analysis of surface properties [
16,
17,
18,
19,
20]. The QCM method is convenient and requires no subjective judgment of an interface. It enables the measurement of the contact angle of a droplet under flexible conditions that are challenging for an optical observation. Dynamic changes of the contact angle in droplet spreading and evaporation have also been characterized with a reproducible shift of the crystal resonance frequency [
21,
22]. We adopted the QCM method to study the change of contact angle when a droplet spreads during the EWOD process. The change of contact angle with EWOD is achieved with an electric field; it is described with the Lippmann–Young equation [
23]:
in which
θ is the contact angle at applied voltage
V,
θ0 is the original contact angle,
γ is the surface tension between the droplet and the ambient medium and
c is the specific capacitance of the dielectric layer. The change of contact angle results in spreading of the droplet and a change of the curvature of the meniscus, which have been carefully investigated and applied as a lens with an adjustable focal length controlled with an external electric field [
24,
25]. When the contact angle of a droplet is modified with an electric field in an asymmetric manner, the asymmetric meniscus results in a pressure difference to pump the droplet. The magnitude of the change of the contact angle affects the pumping force, such that a larger contact angle increases the force to drive the droplet.
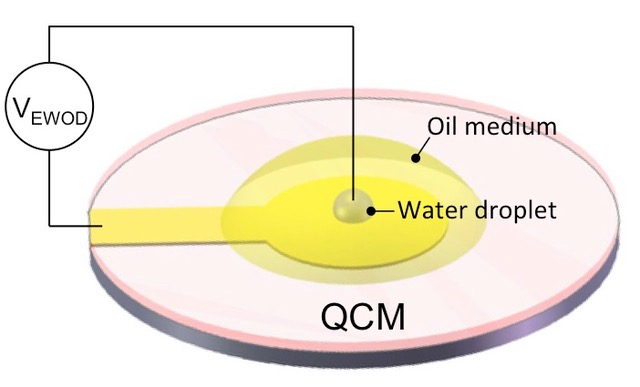
In this work, we applied the sessile-droplet method to measure EWOD directly on a QCM, adopting one QCM electrode for electrowetting. As shown in
Figure 1, we modified a QCM by depositing dielectric and hydrophobic layers on one electrode on one side of the QCM. The sessile droplet was placed on the side with coated dielectric and hydrophobic layers. An immiscible medium was added to surround the droplet; a probe was inserted into the droplet to apply the electric signal between it and the electrode covered with the dielectric and hydrophobic layers. On combining EWOD and a QCM, droplet spreading can be generated and controlled with EWOD and simultaneously detected with a QCM. Integrating EWOD and a QCM on a single microfluidic device has been shown previously, but the QCM worked primarily as a separate sensor to detect the formation of a protein multilayer [
26]. Our work provides the first report to demonstrate EWOD on a QCM chip for the dynamic measurement of contact angle; with this setup, we are able to monitor the potential-dependent change of contact angle of a water droplet in oil. The results verify theoretical predictions that a larger change of contact angle occurs in the medium of oil than in air, increasing the actuating force in the presence of oil. Our results from the QCM reveal also the existence of a thin oil film between the droplet and the hydrophobic layer on the substrate, of which the film thickness can be modulated with the applied electric field.
2. Materials and Methods
To measure the EWOD change of the contact angle using a QCM, the EWOD components, including dielectric and hydrophobic layers, were fabricated on a commercial quartz resonator as depicted in
Figure 1. A photoresist layer (FH-6400, FUJIFILM Electronic Materials, Tokyo, Japan, thickness 5 μm) and a Teflon layer (DuPont AF 1600, St. Joseph, MO, USA, thickness 55 nm) were spin-coated on a quartz oscillator (10 MHz, International Crystal Manufacturing, Oklahoma City, OK, USA) as the dielectric and hydrophobic layers for EWOD manipulation, respectively. As shown in
Figure 1a, the voltage applied across the sessile droplet to create EWOD (
VEWOD) was a 1-kHz square-wave AC electric signal increasing from 0 to 80 V at rate 0.5 V/s, generated with USB-6251 (National Instruments, Austin, TX, USA) and amplified (A-303, A. A. Lab Systems, Ramat-Gan, Israel). The QCM was operated with an electric signal (
VQCM) provided by a QCM oscillator (35366, International Crystal Manufacturing). The resultant frequency shift was acquired through a signal analyzer PXI-5600 and PXI-5620 (National Instruments) and recorded with the LabVIEW (National Instruments) program.
According to the Sauerbrey equation, the shift of the resonance frequency of a QCM is linearly proportional to the mass change of a solid thin film on the quartz plate [
27],
in which ∆
f is the shift of the resonance frequency,
f0 is the initial resonance frequency, ∆
m is the change of the surface mass,
A is the area of the QCM electrode,
ρq is the density of quartz (2648 kg/m
3 [
16,
19,
26]),
μq is the shear modulus equal to
ρqνq2 with
νq as the shear-wave velocity of quartz (3340 m/s [
16,
19,
27]), and
S is the sensitivity of unit mass defined with
When the quartz oscillator is immersed in a liquid on one side, the viscosity of the liquid damps the shear wave and generates a frequency shift as [
28]:
in which
η is the liquid viscosity;
ρ is the density of the liquid. Equation (4) becomes converted to the Sauerbrey equation on introducing ∆
m =
Aρδ/2 as indicated by Equations (5) and (6) [
29].
Equations (5) and (6) provide a physical picture of the QCM response under the liquid; the liquid can be viewed as an effective liquid layer of thickness
δ/2. Because of the presence of the electrode boundary, the response of the QCM to mass is inhomogeneous on the resonator but has a radially dependent Gaussian profile. The radially dependent QCM sensitivity
S for a unit mass is expressible as [
28]
in which
re is the radius of the electrode,
K is the maximum sensitivity at the center of the resonator that can be deduced from the experiment on covering the electrode completely with a liquid of known density and viscosity, and
β defines the sensitivity dependence on
r (
Figure 1b), which was empirically decided as 2–2.15 [
30,
31]. Different from a QCM entirely covered with one liquid (Equations (5) and (6)), sensitivity
S is important when measuring the position of the moving boundary of the droplet and a medium driven by EWOD. The frequency shift caused by a droplet with a given covering radius
rd in a medium [
29] (
Figure 1b) is
in which
ma represents the mass per unit area,
ρ and
δ represent the density and effective thickness of the droplet, respectively; subscripts
w and
o denote the water droplet and the medium, and
re is the electrode radius. The radius-dependent frequency response allows the user to derive the contact radius (
rd) from the QCM results (∆
f). Given the volume of the droplet (
Vd), the contact radius has a specified relation with the contact angle as revealed by the droplet geometry [
29] as follows:
Equations (8) and (9) explain how a QCM resolves the contact angle. The contact radius rd is first derived on measuring the shift of the resonance frequency from the QCM using Equation (8); the contact angle is then obtained through the formula indicated in Equation (9).
3. Results and Discussion
We first conducted the calibration and characterization of the QCM. For an EWOD test on a QCM, the deposited dielectric and hydrophobic layers caused a small mass increase on the QCM electrode and a slight frequency shift; the initial resonance frequency (f0) was 9.93 MHz, rather than 10 MHz. We then evaluated the value of K in Equation (7) on immersing one side of the entire QCM electrode in silicone oil (Dow Corning 200 Fluid, USA, 50 cSt) and recording frequency shift ∆f. K was calculated from Equation (7) as −2.25 × 10¹² on substituting β = 2.
The contact angle was measured first for a droplet (volume 3 μL) of deionized (DI) water with a contact area smaller than the QCM electrode (diameter 2.25 mm) in ambient air as shown in
Figure 2a. From Equation (9), the relation between the contact angle and the contact radius of a 3-μL droplet is plotted in
Figure 2b. On measuring the contact radius (
rd) and using
Figure 2b, we obtained the contact angle. The result was compared with that of an optical goniometer as shown in
Figure 2c. Limited by the resolution, 10 Hz, of the frequency detection in our system, ∆
f carries an uncertainty at most 10 Hz. The angular degree corresponding to a 10-Hz frequency change was calculated and treated as the resolution of the QCM measurement system. Given the volume (3 μL) of the droplet with a varied contact angle
θ, the resolution (or uncertainty) of the measurement of the QCM contact angle can be evaluated, as shown in
Figure 2d. The uncertainty propagation resulted in an uncertainty 0.2°~0.6° of contact angle in the measurement. From
Figure 1c, the QCM results agreed with the Lippman–Young estimate before attaining saturation. The deviation of the QCM results from the optical results increased gradually as the voltage increased. According to
Figure 1d, the deviation arose not from the measurement uncertainty but from two main reasons. In EWOD with an increasing voltage, the droplet spread and caused some unavoidable lateral displacement of the droplet from its original central position. As ∆
f has a Gaussian dependence on the radial distance, the displacement from the central position caused a decrease in ∆
f. A smaller ∆
f yielded a smaller contact radius and thus a larger contact angle. The other reason is that evaporation of the droplet caused negligible effects in the optical measurements. In the calculation model, the volume of the droplet was assumed to remain constant, but evaporation of the droplet inevitably occurred during 160 s of the voltage application from 0 to 80 V at increment 0.5 V/s. Evaporation, according to the lateral displacement described above, caused a smaller ∆
f that resulted in a larger contact angle. Both factors contributed to the larger contact angle measured in the QCM experiment, particularly in the region of larger voltage. Although the largest deviation, 6°, seems substantial, it is notable that the optical measurement of the contact angle depends on a subjective selection of the interface; the inherent error is ~5° in our system. The dynamic QCM measurement of the contact angle for the droplet with an air–water interface in EWOD is considered satisfactory, especially in the region of small voltage.
In the case of a water droplet immersed in oil on an EWOD chip, it has long been known that an oil medium facilitates the movement of a droplet [
13,
14,
15]. One reason is that a larger change of contact angle is induced in oil under the same applied voltage because of the decreased interfacial tension (Equation (1)). Another possibility is that a thin oil film automatically forms between the water droplet and the hydrophobic substrate, which lubricates the surface and decreases the friction. Although the existence of such an oil film between a droplet and a hydrophobic layer has been proposed [
32,
33,
34], the properties and mechanism remain elusive. We used a water droplet that completely covered the QCM electrode (diameter 2.25 mm) and replaced the air medium with silicone oil (50 cSt) as shown in
Figure 3a; we then applied an electric signal 0 to 90 V at increment 0.5 V/s and switched it off between the inserted probe and the top QCM electrode. The resonance frequency of the QCM was monitored and is plotted in
Figure 3b. As water and oil dispersed on the QCM, the resonance frequency initially decreased, as shown in regime A in
Figure 3b. A transient increase in resonance frequency was then observed in regime B in
Figure 3b when a periodic voltage was applied; after the transient increase, a stable variation of the resonance frequency was observed with the on-off voltage (regime C in
Figure 3b). According to Equation (8), when a liquid droplet covers the entire electrode area homogeneously, the externally applied voltage causes no frequency shift ∆
f. The voltage-dependent ∆
f implied that both water and oil were present in the QCM sensing region and altered the effective mass; oil infused under the water droplet and formed a thin layer. The variation of the resonance frequency with on-off voltage demonstrated the variation of the thickness of the oil layer.
The infused oil film made Equation (8) no longer sufficient for the calculation of the contact angle. The idea of an oil film was implemented in our model as a modification term; the contact angle was calculated with the modified model to discover whether it fitted the theoretical value. The model assumed a uniform and homogeneous oil layer underneath the water droplet; the oscillating shear wave of the QCM penetrated a composite of the oil and water layers with individual thicknesses
Fo(
V)
δo/2 and
Fw(
V)
δw/2, respectively (
Figure 3a). The effective thickness of passivation to the QCM wave for pure 50 cSt oil and water can be calculated from Equation (6) as 0.6 μm and 0.08 μm, denoted as
δo/2 and
δw/2, respectively. In the case of both water and oil being present,
Fo(
V) +
Fw(
V) = 1 to conserve the total effective thickness that the QCM shear wave influences. The resultant shift of the frequency becomes
Fo(
V) and
Fw(
V) were determined from the measured resonance frequency (
Figure 3b) with the experimental setup shown in
Figure 3a. We reexamined
Figure 3b with the concept of an infused oil film. In regime A, directly after oil and water were added to the QCM, the decrease of the resonance frequency was approximately ∆
f caused by only 50 cSt silicone oil (13.5 kHz from Equation (4)). In regime A, the QCM detected no water; the thickness of the oil film was at least 0.6 μm. In regime B, when the first voltage 0 to 95 V (increment 0.5 V/s) was applied between the probe and the top QCM electrode, oil was gradually squeezed out; the thinning of the oil film was confirmed with the decreasing ∆
f. When the QCM was covered merely with water, ∆
f was 1.9 kHz. We know from the measured ∆
f that, even at 95 V immediately before switching off the voltage, oil was still sensed by the QCM. After the voltage was terminated, oil infused back between the QCM and water, generating an increased ∆
f. In regime B, after 2–3 cycles of voltage application, the squeezing and infusing of oil became reproducible, showing repeatable ∆
f cycles in regime C. We hence analyzed one ∆
f cycle (dashed circle in
Figure 3b) to obtain
Fo(
V) and
Fw(
V) with the assistance of Equation (10) on setting
rd equal to
re. With the known
K (the measurement described earlier),
Fo(
V) was calculated and is plotted in
Figure 3c as a function of time.
Figure 3d shows the average
Fo(
V) at various applied voltages from the cycles in regime C of
Figure 3b. The effective thickness of the oil film (
Fo(
V)
δo/2) detected with ∆
f of QCM is also labeled in
Figure 3d. The thickness was 0.12–0.3 μm depending on the applied voltage. Our results clearly showed that oil was squeezed out as the applied voltage increased, whereas oil infused between water and QCM when the applied voltage decreased.
With
Fo(
V) determined from several repeated experiments (
Figure 3d), the dynamic change of the contact angle of a tiny droplet in oil on an EWOD chip is calculable with the modified model (with an oil film) in Equation (10). The shift ∆
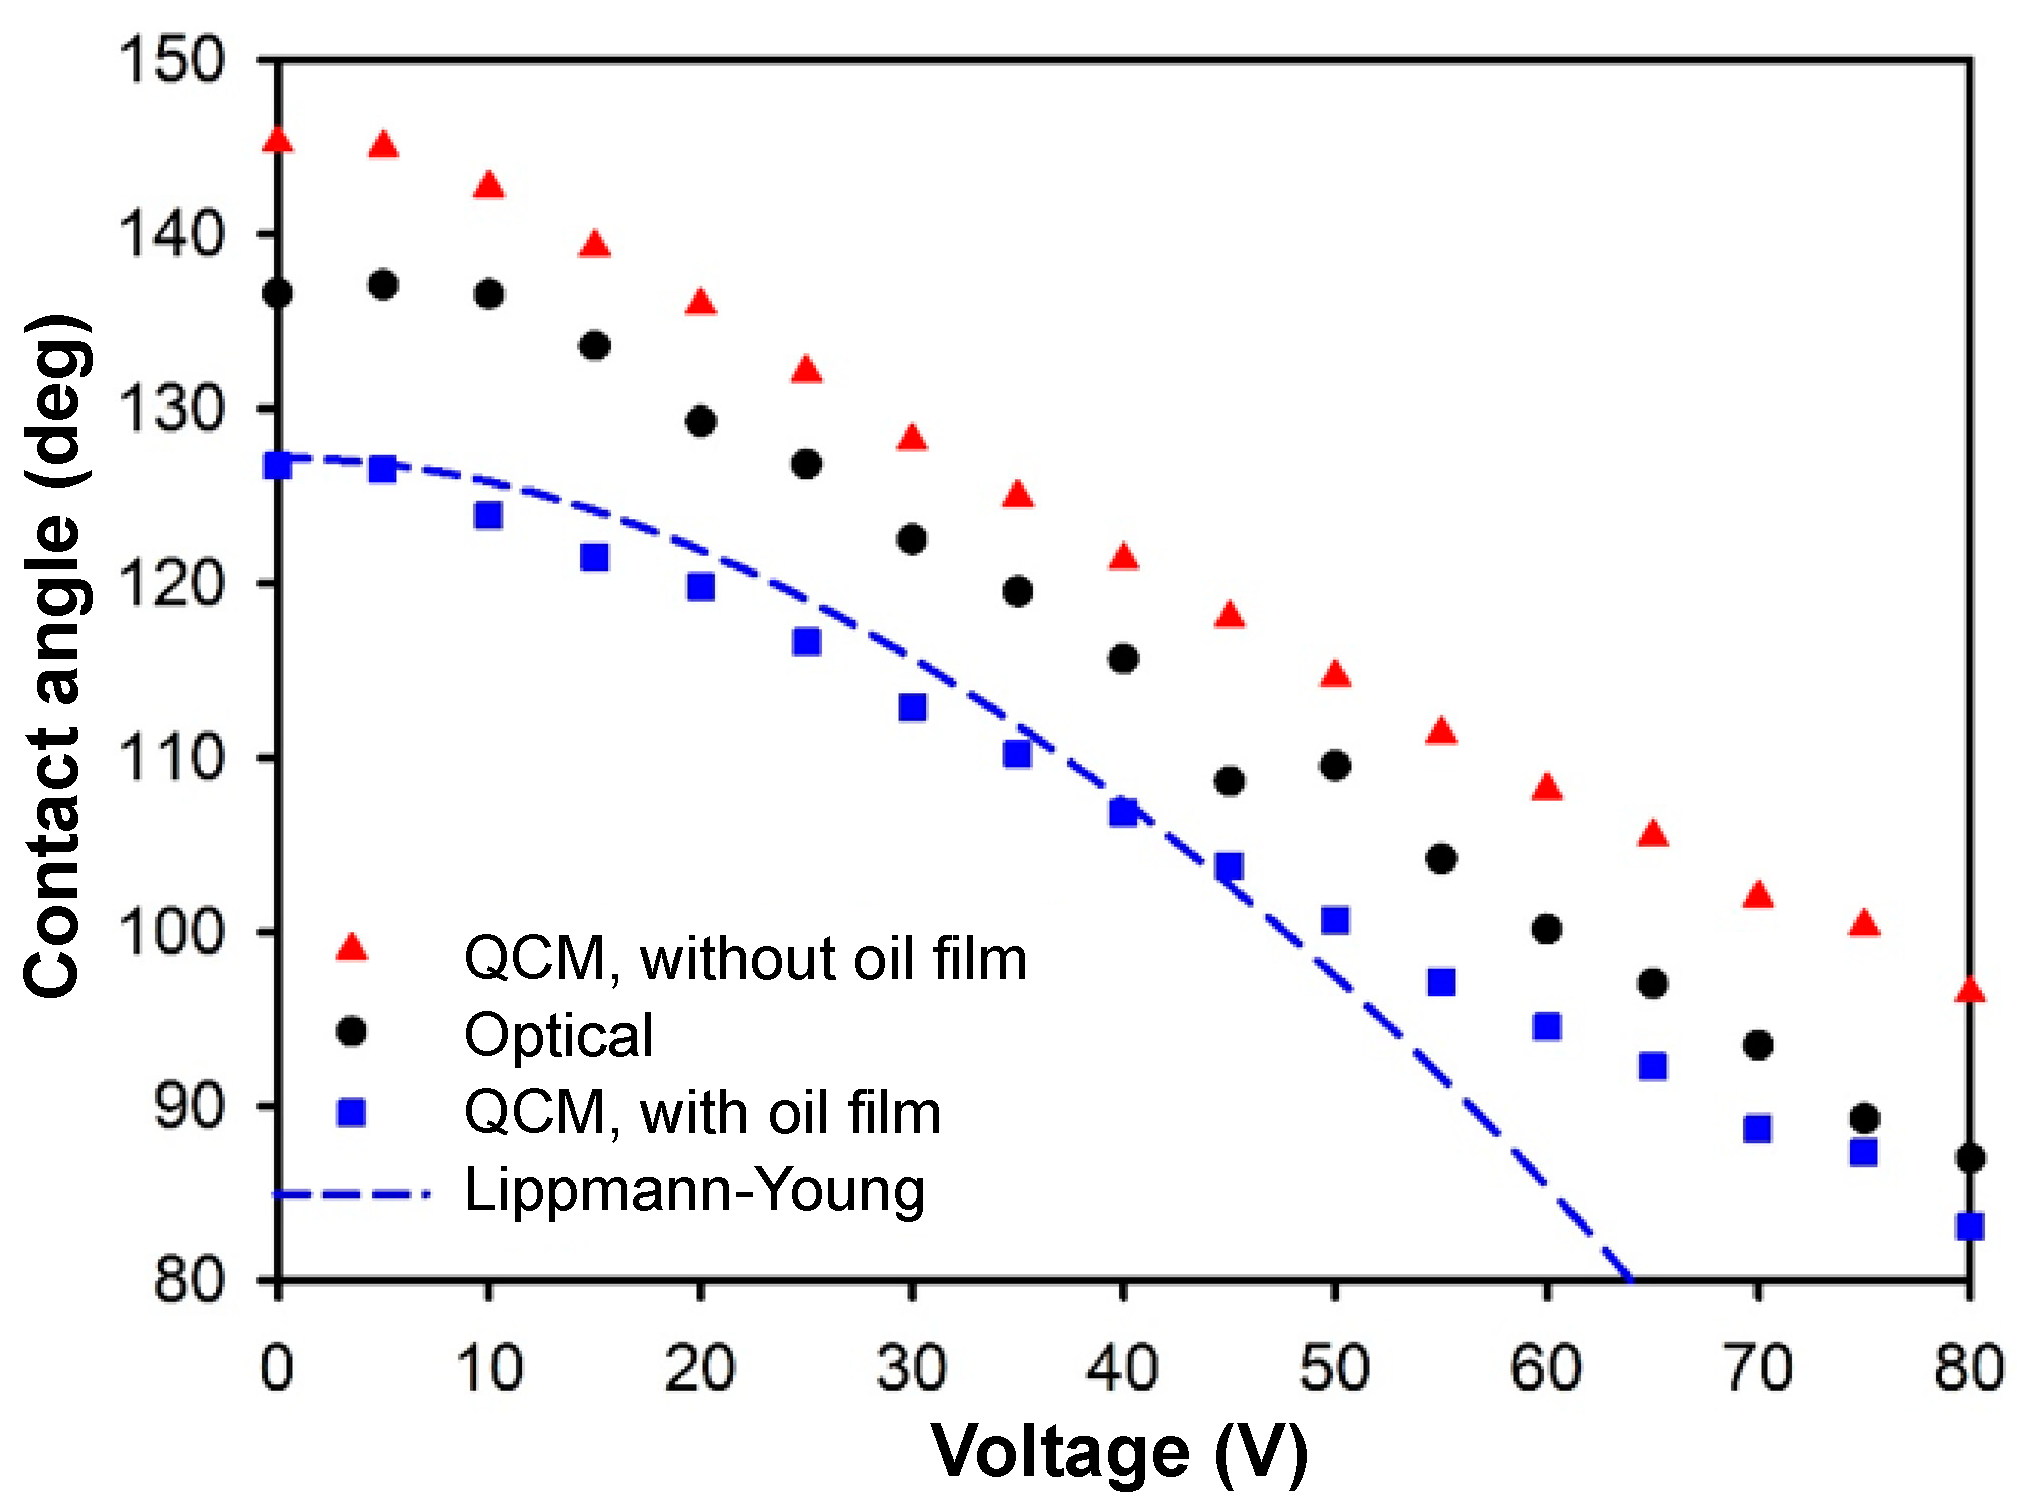
f of the QCM frequency from the experiment was substituted into Equation (10) to yield the contact radius, which then gave the contact angle according to Equation (9). Shown in
Figure 4, the QCM results were compared with those of an optical goniometer and the Lippmann–Young estimate. The QCM results (with oil film) followed the trend predicted with the Lippmann–Young equation until the contact angle attained saturation. The modified QCM and optical data matched each other better at a large voltage. As opposed to the air case, here the closer match between the QCM and optical results at high voltage implied that evaporation was an issue in the air case, as the droplet in oil was not subject to evaporation so that the volume remained constant in the EWOD process. At a small voltage, the contact angles measured with the QCM were 10° less than from the optical means. This effect might be caused by the non-uniformity of the oil film. We compared the QCM results also from the unmodified model in Equation (8) that took no oil film into consideration. The QCM results without the oil film were larger than the optical and modified QCM results.


