1. Introduction
Climate change is one of the global challenges of our time; the European Union (EU) has played a pioneering role in implementing policies to mitigate its effects. Through initiatives such as the Green Deal, the EU seeks to achieve climate neutrality by 2050, establishing a regulatory framework that covers multiple sectors, including transport and the maritime industry [
1]. As part of this strategy, measures such as the Fit for 55 legislative package have been implemented, designed to reduce greenhouse gas emissions by at least 55% by 2030 compared to 1990 levels [
2].
Within this framework, maritime transport has recently been incorporated into the EU emissions trading system (ETS), forcing shipping companies to pay for CO
2 emission permits based on their routes and fuel consumption. This regulation has the potential to transform the competitiveness of European ports, affecting logistics strategies and the redistribution of maritime traffic [
3]. The need to reduce emissions from the sector is crucial, as shipping accounts for approximately 3% of global CO
2 emissions and, until recently, was not subject to emissions regulations comparable to those in other sectors [
2].
While the implementation of the ETS in the maritime sector is a measure aligned with the EU’s sustainability objectives, its economic and operational impact on European ports has not been fully assessed [
4]. The increase in operational costs resulting from the payment of allowances could lead to a loss of competitiveness in ports subject to ETS, incentivising route reconfiguration and favouring calls at third-country ports with less stringent environmental regulations (carbon leakage) [
3]. In addition, the complexity of the monitoring, reporting, and verification mechanism (MRV System) introduces additional challenges in emissions management, as the different indicators assessed can have unequal impacts on the determination of the costs associated with the ETS refs. [
5,
6].
In this context, there is a need to develop advanced modelling tools to analyse the relationship between MRV indicators and ETS costs. Bayesian network-based modelling offers an innovative approach to understanding the structure of dependencies between the key factors that determine emissions and their economic impact, enabling more informed decision-making by actors in the port and maritime sector.
The main objective of this study is to analyse the main indicators of the MRV system from which the costs of the maritime ETS are derived, using an approach based on Bayesian networks. The main contributions of the work are as follows:
Identify the MRV indicators most influential in determining ETS costs.
To develop a probabilistic model to assess the impact of the ETS on the competitiveness of European ports.
To provide a data-driven decision-making tool useful for port operators and shipping companies in optimising their cost mitigation and sustainability strategies.
This article is structured in five main sections. First,
Section 2 presents a state-of-the-art analysis, addressing the regulatory framework of the EU emissions trading system (ETS) applied to maritime transport and the role of the monitoring, reporting, and verification (MRV) system in quantifying emissions. Likewise, the existing literature on the application of Bayesian networks (BNs) in the modelling of complex systems in the port and maritime field is reviewed. In
Section 3, the methodology used in the study is detailed, describing the research design, the selection of MRV indicators, the construction of the database, and the development of the probabilistic model based on Bayesian networks. Subsequently,
Section 4 presents the results obtained and their analysis, highlighting the main findings on the relationship between MRV indicators and ETS costs, as well as the hierarchy of key variables.
Section 5 presents the conclusions of the study, highlighting its implications for strategic planning in the maritime and port sector, as well as the limitations of the study and the prospects for future research, including possible improvements in the model and its application in other regulatory contexts.
2. State-of-the-Art
2.1. The EU Emissions Trading System (ETS) Applied to Maritime Transport
The European Union has established an ambitious regulatory framework to reduce greenhouse gas (GHG) emissions and move towards climate neutrality by 2050, as part of the Green Deal [
1]. Within this plan, the EU emissions trading system (EU ETS) represents one of the key tools to incentivise the decarbonisation of the industrial and energy sector through a market system that allocates costs to carbon pollution [
7].
Originally, the EU ETS was designed for sectors such as power generation and heavy industry, but its progressive expansion has included the maritime sector, an area historically exempt from emission restrictions equivalent to other sectors [
8]. From 2024, shipping companies operating in European waters will have to participate in this market, paying for CO
2 emission permits according to their routes and fuel consumption [
9].
The expansion of the ETS to maritime transport is part of the ambitious legislative package Fit for 55, which aims to achieve a 55% reduction in greenhouse gas (GHG) emissions by 2030, based on 1990 levels [
10]. This initiative introduces a progressive approach to emissions coverage, which includes all vessels of more than 5000 GT operating on intra-European routes, as well as 50% of emissions generated on routes to and from the European Union.
The implementation of the ETS in this sector will be carried out gradually. By 2024, shipping companies will be obliged to pay for 40% of their total emissions. This percentage will increase to 70% in 2025, to reach 100% in 2026, when all emissions from regulated ships will be subject to this scheme [
8]. This phased approach seeks to facilitate the adaptation of the sector to new demands and encourage investments in cleaner technologies from the early stages of implementation.
In addition, the scope of the ETS will expand in the future. From 2026, the possibility of including smaller vessels within the regulation will be evaluated, expanding the impact of the system. Consideration will also be given to incorporating new types of emissions, such as methane (CH
4) and nitrogen oxides (NO
x), in an effort to capture a greater share of the gases that contribute to climate change [
9].
This progressive and adaptable approach reflects the EU’s commitment to a gradual but steady transition towards the decarbonisation of shipping.
The inclusion of maritime transport in the EU ETS represents a significant change in the economy of the sector, generating both opportunities and challenges:
Incentive for decarbonisation: The obligation to purchase emission permits seeks to encourage the adoption of alternative fuels, the optimisation of routes, and investment in energy efficiency technologies [
7].
Impact on the competitiveness of European ports: The additional costs arising from the ETS could cause some companies to reconfigure their routes to avoid calls in the EU, benefiting third-country ports with less stringent regulations (carbon leakage) [
3].
Implementation and compliance challenges: A robust monitoring and verification system will be required. Ref. [
5], which represents both a technical and administrative challenge for shipping companies and port authorities [
10].
2.2. Monitoring, Reporting, and Verification (MRV) System
The monitoring, reporting, and verification (MRV) system implemented by the European Union is an essential mechanism to ensure transparency and accuracy in the quantification of greenhouse gas emissions in the maritime sector. Introduced in 2018, this system seeks to collect and analyse data on the fuel consumption and CO
2 emissions of vessels over 5000 GT operating within the European Economic Area [
11]. The importance of MRV lies in its ability to provide robust data that serve as the basis for the design and implementation of environmental policies, such as the EU emissions trading system (EU ETS).
The MRV mechanism is based on three fundamental pillars:
Monitoring: Shipowners should collect detailed information on fuel consumption, cargo carried, distances travelled, and ports visited.
Report: The data collected are submitted annually to the competent authorities through digital platforms such as THETIS-MRV [
12].
Verification: Submitted reports are evaluated by independent entities to ensure accuracy and compliance with established regulations [
4].
After more than five years since its implementation, the monitoring, reporting, and verification (MRV) system has proven to be an effective tool to promote transparency in the European maritime sector. This mechanism has made it possible to collect reliable data on emissions, which is essential to design more accurate environmental policies. However, its operability is not without significant challenges that limit its scope and effectiveness.
First, the operational complexity of MRV represents a considerable obstacle, especially for small and medium-sized shipping companies. Data collection and verification require a robust technical infrastructure and generate high administrative costs, which can make it difficult for actors with more limited resources to participate [
13].
Another critical aspect is the limited coverage of the system. Although MRV covers a significant proportion of larger vessels, many smaller vessels fall out of reach. In addition, non-carbon dioxide emissions such as methane (CH
4) and nitrogen oxides (NO
x) are also not included in the current scheme, limiting its ability to comprehensively address the environmental impact of the maritime sector [
14].
Finally, the lack of data standardisation is a major technical challenge. Discrepancies in the format and quality of the reported data make comparative analysis between operators and regions difficult, complicating the accurate assessment of shipping companies’ environmental performance [
11].
Addressing these constraints will be key to ensuring that MRV fully fulfils its role as an environmental governance tool and essential support for initiatives such as the European Union’s emissions trading system.
The future of MRV could be marked by the integration of advanced technologies such as blockchain and big data analytics. These tools have the potential to automate monitoring and verification, reduce administrative costs, and increase transparency [
15]. For example, the use of blockchain-based smart contracts can ensure that emissions data are collected and validated in real-time, minimising human error and fraud.
MRV not only provides an essential database for the ETS but also plays a crucial role in assessing the costs associated with emissions. The data collected by MRV have made it possible to accurately calculate the direct costs of ETS for shipping companies, facilitating strategic planning and regulatory compliance. In addition, the system has demonstrated its potential to identify fuel consumption and emissions patterns, which could be used to optimise routes and improve operational efficiency in the maritime sector [
4].
2.3. Use of Bayesian Networks in the Modeling of Complex Systems
Bayesian networks (BNs) are widely used probabilistic tools to model dependency relationships between variables and manage uncertainty in complex systems. Their ability to integrate quantitative and qualitative data makes them a powerful choice for addressing interdisciplinary issues in sustainability, logistics, and risk management [
16,
17].
In the field of environmental sustainability, BNs have stood out as a participatory approach that allows the integration of knowledge from multiple actors to better understand complex environmental systems. For example, they have been used to assess the sustainability of watersheds, as in the case of resource management in the Hablehrood River basin, where environmental and socioeconomic variables were integrated to propose sustainable management solutions [
18].
In terms of social sustainability, these networks have been applied to evaluate the social impact of infrastructure projects. This approach has made it possible to analyse design alternatives and mitigate negative effects on communities, promoting more balanced and sustainable planning [
19].
In addition, BNs have been used in the evaluation of the sustainability of supply chains, integrating economic, social, and environmental aspects. This type of analysis allows you to identify areas for improvement in logistics operations and perform comprehensive assessments of supply networks [
20].
In the transport sector, BNs have been used to model the resilience of urban transport systems, providing key tools to plan and manage urban mobility in a sustainable and resilient way [
21]. On the other hand, in the field of renewable energies, these networks have been applied to risk analysis in the wind industry, improving the sustainability and reliability of energy systems [
22].
In the port context, BNs have proven to be effective in classifying and predicting operational variables, contributing to better strategic management and improving the operational efficiency of ports [
23,
24]. Likewise, its implementation in the management of maritime risks, such as oil spills, has shown significant benefits in risk assessment and response planning [
25].
BNs have evolved towards more advanced approaches, such as integration with digital twins (Digital Twins), enabling real-time monitoring of complex systems. This approach has proven useful in managing the operational health of maritime and logistics systems [
17]. In addition, their ability to manage uncertainty makes them a crucial tool in the design of public policies and sustainability strategies, as evidenced by their application to explore synergies and trade-offs between the Sustainable Development Goals (SDGs) of the 2030 Agenda [
26].
In summary, Bayesian networks represent an essential tool in the modelling of complex systems. Their ability to integrate multiple variables and manage uncertainty makes them ideal for sustainability assessment and planning. This study uses BNs to analyse the relationships between MRV system indicators and costs associated with the ETS, providing a solid basis for informed decision-making in the port and maritime sector.
In the field of port sustainability and decision-making, various methodological approaches have been explored to address uncertainties and optimise operations. Ref. [
27] provides a comprehensive review of tools and technologies for sustainable ports, highlighting how research supports decision-making processes. Their study emphasises multi-criteria assessment frameworks and simulation-based methods but notes limitations in capturing probabilistic dependencies among key sustainability indicators. Unlike Bayesian networks, which explicitly model uncertainty and interdependencies, these tools often rely on static assessments that may not adapt well to dynamic port environments.
Similarly, ref. [
28] explores multiple-criteria decision-making (MCDM) under uncertainty in port management, proposing a structured approach to weigh competing objectives. While MCDM techniques effectively integrate diverse criteria, they lack the probabilistic inference capability of Bayesian networks, which can dynamically update predictions as new data become available. This adaptability is crucial in regulatory environments such as the emissions trading system (ETS), where unforeseen variables influence costs.
Focus on transshipment port selection, applying decision-making models based on deterministic criteria. Their findings highlight the importance of economic and operational factors in port selection but do not account for the conditional dependencies between variables [
29]. Bayesian networks offer a more flexible approach, allowing decision-makers to assess how changes in one factor influence overall outcomes probabilistically.
By integrating Bayesian networks, this study advances prior research by providing a data-driven framework that accommodates uncertainty and interdependencies, offering a more robust tool for strategic decision-making in port sustainability.
2.4. Gap Research
Despite progress in the implementation of the emissions trading system (ETS) in European shipping, there are still significant gaps in understanding its economic and operational impact on ports. Most previous studies have approached the ETS from a general regulatory or economic perspective, without delving into how monitoring, reporting, and verification (MRV) indicators affect the specific costs of emissions. The lack of a quantitative approach that directly links these indicators to the ETS makes it difficult for shipping companies, port operators, and policymakers to make strategic decisions. In addition, although MRV provides a wealth of data on fuel consumption and CO2 emissions, a robust analytical model has not yet been developed to identify which of these indicators have a greater weight in determining ETS costs and how they influence the competitiveness of European ports.
This study fills this methodological gap by applying Bayesian networks to model the interdependencies between the different MRV indicators and their influence on ETS costs. Unlike previous approaches, this probabilistic model allows us to identify causal relationships and quantify the uncertainty in the evolution of the costs associated with the regulation of the ETS. In addition, by structuring the indicators in a hierarchical network, the interpretation and practical application of the results is facilitated, allowing actors in the maritime sector to develop informed strategies to minimise costs and improve sustainability. In this way, this research not only contributes to the knowledge about the impact of the ETS on the port sector but also provides an innovative and data-driven tool for the optimisation of policies and operations within the framework of the ecological transition of the European Union.
3. Methodology
In this chapter, the phases followed in the research are presented. These phases are schematically outlined in
Figure 1.
Phase 0: Research Design
The design of this research is descriptive and exploratory. This approach is appropriate for the objective of the study, which is to analyse the interrelationships between the indicators of the European Union’s monitoring, reporting, and verification (MRV) system and to explore which of them are most influential when assessing the emissions trading system (ETS). This approach not only allows us to understand existing patterns but also to identify opportunities to improve the sustainability and competitiveness of European ports under the ETS regulatory framework.
Phase 1: Selection of Study Scope
The scope of the study covers the entire MRV system of the European Union, which includes vessels of more than 5000 GT operating on intra-European routes and routes to or from the EU. This approach ensures the representativeness and relevance needed to assess how MRV system indicators impact ETS costs. The data used comes from the public platform THETIS-MRV [
12], which provides official information on ship emissions and fuel consumption.
Phase 2: Identification of Indicators
To build the Bayesian network, all indicators collected from the MRV system were identified and selected. These include variables related to fuel consumption, the type of vessel, distances travelled, reported CO
2 emissions, times in port, etc. The selection of indicators was based on the revision of European regulations and the data available in THETIS-MRV [
12].
This study incorporates all indicators provided by the MRV-THETIS system, ensuring comprehensive coverage of emissions verified under European regulations. This approach guarantees that the Bayesian network structure captures the full range of monitored variables, avoiding omissions and preserving the statistical integrity of interdependencies within the model.
Phase 3: Database Creation and Preprocessing
In this phase, historical data on the selected indicators were collected from the MRV system’s annual reports. The following steps were then taken to prepare the data for use in the model:
To adapt the data to the probabilistic approach, an equal-frequency discretisation method was applied, ensuring an appropriate representation of the distributions of continuous variables. This approach preserves key variability information while preventing biases introduced by equal-width intervals or arbitrary segmentations. Discretisation is a fundamental step in Bayesian network modelling, as it facilitates the estimation of conditional probability distributions without requiring an excessively large dataset for each combination of values.
Phase 4: Bayesian Networks
Definition and Justification
Bayesian networks were selected as the main tool due to their ability to model dependency relationships between variables and manage uncertainty, critical aspects in a complex system such as MRV [
30]. These networks allow us to identify conditional relationships between the indicators and determine which ones are most influential on the costs of the HTA. These probabilistic networks are based on Bayes’ theorem. The general formula for calculating the probability of a series of variables (nodes) is as follows (Formula (1)):
where the following is valid:
are the variables of the Bayesian network;
represents the conditional probability of variable , given its parent set, which are the nodes that have a direct connection to .
Model Construction
The Bayesian network model was built using the pgmpy software (version 2024) [
31], Python (version 3.14) library specialised in probabilistic networks. A network structure was established that includes the selected indicators as nodes, and the connections between these represent dependency relationships. To define the structure, techniques based on expert knowledge and analysis of historical data from the selected ports were used.
The Bayesian network construction process included a structural learning phase using the HillClimbSearch algorithm, which optimises the network structure by maximising the likelihood criterion through BIC (Bayesian information criterion). Subsequently, network parameters were estimated using a Bayesian approach with a Dirichlet prior (BDeu), allowing for uncertainty management in datasets with sparse values or asymmetric distributions.
To validate the robustness of the network, its predictions were compared against traditional correlation analysis and regression models. A k-fold cross-validation evaluation was employed to analyse the stability of results under different data configurations. Additionally, a node sensitivity analysis was conducted, assessing how variations in a key indicator (e.g., emissions at port) influence the probabilistic estimation of ETS costs.
Phase 5: Results Acquisition
The initial results obtained from the model graphically displayed all possible probabilistic relationships between the nodes. The network was subsequently pruned in several iterations using expert criteria to discard weak relationships, resulting in the final network.
Phase 6: Results and Analysis
In the final phase, the results obtained were analysed using descriptive statistical techniques. This made it possible to identify the key indicators that impact the costs of the ETS and to formulate practical recommendations to optimise the economic and environmental sustainability of the European port system. The analysis also highlighted the potential implications of the most influential indicators in strategic decision-making to meet the objectives of the ETS.
To ensure a robust analysis based on Bayesian inference, a structured approach was adopted to identify patterns in the data and extract key relationships between MRV indicators and ETS costs. Normalisation and discretisation techniques were applied to optimise the representation of variables while preserving conditional relationships within the Bayesian network. Subsequently, the model structure was determined using a heuristic search method based on score optimisation, allowing the identification of the most significant dependency relationships among indicators.
To assess the robustness of the model, statistical metrics were employed to measure the quality of the learned structure, including information criteria to evaluate the network’s suitability. Additionally, cross-validation with data partitioning was conducted to verify the stability of the results under different input data configurations. Finally, probabilistic inference was carried out using variable elimination techniques, enabling an in-depth analysis of how different indicators influence ETS cost determination and providing insights into their impact on decision-making within the maritime sector.
4. Results and Discussion
The results obtained in this study are based on the application of the Bayesian network model to the dataset extracted from the THETIS-MRV system of the European Union. This model allows the influence of different indicators to be analysed in the determination of the costs associated with the emissions trading system (ETS) in maritime transport.
To provide a clearer connection between the methodological phases and the results, it is incorporate the key findings from Phases 0 to 3, as these stages form the basis of the Bayesian network model. In the data preprocessing phase, categorical variables were encoded, numerical features were standardised using StandardScaler, and missing values were removed to ensure consistency. Furthermore, continuous variables were discretised into five intervals to optimise computational efficiency while preserving critical relationships between indicators. The dataset was carefully curated from the THETIS-MRV system.
In addition, the Bayesian network parameters were estimated using Bayesian Estimation with a Dirichlet prior (BDeu) to ensure robustness in learning probability distributions. The network’s structure was optimised using the HillClimbSearch algorithm, which applies a score-based method to define the most significant dependencies among variables. Validation was performed using K2 and BIC scores, along with a two-fold cross-validation procedure to evaluate predictive accuracy.
To further validate the robustness of the Bayesian network, we conducted a sensitivity analysis by systematically varying key MRV indicators and analysing their impact on ETS cost estimations. The results confirmed that I_15 (annual CO2 emissions per distance) and I_9 (CO2 emissions from voyages between ports in MS jurisdiction) remained the most influential variables across different parameter variations, reinforcing the model’s reliability in identifying key cost determinants.
The hierarchical structuring of the Bayesian network goes beyond a mere reorganisation of variables; it provides an enhanced interpretability of the relationships between indicators. By distinguishing between parent and dependent nodes, this structure allows for the identification of the most influential factors affecting ETS costs. This approach facilitates a more targeted analysis and enables policymakers and industry stakeholders to focus on key variables, such as port emissions and fuel efficiency, for cost reduction strategies. The refined structure ensures that the probabilistic dependencies between factors are accurately represented, reinforcing the validity of the findings and their applicability in maritime decision-making.
Initially, the model included a total of 18 indicators related to fuel consumption, CO
2 emissions, technical efficiency, sailing times, and other key factors extracted from the MRV data.
Figure 2 shows the original structure of the Bayesian network, in which multiple interdependencies between the variables are identified, evidencing the complexity of the system.
The initial analysis shows that certain variables have a higher density of connections with other nodes, which suggests their relevance within the model. The indicators with the highest number of dependencies are as follows:
I_7 (Total fuel consumption)
I_8 (Total CO2 emissions)
I_9 (CO2 emissions from all voyages between ports under an MS jurisdiction)
I_15 (Annual average CO2 emissions per distance)
These results indicate that the amount of fuel consumed and total CO2 emissions play a key role in the configuration of the ETS, as expected. However, the high interconnection between the variables generates a model that is difficult to interpret and with possible redundancies.
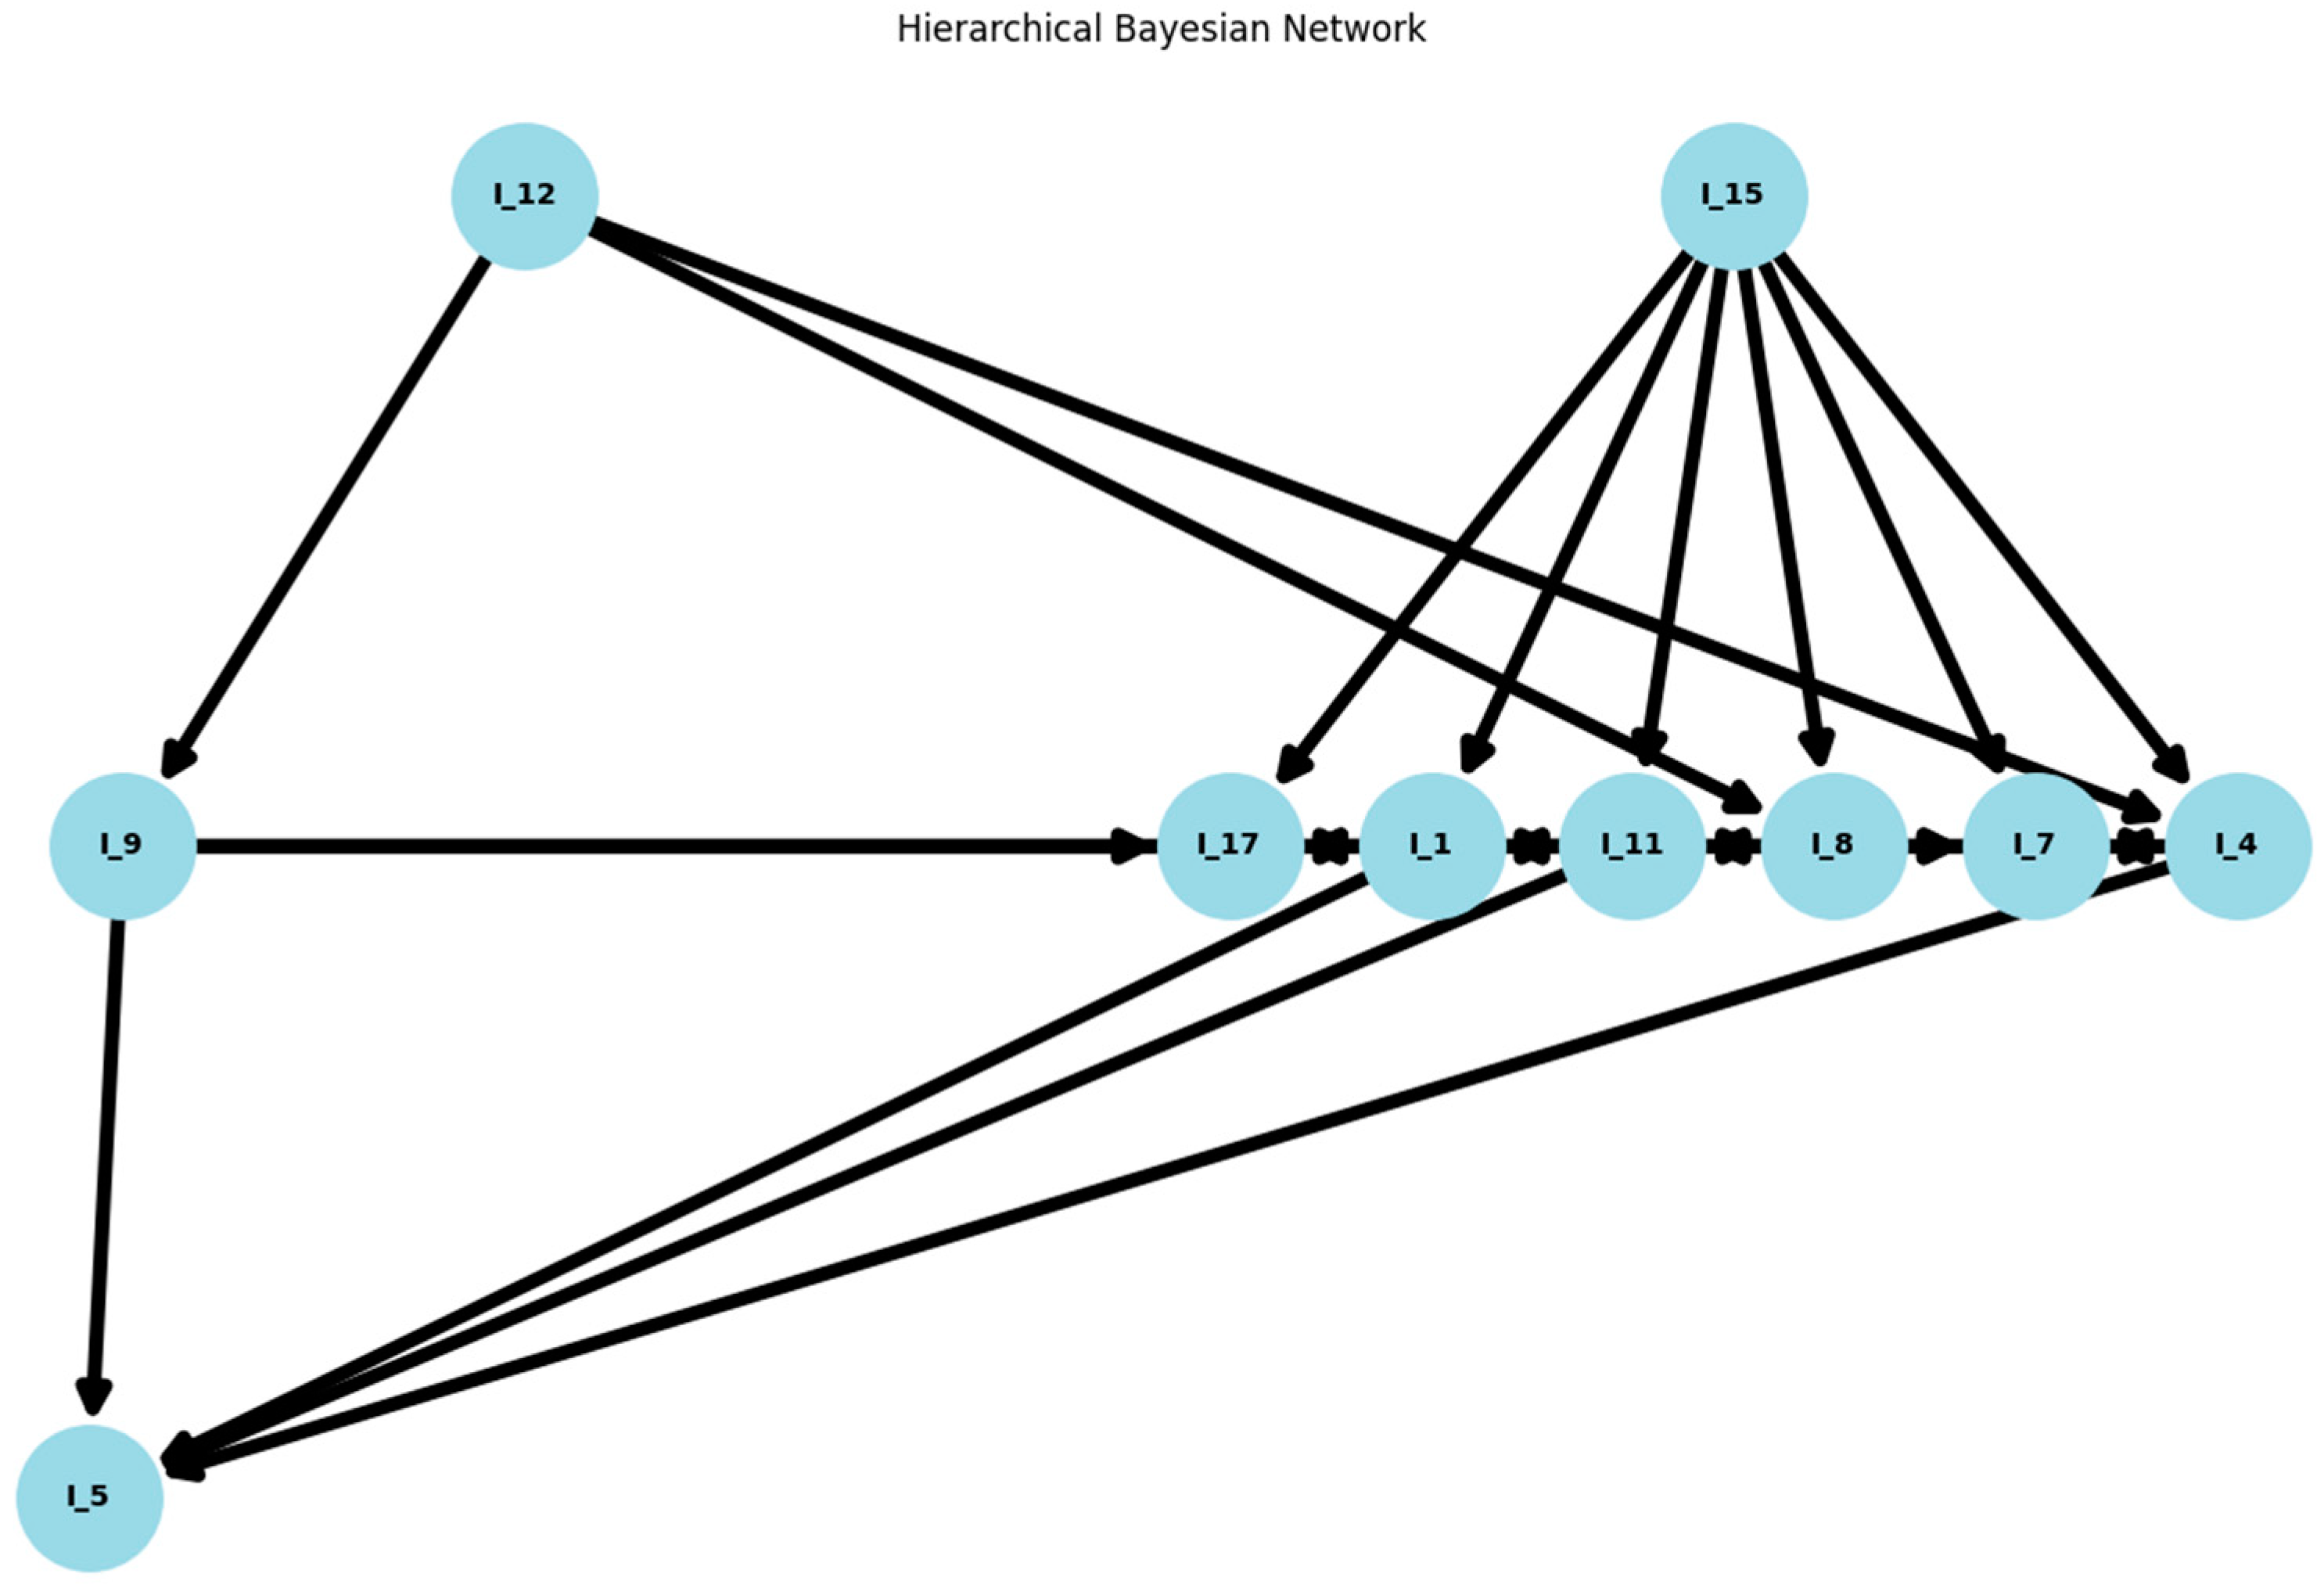
To improve the interpretability of the model, a process of hierarchisation by levels was applied. This refinement made it possible to structure a hierarchical Bayesian network where the parent nodes (most influential indicators) and the children (dependent indicators) are clearly differentiated (
Figure 3 and
Figure 4).
Next, a pruning process based on expert criteria and the adjacency matrix was applied, eliminating less significant relationships. This refinement made it possible to structure a hierarchical Bayesian network where the parent nodes (most influential indicators) are clearly differentiated from the children (dependent indicators) (
Figure 5 and
Figure 6).
In this refined version of the network, the following stand out as top nodes:
I_15 (Annual average CO2 emissions per distance)
I_8 (Total CO2 emissions)
I_12 (CO2 emissions at berth within MS jurisdiction)
These nodes appear at the higher levels of the hierarchy and exhibit multiple downstream connections, indicating that they are key factors in determining ETS-regulated emissions. In addition, the I_9 variable (CO2 emissions from voyages between ports in MS jurisdiction) maintains a strong connection with economic indicators, suggesting that the costs associated with ETS are closely linked to navigation patterns.
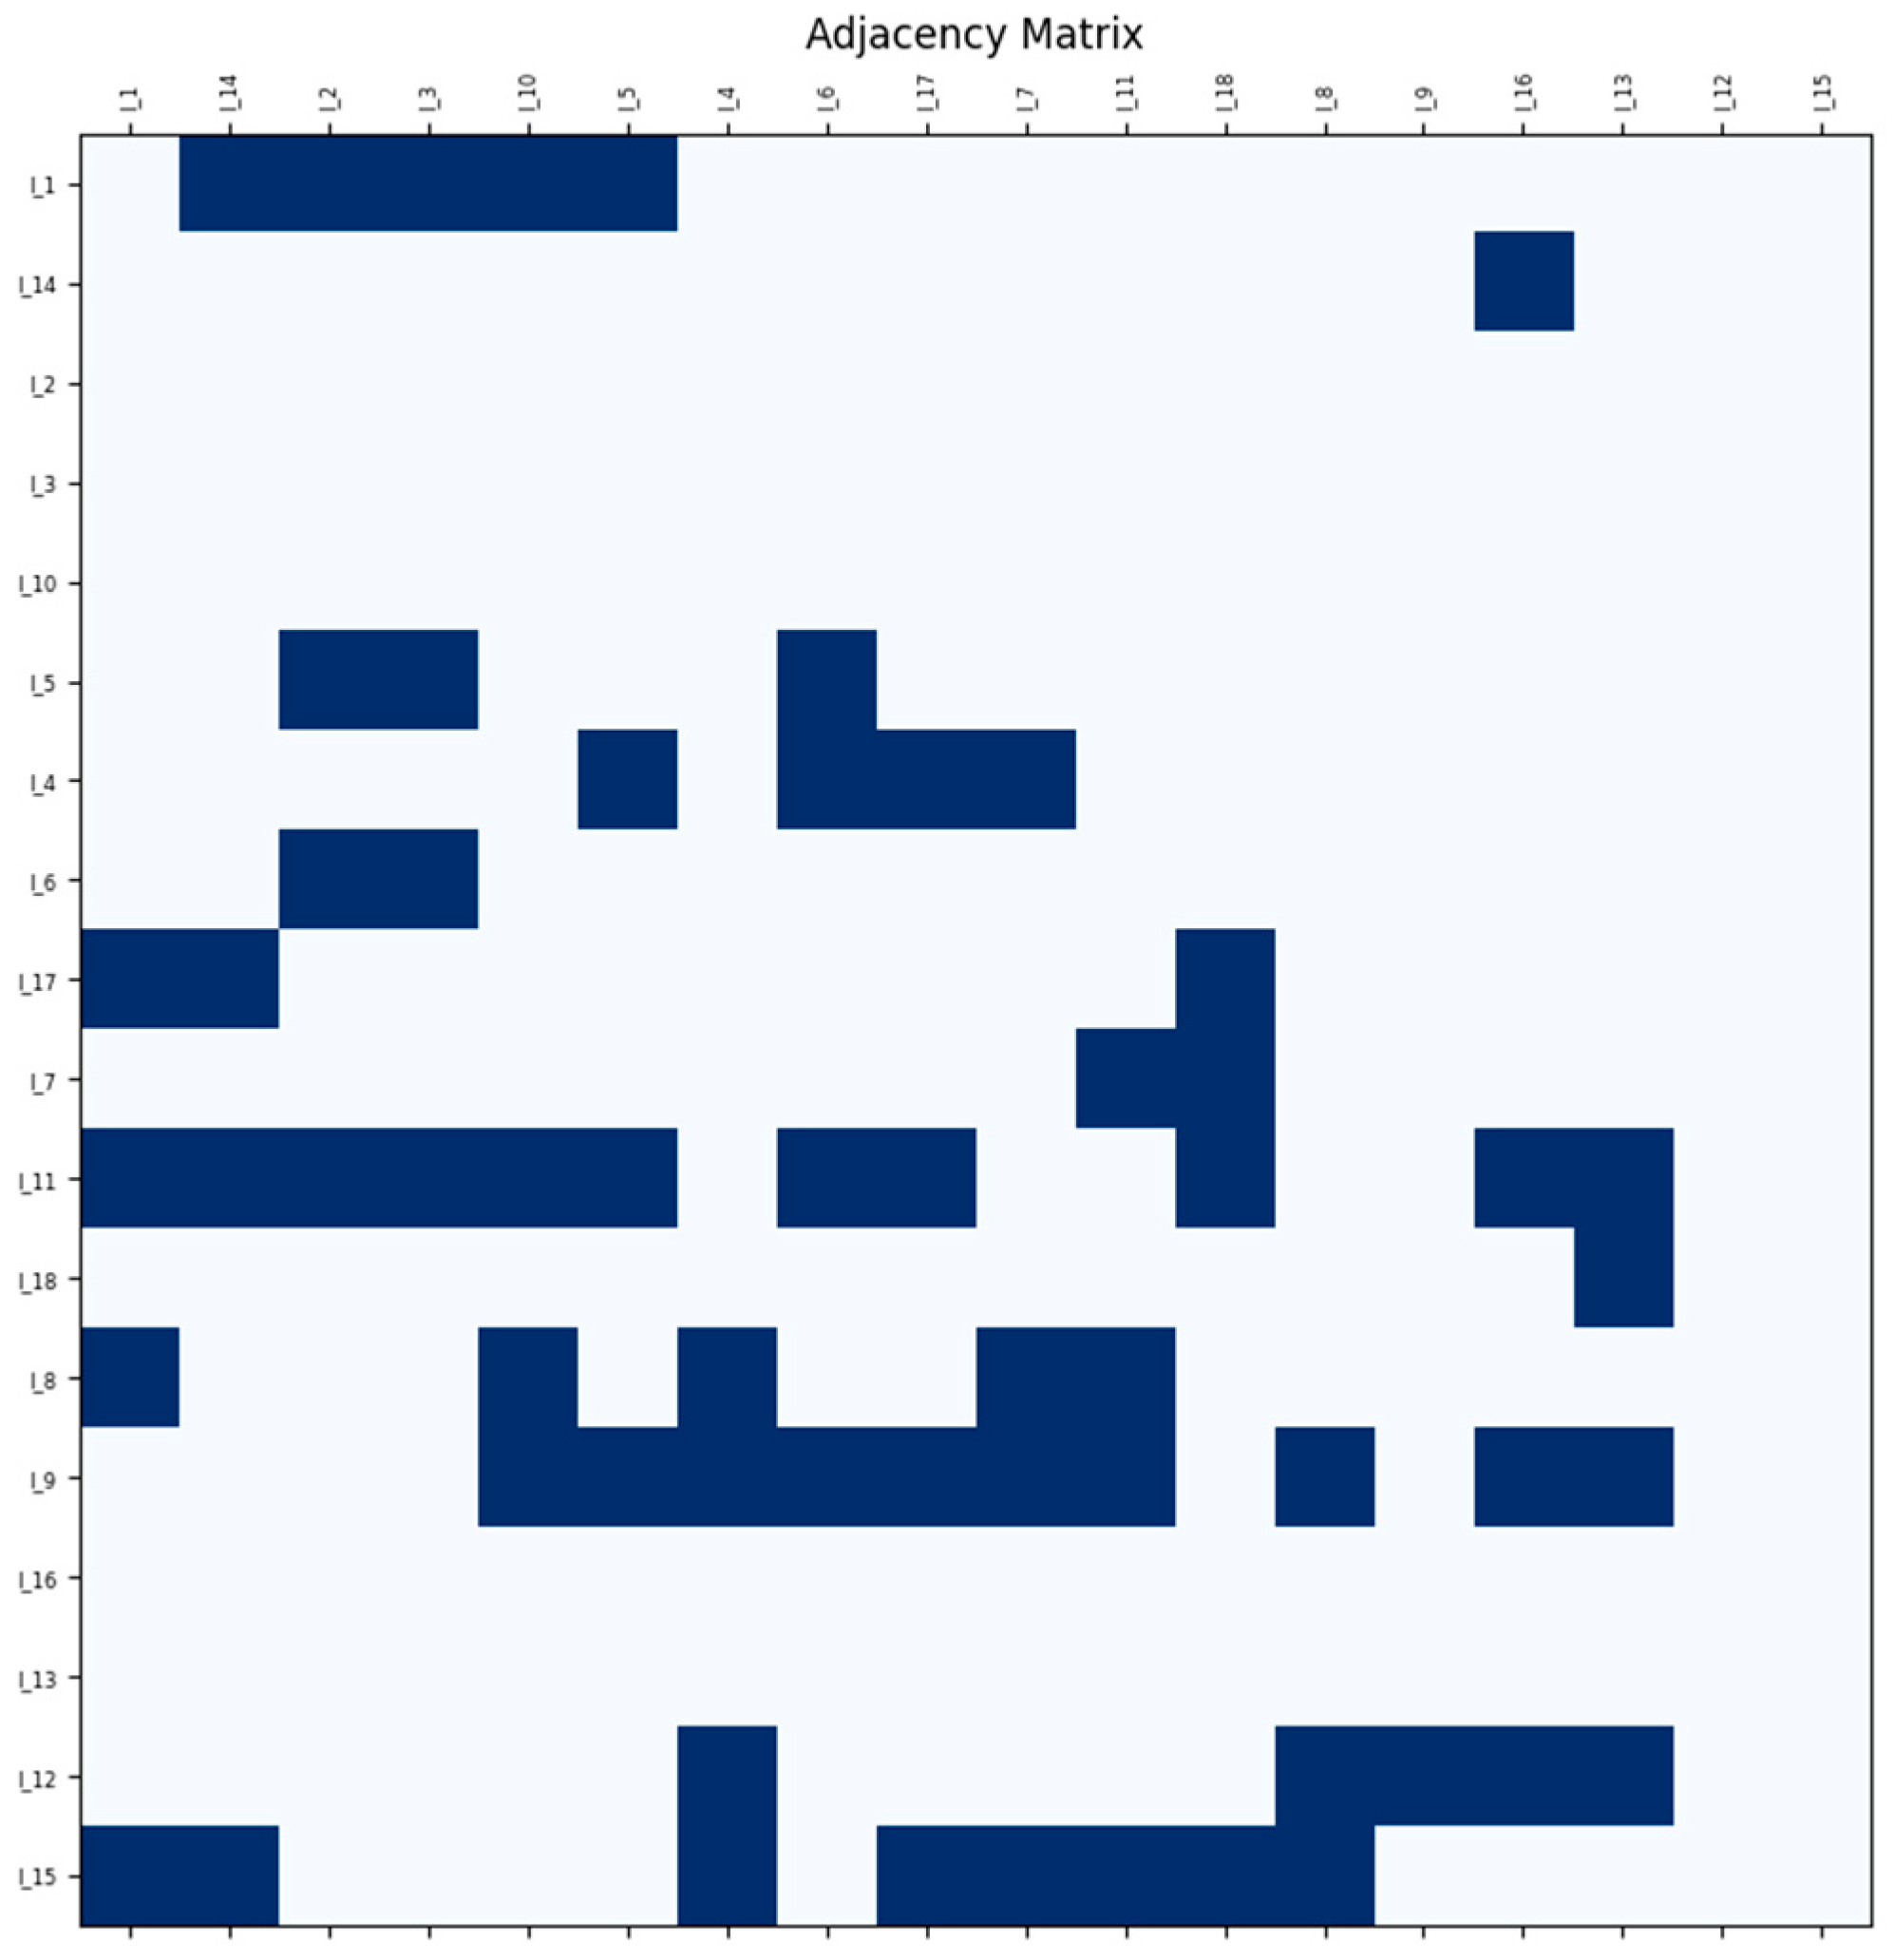
The pruning process is also reflected in the adjacency matrix (
Figure 4 and
Figure 6), where a significant reduction in the number of connections between variables can be observed. By comparing the original and refined versions of the model, key patterns are identified as follows:
Weaker relationships were eliminated without significant loss of information.
Clearer dependencies between emissions indicators and ETS costs were consolidated.
The variable I_15 (annual CO2 emissions per distance) appears as the most influential factor in the determination of costs.
Beyond identifying key nodes, the adjacency matrix provides valuable insights into the structure of dependencies within the Bayesian network. A closer examination reveals clusters of interconnected variables, particularly among emissions-related indicators such as I_8, I_7, and I_12, indicating strong interdependencies in the context of maritime transport emissions. These clusters highlight functional groupings that can help policymakers and industry stakeholders understand the most impactful factors influencing ETS costs.
Additionally, the hierarchical structuring of the Bayesian network, as reflected in the adjacency matrix, helps distinguish between primary influencers and secondary dependencies. The matrix confirms that I_9 (CO2 emissions from voyages between ports under an MS jurisdiction) maintains strong connections with economic indicators, suggesting that navigation patterns significantly shape ETS-related costs.
By refining the Bayesian network and reducing weak dependencies, the model remains interpretable while preserving key probabilistic relationships. This optimisation ensures more accurate inference, reinforcing the model’s applicability for decision-making in port sustainability and emissions management.
A key result of the Bayesian network analysis is the estimation of posterior probabilities, which quantify the impact of MRV indicators on ETS-related costs. By comparing prior and posterior distributions, we observe how the model updates its beliefs based on new evidence, highlighting the role of Bayesian inference in dynamic cost estimation.
Before integrating observational data, the prior probabilities were assigned based on historical trends and expert knowledge. Once the dataset was processed, Bayesian updating was applied, and significant shifts were observed in key indicators. For example, the probability of I_15 (annual CO2 emissions per distance) being a dominant factor in ETS cost determination increased substantially in the posterior distribution, confirming its critical influence. Similarly, I_9 (CO2 emissions from voyages between ports in MS jurisdiction) exhibited a strengthened relationship with economic cost variables, indicating that navigation patterns play a fundamental role in shaping regulatory expenses.
The likelihood function used in this analysis follows a Bayesian estimation approach with a Dirichlet prior (BDeu). This choice is justified by its ability to handle uncertainties in sparse datasets while ensuring robust probability assignments. By leveraging this function, the model effectively refines conditional probability tables (CPTs), leading to more reliable predictions of ETS costs under different operational scenarios.
These findings reinforce the applicability of Bayesian networks in decision-making for emissions management, providing stakeholders with a probabilistic framework to assess cost-reduction strategies. The results suggest that optimising fuel efficiency and adopting emissions reduction measures in port operations can significantly alter the expected ETS cost burden. Furthermore, the sensitivity of navigation patterns to policy changes highlights the need for regulatory strategies that anticipate shifts in maritime traffic dynamics.
These results suggest that ETS cost reduction strategies should focus on improving operational efficiency and reducing average emissions per nautical mile rather than focusing solely on the total volume of emissions.
The results obtained through the analysis with Bayesian networks offer key information for decision-making in the maritime sector, allowing a better understanding of the dynamics that influence the costs of the emissions trading system (ETS). One of the most significant findings is the close relationship between fuel efficiency and the costs associated with ETS. This suggests that shipping companies can optimise their routes and improve the technical efficiency of their vessels as key strategies to reduce their economic burden within the emissions trading system.
Another revealing aspect of the model is the importance of emissions generated in port, which emerge as a more relevant factor than expected. In particular, the I_12 variable (CO2 emissions at berth) appears in prominent positions within the network hierarchy, which highlights the need to adopt measures to minimise the impact of port operations. Solutions such as cold ironing, which allows ships to connect to the power grid in port instead of keeping their auxiliary engines running, could play a key role in reducing emissions and, consequently, the costs derived from ETS.
The hierarchical organisation of the Bayesian network also provides added value to the model, as it facilitates the interpretation of the relationships between variables. Differentiation between primary and secondary nodes helps policymakers and port operators to focus their efforts on the most influential indicators, optimising decision-making to reduce costs and improve the sustainability of the sector.
Finally, the results show that navigation patterns and the regionalisation of maritime traffic play a crucial role in shaping ETS costs. The I_9 variable (CO2 emissions from voyages between ports under an MS jurisdiction) shows a strong interdependence with the rest of the indicators, suggesting that some companies could reconfigure their shipping routes to minimise their exposure to the costs associated with emissions trading within the EU. This behaviour could have implications for the competitiveness of European ports and the distribution of international maritime traffic.
Taken together, these findings underscore the need for integrated strategies that combine operational optimisation, port emissions reduction, and efficient maritime traffic management in order to mitigate ETS costs without compromising the competitiveness of the sector.
5. Conclusions
This study has fulfilled its main objective by analysing the impact of the indicators of the monitoring, reporting, and verification (MRV) system in the determination of the costs associated with the emissions trading system (ETS) in the European maritime sector. By using Bayesian networks, it has been possible to identify the dependency relationships between different key variables, providing a deeper understanding of how these factors affect the cost structure of shipping companies and ports within the ETS regulatory framework.
This study makes three key contributions to the literature on maritime emissions regulation and decision-making:
Identification of the most influential MRV indicators on ETS costs. The analysis reveals that I_15 (annual CO2 emissions per distance) and I_9 (CO2 emissions from voyages between ports in MS jurisdiction) are the most critical variables affecting the cost structure within the ETS framework. The probabilistic approach allowed us to quantify their impact and highlight how fuel efficiency and port emissions play a decisive role in shaping regulatory costs.
Development of a probabilistic model for ETS cost estimation and port competitiveness assessment. Unlike traditional deterministic models, the Bayesian network developed in this study enables a dynamic evaluation of cost determinants, allowing for scenario-based forecasting. This model provides an adaptable framework that can incorporate new regulatory updates and operational changes, making it a valuable tool for ongoing assessments of the ETS impact on maritime operations.
Providing a decision-making tool for industry stakeholders. The findings of this study offer direct applications for port operators, shipping companies, and policymakers by providing an analytical basis for optimising cost-mitigation strategies. The hierarchical structure of the Bayesian network enables stakeholders to prioritise key indicators, facilitating the implementation of targeted emission reduction strategies such as cold ironing and fuel efficiency improvements. Additionally, this study underscores the potential implications of route reconfiguration as companies seek to minimise ETS-related costs, a factor that policymakers must consider in future regulatory developments.
These contributions strengthen the understanding of the economic implications of the ETS and provide a practical, data-driven tool for managing compliance costs and improving the sustainability of maritime operations.
One of the most relevant findings is the close relationship between fuel efficiency and baskets derived from ETS. It has been observed that variables such as total fuel consumption and CO2 emissions per nautical mile are highly interdependent with compliance costs, suggesting that operational optimisation and the implementation of more efficient technologies can be effective strategies to reduce the economic burden of regulation. The analysis has also revealed that port emissions play a more significant role than expected. In particular, the amount of CO2 emitted during the stay in port has been identified as a determining factor in the grid hierarchy, highlighting the importance of adopting solutions such as cold ironing to reduce emissions and associated costs.
Another key aspect identified in the study is the impact that navigation patterns and the regionalisation of maritime traffic have on the ETS. Emissions generated on journeys between ports within EU jurisdiction are strongly correlated with the cost structure of the emissions trading system. This finding suggests that shipping companies could reconsider their routes with the aim of minimising their exposure to regulatory costs, which could influence the competitiveness of European ports vis-à-vis those located in countries with less stringent environmental regulations, so-called carbon leakage.
The hierarchical structure obtained from the Bayesian network has allowed a clearer interpretation of the factors that influence the costs of the ETS, differentiating between key and secondary indicators. This not only improves the understanding of the system but also provides a useful tool for strategic decision-making by the various actors in the maritime sector. For shipping companies, the developed model offers an analytical basis that allows them to evaluate and adjust their operating strategies to optimise costs. For port managers, the identification of port emissions as a critical variable emphasises the need to implement mitigation measures to reduce the impact of the ETS on the competitiveness of ports. For their part, legislators can use these findings to design regulations that are more effective and adapted to the operational reality of the sector.
The availability and quality of the data used, from official sources such as THETIS-MRV, can be affected by differences in the way shipping companies report their emissions. In addition, due to the high speed of implementation of new technologies such as more efficient engines, new emission-neutral fuels, etc., they can significantly alter the cost structure in the future.
Based on these findings, several lines of research are opened to delve into the relationship between MRV and ETS. A possible extension of the study would be to apply this model in a global context, including maritime routes outside the EU, which would allow the impact of the ETS on the reconfiguration of international traffic to be assessed. Likewise, the integration of machine learning algorithms in combination with Bayesian networks could improve the predictive capacity of the model, allowing future scenarios to be analysed more accurately. It would also be relevant to examine the effect of new emission reduction technologies, such as alternative fuels or energy efficiency improvements, on reducing costs within the ETS system.
In short, this study has shown that Bayesian networks are a powerful tool to analyse the interaction between MRV indicators and ETS costs, providing key information for planning and management in the maritime sector. The results obtained allow shipping companies, ports, and regulators to make more informed decisions, optimising sustainability and competitiveness in a constantly evolving regulatory environment. As the maritime sector moves towards a green transition, having analytical models such as the one developed in this research will be essential to ensure an efficient and balanced adaptation to new environmental and economic challenges.


 ,
, 
