Article

Research on Partial Discharge Spectrum Recognition Technology Used in Power Cables Based on Convolutional Neural Networks

1
Lianyungang Zhiyuan Electric Power Design Co., Ltd., No. 23 Xingfu Road, Lianyungang 222000, China
2
State Grid Lianyungang Power Supply Company, No. 13 Xingfu Road, Lianyungang 222000, China
3
School of Electrical and Power Engineering, Hohai University, No. 8 Focheng Road, Nanjing 211100, China
*
Author to whom correspondence should be addressed.
Inventions 2025, 10(2), 25; https://doi.org/10.3390/inventions10020025
Submission received: 16 December 2024 / Revised: 11 February 2025 / Accepted: 21 February 2025 / Published: 5 March 2025

Abstract

:
Partial discharge is an important symptom of cable aging, and timely detection of potential defects is of great significance to ensure the stability and safety of the power supply. However, due to the diversity of inspection equipment and information blockage, the staff often show blindness to the partial discharge spectrum and the defects corresponding to the spectrum. In view of this phenomenon, a partial discharge spectrum recognition method based on a convolutional neural network was developed. Firstly, a database of typical partial discharge spectrum was established, including partial amplifiers in the laboratory and at the work site, and then the convolutional neural network was used to train the defect spectral library. This paper proposes a processing technology for the on-site partial discharge spectrum; the unified grayscale image is obtained by grayscale processing, linearized stretching and size unification, and then the shape and color feature parameters are extracted according to the grayscale image, which solves the image distortion and statistical spectrum movement caused by the on-site environment or photographic angle on the user side. The partial discharge type can be obtained by comparing the processed spectrum with the database through the intelligent terminal, which greatly improves the accuracy and efficiency of on-site operations.

1. Introduction

With the increasing urbanization, the demand for urban electricity is growing rapidly, and the scale of the power grid is gradually expanding [1]. As the medium of power transmission, the insulation state of power cables directly determines the reliability of cable operation, is related to the reliability of power supply, and directly affects the lives of residents and social production [2]. Partial discharge (PD) is one of the main causes of insulation deterioration and failure of power cables [3,4], and it is of great significance to implement effective live detection of cable accessories and timely detection of potential defects to ensure the stability and safety of power supply.
Based on the statistical analysis of materials such as power cable repair records, accident scene photos, and faulty cable sealing samples in major cities across the country in recent years, cable accessory faults account for about 80% of line faults among the main factors leading to power cable operation failures, and the failure rate of cable accessories is more than 100 times higher than that of the main body after excluding the influence of external factors [5]. At the moment, there are many different methods for detecting partial discharge of cables, such as the Pulsed Current method, Ultrasonic PD Detection, Radio Frequency method, Ultra-High Frequency (UHF) Partial Discharge Detection, etc. [6]. In Ref. [7], a high-sensitivity Gas-Insulated Switchgear (GIS) pulse current partial discharge measurement system was established, and this system has a partial discharge identification capability of up to 0.02 pC. The partial discharge of sub-millimeter/millimeter micrometal particles on the surface of GIS insulators was observed at a level close to the actual operating voltage. A multi-source partial discharge diagnostic method was proposed in Ref. [8], which was based on the combined detection of pulsed current method and ultraviolet pulse method. In Ref. [9], a flexible ultrasonic sensor based on lead zirconate titanate (Pb (Zr0.52Ti0.48) O3, PZT) piezoelectric film was prepared, which improved the problem of serious partial discharge signal attenuation during the operation of traditional ultrasonic sensors. In Ref. [10], a long-term constant voltage test on the attachment defects of metal foreign bodies on the surface of GIS insulators was conducted. Suggestions are put forward to extend the single-point measurement time and change the detection threshold of the UHF detection system, which can alleviate the misjudgment of sparse discharge in traditional UHF detection strategy. In Ref. [11], a partial discharge UHF and ultra-sonic signal noise reduction method based on coherent average was proposed, which obtained lower mean square error, higher normalized correlation number and noise reduction level than the traditional methods, such as wavelet noise reduction and singular value de-composition noise reduction methods. It helped researchers effectively extract the partial discharge pulses submerged by noise and realize the accurate location of defects. In Ref. [12], a commutator partial discharge detection and positioning technology based on broadband radio frequency was proposed. This technology obtains the original time-domain waveform of the electromagnetic pulse signal through high-speed sampling at 2.5 GHz, so it can accurately judge the arrival time of the pulse signal. Then, device-level positioning based on the arrival time difference method was performed for the convenience of using a spatial grid search algorithm to solve the problem.
However, in the field operation, limited by the equipment conditions and the experience of the staff, the diagnosis of cable defects has a certain blindness. A more intuitive and easy-to-operate method is needed to accurately and efficiently diagnose the cable partial discharge. Convolutional neural network is a commonly used network in deep learning, which reduces the complexity of the network model, reduces the number of weights, can give excellent results in image and speech recognition, and has high adaptability to the collection and training of PD data. In Ref. [13], an experimental platform for the collection of Phase Resolved Partial Discharge (PRPD) spectra of four typical PD defects was built, and a GIS PD pattern recognition method based on deep residual network was proposed, which could automatically extract the PRPD spectral features of the four typical PD defects in GIS and accurately identify the PD types. In Ref. [14], a partial discharge pattern recognition method for switch cabinets was proposed. This method is based on a residual convolutional neural network, and it solves the problem of accuracy degradation in deep convolutional networks as the network layers deepen by adding a residual module to the network. This approach significantly improves the accuracy of partial discharge pattern recognition for switch cabinets. In Ref. [15], an audible sound recognition method is used to construct a spectrum map dataset. The dataset is created by aliasing the discharge fault sound of power equipment, normal working condition sounds, and environmental noise. A specially added attention mechanism helped adjust the exponential attenuation learning rate, dataset sample size, and audio sampling rate. Combined with an improved convolutional neural network, discharge faults can be detected quickly and precisely. In Ref. [16], a transformer acoustic signal recognition model based on improved waterfall spectrogram-convolutional neural network was proposed, which used wavelet transform and independent component analysis to jointly denoise the acoustic signal and used principal component analysis to improve the waterfall spectrogram and perform feature extraction. Then, a convolutional neural network structure suitable for transformer characteristic spectrogram recognition was designed, and the collected transformer acoustic signals under three operating states were tested and analyzed, and the recognition effect was excellent.
The basic methods of the above literature are to use convolutional neural networks to train partial discharge spectrum or partial discharge acoustic spectrum and improve recognition efficiency and accuracy through optimization algorithms. However, most of these spectra are obtained in laboratory platforms, which have certain limitations. In this study, a typical PD spectrum library was established based on laboratory data and work site survey data, and then a partial discharge spectrum recognition method based on convolutional neural network was proposed, and a map feature parameter extraction technology was also proposed. Due to the need to deploy Graphics Processing Unit (GPU) resources, a Compute Unified Device Architecture (CUDA) environment is required on the server side. Field personnel only need handheld devices and supporting software to upload the field spectrum to the server and then call the function at the client to obtain the partial discharge type. Compared with the traditional method of field expert analysis, it greatly improves the convenience of field operation.

2. Materials and Methods

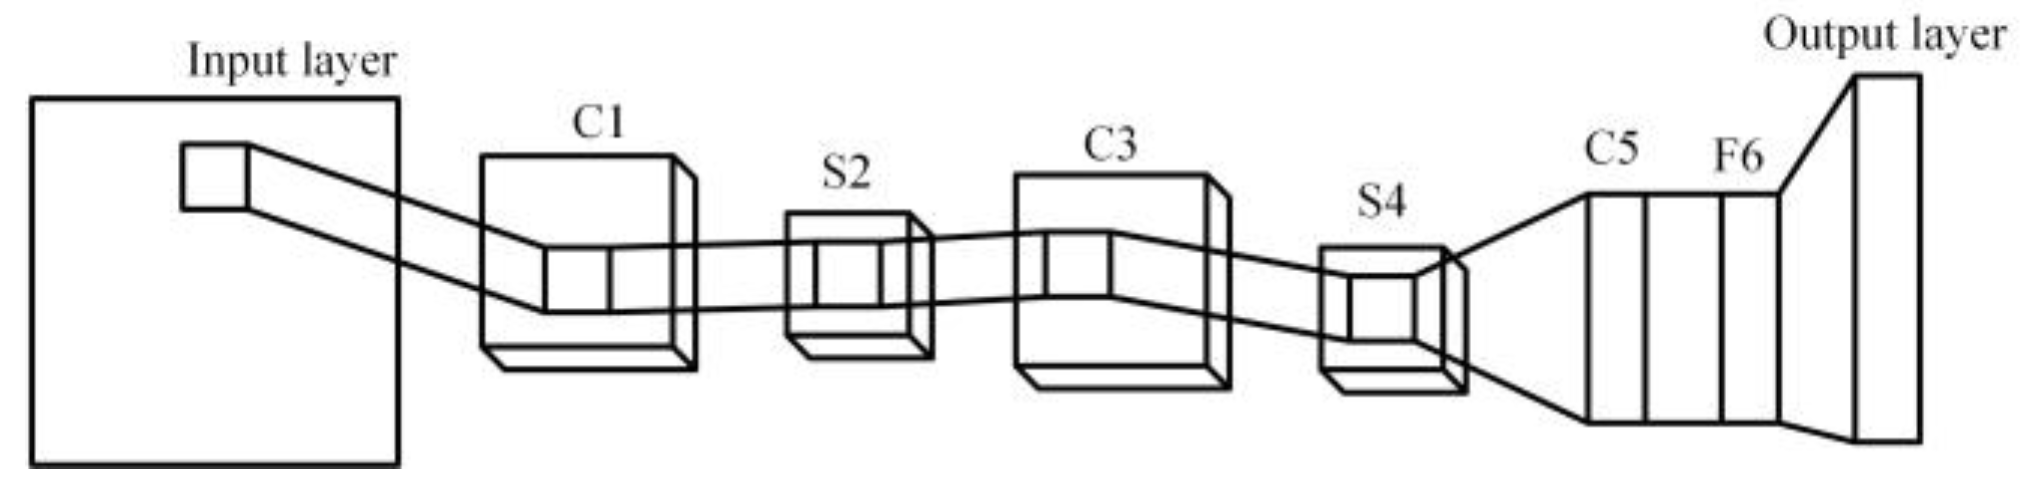
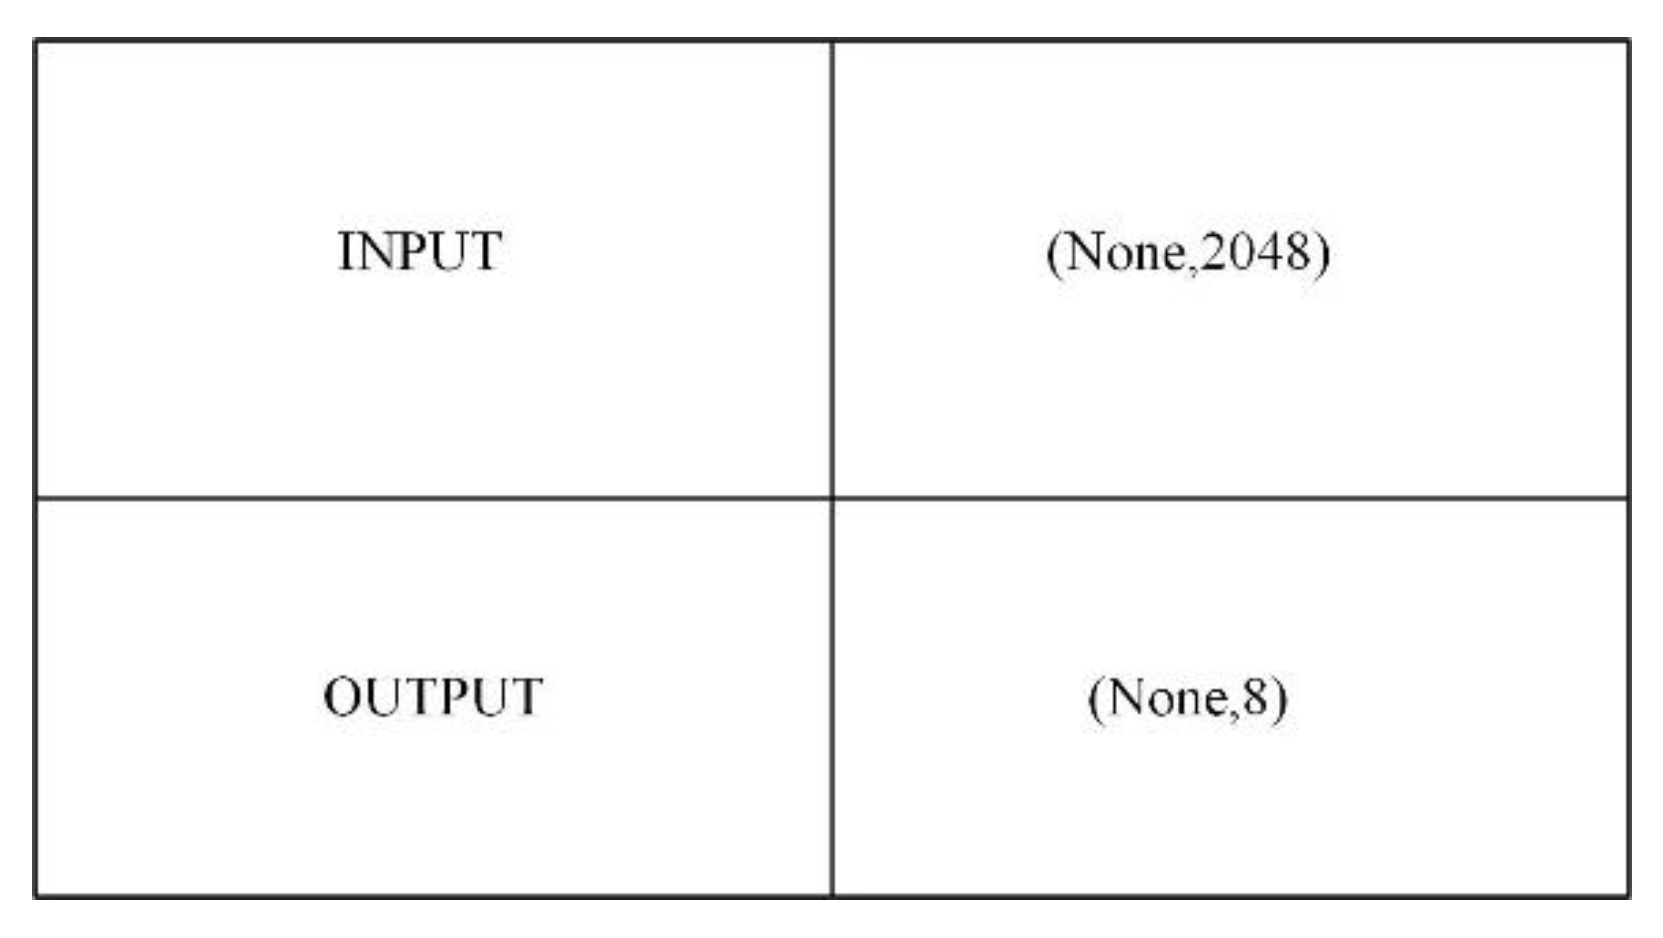
2.1. Partial Release Graph Training Based on Convolutional Neural Network

A typical convolutional neural network (CNN) structure is shown in Figure 1 and consists of an input layer, several convolutional layers (C) and pooling layers (S), a fully connected layer (F) and an output layer. The input layer typically holds a matrix of pixels or groups of matrices for the input image. The convolutional layer, also known as a filter or kernel, is used to extract image features by sliding over the input image. The function of the pooling layer is to reduce the spatial size of the feature map, thereby reducing the computational mitigation of overfitting. After multiple convolutions and pooling, the fully connected layer takes the extracted high-level mapping as the final output [17].
The recognition of partial discharge spectra requires a high-depth neural network, and Residual Network (ResNet) can effectively solve the degradation problem of neural networks with increasing depth. Compared with traditional networks, such as GoogLeNet and Visual Geometry Group Network (VGGNet), ResNet has lower complexity, a smaller number of parameters, and less optimization difficulty [18]. The most important thing is that ResNet can learn more complex feature representations through deep networks, which is very helpful in improving the performance of image classification, target detection, and other tasks, especially suitable for the work of partial discharge spectrum recognition. Table 1 shows the parameter comparison between the neural networks and the classical network used in this study.
The design idea of this study refers to the design of ResNet, which consists of three parts: The input part, the intermediate convolution part, and the output part. The input part consists of 224 × 224 image data, and there are three channels of RGB, so the input layer specification is (224, 224, 3). Following the input layer, 7 × 7 convolution and 3 × 3 pooling were performed on the image data to convert the data into a feature map of 56 × 56 size. The processing of the input part reduces the size of the data and lays the foundation for feature extraction of the convolutional layer. The convolution part is different from the original structure of the ResNet network, and the residual unit used in this study is composed of three layers of convolution, and the sizes of the convolution kernels are 1 × 1, 3 × 3, and 1 × 1, respectively. The introduction of the activation function Relu can add non-linear operations to all hidden and output layers, making the output of the neural network more complex and expressive. The formula for Relu is as follows:
f ( x ) = x , x 0 0 , x < 0
The residual element structure of the application network in this study is shown in Figure 2. In this study, a total of 16 such residual element structures were used, with a total of 48 convolutional layers, to form a residual neural network with a depth of 50 layers. The input-output structure is shown in Figure 3. The input data dimension is 2048, and “None” indicates that the number of data is indefinite; any amount of data can be received. The output conclusion dimension is 8, which represents eight types of diagnostic conclusions, including corona discharge, suspension discharge, surface dis-charge, air gap discharge, particulate discharge, noise, normal, and other. The output channel is 8 during the test, which can be adjusted according to the number of output categories required by the actual work. Figure 4 shows the overall network architecture.

2.2. Image Preprocessing Technology

In the actual partial discharge detection process, when the suspected partial dis-charge spectrum is encountered, the intelligent terminal can be used to take pictures of the spectrum on the detection instrument to obtain the original photo of the partial discharge spectrum. However, due to problems such as the angle and optical fiber of the camera in the process of taking pictures, and the fact that there is no reference voltage in the statistical spectrum in most cases, there will be statistical spectrum drift, so it is necessary to preprocess the pictures obtained on site. It is mainly divided into three parts, namely grayscale processing, brightness processing, and size processing.
In order to avoid the influence of color aberration in the image on the recognition effect, the image needs to be grayscaled; Figure 5 shows the partial discharge spectrum before and after grayscale processing. Linear stretching of the grayscale of each pixel of the image (as shown in Equation (2) below) removes brightness interference. The gray range of the original image f(i, j) is [a, b], and the range of g(i, j) is, where a1 = 0 and b1 = 255. In order to eliminate the error caused by the height and size of the photograph in the process of taking pictures, the picture should be processed in a unified size, so the gray value matrix g(i, j) is obtained, where i is the number of rows and j is the number of columns.
g ( i , j ) = a 1 + b 1 a 1 b a [ f ( i , j ) a ]

2.3. Extraction of Spectral Feature Parameters

Considering that the shooting angle of the image is different, the coordinate system changes, and other problems will cause the stretching or compression of the shape of the partial discharge spectrum; in order to obtain a better recognition effect, it is necessary to consider the extraction of trait invariant features. The features of an image are extracted using a matrix.
In the image, the low-order matrix reflects low-frequency information, and the higher-order matrix reflects high-frequency information. The set of matrices computed from an image can not only describe the global features of the image shape but also provide a large amount of information about the geometric features of the image, such as size, position, orientation, and shape [19]. The color feature parameters of the obtained grayscale map were extracted, and the color connectivity parameter was used as the feature quantity.
Firstly, the gray value 0~255 is divided into k intervals, and the gray value is requantified according to these k intervals, as shown in Equation (3):
g ( f ( x , y ) > ( i 1 ) * 255 / k & f ( x , y ) < ( i ) * 255 / k ) = i
where k is the number of intervals, i is the ith interval, g is the requantized gray value matrix, and f is the generated gray value matrix.
The connected region is judged for each interval, and the connected region matrix G(m, n) under each interval is obtained. The aggregation judgment is carried out for each interval, and the number of two parameter aggregate pixels and non-aggregate pixels is obtained. The threshold for judging whether to aggregate is set to 1% of the number of pixels. After the above steps, the color feature parameters in k intervals can be obtained, including 2 × k parameters: colorvector (color11, color12, color21, color22, …, colork1, colork2), where color11 represents the number of pixels aggregated in the first interval and color12 represents the number of non-aggregated pixels in the first interval.
In order to achieve a better recognition effect, it is necessary to consider the ex-traction of trait invariant features and to use the Hu invariant moment to extract the features of the image (block). Equation (4) is the p + q moment of the grayscale image f(x, y):
u p q = x = 1 C y = 1 R x p y q f ( x , y ) , p , q = 0 , 1 , 2 ,
In the formula, C represents the row of the image, R represents the column of the image, the zero matrix u00 represents the mass (area) of the target region, the first-order moments u10 and u01 represent the centroid of the target region, the second-order moments u20, u11, and u02 represent the rotation radius of the target region, and the third-order moments u30, u21, u12, and u03 represent the orientation and slope of the target region.
According to the feature parameters of the shape features, such as the zeroth-order moment, the first-order moment, the centroid, and the center distance, seven kinds of characteristic moments were constructed to extract the shape features of the gray value matrix f(m, n). For the zero-order moment, if the scale of the target region changes, the zero-order center distance will also change accordingly, so that the moment has scale invariance. From the zeroth-order origin moment and the first-order origin moment, the centroid coordinates of the target region can be obtained. The central moment is constructed with the centroid of the target region as the center. Thus, the calculation of the moment is always the centroid of the point in the target region relative to the target region and has nothing to do with the position of the target region; that is, it has translational invariance. The normalized center moment can be obtained by normalizing the center distance of each order by using the zero-order center moment u00, which is used to construct the scale invariance. By using the second- and third-order normalized central moments to construct the rotation invariance, seven groups of invariant moments can be derived, which remain unchanged when the image is translated, rotated, and proportionally changed [20].
The shape features of the gray value matrix were calculated, and the initial values of the zero-order moment u00, first-order moment u10, and u01 of the matrix were calculated, respectively.
Solve for the centroid of the matrix using Equation (5):
x 0 = u 10 u 00 , y 0 = u 01 u 00
Solve for the center distance of the image, μ11, μ20, μ02, μ30, μ03, μ12, and μ21, using Equation (6):
μ p q = x = 1 C y = 1 R ( x x 0 ) p ( y y 0 ) q f ( x , y ) , p , q = 0 , 1 , 2 ,
According to the center distances of the image, the 7 shape parameters of the image are obtained, and the formula is shown in Equation (7):
n 1 = μ 20 + μ 02 n 2 = ( μ 20 μ 02 ) 2 + 4 μ 11 2 n 3 = ( μ 30 3 μ 12 ) 2 + ( 3 μ 21 μ 03 ) 2 n 4 = ( μ 30 + μ 12 ) 2 + ( μ 21 + μ 30 ) 2 n 5 = ( μ 30 3 μ 12 ) * ( μ 30 + μ 12 ) * ( μ 30 + μ 12 ) 2 3 * ( μ 21 + μ 03 ) 2 + ( 3 μ 21 μ 03 ) * ( μ 21 + μ 03 ) * 3 * ( μ 30 + μ 12 ) 2 ( μ 21 + μ 03 ) 2 n 6 = ( μ 20 μ 02 ) * ( μ 30 + μ 12 ) 2 ( μ 21 + μ 03 ) 2 + 4 μ 11 ( μ 30 + μ 12 ) * ( μ 21 + μ 03 ) n 7 = ( 3 μ 21 μ 03 ) * ( μ 21 + μ 03 ) * ( μ 30 + μ 12 ) 2 3 * ( μ 21 + μ 03 ) ( μ 30 3 μ 12 ) * ( μ 21 + μ 03 ) * 3 * ( μ 30 + μ 12 ) 2 ( μ 21 + μ 03 ) 2

3. Results

3.1. Establishment of a Database of Typical and Field Noise Spectra of Partial Discharge

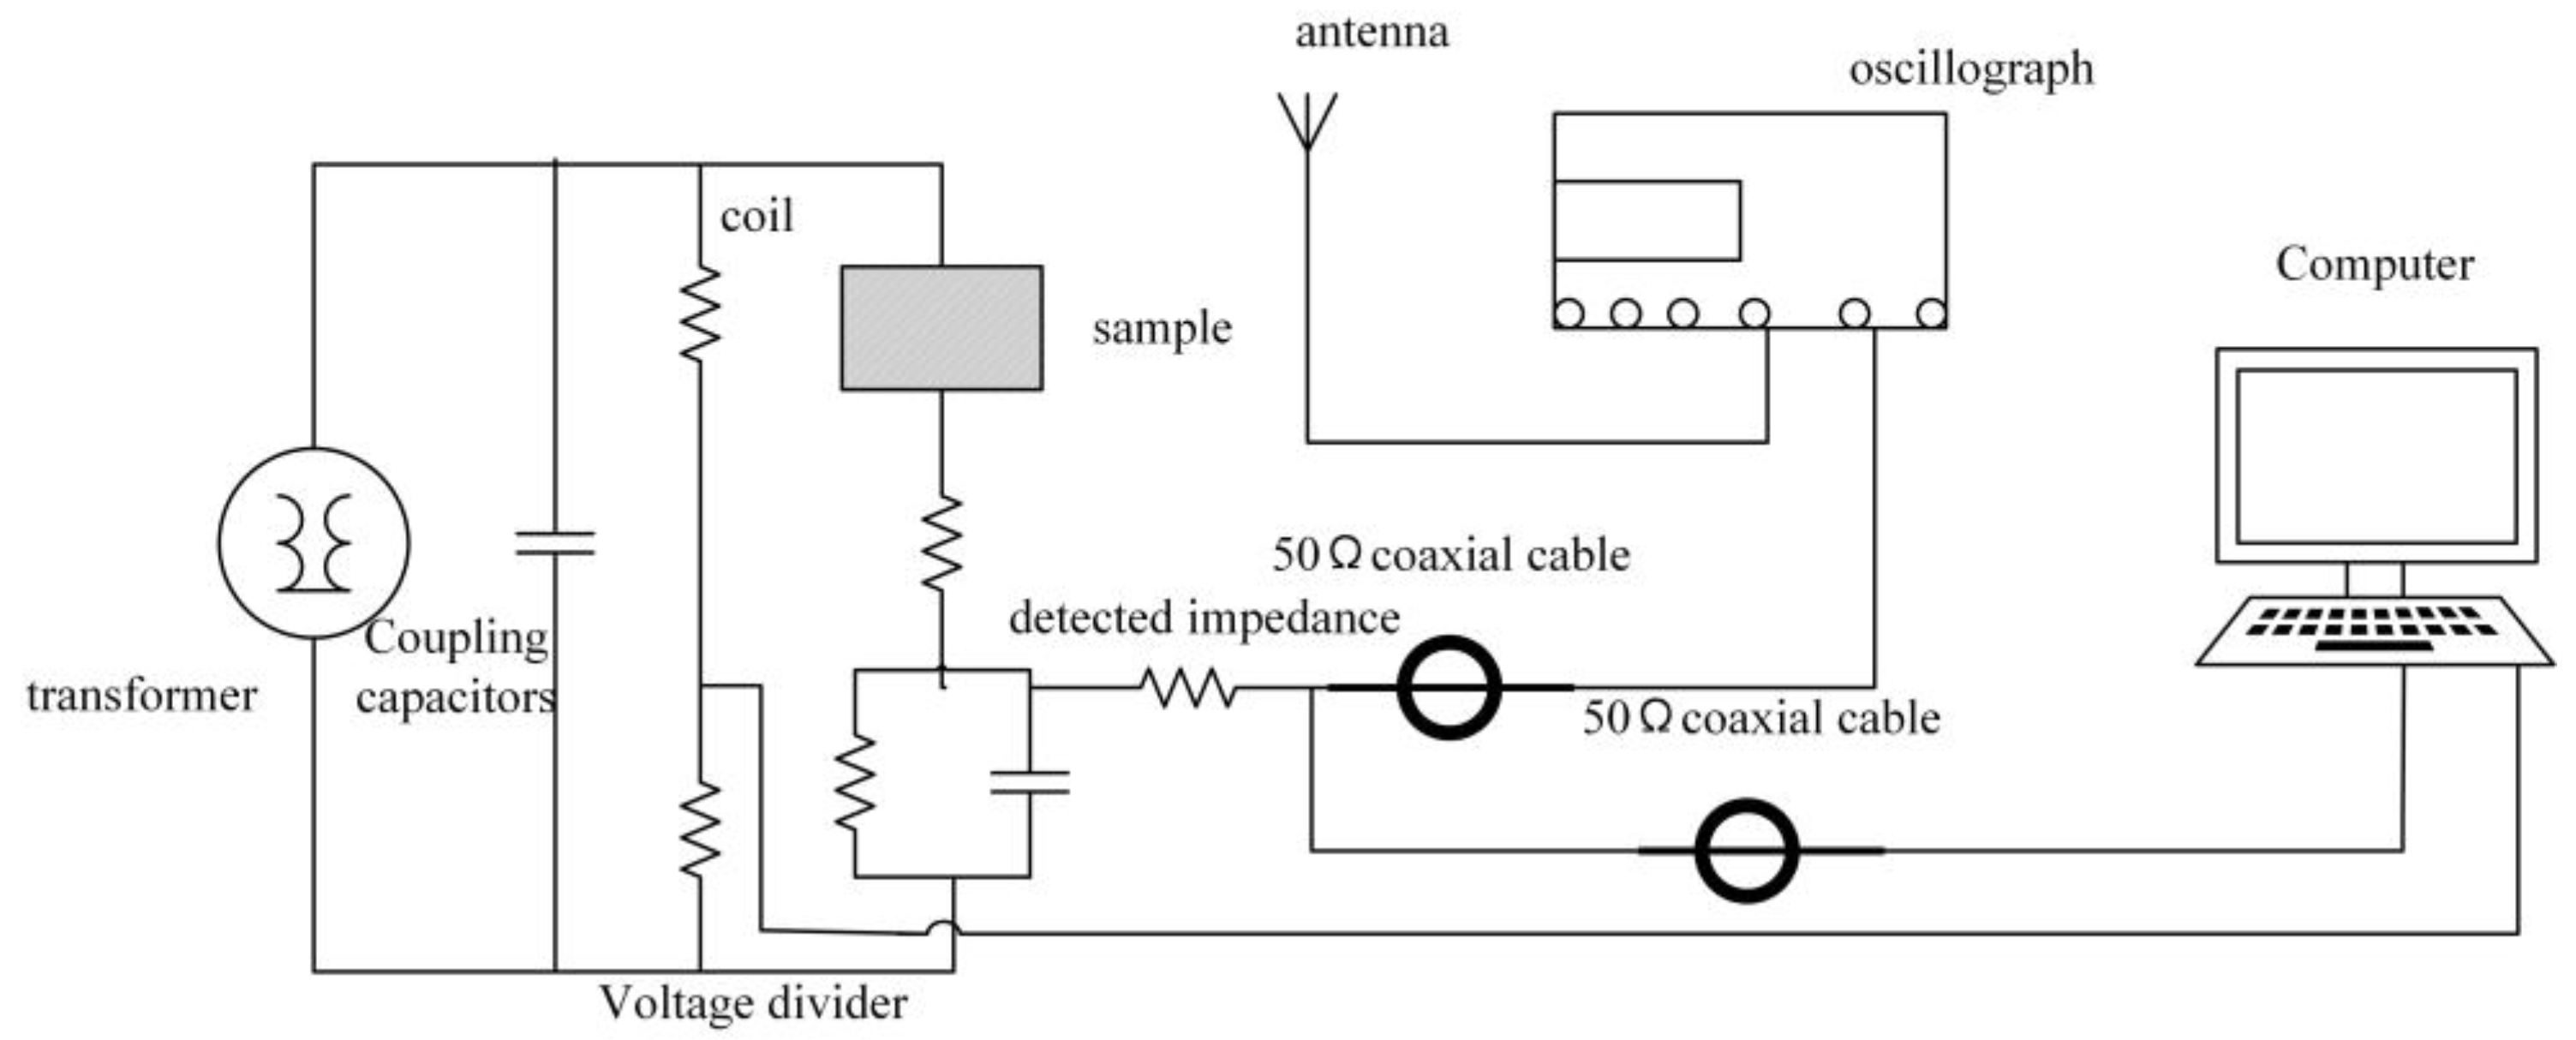
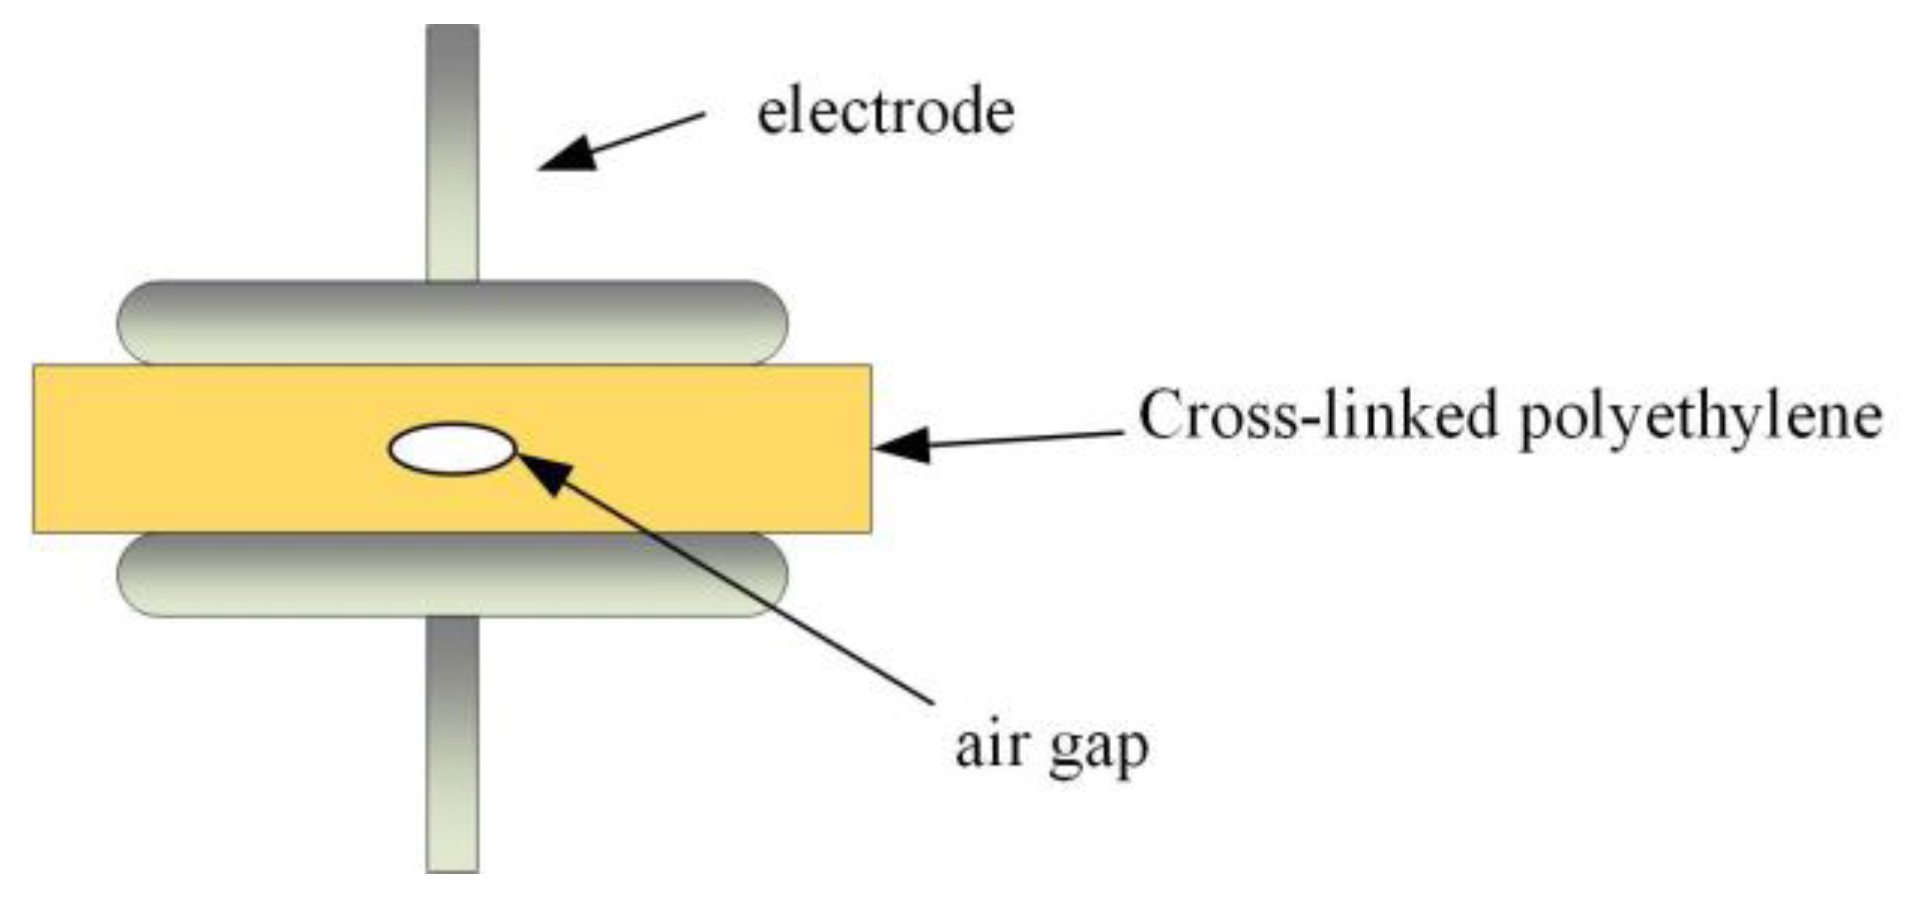
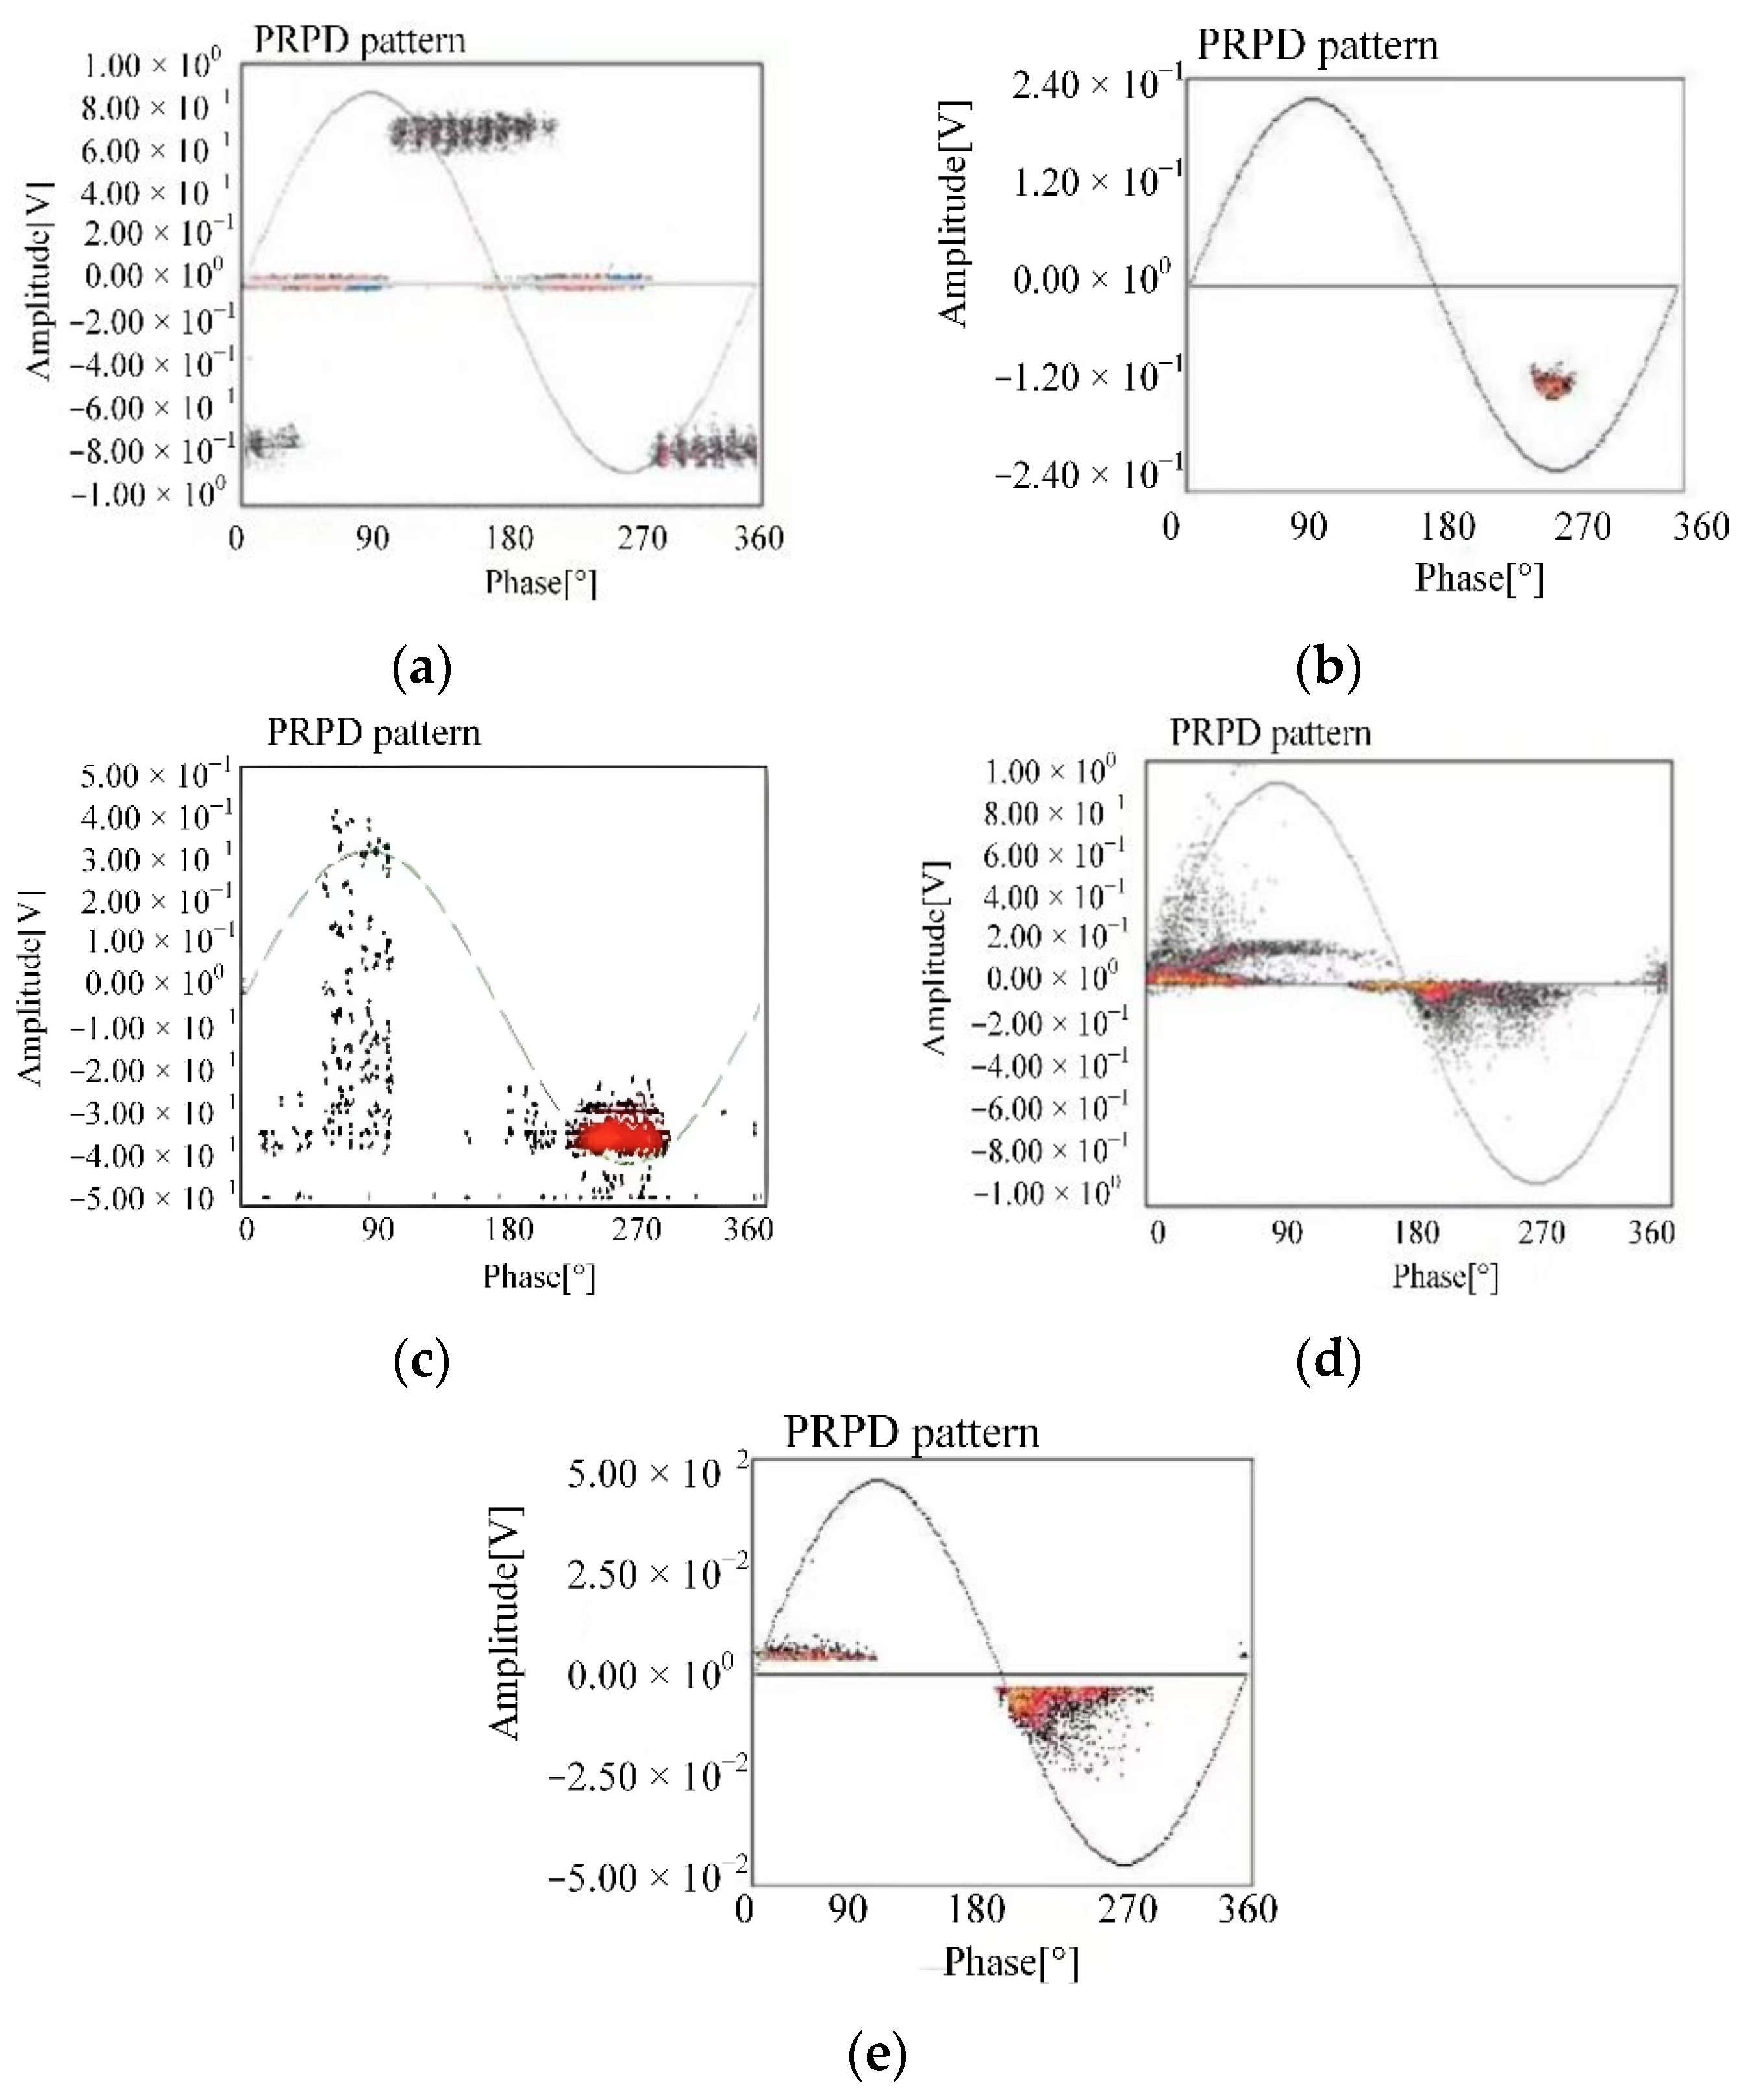
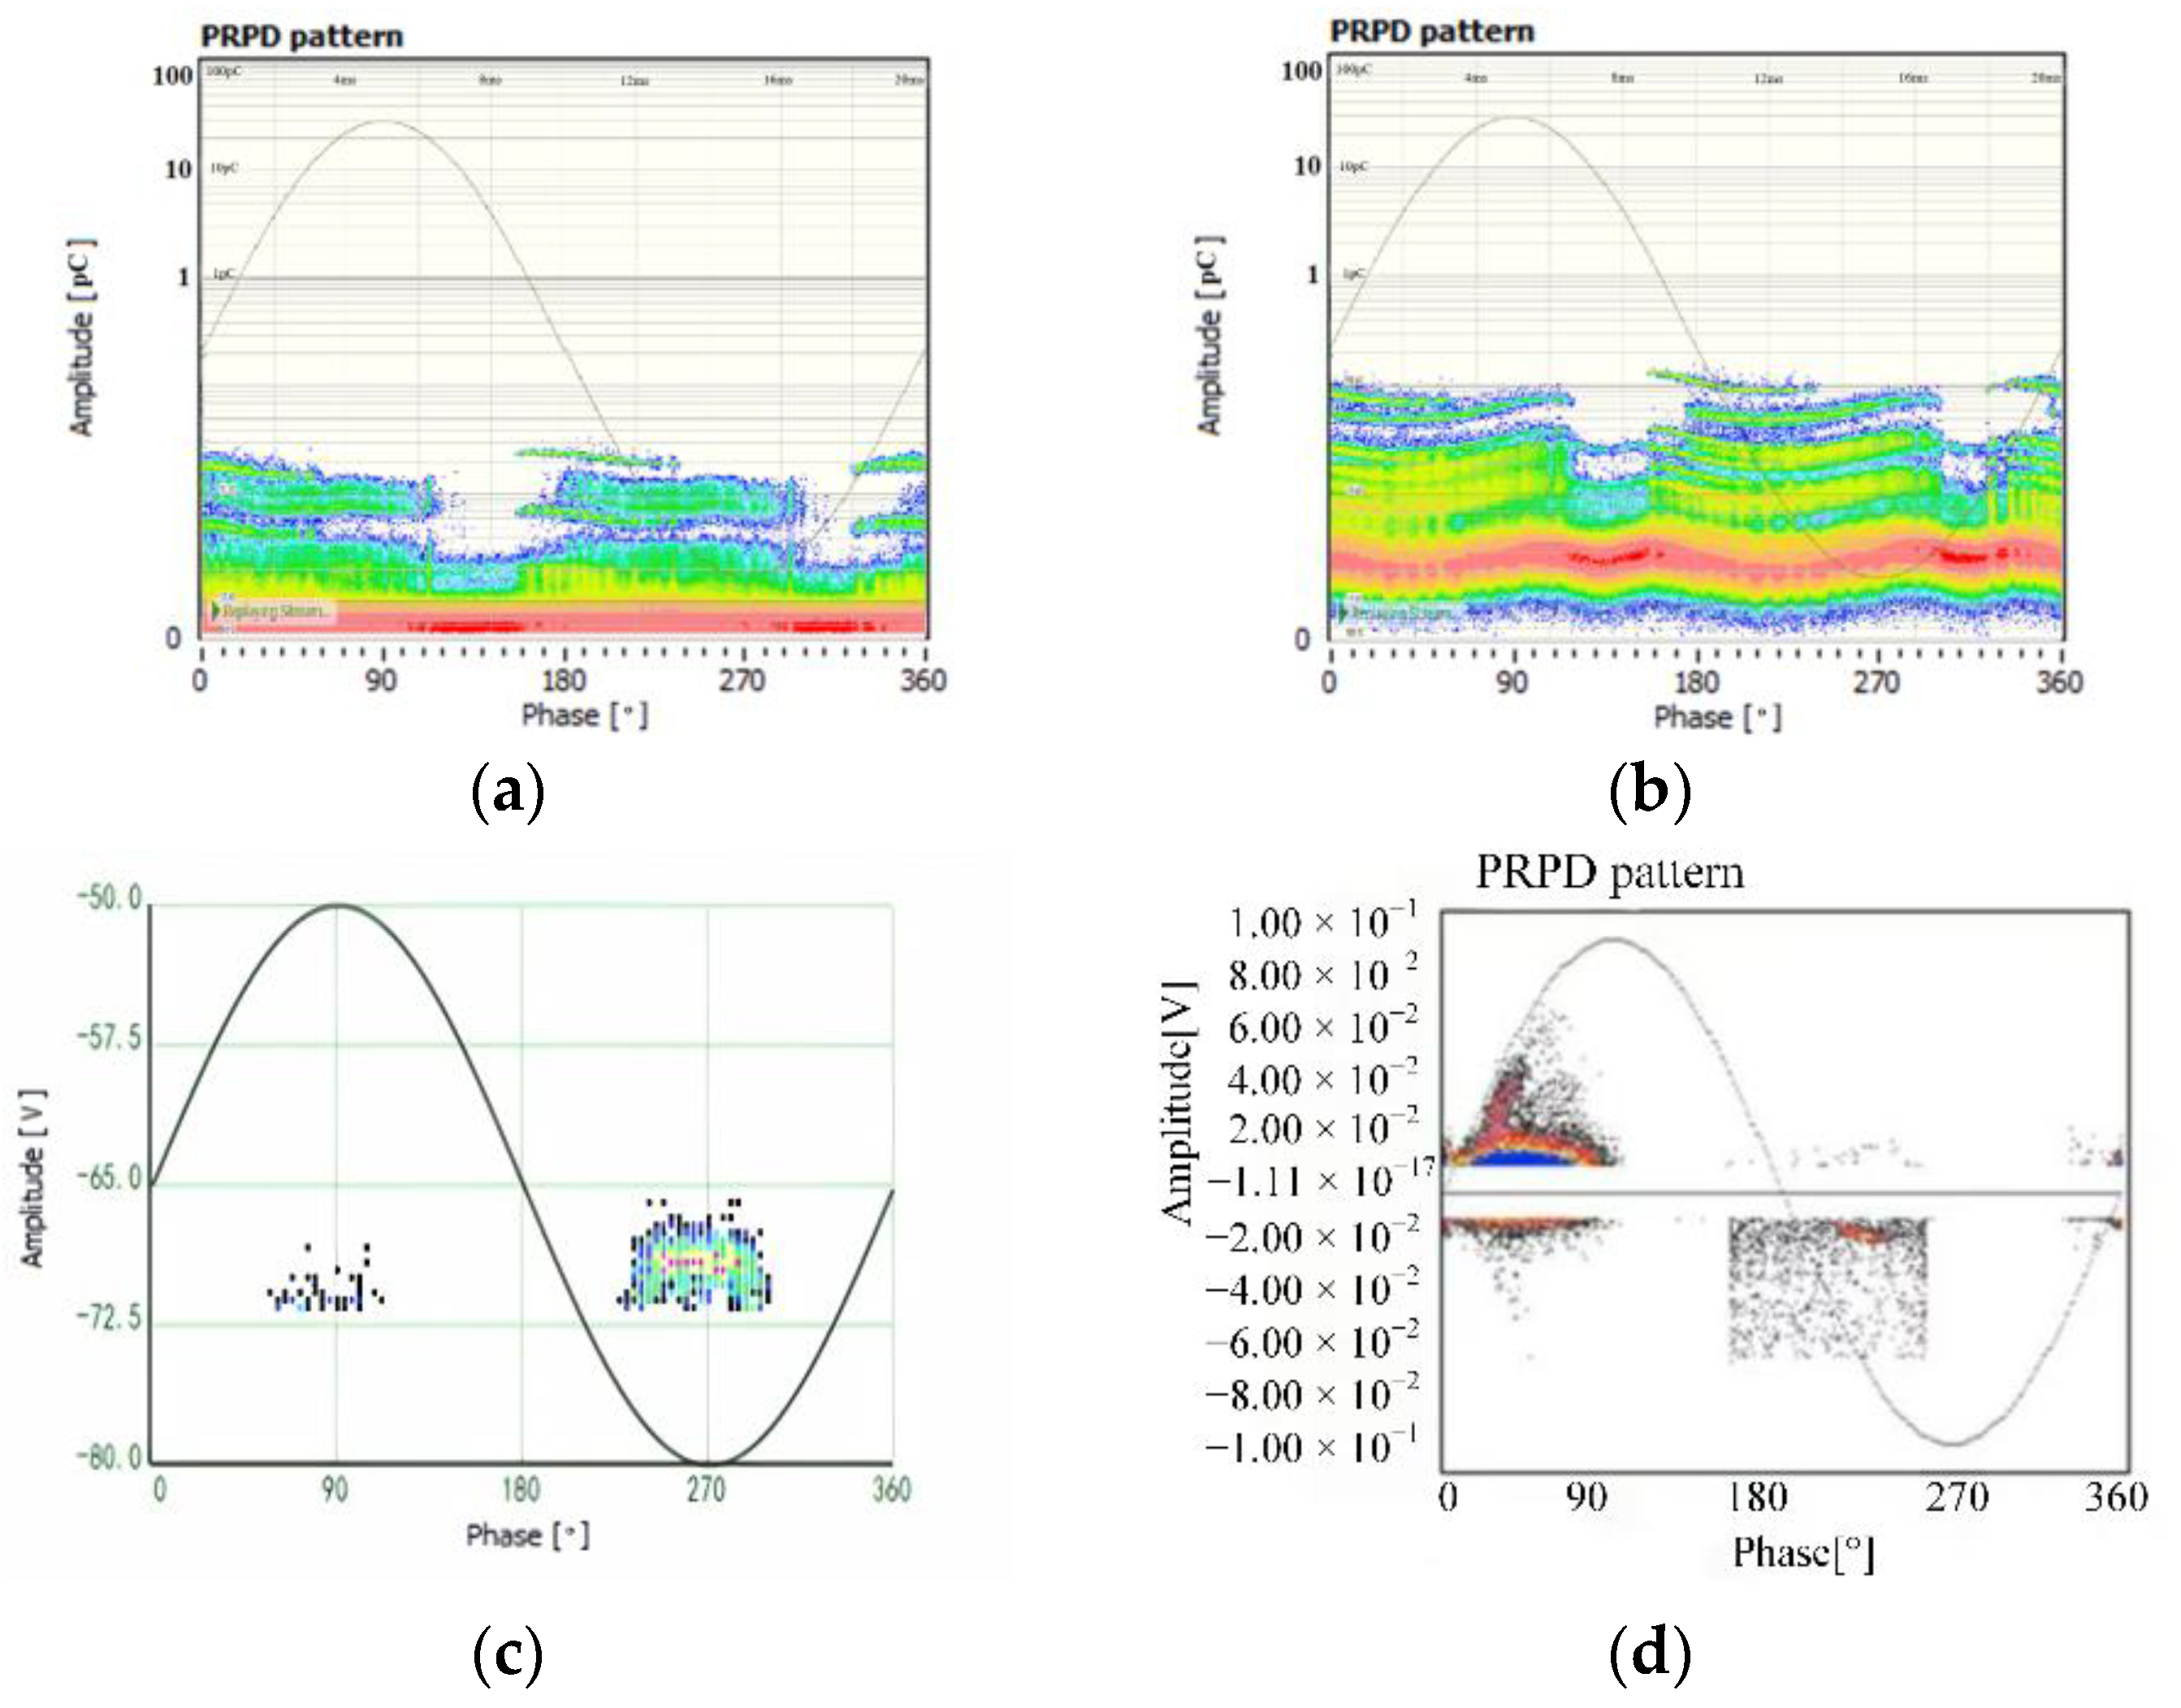
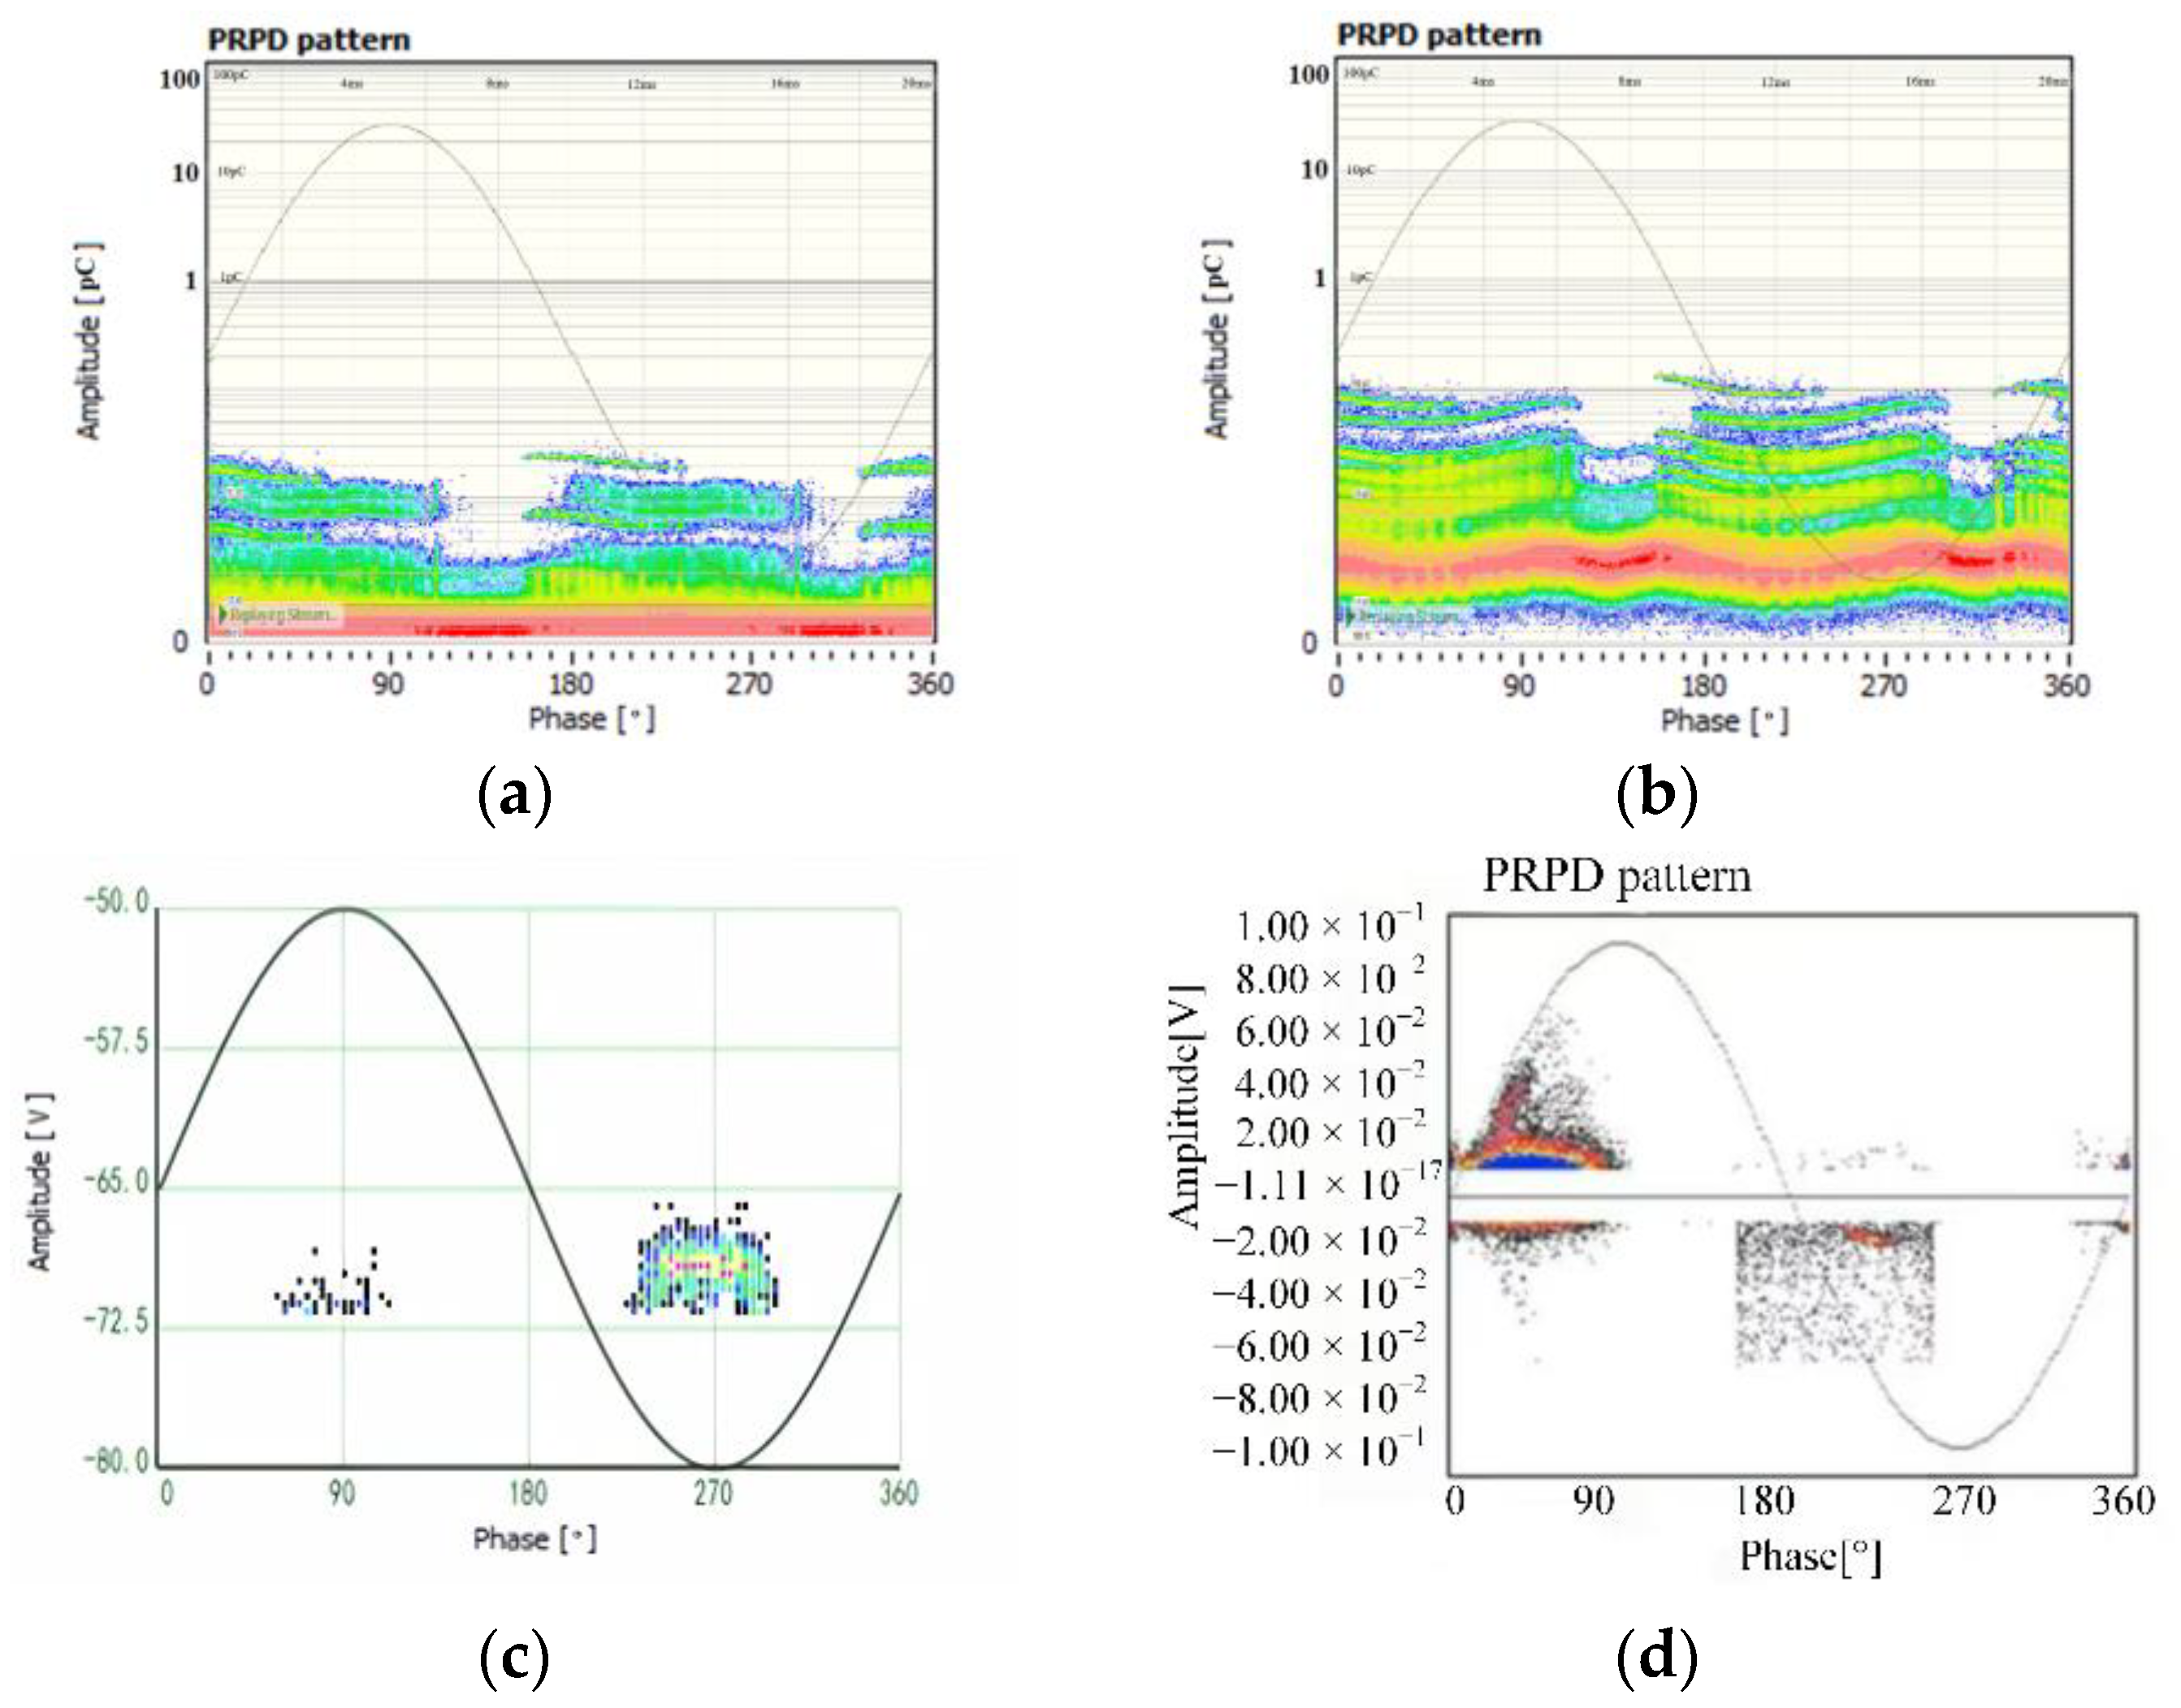
3.1.1. Construction of Laboratory Test Platform and Typical Partial Discharge Pulse Phase Distribution Spectrum

The typical spectra of the laboratory are mainly obtained by establishing typical insulation defects and building a partial discharge test platform [21,22], as shown in Figure 6 and Figure 7. The types of defects that can be achieved include air gaps, levitations, tips, edges, and so on. Partial discharge radiates high-frequency electromagnetic waves. The antenna can capture these signals in a non-invasive way to avoid the risk of direct access to the high-voltage circuit. The platform generates high-voltage-induced partial discharge through the transformer, uses the antenna as a UHF sensor to receive the electromagnetic wave signals generated by the discharge, and transmits it to the oscilloscope and computer through a 50 Ω coaxial cable for analysis. At the same time, the detection impedance and voltage divider are used to extract the pulse current signal and monitor the voltage phase. Combined with the UHF signal, the typical spectrum is generated to realize the multi-dimensional detection and pattern recognition of partial discharge.
In this work, the partial discharge detection and analysis equipment used is the MPD 600 produced by OMICRON in Berlin, Germany and the PDcheck produced by Techimp in Casalecchio di Reno, Italy. The accompanying software and version numbers are Omicron software for MPD and MI 1.6.5 and PDProcessingII1.00.22.
A total of four types of partial discharge spectra were obtained in the laboratory, and the PRPD spectra of each defect type were significantly different. In order to verify the accuracy of image extraction technology, the partial discharge spectra we used were all unprocessed actual obtained images, and the coordinate values were clearly optimized for readers to read.
Figure 8a shows the basic suspension discharge, which is generated by toggling the metal parts in the experiment. The partial discharge pulse phase of the suspension discharge is mainly distributed at the peak of the applied voltage, which is generated in the positive and negative half-cycles; the amplitude is large, and the time interval of adjacent pulses is basically the same, exhibiting a certain symmetry. Figure 8b shows a slight tip discharge, which is generally generated in a high-potential or low-potential metal burr or tip The polarity effect of the partial discharge pulse is obvious, usually occurring in the power frequency phase’s negative half-cycle or positive half-cycle. The discharge signal strength is weak, the phase distribution is wide, and the number of discharges is large. Figure 8c shows a high-intensity tip discharge, where the discharge signal also appears in the other half of the cycle; the amplitude is higher, the phase distribution is narrower, and the number of discharges is also smaller. Figure 8d shows the hole discharge, which is caused by the internal cracking of the solid insulation, air gaps, and other defects. The discharge signal usually appears in the power frequency phase’s positive and negative half-cycles and has a certain symmetry; the discharge amplitude is more dispersed, and the number of discharges is fewer. Figure 8e shows a typical surface discharge. The characteristics of the discharge signal are similar to those of the hole discharge signal, but the discharge amplitude is highly dispersed, the discharge time interval is unstable, and the polarity effect is not obvious.

3.1.2. Field PD Pulse Phase Distribution Spectrum

The samples collected in the field have the advantages of high authenticity, wide feature coverage, and rare defective features. Therefore, the quality of the sample set is positively correlated with the proportion of field samples, and models trained with a sample set with a high proportion of field samples tend to perform better in actual deployment and use. In the sample of this study, on-site partial discharge accounted for 64%, but in the actual training of the subsequent model, this proportion will be adjusted to more than 80%.
Compared with the typical discharge spectrum in the laboratory, the partial dis-charge spectrum in the field has the following characteristics: There is often no voltage phase reference, so the discharge type cannot be judged according to the location of the voltage phase; there is significant noise interference on site, especially white noise interference; and there are effects of cable propagation characteristics in the field, as well as the effects of multi-phase discharges [23].
The spectra obtained in the field include the following: on-site high-intensity suspension dis-charge (with reflected wave), displayed in Figure 9a; on-site multi-phase superimposed levitation discharge, displayed in Figure 9b; on-site typical corona discharge, displayed in Figure 9c; and typical on-site surface discharge, displayed in Figure 9d.

3.1.3. On-Site Noise Spectrum

The following are three typical interference spectra, namely pulse interference signal, power frequency interference signal, and white noise, which are shown in Figure 10a–c. The waveform of the pulse interference signal is relatively fixed, the amplitude is stable, there is a certain power frequency correlation, there are no phase characteristics, and there is a specific repetition frequency. The waveform of the power frequency interference signal has obvious peak points with periodic characteristics, no power frequency correlation, and no phase characteristics. The white noise disturbance waveform has no obvious phase characteristics, and the amplitude is widely distributed.

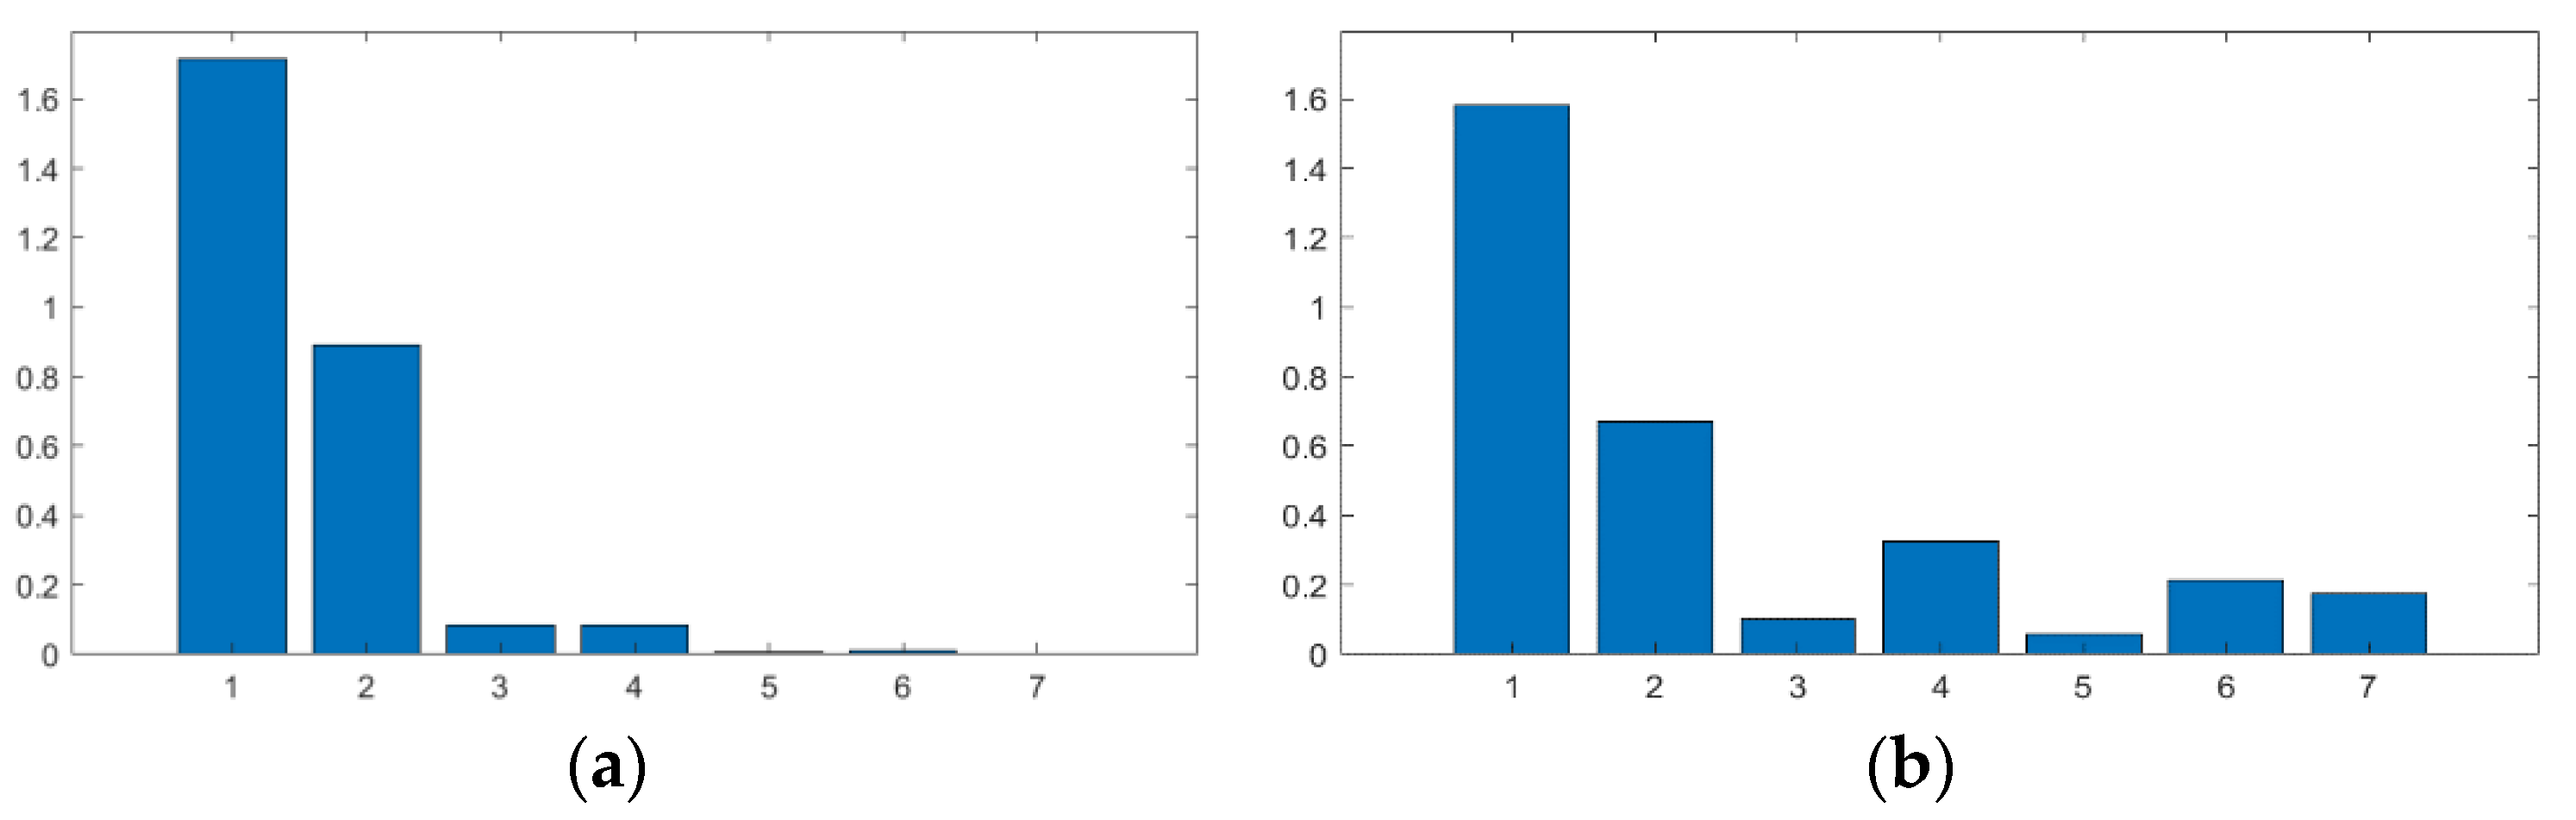
3.2. Feature Parameter Extraction of Grayscale Image and Partial Discharge Spectrum Verification

In this study, more than 1000 spectral data points were collected in the laboratory, more than 1000 live detection field data points, and more than 100 sets of cable online monitoring field data. Based on such a PD spectrum library, the PD PRPD spectral image is generated as the network input, and the convolutional neural network is used to identify various defect spectra. By combining the calculated characteristic parameters, the feature parameter dataset PD picFeature = {colorvector, n1, n2, n3, n4, n5, n6, n7} is obtained to verify the validity of the PD picFeature feature of the above feature dataset. As can be seen from Figure 11, when comparing the characteristic values of statistical spectra under different offsets and distortions, there is little change in the seven shape parameters, indicating consistency.
As can be seen from Figure 12, when comparing the characteristic values of statistical spectra with different amplitude sizes, the seven shape parameters do not change much and exhibit consistency.
Using the shape feature parameter extraction technology proposed in this paper, the average recognition accuracy of more than 90% was obtained without parameter optimization after substituting the extracted shape feature sets into different classification algorithms (SVM, KNN, Tress). Figure 13 shows the results of the accuracy analysis of the four types of basic partial amplification and the four types of noise classification under the three algorithms. The columns in the figure represent the eight classification results, while the rows represent the eight corresponding spectra that participated in the experiment. The percentage numbers displayed at the intersections indicate the confidence level of each result. The serial numbers 1 to 8 in the figure are suspension discharge, tip discharge, edge discharge, internal discharge, impulse interference noise, power frequency interference noise, white noise, and other noise.
The recognition accuracy for the four basic types of partial discharges is above 90%, with the best recognition effect for internal discharges and a slightly worse recognition effect for the other three types of partial discharges. There is an unstable phenomenon in the recognition of noise spectra: Firstly, for pulse interference noise, the recognition accuracy of all three classification algorithms can reach 100%, while for power frequency interference noise, the accuracy is only 71%, which is easily mistaken for “other noise”. In particular, when applying the KNN classifier, the recognition accuracy of white noise can only reach 71%. This may be attributed to insufficient noise data in the field survey, but with the expansion of the database in the application process, the recognition accuracy is expected to improve.

4. Conclusions

In this study, the following results were obtained:
(1)
Based on the typical partial discharge spectrum in the laboratory and the partial discharge spectrum obtained in the field, the partial discharge spectrum of multiple sets of cable monitoring data and the partial discharge spectrum in the typical literature were also collected, which provided a large number of samples and data support for convolutional neural network training.
(2)
A feature parameter extraction method based on the graph was proposed, which improved the compatibility of the pictures obtained in the field operation and provided convenience for the field staff. With the update of the defect database and the upgrade of the system algorithm, the recognition accuracy of the convolutional neural network for the partial discharge spectrum proposed in this paper can reach more than 85%. According to the measured network delay and cloud reasoning time displayed in the operation log, the diagnosis time is less than 10 s, which is expected to greatly improve the detection efficiency of cable aging in field operations.
(3)
By using the convolutional neural network based on deep learning, the self-learning mechanism can be used to improve the accuracy of the system while the PD spectrum database is constantly expanding.

Author Contributions

Conceptualization, Z.Z.; methodology, M.D.; software, H.W.; validation, H.W. and Z.Z.; formal analysis, W.R.; investigation, W.R.; resources, W.R.; data curation, W.R.; writing—original draft preparation, J.Y.; writing—review and editing, J.Y.; visualization, J.Y.; supervision, Z.S.; project administration, Z.S.; funding acquisition, Z.S. All authors have read and agreed to the published version of the manuscript.

Funding

This research was funded by the Jiangsu Province Coastal Power Infrastructure Intelligent Engineering Research Center Project (F2023-5218).

Data Availability Statement

The datasets generated during and/or analyzed during the current study are available from the corresponding author upon reasonable request.

Acknowledgments

The authors greatly appreciate the financial support from the ‘Jiangsu Province Coastal Power Infrastructure Intelligent Engineering Research Center Project’ (F2023-5218).

Conflicts of Interest

Authors Zhenqing Zhang, Hao Wu, and Weiyin Ren were employed by Lianyungang Zhiyuan Electric Power Design Company. Authors Jian Yan and Zhefu Sun were employed by State Grid Lianyungang Power Supply Company. The remaining authors declare that the research was conducted in the absence of any commercial or financial relationships that could be construed as a potential conflict of interest.

References

  1. DL/T2271-2021; Technical Specification for Online Monitoring System for Partial Discharge of High-Voltage Cables. National Energy Administration (NEA): Beijing, China, 2021.
  2. Liu, J.H.; OuYang, B.H.; Xia, R.; Fei, W.L. Assessment of the insulation aging state of high voltage XLPE cables. Electr. Power Eng. Technol. 2021, 40, 141–149. [Google Scholar]
  3. Zhao, F.Q.; Xiao, Y.X.; Lu, L. Investigation on Partial Discharge Characteristic Gas in XLPE. Guangdong Electr. Power 2019, 32, 130–136. [Google Scholar] [CrossRef]
  4. IEEE Std 4003—2006; IEEE Guide for Partial Discharge Testing of Shielded Power Cable Systems in a Field Environment. IEEE: Piscataway, NJ, USA, 2007.
  5. Wu, M.X.; Ouyang, B.H.; Li, W.J. Common Faults and Cause Analysis of XLPE Cables. Electr. Power 2013, 46, 66–70. [Google Scholar]
  6. Li, W.; Ye, C.; Li, L.Y.; Zheng, S.S. Novel Coupling Method for High-frequency Current of Partial Discharge in Switch-Gear Cabinets Used in Wind Solar & Energy Storage Stations Located in Gobi Deserts. High Volt. Appar. 2024, 1–13. [Google Scholar]
  7. Xu, Y.; Liu, W.D.; Chen, W.J.; Yang, J.G. Partial Discharge Characteristics of Metal Particles on Spacer Surface in GIS Based on High Sensitivity Measurement. High Volt. Eng. 2019, 45, 2707–2714. [Google Scholar]
  8. Su, Z.X.; Sun, K.; Ding, H.; Zhang, Z.S. Multi-source partial discharge detection method based on pulse current method and ultraviolet pulse method. Insul. Mater. 2024, 57, 101–108. [Google Scholar]
  9. Yan, Y.; Yao, L.L.; Wu, M.; Liu, Y.B.; Gao, J.H. Highly Sensitive Flexible PZT Piezoelectric Ultrasonic Sensor for Cable Partial Discharge Ultrasonic Detection. High Volt. Eng. 2024, 1–9. [Google Scholar] [CrossRef]
  10. Li, W.; Zhang, L.G.; Li, L.L.; Kong, J. Analysis on UHF signal intermittency and effective detection rate of partial discharge of metal particles on GIS insulator surface. Insul. Mater. 2024, 57, 122–129. [Google Scholar]
  11. Li, X.; Ding, D.W.; Xu, Y. Denoising and Localization for GIS/GIL Partial Discharge Based on Ultra-high Frequency and Ultrasound Method United. High Volt. Eng. 2024, 1–10. [Google Scholar] [CrossRef]
  12. Yang, Z.H.; Huang, H.; Liu, W.L.; Liu, Y. Partial Discharge Detection and Location Technology of Converter Transformer Based on Broadband Radio Frequency. High Volt. Eng. 2022, 48, 2952–2960. [Google Scholar]
  13. Xu, C.H.; Chen, J.M.; Liu, W.N.; Lu, Z.; Li, P.; Zhu, M.X. Pattern Recognition of Partial Discharge PRPD Spectrum in GIS Based on Deep Residual Network. High Volt. Eng. 2022, 48, 1113–1123. [Google Scholar]
  14. Huang, X.Y.; Xiong, J.; Zhang, Y.; Liu, H.; Chen, L.; Meng, X.L.; Jiang, X.C. Partial Discharge Pattern Recognition of Switchgear Based on Residual Convolutional Neural Network. Electr. Power 2021, 54, 44–51. [Google Scholar] [CrossRef]
  15. Wang, Z.C.; Wang, Z.W.; Zhu, M.F.; Ji, R.H.; Zhang, B. Study on sound recognition of Partial discharge base on convolu-tional. Electron. Meas. Technol. 2023, 46, 148–155. [Google Scholar]
  16. Zhao, D.H.; Zhang, J.G.; Shi, L.; Qi, X.; Wang, X. Transformer Condition Monitoring and Fault Diagnosis Based on Acoustic Signal Feature Spectrogram. Electr. Autom. 2023, 45, 106–108+112. [Google Scholar]
  17. Tang, Z.G.; Cao, Z.; He, N.H. Application of Convolutional Neural Network Transfer Learning in Partial Discharge Type Diagnosis. High Volt. Appar. 2022, 58, 158–164. [Google Scholar]
  18. Ma, Y.J.; Cheng, S.S.; Ma, Y.T.; Ma, Y.D. Review of convolutional neural network and its application in intelligent transportation system. J. Traffic Transp. Eng. 2021, 21, 48–71. [Google Scholar]
  19. Wang, K.; Zhang, S.Q.; Li, J.Z.; Sun, J.T.; Zhao, X.Y.; Liao, R.J.; Zou, G.P. Partial discharge feature extraction and optimization based on gray image decomposition. Electr. Mach. Control 2018, 22, 25–34. [Google Scholar]
  20. Diao, Y.H.; Meng, Z.Y.; Wang, X.J. Research on image shape feature extraction based on Hu invariant moment. Netw. Secur. Technol. Appl. 2017, 10, 46–47. [Google Scholar]
  21. Liu, S.T.; Xu, Z.G.; Yang, K. Partial discharge characteristics and identification of power cables under typical defects. High Volt. Eng. 2023, 49, 36–39. [Google Scholar]
  22. Zhou, H.B.; Wang, J.B.; Zhou, C. Research on commutation on-site partial discharge detection instrument. Autom. Instrum. 2018, 3, 63–66. [Google Scholar]
  23. Wan, X.Q.; Song, H.; Luo, L.G.; Li, Z.; Sheng, G.H.; Jiang, X.C. Application of Convolutional Neural Networks in Pattern Recognition of Partial Discharge Image. Power Syst. Technol. 2019, 43, 2219–2226. [Google Scholar]
Figure 1. Typical CNN structure diagram.
Inventions 10 00025 g001
Figure 2. The residual unit of the network applied in this study.
Inventions 10 00025 g002
Figure 3. The input-output structure of the application network applied in this study.
Inventions 10 00025 g003
Figure 4. Spectra-based feature parameter extraction technology.
Inventions 10 00025 g004
Figure 5. Partial discharge spectra before and after grayscale processing.
Inventions 10 00025 g005
Figure 6. Typical partial discharge test platform.
Inventions 10 00025 g006
Figure 7. Typical defect model.
Inventions 10 00025 g007
Figure 8. Partial discharge spectra of different kinds. (a) Basic suspension discharge. (b) Slight tip discharge. (c) High-intensity tip discharge. (d) Hole discharge. (e) Surface discharge.
Inventions 10 00025 g008
Figure 9. Typical on-site partial discharge. (a) Suspension discharge with high intensity in the field. (b) On-site multi-phase superimposed suspension discharge. (c) Typical corona discharge in the field. (d) Typical on-site surface discharge.
Inventions 10 00025 g009
Figure 10. On-site noise spectrum. (a) Pulses interfering with signals. (b) Power frequency interference signal. (c) White noise.
Inventions 10 00025 g010
Figure 11. (a) Characteristic values of the spectra taken at non-parallel angles. (b) Characteristic values of the spectrum taken at parallel angles.
Inventions 10 00025 g011
Figure 12. (a) Shape characteristic parameters of the statistical spectrum at large amplitudes. (b) Shape characteristic parameters of the statistical spectrum at small values.
Inventions 10 00025 g012
Figure 13. (a) Analysis of the accuracy of four typical partial discharge spectra and four types of noise classification under the SVM algorithm. (b) Analysis of the accuracy of four typical partial discharge spectra and four types of noise classification under the KNN algorithm. (c) Analysis of the accuracy of four typical partial discharge spectra and four types of noise classification under the Tress algorithm.
Inventions 10 00025 g013
Table 1. The parameter comparison between the classical neural networks and the network used in this study.
ModelVGGNetGoogLeNetResNetThe Network in This Study
Number of layers192215150
Data augmentationyesyesyesyes
Inceptionnoyesnono
Number of convolutional layers162115048
Convolution kernel size37, 1, 3, 57, 1, 3, 57, 1, 3, 5
Number of fully connected layers3111
The size of the fully connected layer4096, 4096, 1000100010008
Dropoutyesyesyesyes
Regularizationnoyesyesyes
Batch normalizationnonoyesyes
Disclaimer/Publisher’s Note: The statements, opinions and data contained in all publications are solely those of the individual author(s) and contributor(s) and not of MDPI and/or the editor(s). MDPI and/or the editor(s) disclaim responsibility for any injury to people or property resulting from any ideas, methods, instructions or products referred to in the content.

