Article

Analysis of Contact Noise Due to Elastic Recovery of Surface Asperities for Spherical Contact

1
Research Institute of Mechanical Technology, Pusan National University, Busan 48513, Republic of Korea
2
Department of Intelligent Robotics Graduate School, Pukyong National University, Busan 48513, Republic of Korea
3
Department of Mechanical Engineering, Pukyong National University, Busan 48513, Republic of Korea
*
Author to whom correspondence should be addressed.
Inventions 2025, 10(1), 17; https://doi.org/10.3390/inventions10010017
Submission received: 2 January 2025 / Revised: 31 January 2025 / Accepted: 5 February 2025 / Published: 8 February 2025

Abstract

:
Contact noise, often arising from frictional vibrations in mechanical systems, significantly impacts performance and user experience. This study investigates the generation of contact noise due to the elastic recovery of surface asperities during spherical contact with rough surfaces. A numerical algorithm was developed to model the noise produced by the elastic–plastic deformation of asperities, incorporating surface roughness and normal load effects. Gaussian-distributed rough surfaces with varying Ra values (0.01–5 μm) were generated to analyze the interaction between a rigid sphere and the rough surface. Contact pressure, asperity deformation, and the resulting acoustic emissions were calculated. The results indicate that, as surface roughness and applied load increase, noise levels within the audible frequency range also rise, exceeding 70 dB under certain conditions. The transition from elastic to plastic deformation significantly influences the noise characteristics. Surfaces with Ra ≥ 0.1 μm showed a 10–15 dB increase in noise compared to smoother surfaces. These findings offer insights into optimizing surface parameters for noise reduction in rolling contact applications, providing a foundation for designing low-noise mechanical systems. Future experimental validations are expected to enhance the practical applications of this analytical framework.

1. Introduction

Noise due to frictional vibration is a major problem that occurs in many mechanical systems, and it frequently occurs not only in mechanical elements that operate under dry friction conditions, such as brakes, friction clutches, railway wheel-rails, and automobile wipers, but also in mechanical elements that operate under lubricated conditions, such as worm gears, ball screws, and ball bearings.
Many experimental and theoretical studies have shown that frictional noise is caused by the generation of acoustic emission (AE), which is a transient elastic wave generated by the rapid release of strain energy. However, most of the existing theoretical studies on contact noise are based on FEM analysis or statistical surface roughness conditions. Radhakrishnan [1] presented the concept of noise generation due to asperity contact during rolling or sliding contact and experimentally verified noise generation according to surface roughness. The most widely used method to account for surface roughness is to use probabilistic theories such as the models presented by Baranov et al. [2] and Fan et al. [3]. They hypothesized that the energy released when elastically deformed surface asperities recover their deformation upon removal of the load is the cause of AE. These mathematical models are based on the theory of Greenwood and Williamson [4], which assumes that a surface is a collection of asperities with equal radii and a Gaussian distribution and calculates the contact properties using Hertzian theory. Sharma et al. [5,6,7] developed an AE model for spur gears and ball bearings based on Fan’s model. Abdo [8] presented a model of asperity stiffness for vertical/horizontal loads when contacting asperities, and Li et al. [9] created multiple surfaces using surface height parameters and then calculated noise based on elastic energy for rotational speed and vertical load using the finite element method. Kozupa et al. [10] analyzed the radiation efficiency and noise power using the FDM method. Recent studies have further explored the relationships between friction, wear, and noise in mechanical systems. Feng et al. [11,12] reviewed the interdependence of friction, wear, and AE in various tribological applications. Longtin et al. [13] modeled and experimentally validated the quantitative relationship between wear and noise through pin-on-disk experiments. Wang et al. [14] proposed a squeal noise reduction mechanism by modifying surface roughness. Sun et al. [15] analyzed friction-related AE in bolted joint structures under different preload conditions, revealing insights into AE mechanisms in practical systems. Borghesani et al. [16] proposed a statistical model to characterize acoustic emission signals generated from surfaces in sliding contact. These studies underscore the complexity of AE phenomena and highlight the importance of understanding the effects of surface roughness on contact mechanics and noise generation. The precise analysis of AE signal characteristics (e.g., frequency, intensity) and their relationship with surface roughness is currently applied in real-time monitoring and nondestructive testing technologies: metalworking processes [17,18] and gear fitting fault diagnosis [19,20].
The contact analysis methods for rough surfaces can generally be categorized into stochastic and deterministic approaches. However, most theoretical studies on noise analysis caused by contact with rough surfaces so far have been based on stochastic contact analysis. Stochastic contact analysis assumes that asperities with the same radius of curvature undergo Hertzian contact, which has the disadvantage of failing to provide information on the pressure and deformation around asperities with varying curvatures. In this study, surface roughness was generated and analyzed using a deterministic approach, allowing for the interpretation of deformation in and around asperities with varying curvatures on rough surfaces. This offers the advantage of better analyzing the effects on contact noise.
In this study, we developed an algorithm to calculate contact noise when a smooth sphere comes into contact with a rough surface, and evaluated the effects of surface roughness and normal load on noise generation. A three-dimensional rough surface with a surface roughness ranging from Ra 0.01 μm to Ra 5 μm was numerically generated. Through a contact analysis of three-dimensional rough surfaces, the pressure and asperity deformation were calculated considering the elastic and plastic deformation of the surfaces, and the noise level within the audible frequency was calculated based on the elastic energy generated when the asperity elastically recovered.

2. Theoretical Model for Contact Noise

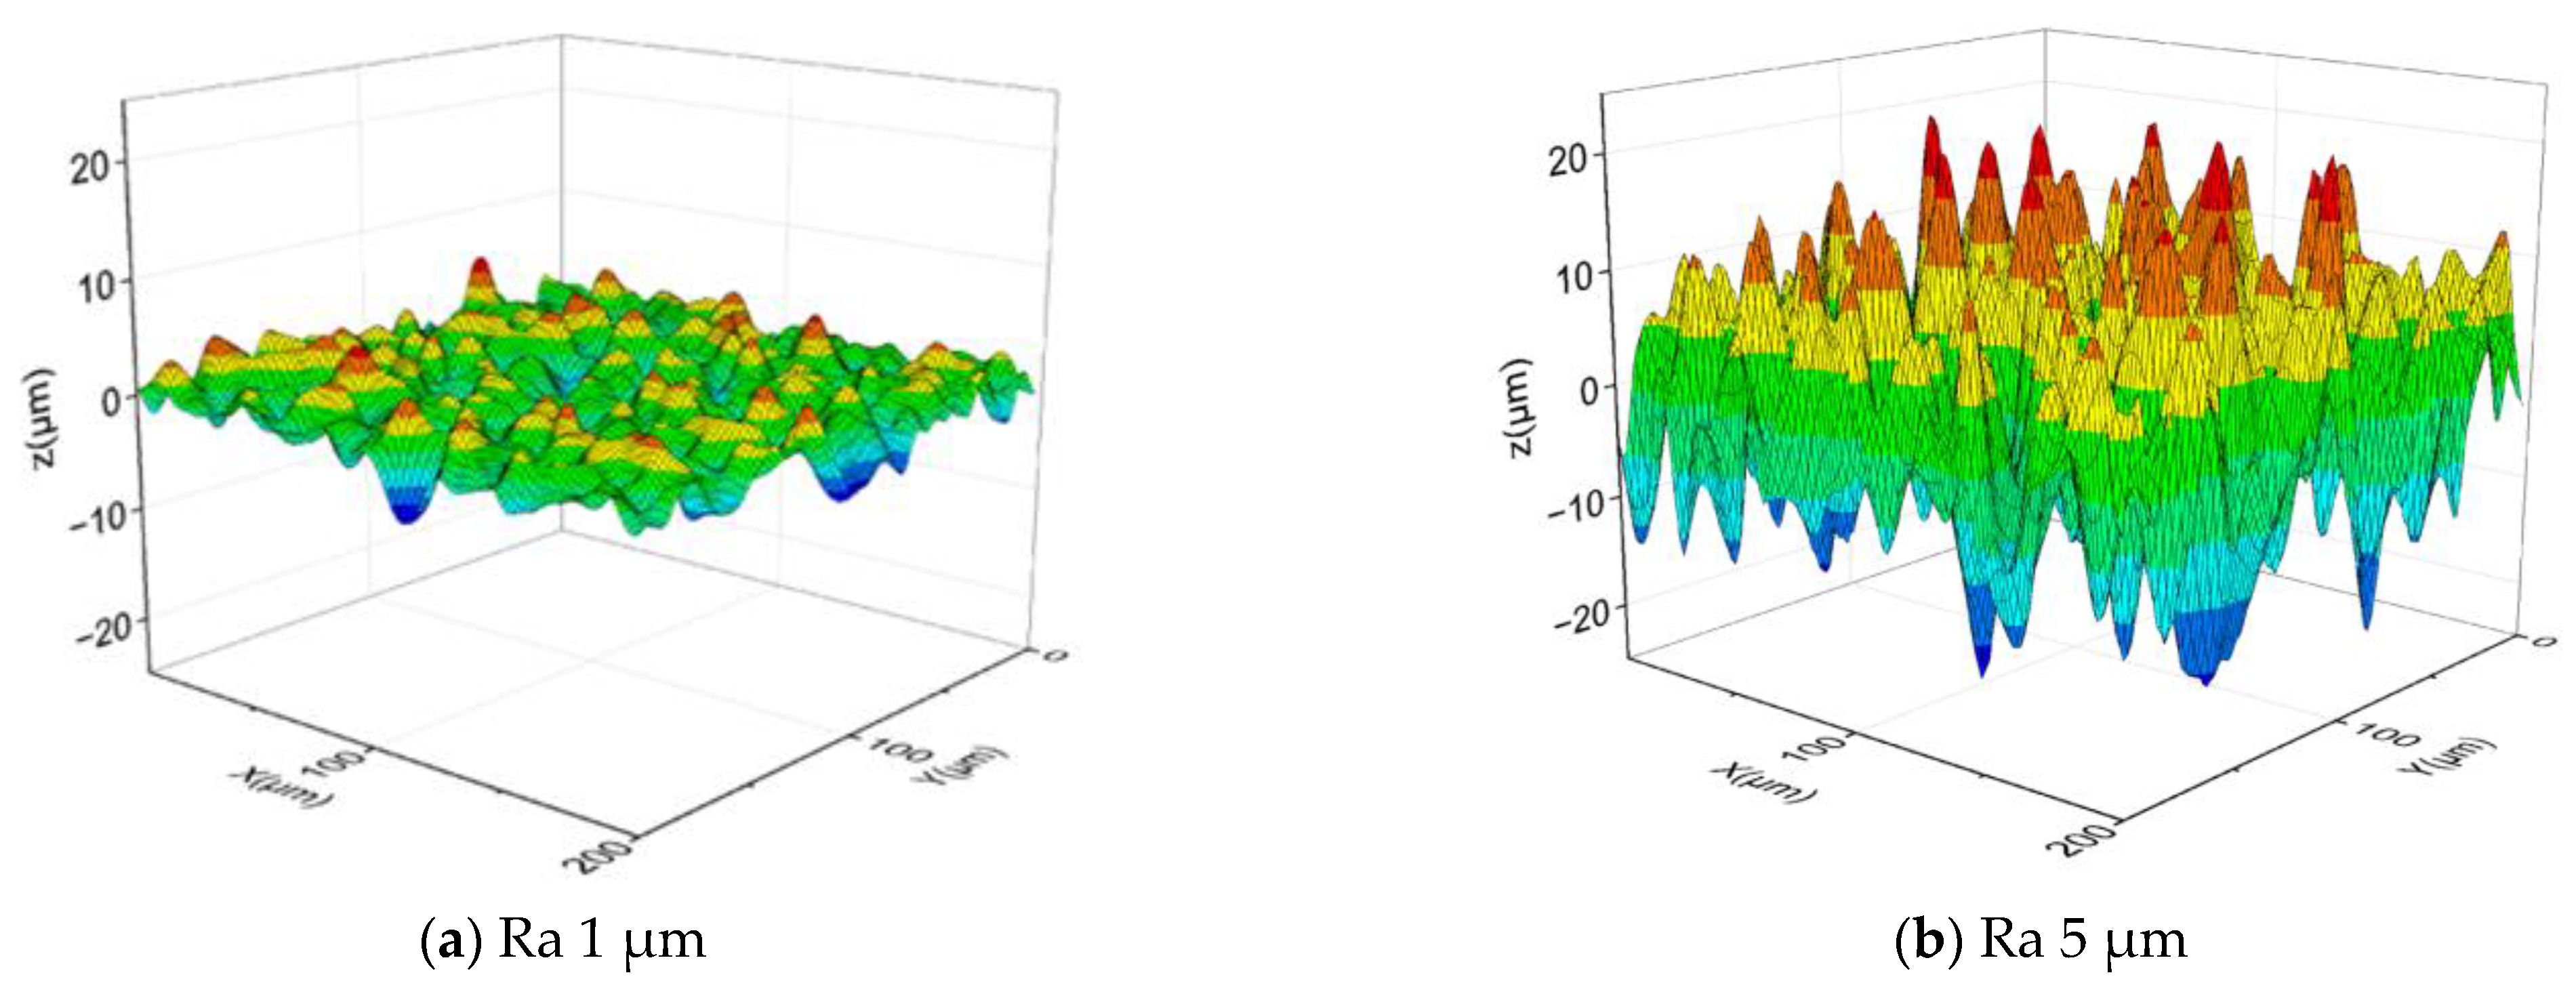
2.1. Rough Surface Generation

In general, there are two ways to create a rough surface: using measuring equipment and generating it numerically. The method of obtaining a three-dimensional surface shape using a measuring device requires a process of rearranging multiple cross-section measurements using a high-precision measuring device, and it is difficult to implement a surface with the desired surface parameters. On the other hand, the numerical surface generation method has the advantage of being able to provide a desired shape for roughness height and correlation between asperities, thereby allowing the influence of each surface parameter to be separated and analyzed. The rough surface used in this analysis was generated numerically. The statistical properties of the surface structure could be specified from the probability density function and the autocorrelation function, and the desired surface could be generated using these two functions [21]. The surface autocorrelation function was defined as follows:
R λ x , λ y = E z x , y , z x + λ x , y + λ y
where E is the expectation operator, and λ x and λ y are the autocorrelation lengths of the x-axis and y-axis, respectively. The probability density function can be classified as Gaussian distribution or non-Gaussian distribution depending on the distribution of the roughness height. The probability density function for Gaussian distribution is shown in Equation (2), and, the desired roughness height distribution could be obtained by assigning the standard deviation and mean of the roughness height.
f z = 1 2 π σ 2 e x p ( z z ¯ ) 2 / 2 σ 2
Figure 1 shows examples of the result of numerically generating rough surfaces with Gaussian distribution by combining the probability density function and the autocorrelation function.

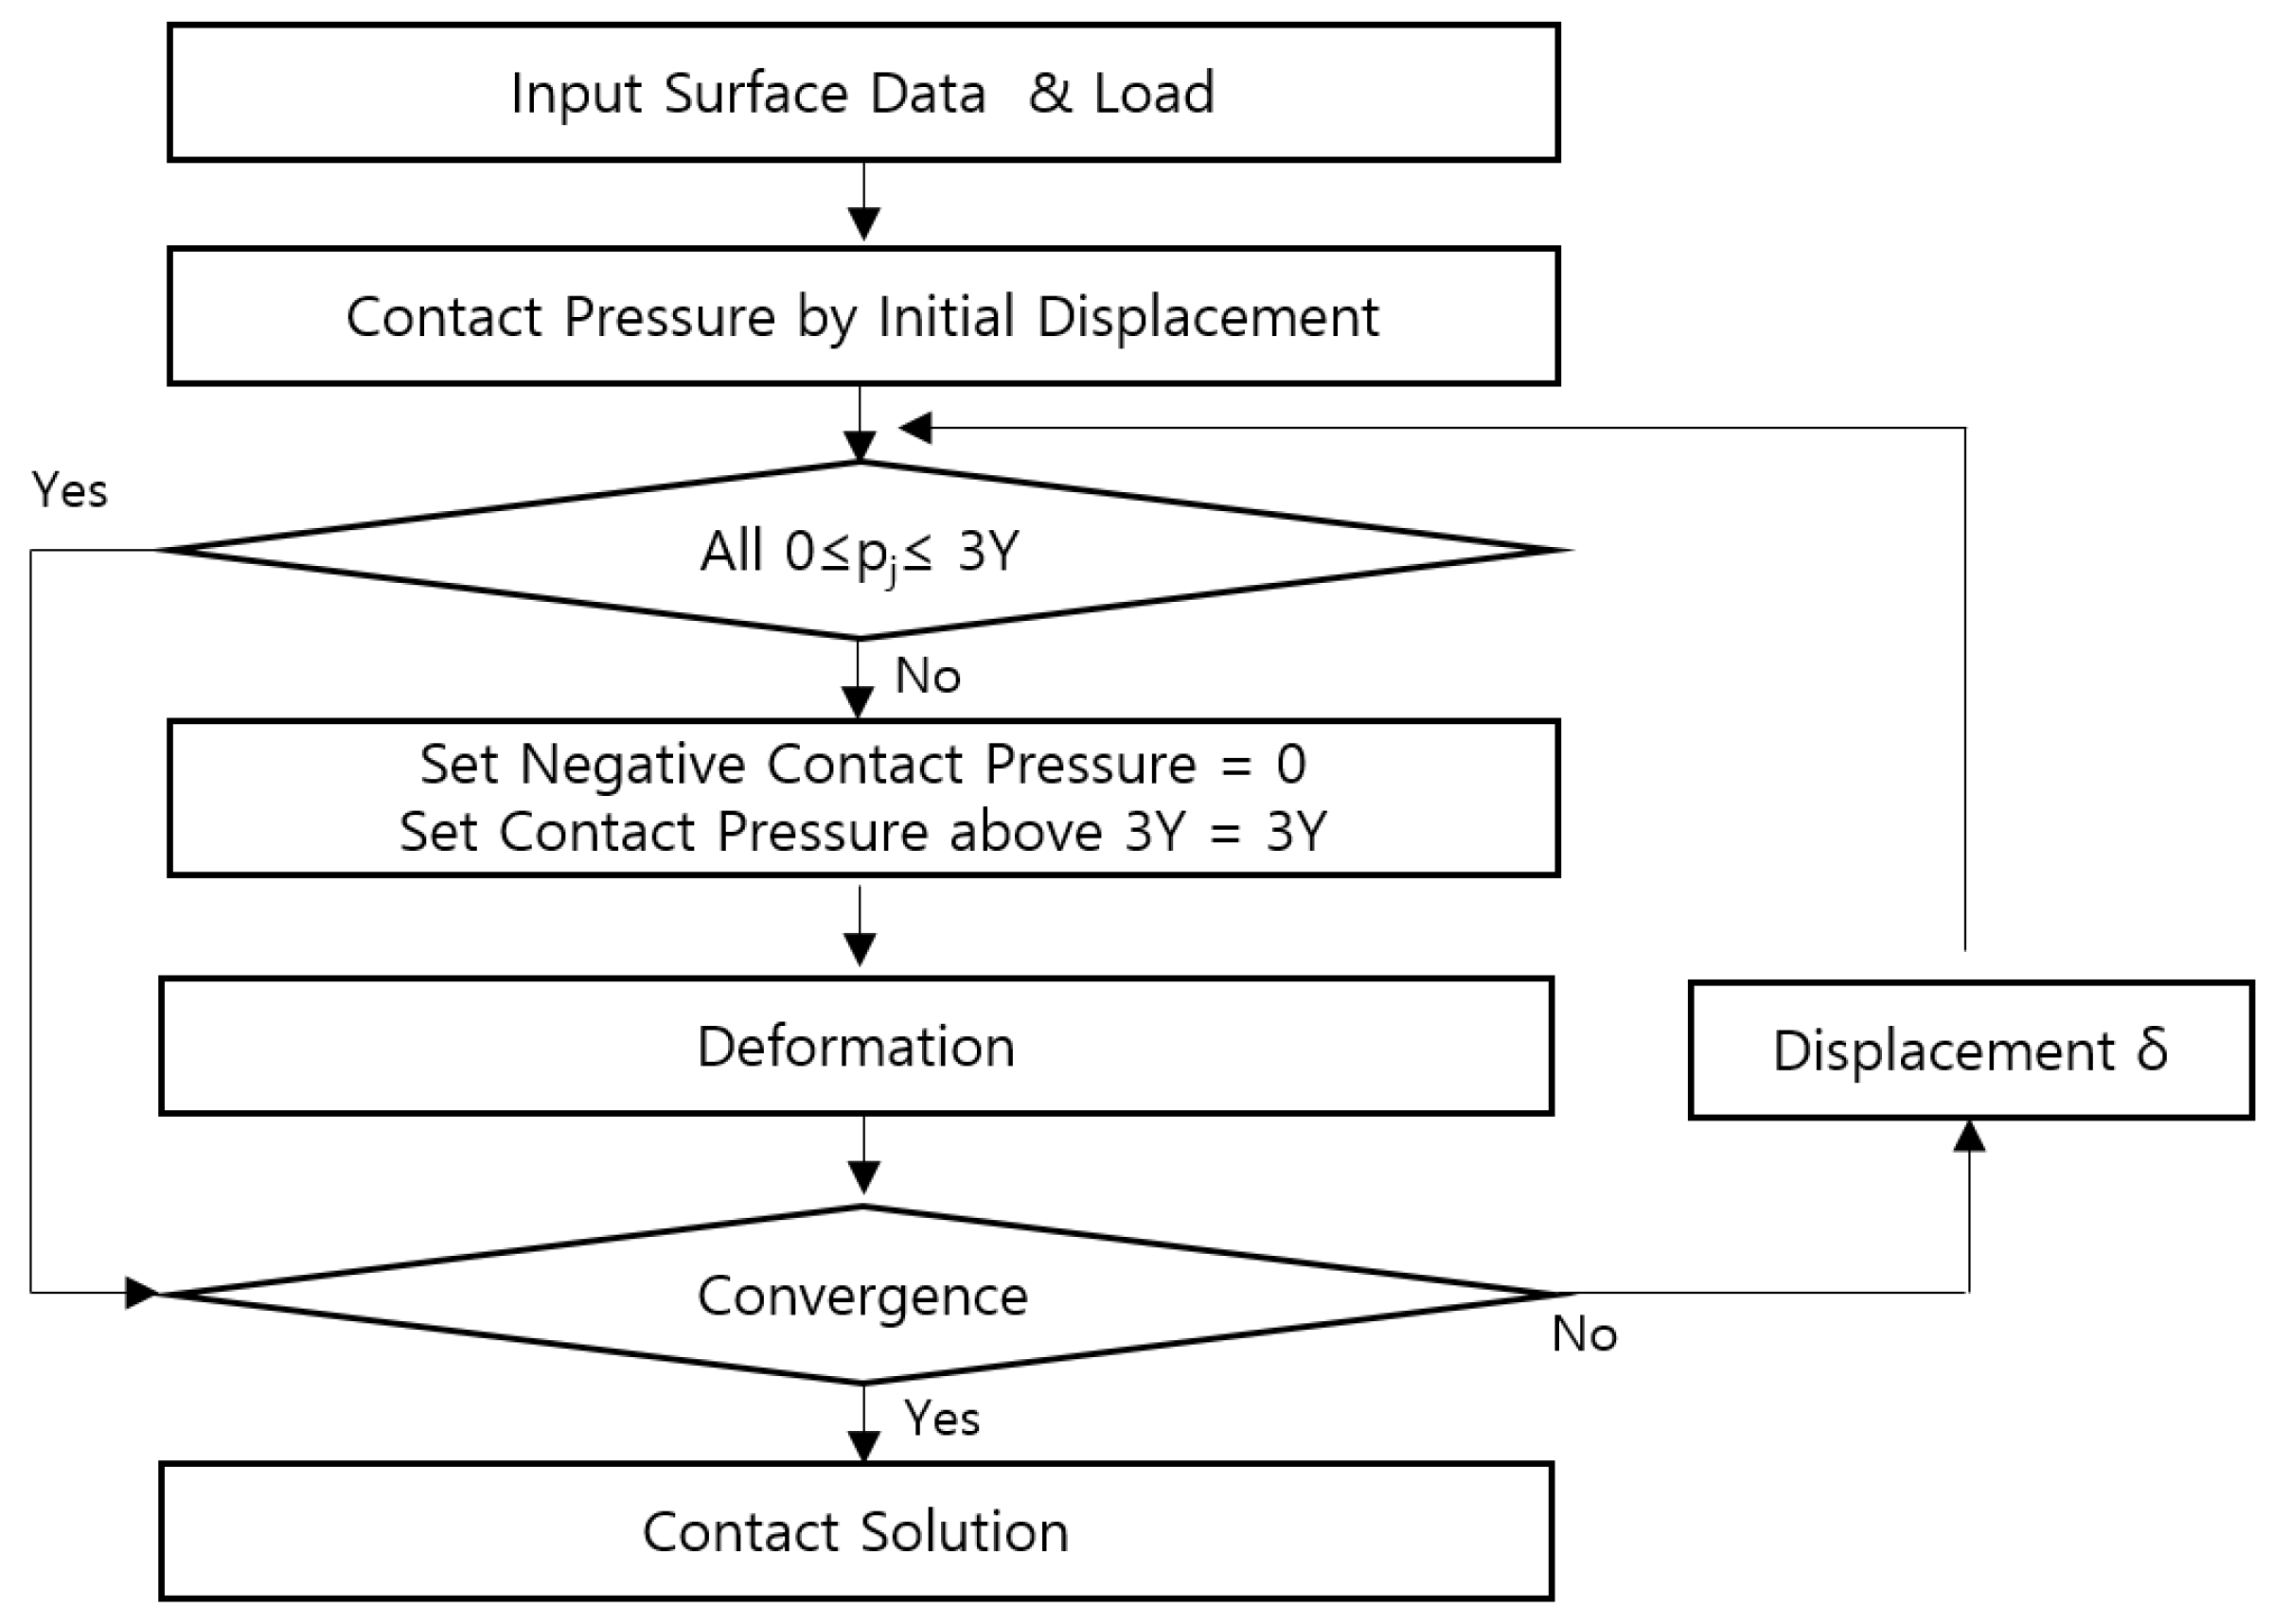
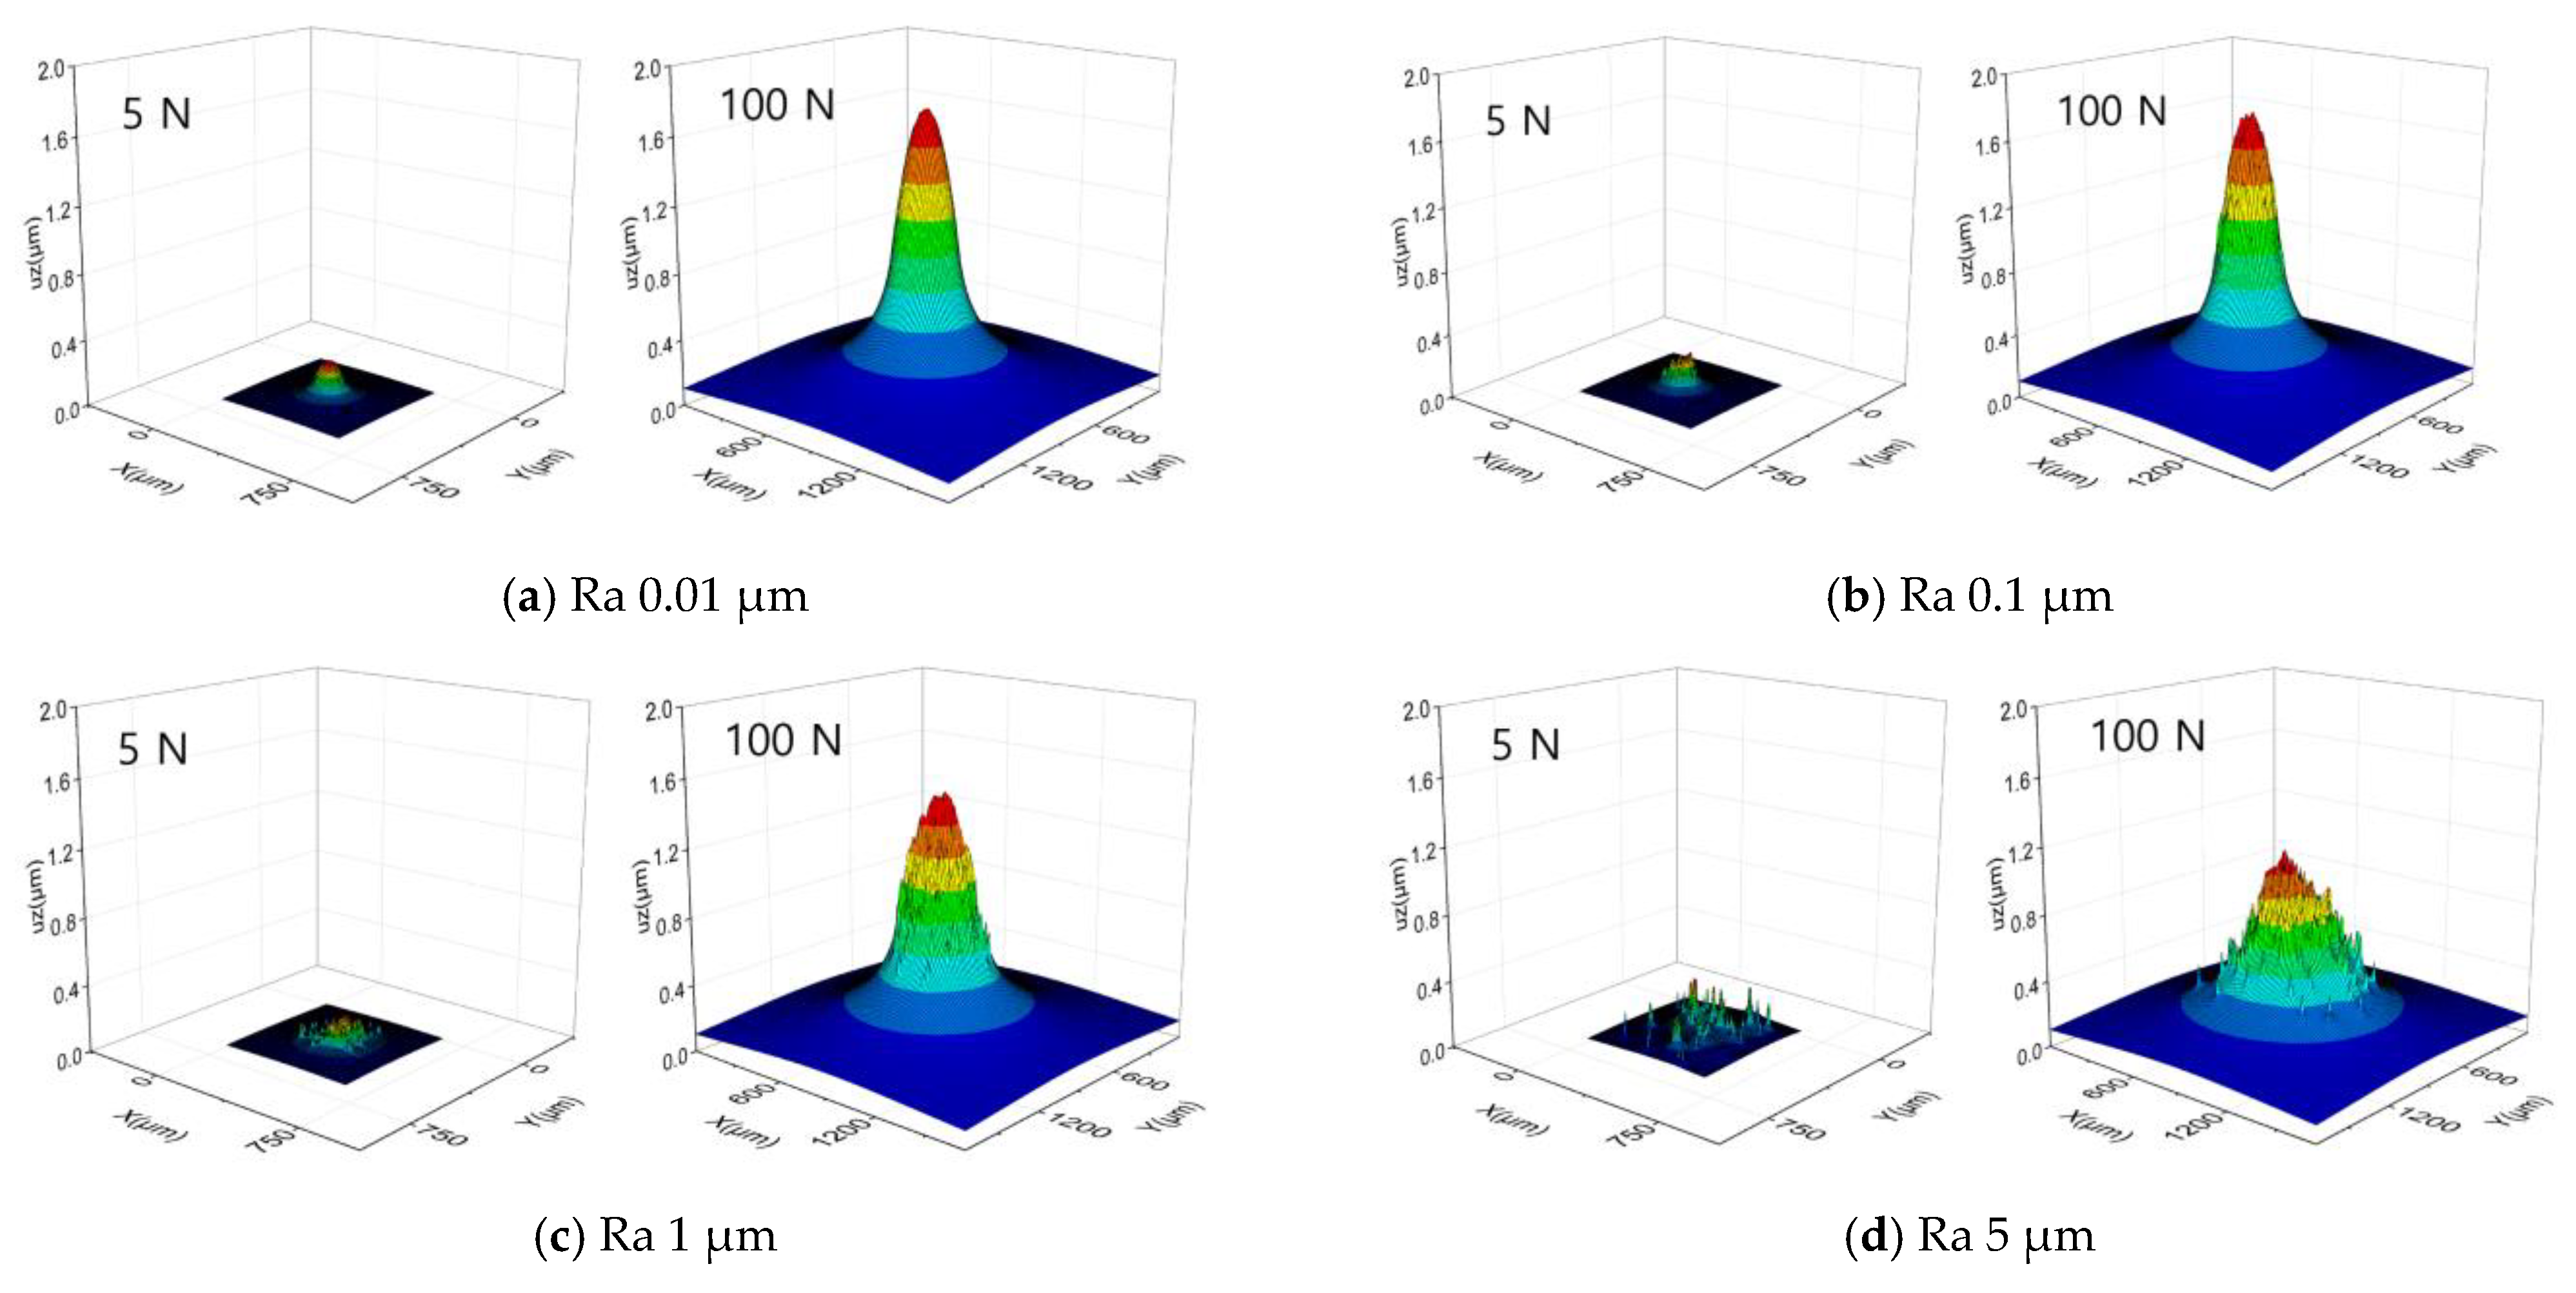
2.2. Contact Analysis

In general, there are two ways to create a rough surface: using measuring equipment and generating it numerically. In this study, a three-dimensional elastoplastic contact analysis of a sphere and a rough plate was performed as shown in Figure 2. Plastic deformation is considered to be confined to a very small region, such that it does not significantly alter the geometry of the surrounding elastically deformed contact surface. Outside the plastically deformed area, the relationship between contact pressure and elastic deformation remains valid. For moderate loads, the contacting asperities on rough flat surfaces are typically separated and consist of a few patches, resembling sharp asperities rather than spherical ones with large radii. These asperity points are modeled as elastic–perfectly plastic, transitioning directly from elastic deformation to fully developed plastic flow. This results in constrained plastic deformation rather than an unconstrained fully developed plastic flow. This approach generates errors in analyzing the contact of a sphere and heavily loaded contact of a rough flat surface.
When modeling the plastic deformation of asperities, if the contact pressure in a local region exceeds three times the uniaxial yield strength (3Y) or the hardness of the softer material, the pressure in those regions is capped at 3Y, allowing free deformation [22,23]. Accordingly, in this study, when the contact pressure surpassed the softer material’s hardness (3Y), the stress was set to this limiting value. To solve the contact problem, iterative operations are required under the following constraints:
P ( x , y ) > 0 at   h ( x , y ) = 0
P x , y = 0 at   h x , y > 0
P x , y = 3 Y at   p ( x , y ) 3 Y
where p ( x , y ) is the contact pressure, Y is the yield strength of the material, and h(x,y) is the distance between the rigid surface and the rough surface after deformation, which can be expressed as shown below.
h x , y = e x , y + u x , y δ
where, e x , y is the height distribution of the surface shape before deformation, δ is the effective rigid body displacement, and u x , y is the elastic deformation. u x , y is expressed by Boussinesq’s equation within the contact area Ω, and Equation (6) represents the following relationship [24]:
1 ν 2 π E Ω p ( x , y ) ( x x ) 2 + ( y y ) 2 = δ e x , y
where E is Young’s modulus, and ν is Poisson’s ratio. This equation can be written in the following form:
j = 1 n C i , j p j = δ e j
where N is the number of patches in Ω, and C i j is the influence matrix, which represents the displacement at point j due to a distributed unit normal load on element i. Figure 3 is a flowchart of the contact analysis procedure. First, a rough surface is created numerically, and elastic deformation is applied to calculate the number of initial contact points and the deformation amount. An influence matrix is constructed to consider the interaction of asperities, and the initial contact pressure is calculated. Then, contact points with negative pressure values are excluded, and an influence matrix corresponding to the new number of contact points is reconstructed through an iterative calculation to calculate the contact pressure [23]. Here, if the contact pressure exceeds the yield strength limit to consider the yield strength of the asperity, it is set to 3Y, and the iterative calculation is performed again to calculate the new contact area and contact pressure.

2.3. Contact Noise Analysis

Contact noise can be calculated from the elastic energy released when the asperities elastically deform. As shown in Figure 4, when the vertical deformation due to the vertical force acting on the asperity is u, the asperity undergoes elastic recovery in the case of u t i + 1 < u t i , and the elastic energy released during time dt is as follows:
E l = u t i + 1 u t i d t p i d x d y
The elastic energy released from the entire node during time dt is as follows:
E t = l = 1 m E l
where k is the number of nodes in which elastic recovery occurs. Since elastic energy is stored and released at each contact node during asperity contact, the released elastic energy can be obtained by adding the elastic energy of nodes with negative values, and the elastic energy release rate can be calculated by dividing this value by the time interval.
E ˙ A E = q E ˙ r
where q is the energy ratio that takes into account the loss when converting the amount of acoustic emission generated by friction into an acoustic measurement device. In this study, this is assumed to be a value of 1 because the loss is not considered. The sound intensity level (SIL) can be expressed as follows:
L I [ d B ] = 10 l o g E ˙ A E S I r e f
where S is the area of a sphere whose radius is the distance from the noise source to the measurement location, and this is generally set to 1 m. Iref is the reference sound intensity level, which is 10 W/m2. Since the difference between the sound pressure level (SPL) and the sound intensity level at atmospheric pressure is about 0.2 dB, which is negligible, the sound intensity level was used as the sound pressure level in this study.

3. Results and Discussion

In this study, contact noise analysis was performed when a smooth rigid sphere with a diameter of 10 mm rolled on a flat plate with varying surface roughness. The flat plate was assumed to be a Gaussian surface, and only the Ra value was varied (0.01, 0.1, 1, and 5 μm) to investigate the effect of surface roughness height on the noise. The autocorrelation length was set to be a constant 10 μm, representing a moderately smooth and uniform surface. Practical examples of surfaces with an autocorrelation length of about 10 µm included precision-machined metal surfaces (e.g., after milling or turning), surfaces subjected to fine polishing, etc. The applied load was analyzed from 5 N to 100 N. In this study, the material properties of the flat plate were assumed to be an elastic modulus of 210 GPa and a Poisson’s ratio of 0.3, corresponding to general-purpose steel alloys. The hardness was assumed to be 2.1 GPa, which corresponded to quenched and tempered steel or a medium carbon steel with some form of strengthening treatment. The friction coefficient was not considered, assuming pure rolling motion.
Figure 5 is a three-dimensional diagram of the contact pressure shape according to the change in vertical load for surfaces with four different Ra values. In the case of the Ra 0.01 μm surface in Figure 5a, it can be seen that the contact pressure and contact area increase as the load increases, and, even under the condition of a load of 100 N, the maximum contact pressure is below 2.1 GPa, which is the limit of plastic deformation. It is shown that the maximum contact pressure on surfaces with Ra of 0.1 μm or more reaches the limit of plastic deformation, and the plastically deformed contact area increases as the surface becomes rougher and the load increases. In rough surface contact, only the asperity peaks initially make contact. These peaks are distributed across the surface, creating discrete contact regions. The pressure distribution at these contact points often forms vertical (column-like) stress profiles due to localized loading. When asperities undergo elastic or elastic–plastic deformation, the contact pressure within each asperity tends to follow a predictable distribution. In the elastic regime, it may resemble a Hertzian pressure distribution, as shown in Figure 5a. In the plastic regime, pressure tends to equalize to a constant value which is the material hardness, leading to uniform vertical stress transfer, as shown in Figure 5b–d. To examine the effect of different Ra values on pressure distribution, smoother surfaces with Ra = 0.1 µm exhibited shorter and more uniform asperities in height. These features led to greater elastic deformation, resulting in a relatively smooth and axisymmetric pressure distribution around the contact zones. In contrast, rougher surfaces with taller asperities experienced plastic deformation under higher loads, limiting the pressure to the material’s hardness. Consequently, the pressure distribution on rough surfaces displayed sharp peaks and valleys corresponding to asperity contact points, leading to highly non-uniform pressure distributions as these asperities bore the majority of the load.
Figure 6 shows the shape of the elastic deformation of the flat plate according to the change in vertical load. The surface with Ra 0.01 μm is smoothly deformed because the surface of the flat plate is very smooth. As the surface roughness increases, the shape of the deformation is greatly affected by the surface roughness. Surfaces with higher Ra values (e.g., 5 μm) exhibit lower contact deformations primarily because taller asperities on rough surfaces tend to undergo plastic deformation under a load, rather than elastic deformation. On a rough surface, the contact occurs primarily at the peaks of the asperities, concentrating the load on smaller areas. This high stress often exceeds the material’s elastic limit, causing the asperities to deform plastically. Once an asperity deforms plastically, it flattens out, reducing its ability to deform further under the same load. This “capping” of deformation by plasticity leads to lower overall contact deformation compared to elastic deformation, which would distribute the load over a larger area. The pressure at contact points between the asperities and the rough surfaces is effectively limited by the material’s hardness. This further restricts the total deformation, as the asperities cannot deform indefinitely. In contrast, smoother surfaces have shorter, more uniform asperities, leading to a broader and more elastic load-bearing contact area. This results in greater overall deformation, distributed more evenly across the surface.
Figure 7 shows the ratio of the plastically deformed area to the Hertz contact area for four surfaces as a function of the increasing load. Here, the Hertz contact area refers to the contact area when both the sphere and the plate are assumed to be smooth. Each point of the curves in this figure is calculated by averaging the results from five different surfaces, all having the same statistical roughness properties. An error bar representing the surface deviation of the simulation results is shown on the graph. It can be seen that the plastic deformation ratio is 0 under all load conditions on a surface with Ra 0.01 μm and that the plastic deformation ratio increases as the load increases on a surface with Ra 0.1 μm or more. It can be seen that the plastic deformation ratio of the surface with Ra 1 μm is approximately 1.5 times higher than the surface with Ra 0.1 μm under all load conditions, and the plastic deformation ratio of the surface with Ra 5 μm is almost similar to that of the surface with Ra 1 μm.
Figure 8 shows the noise results generated when a smooth sphere rolls over surfaces with four different surface roughness values, assuming frictionless conditions. As the surface roughness increased, the noise level within the audible frequency range increased. On a surface with Ra 0.01 μm, there was a large difference in the noise levels under loads of 20 N or less and 50 N or more in the high-frequency band. This could have been due to the difference in elastic deformation, as the deformation due to the surface roughness of high-frequency components became more prominent as the load increased. On surfaces with Ra of 0.1 μm or more, noise levels greater than 70 dB, which are generally recognized as squeal noise, were generated, and the noise level increased as the load increased.
Figure 9 shows the change in the maximum noise level as the load increases for surfaces with four different surface roughness values. It can be seen that the maximum noise level for the surface with Ra 0.1 μm or more increased by about 10 to 15dB compared to the surface with Ra 0.01 μm. The noise level for all four surfaces increased by an average of about 14 dB as the load increased, but the noise increase was not large at a load of 50 N or more. In the range of vertical loads of 20 N and 50 N, the surface with Ra 1 μm showed the highest noise level, and in the range of vertical loads of 100 N, the surface with Ra 5 μm showed the highest noise level. However, it can be seen that the effect of surface roughness was not significant for surfaces with Ra 0.1 μm or more overall.
In this study, simulations were performed only on Gaussian-distribution surfaces, but it is thought that the effect on the contact noise of non-Gaussian-distribution surfaces would also be significant. According to the study by Kim et al. [23], surfaces with positive skewness and higher kurtosis tend to have relatively small contact areas, high contact pressures, and high plastic deformation ratios. This can be interpreted as high pressures inducing high stresses, which can increase the possibility of material failure or wear. In terms of noise, noise levels can increase due to increased energy release in the plastically deformed region. In addition, the influence of the autocorrelation length on the contact noise is also expected to be very large, because it directly affects the frequency, intensity, and characteristics of the noise generated in tribological systems. Surfaces with a short autocorrelation length and closely spaced asperities produce high-frequency, intense noise due to rapid interactions, while surfaces with a long autocorrelation length reduce noise intensity, with smoother, low-frequency transitions. Therefore, experimental and analytical studies are needed to investigate the effects of contact noise on various surface parameters, including skewness, kurtosis, and autocorrelation length. Confirmatory experiments for the effect of surface roughness on contact noise using a ball-on-disk friction test device are underway, and we expect to obtain good results in the near future.

4. Conclusions

In this paper, we numerically analyzed the contact noise generated when a sphere rolled on a surface with various height distributions of surface roughness using a deterministic technique. We calculated the noise level within the audible frequency based on the elastic energy generated when asperities deformed, considering the elastic–plastic deformation of the surface. The ratio of the plastically deformed area on the surface with Ra 1 μm was about 1.5 times higher than that on the surface with Ra 0.1 μm under all load conditions, and that on the surface with Ra = 5 μm was almost similar to that on the surface with Ra = 1 μm. The maximum noise level on the surface with Ra 0.1 μm or more increased by about 10 to 15 dB compared to that on the surface with Ra 0.01 μm. On surfaces with Ra of 0.1 μm or more, noises greater than 70 dB, which are generally recognized as squeal noise, were generated, and the noise level also increased as the load increased. In this study, the influence of surface roughness on contact noise was investigated through an analytical method based on the elastic–plastic deformation of surface asperities. The optimal surface for low-noise machine operation is expected to be presented through future experimental verifications.

Author Contributions

Conceptualization and methodology, B.L. and T.K.; validation, K.K., B.L. and T.K.; formal analysis, K.K.; data curation, K.K.; writing—original draft preparation, B.L.; writing—review and editing, T.K.; supervision, T.K.; project administration, T.K.; and funding acquisition, T.K. All authors have read and agreed to the published version of the manuscript.

Funding

This work was supported by a research grant of Pukyong National University (2023).

Data Availability Statement

The data presented in this study are available upon request from the corresponding author.

Acknowledgments

This research was supported by Pukyong National University.

Conflicts of Interest

The authors declare no conflicts of interest.

References

  1. Ananthapadmanaban, T.; Radhakrishnan, V. An investigation of the role of surface irregularities in the noise spectrum of rolling and sliding contacts. Wear 1982, 83, 399–409. [Google Scholar] [CrossRef]
  2. Baranov, V.; Kudryavtsev, E.; Sarychev, G.; Schavelin, V. Friction of solids and nature of acoustic emission. In Acoustic Emission in Friction; Baranov, V., Kudryavtsev, E., Sarychev, G., Schavelin, V., Eds.; Elsevier: Moscow, Russia, 2007; Volume 53, pp. 1–36. [Google Scholar]
  3. Fan, Y.; Gu, F.; Ball, A. Modelling acoustic emissions generated by sliding friction. Wear 2010, 268, 811–815. [Google Scholar] [CrossRef]
  4. Greenwood, J.A.; Williamson, J.B.P. Contact of Nominally Flat Surfaces. Proc. Roy. Soc. 1966, A295, 300–319. [Google Scholar]
  5. Sharma, R.B.; Parey, A.; Tandon, N. Modelling of acoustic emission generated in involute spur gear pair. J. Sound Vib. 2017, 393, 353–373. [Google Scholar] [CrossRef]
  6. Sharma, R.B.; Parey, A. Modelling of acoustic emission generated due to pitting on spur gear. Eng. Fail. Anal. 2018, 86, 1–20. [Google Scholar] [CrossRef]
  7. Sharma, R.B.; Parey, A. Modelling of acoustic emission generated in rolling element bearing. Appl. Acoust. 2019, 144, 96–112. [Google Scholar] [CrossRef]
  8. Abdo, J.A. Investigation of contact stiffness and its relation to friction-induced noise and vibration. Int. J. Model. Simul. 2006, 26, 295–302. [Google Scholar] [CrossRef]
  9. Li, Z.; Chen, J.; Li, J.; Liu, K. Effect of textured surface on the frictional noise under line contact and sliding–rolling conditions. P. I. Mech. Eng. C-J. Mec. 2018, 232, 1679–1689. [Google Scholar] [CrossRef]
  10. Kozupa, M.; Kolusz, G.; Świątkowski, M. Acoustic radiation efficiency parameter in assessment of transformer noise. In Proceedings of the Euronoise 2018, Heraklion, Greece, 27–31 May 2018. [Google Scholar]
  11. Feng, P.; Borghesani, P.; Smith, W.A.; Randall, R.B.; Peng, Z. A review on the relationships between acoustic emission, friction and wear in mechanical systems. Appl. Mech. Rev. 2020, 72, 020801. [Google Scholar] [CrossRef]
  12. Feng, P.; Borghesani, P.; Smith, W.A.; Peng, Z. Model-based surface roughness prediction using acoustic emission signals. Tribol. Int. 2020, 144, 106101. [Google Scholar] [CrossRef]
  13. Lontin, K.; Khan, M.A. Wear and Airborne Noise Interdependency at Asperitical Level: Analytical Modelling and Experimental Validation. Materials 2021, 14, 7308. [Google Scholar] [CrossRef] [PubMed]
  14. Wang, A.Y.; Mo, J.L.; Wang, X.C.; Zhu, M.H.; Zhou, Z.R. Effect of surface roughness on friction-induced noise: Exploring the generation of squeal at sliding friction interface. Wear 2018, 402–403, 80–90. [Google Scholar] [CrossRef]
  15. Sun, J.; Yang, H.; Li, D.; Xu, C. Analysis of friction-related acoustic emission in bolted joint structures. Int. J. Mech. Syst. Dyn. 2023, 3, 383–396. [Google Scholar] [CrossRef]
  16. Borghesani, P.; Smith, W.A.; Zhang, X.; Feng, P.; Antoni, J.; Peng, Z. A new statistical model for acoustic emission signals generated from sliding contact in machine elements. Tribol. Int. 2018, 127, 412–419. [Google Scholar] [CrossRef]
  17. Nahornyi, V.; Panda, A.; Valíček, J.; Harničárová, M.; Kušnerová, M.; Pandová, I.; Legutko, S.; Palková, Z.; Lukáč, O. Method of Using the Correlation between the Surface Roughness of Metallic Materials and the Sound Generated during the Controlled Machining Process. Materials 2022, 15, 823. [Google Scholar] [CrossRef] [PubMed]
  18. Kim, J.H.; Kim, S.; Seo, Y.H.; Song, W. Acoustic emission analysis for monitoring tribological behaviors of steel coated with zinc phosphate/stearate for cold forging. Tribol. Int. 2024, 196, 109641. [Google Scholar] [CrossRef]
  19. Li, X.; Li, J.; Qu, Y.; He, D. Gear pitting fault diagnosis using integrated cnn and gru network with both vibration and acoustic emission signals. Appl. Sci. 2019, 9, 768. [Google Scholar] [CrossRef]
  20. Leaman, F.; Vicuña, C.; Clausen, E. A review of gear fault diagnosis of planetary gearboxes using acoustic emissions. Acoust. Aust. 2021, 49, 265–272. [Google Scholar] [CrossRef]
  21. Patir, N. A numerical procedure for random generation of rough surfaces. Wear 1978, 47, 263–277. [Google Scholar] [CrossRef]
  22. Lee, S.C.; Cheng, H.S. On the relation of load to average gap in the contact between surfaces with longitudinal roughness. Tribol. Trans. 1992, 35, 523–529. [Google Scholar] [CrossRef]
  23. Kim, T.W.; Bhushan, B.; Cho, Y.J. The contact behavior of elastic/plastic non-Gaussian rough surfaces. Tribol. Lett. 2006, 22, 1–13. [Google Scholar] [CrossRef]
  24. Love, A.E.H. The stress produced in a semi-infinite solid by pressure on part of the boundary. Proc. Roy. Soc. London 1929, A228, 377–420. [Google Scholar]
Figure 1. Numerically generated Gaussian rough surfaces with (a) Ra 1 μm and (b) Ra 5 μm. The correlation length in the x− and y−directions is 10 μm. The rough surfaces are discretized by 256 × 256 nodes with identical spacing.
Inventions 10 00017 g001
Figure 2. Contact geometry of a sphere and a plane.
Inventions 10 00017 g002
Figure 3. Flowchart of contact analysis.
Inventions 10 00017 g003
Figure 4. Storage and release of elastic energy of the asperity.
Inventions 10 00017 g004
Figure 5. Three-dimensional contact pressures on surfaces with four different Ra values for applied loads of 5 N and 100 N: (a) Ra 0.01 μm; (b) Ra 0.1 μm; (c) Ra 1 μm; and (d) Ra 5 μm.
Inventions 10 00017 g005
Figure 6. Three-dimensional contact deformations on surfaces with four different Ra values for applied loads of 5 N and 100 N: (a) Ra 0.01 μm; (b) Ra 0.1 μm; (c) Ra 1 μm; and (d) Ra 5 μm.
Inventions 10 00017 g006
Figure 7. Plastic deformation ratio for surfaces with four different Ra values as a function of increasing loads. The error bars show standard deviations of the simulation results.
Inventions 10 00017 g007
Figure 8. A-weighted SPL values of surfaces with various Ra values for different normal loads under rolling contact values of (a) Ra 0.01 μm, (b) Ra 0.1 μm, (c) Ra 1 μm, and (d) Ra 5 μm.
Inventions 10 00017 g008aInventions 10 00017 g008b
Figure 9. Maximum A-weighted SPL values with four different Ra values as a function of increasing load. The error bars show standard deviations of the simulation results.
Inventions 10 00017 g009
Disclaimer/Publisher’s Note: The statements, opinions and data contained in all publications are solely those of the individual author(s) and contributor(s) and not of MDPI and/or the editor(s). MDPI and/or the editor(s) disclaim responsibility for any injury to people or property resulting from any ideas, methods, instructions or products referred to in the content.

