Article

Siting and Sizing Method of GFM Converters Based on Genetic Algorithm

1
State Grid Jiangsu Electric Power Co., Ltd., Economic and Technological Research Institute, Nanjing 210008, China
2
State Grid Jiangsu Electric Power Co., Ltd., Nanjing 210018, China
*
Author to whom correspondence should be addressed.
Inventions 2025, 10(1), 13; https://doi.org/10.3390/inventions10010013
Submission received: 20 December 2024 / Revised: 17 January 2025 / Accepted: 24 January 2025 / Published: 3 February 2025

Abstract

:
The rising integration of renewable energy sources has resulted in a diminished capacity for voltage support within the system, which is characterized by low inertia and a reduced short circuit ratio (SCR). In order to improve grid strength and enhance the capacity for renewable energy integration, an initial analysis was conducted on the grid support capabilities of grid-forming (GFM) stations, followed by an investigation into how grid strength influences the dominant operational modes of GFM converters. Subsequently, leveraging the definition of the multi-infeed short circuit ratio, a calculation method for the SCR, applicable to new energy base stations featuring GFM substations, is developed. Additionally, a strategic approach to optimal location selection and sizing of these substations aimed at enhancing the SCR within new energy grids is proposed, with the model being solved through genetic algorithms. Finally, the effectiveness of the proposed method is verified based on the IEEE39-node system and a real new energy station. The results show that the system strength is greatly improved after the optimized configuration of the GFM equipment, and the maximum tolerable space of 90% new energy stations reaches 95% of the theoretical maximum tolerable space of each new energy station.

1. Introduction

The ‘14th Five-Year Plan’ for China’s modern energy system explicitly articulates the necessity of expediting the development of large-scale wind and photovoltaic energy projects in arid regions, such as deserts and gobi, as a pivotal strategy for achieving the dual carbon objectives. However, the remote locations of these new energy bases often result in a lack of conventional power supply support. Consequently, the systems exhibit the characteristics of low inertia and low short circuit ratios (SCR) [1], which predisposes them to sub- and super-synchronous oscillations due to mismatches between the control bandwidth of phase-lock loops and grid strength [2]. Therefore, there is an urgent need to enhance the support capacity of these renewable energy bases.
In response to these challenges, grid-forming (GFM) technology is increasingly attracting scholarly attention. Traditional grid-following converters exhibit limited support capabilities, demonstrating satisfactory control performance solely under robust grid conditions. The GFM converter operates independently of a PLL for grid integration, thereby mitigating the occurrence of sub- and super-synchronous oscillations typically associated with PLL dominance [3,4,5,6,7]. Furthermore, GFM converters exhibiting an outer characteristic akin to that of a voltage source are typically capable of providing substantial voltage support to the grid [8,9,10]. Consequently, GFM converter technology has garnered significant attention within the industry in recent years, leading to the emergence of concepts such as GFM energy storage systems, GFM static reactive power compensators, and GFM wind turbines, alongside various demonstration projects.
At present, the stability characteristics of new energy multi-input systems incorporating GFM equipment have garnered considerable attention. The current methodologies for assessing the stability of GFM converters encompass impedance-based stability criteria and participation factor analysis derived from state space models [11]. The impedance-based stability criterion delineates the grid-connected inverter and the grid as two independent subsystems, derives their equivalent impedances, and assesses the stability of the grid-connected inverter system using the Nyquist curve [12,13]. However, this method is unable to identify the critical equipment or even the control loops that contribute to system instability. The state-space-based participation factor analysis initially computes the eigenvalues of the system’s state matrix [14,15], subsequently assessing system stability by determining whether the real parts of these eigenvalues are positive [16]. Following this, it calculates the participation factor values for each state variable, enabling system designers or equipment manufacturers to adjust control parameters accordingly to restore stability. Consequently, state-space-based participation factor analysis is preferred by researchers over impedance-based stability criteria. Accordingly, this paper examines the impact of grid strength on the dominant mode of GFM converters based on this framework.
The short circuit ratio is commonly employed as an evaluation metric for the voltage support capacity of grid-connected systems [17,18], reflecting the grid’s ability to sustain voltage stability following the integration of renewable energy power stations. The critical short circuit ratio (CSCR) represents the SCR associated with the substation’s critical stability condition, reflecting the substation’s resilience to weak power grids. The operational capability of a new energy power station under weak grid conditions can be assessed through a comparison of SCR and CSCR [19]. Ref. [20] explored the number of GFM wind turbines that the system needs to configure for specific grid short circuit ratio conditions but did not consider the proportional configuration of GFM wind turbines under different grid strengths. Ref. [21] studied the relationship between the configuration ratio of the GFM wind turbine and the CSCR through the small signal model and the electromagnetic transient model. It concluded that with the increase in the configuration ratio of the GFM wind turbine, the CSCR of a wind farm gradually decreases. Ref. [22] conducted an analysis of the landing points and capacity allocation challenges associated with GFM converters, determining the minimum capacity necessary to satisfy system strength constraints. Ref. [23] explored the minimum proportion of synchronous generators required in new high-proportion energy power systems but did not consider the impact of GFM wind turbines. Ref. [24] explored the proportion of GFM wind turbines in islanded scenarios but did not consider the influence of grid characteristics on the proportion demand of GFM wind turbines after wind farms are connected to the grid. Based on the example of Irish power system, Ref. [25] analyzed that the whole power electronic system needs about 30% of the GFM converter to ensure the stability of the system. However, these research conclusions are the results of specific scenarios and are difficult to be extended to general scenarios. In reference [26], based on the idea of matrix perturbation, it is proved that in the system dominated by phase-locked loop converters, adding a small number of GFM converters can improve the generalized short circuit ratio of the hybrid system, thereby enhancing the small signal stability of the phase-locked loop frequency band. However, there is a lack of in-depth research on the quantitative evaluation of the system support capability of the GFM converter and its optimal proportion in the system has not been solved.
In summary, for power grids of varying strengths, a clear consensus has yet to be established regarding the selection of capacity ratios and spatial distribution of grid-connected equipment necessary to ensure the stable operation of new energy grid systems. Moreover, due to the strong coupling between devices in the multi-station system and the difficulty in quantifying the configuration objectives, it is still difficult to theoretically obtain a matching conclusion with high universality in complex scenarios.
Therefore, this paper focuses on the scenario of new energy base access to low short circuit ratio weak power grid, and studies the location and capacity of GFM equipment in multi-new energy station. The innovation lies in the following:
(1)
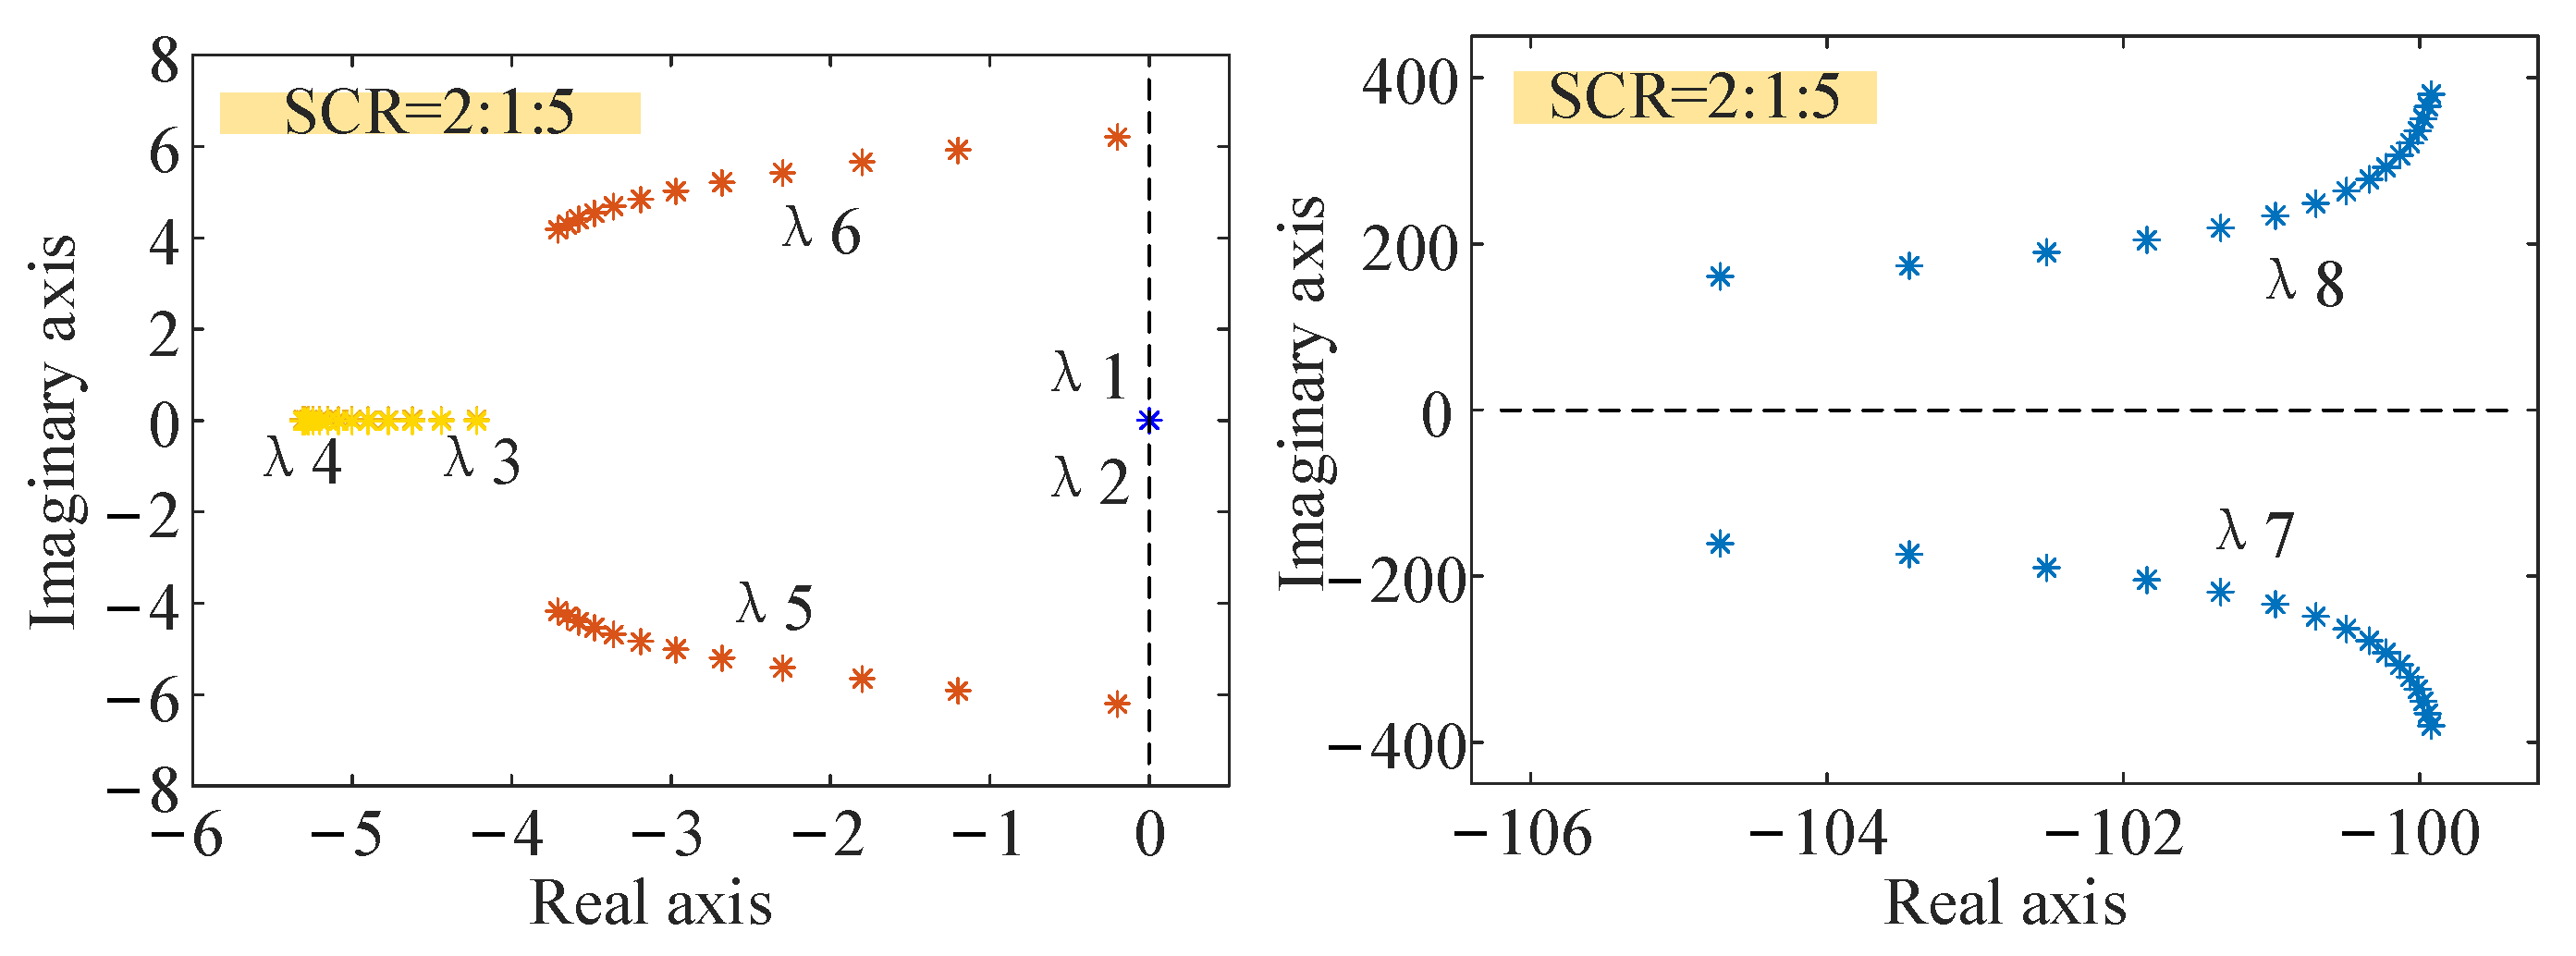
The grid supporting capacity of GFM station is analyzed, and the influence of grid strength on the dominant mode of GFM converter is studied.
(2)
Based on the definition of multi-infeed short circuit ratio, the calculation method of short circuit ratio of new energy base with GFM station is proposed, and the location and capacity strategy of GFM station to improve the short circuit ratio of new energy grid-connected system is further proposed.
(3)
Based on the coupling mechanism between the critical short circuit ratio index and the consumption capacity of the new energy station, the quantitative evaluation of the system support capacity of the GFM converter is realized, and the proposed method of site selection and capacity determination of the GFM equipment can be applied to the actual complex system with high universality.
The rest of this article is organized as follows: the second part analyzes the power grid support capacity of the GFM station. The third part puts forward the calculation method of short circuit ratio of new energy base with GFM station. The fourth part elaborates the strategy of site selection and capacity determination of GFM station and its optimization algorithm to improve the short circuit ratio of new energy grid-connected system. The fifth and sixth parts verify the method proposed in this paper. Finally, the conclusion provides a summary of the full text and the prospect of future work.

2. Analysis of the Grid Support Capacity of GFM Substations

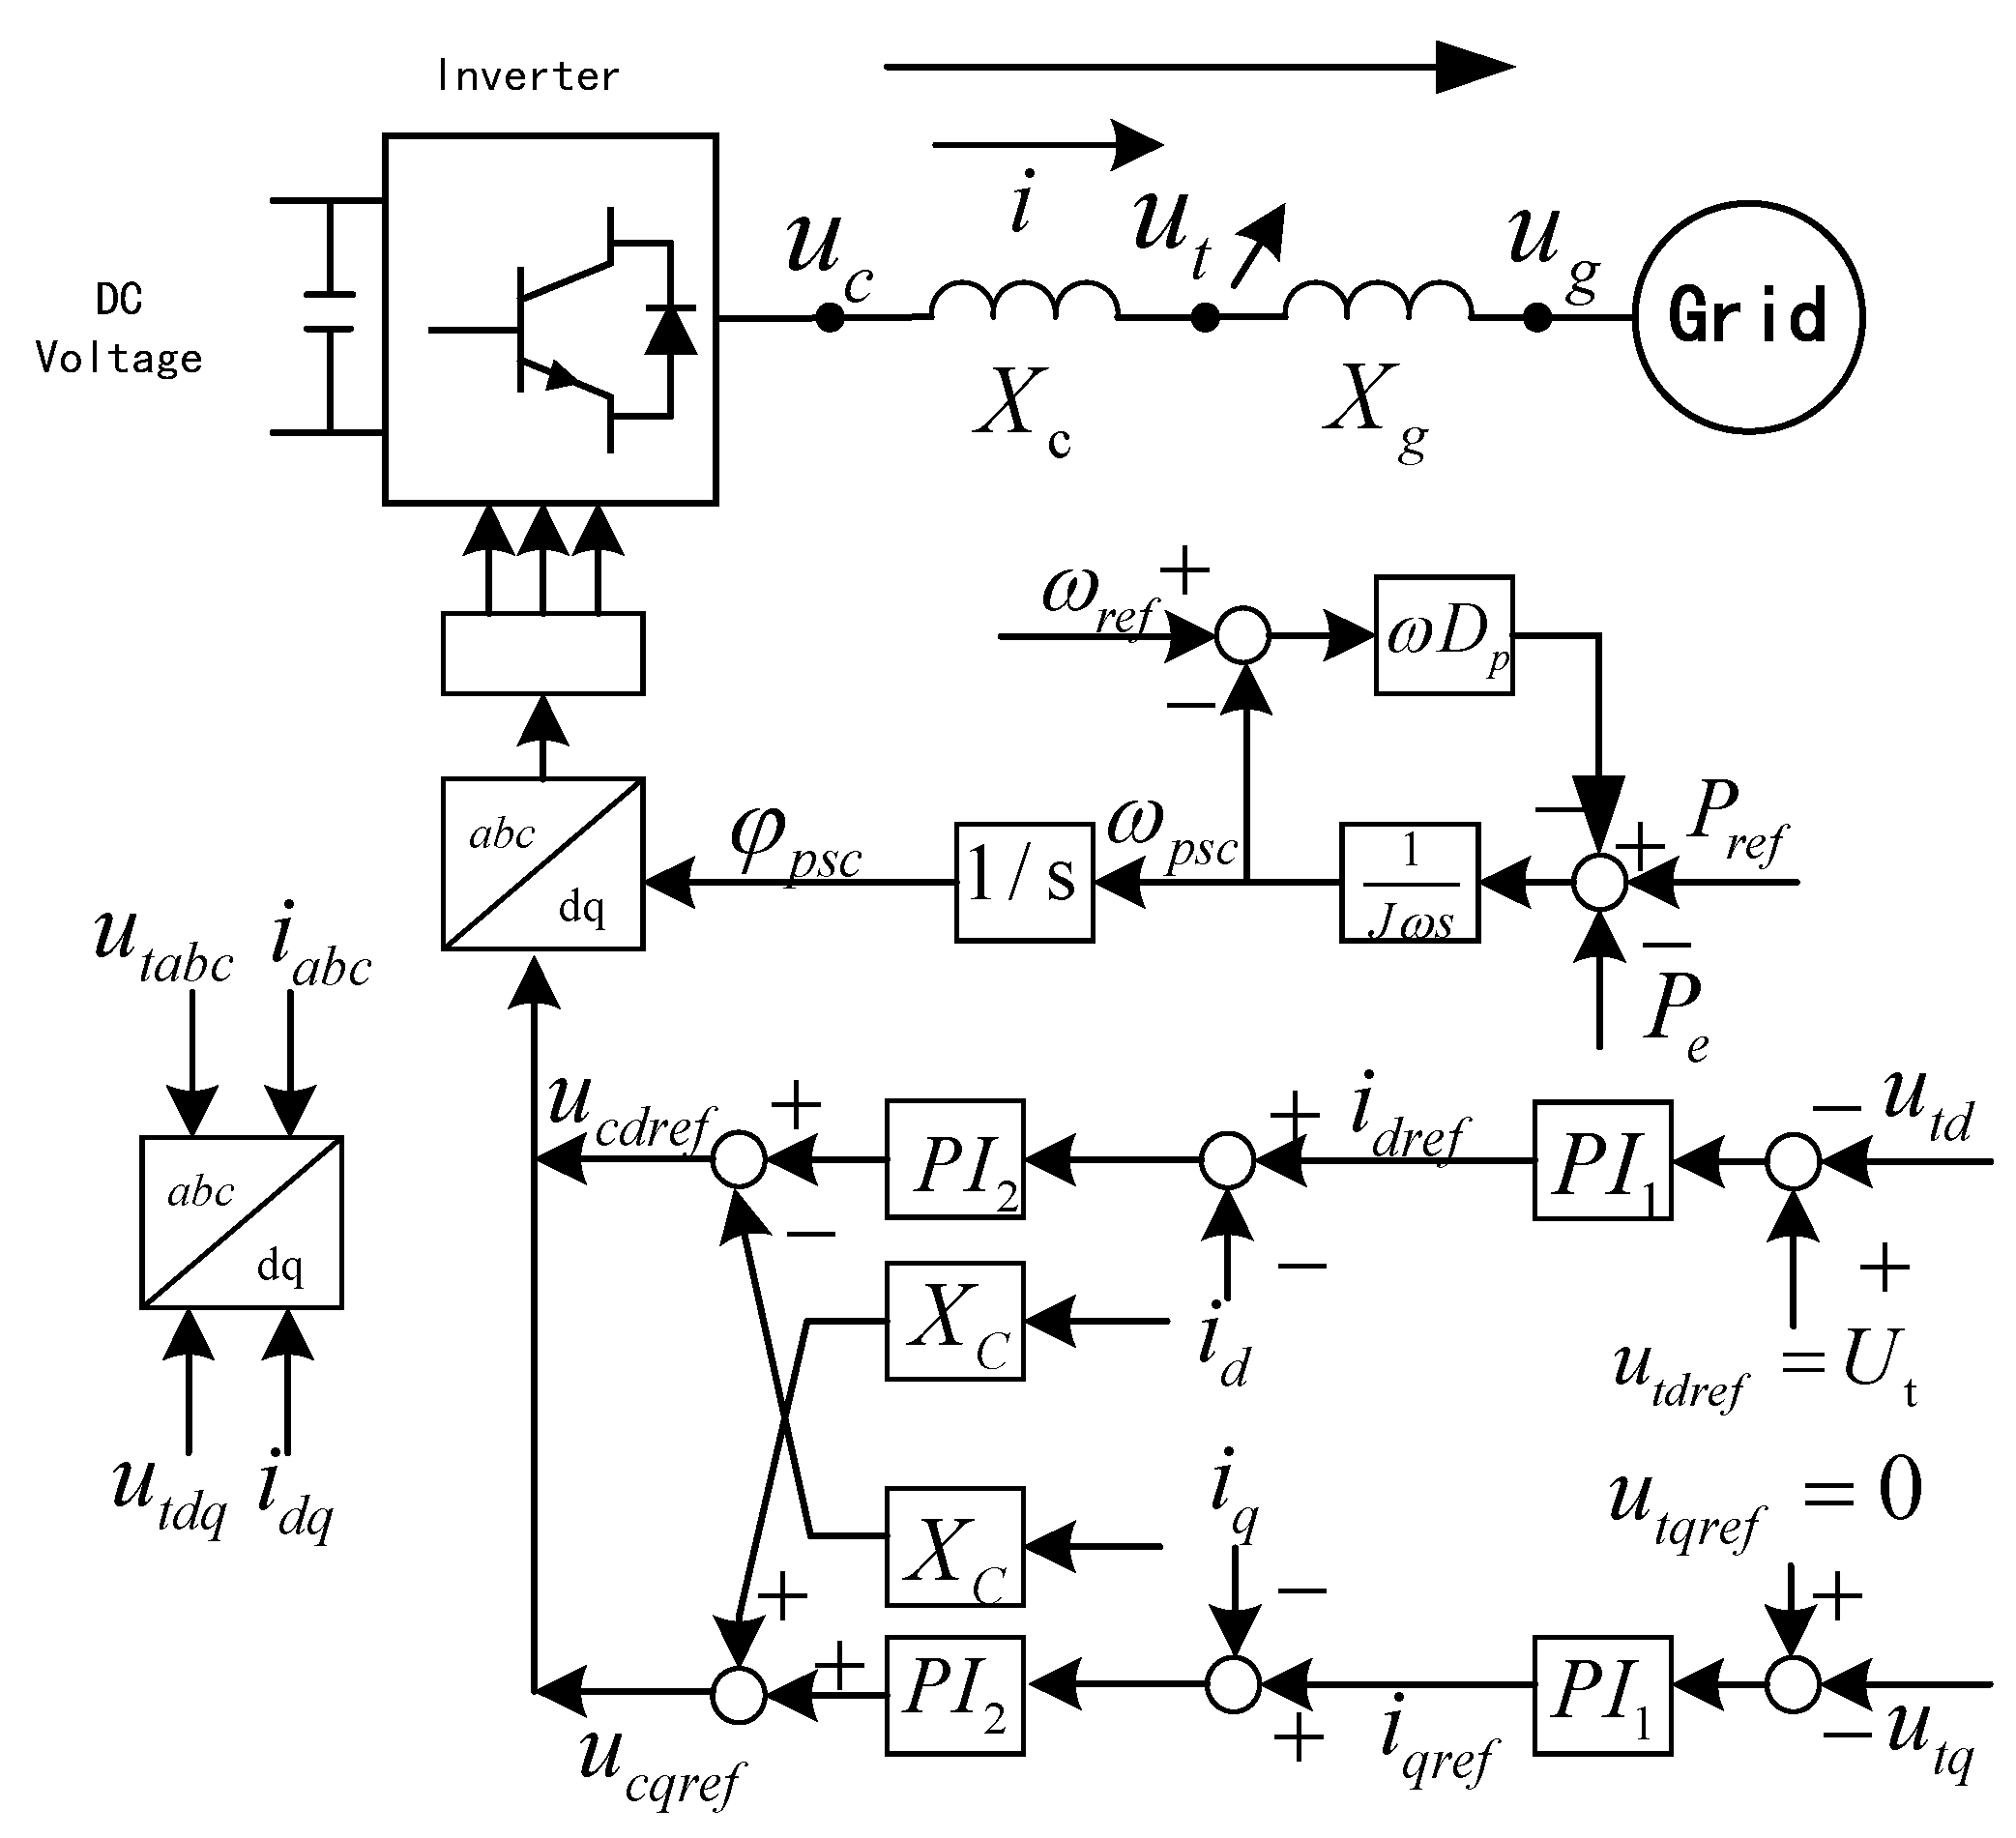
2.1. Control Strategies for GFM Converters

The main circuit configuration and control strategy of the GFM converter examined in this study are illustrated in Figure 1. The direct current (DC) voltage is converted into alternating current uc by the inverter, with the connection point voltage denoted as ut, the grid voltage represented as ug, and the filter impedance and line impedance defined as Xc and Xg, respectively. The control architecture is categorized into a power outer loop and a voltage–current inner loop. The power loop employs virtual synchronous control to emulate the external characteristics of synchronous generators, thereby providing inertia and frequency support for the inverter. Meanwhile, the voltage–current loop utilizes classical dq decoupling control. The reference voltages ucdref and ucqref, derived from the voltage and current inner loops, are generated through Park’s inverse transformation to produce PWM signals that control the inverter output, with the transformation angle corresponding to the power inner loop output angle φpsc.
The mathematical model of the GFM converter system is categorized into a power synchronization loop, a voltage control loop, a current control loop, and transmission lines.
(1)
Power synchronization loop
d φ p s c d t = ω p s c d ω p s c d t = 1 J ω r e f ( P r e f P e + ω r e f D p ( ω r e f ω p s c ) )
In this equation, J denotes the inertia coefficient, Dp signifies the damping coefficient, Pref indicates the specified active power value, and Pe represents the actual feedback active power value, corresponding to the following calculation formula:
P e = u t d i d + u t q i q
In this equation, utd, utq, id, and iq denote the d and q components of the voltage and transmission current at the grid-connected point in the dq coordinate system.
(2)
Transmission line
d i d d t = 1 L c ( u c d u t d ) + ω r e f i q d i q d t = 1 L c ( u c q u t q ) ω r e f i d d i d d t = 1 L g ( u t d u g d ) + ω r e f i q d i q d t = 1 L g ( u t q u g q ) ω r e f i d u g d = U g cos ( φ g ) u g q = U g cos ( φ g )
In this equation, Lc denotes the filter inductance; Lg signifies the line inductance; Ug indicates the amplitude of the grid voltage; ugd and ugq represent the d and q components of the grid voltage, respectively.
(3)
Voltage control loop
i d r e f = ( k p 1 + k i 1 s ) ( u t d r e f u t d ) i q r e f = ( k p 1 + k i 1 s ) ( u t q r e f u t d )
In this equation, kp1 and ki1 denote the PI control parameters for the voltage loop; s represents the Laplace operator; idref and iqref signify the d and q reference values for the transmitted current. Additionally, utdref indicates the d-axis reference value of the terminal voltage, which corresponds to the amplitude of ut; while uqref denotes the q-axis reference value of the terminal voltage, set to 0. To enhance the selection of state variables for stability analysis, Equation (4) is reformulated as follows:
d x 1 d t = k i 1 ( u t d r e f u t d ) d x 2 d t = k i 1 ( u t q r e f u t q ) i d r e f = x 1 + k p 1 ( u t d r e f u t d ) i q r e f = x 2 + k p 1 ( u t q r e f u t q )
In this equation, x1 and x2 represent the chosen state variables of the voltage loop.
(4)
Current control loop
The state variables x3 and x4 are selected, as the dq decoupling terms resulting from the Park transformation exert a negligible influence on control, and the feedforward compensation terms are thus disregarded. Specifically, kp2 and ki2 denote the PI control parameters for the current loop, while ucdref and ucqref represent the dq reference quantities associated with the internal potential of the inverter output.
d x 3 d t = k i 2 ( i d r e f i d ) d x 4 d t = k i 2 ( i q r e f i q ) u c d r e f = x 3 + k p 2 ( i d r e f i d ) u c q r e f = x 4 + k p 2 ( i q r e f i q )

2.2. State Space Model of GFM Converter

By integrating Equations (1)–(6), the mathematical model of the GFM converter system is linearized to derive its small-signal state-space representation as follows:
d Δ X d t = A Δ X
The state space analysis method indicates that the state matrix A governs the small-signal stability of the system, and the defined selected state variables are as follows:
Δ X = [ Δ ω psc , Δ φ psc , Δ x 1 , Δ x 2 , Δ x 3 , Δ x 4 , Δ i d , Δ i q ] T
Consequently, the linearized mathematical models for the power synchronization loop, transmission line, voltage control loop, and current control loop are presented as follows:
(1)
Power synchronization loop
d Δ φ p s c d t = Δ ω p s c d Δ ω p s c d t = 1 J ω r e f ( Δ P e ω r e f D p Δ ω p s c )
Δ P e = u t d Δ i d + Δ u t q i q 0 + Δ u t d i d 0
(2)
Transmission line
d Δ i d d t = 1 L c ( Δ u c d Δ u t d ) + ω r e f Δ i q d Δ i q d t = 1 L c ( Δ u c q Δ u t q ) ω r e f Δ i d
(3)
Voltage control loop
d Δ x 1 d t = k i 1 Δ u t d d Δ x 2 d t = k i 1 Δ u t q
Δ i d = k p 1 u t d + Δ x 1 Δ i q = k p 1 u t q + Δ x 2
(4)
Current control loop
d Δ x 3 d t = k i 2 Δ i d d Δ x 4 d t = k i 2 Δ i q
Δ u c d = Δ x 3 k p 2 Δ i d Δ u c q = Δ x 4 k p 2 Δ i q
Ultimately, the state space matrix A is derived as follows:
D p J Δ φ p s c J ω r e f 0 0 0 0 R 3 J ω r e f R 2 J ω r e f 1 0 0 0 0 0 0 0 0 k i 1 R 2 0 0 0 0 0 k i 1 R 1 0 k i 1 R 3 0 0 0 0 k i 1 R 1 0 0 0 0 0 0 0 k i 2 0 0 0 0 0 0 0 0 k i 2 0 R 2 L c 0 0 1 L c 0 k p 2 L c ω r e f R 1 L c 0 R 3 L c 0 0 0 1 L c ω r e f R 1 L c k p 2 L c
In the equation: R 1 = X g , R 2 = X g i d 0 , R 3 = X g i d 0 + u t d 0 , R 4 = X g ( i q 0 2 i d 0 2 ) + u t d 0 i d 0 .

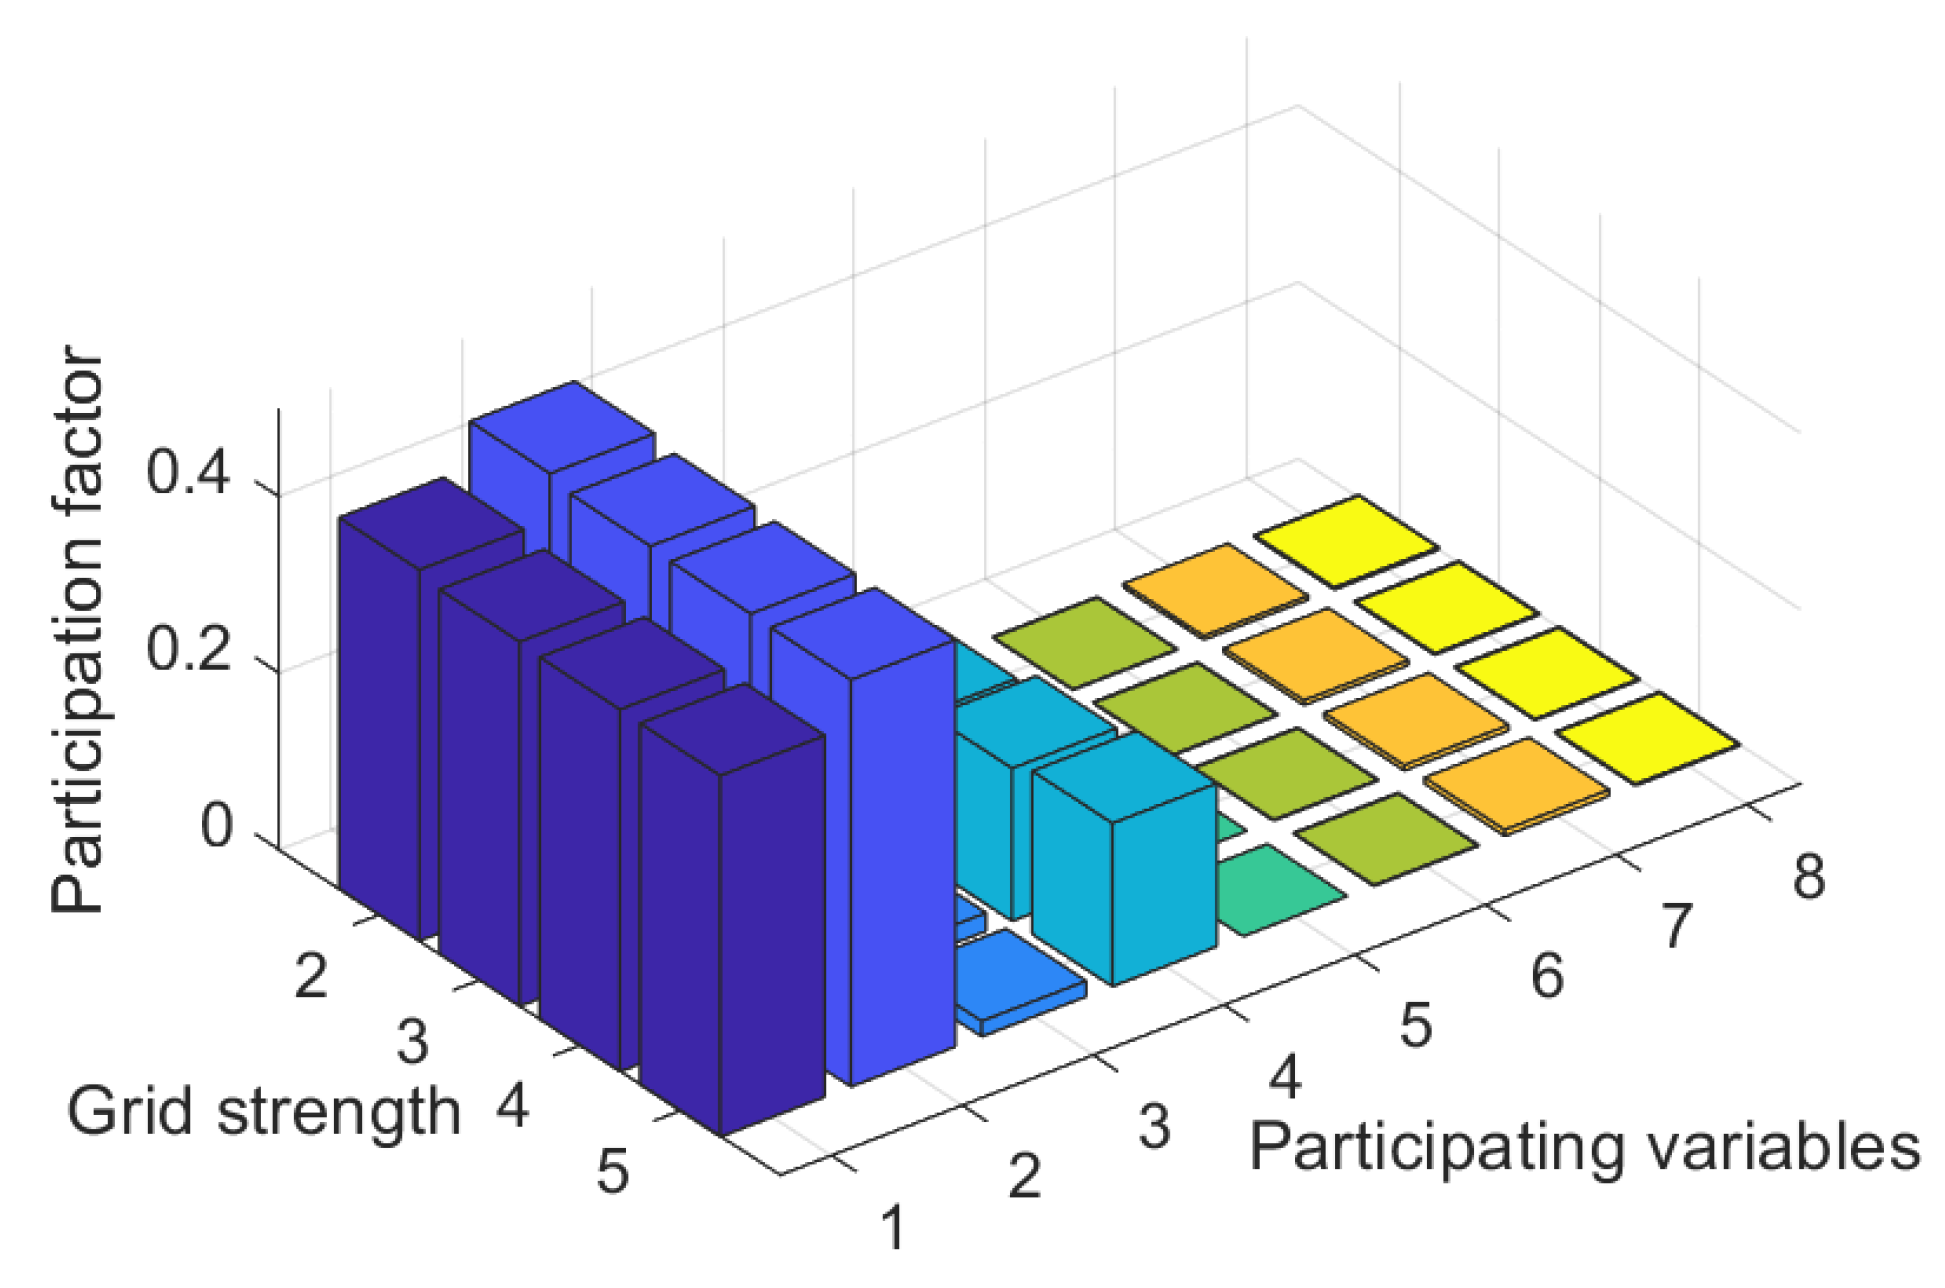
2.3. The Impact of Grid Strength on the Dominant Operational Mode of GFM Converters

In the context of a single-feed grid-connected system, SCR is defined as the ratio of the AC short circuit capacity to the rated capacity of power electronic devices:
S C R = S a c S B = U N 2 S B 1 Z
In this equation, Sac denotes the short circuit capacity of the AC system; SB denotes the rated capacity of the power electronic devices; UN denotes the rated voltage of the busbar; and Z denotes the equivalent reactance of the AC power grid.
Utilizing the time–domain simulation model of the grid-connected system depicted in Figure 1 within Simulink (with specific control parameters for the converter detailed in Table A1 of Appendix A), this study analyzes the impact of grid strength on the stability of networked topology grid-connected systems through participation factors and eigenvalue trajectories. By varying the line inductance parameter Lg, this study examines the impact of grid strength SCR on the characteristic eigenvalues of the GFM converter system. The trend of changes in the system characteristic roots, as the grid strength of the GFM converter increases, is illustrated in Figure 2. As the grid strength increases, characteristic roots λ1 and λ2 remain nearly constant, while real characteristic roots λ3 and λ4 consistently reside in the left half-plane of the complex plane. Meanwhile, the complex conjugate characteristic roots λ7 and λ8 gradually diverge from the imaginary axis. The aforementioned characteristic roots exert a negligible influence on the stability of the system. At this stage, the dominant oscillation modes of the system are λ5 and λ6, which govern the stability and dynamic performance of the system. The system exhibits underdamped characteristics, with these dominant oscillation modes gradually shifting towards the positive half-axis of the real axis, leading to an increasing instability.
A participation factor analysis of the dominant oscillation modes across varying grid strengths was conducted as illustrated in Figure 3 (the identifiers for participating variables are provided in Table A2 of Appendix A). Figure 3 illustrates that the participation degree of the current loop and filter inductor in the dominant oscillation mode is relatively low across different SCR. This suggests that as the SCR varies, both the current loop and filter inductor contribute minimally to the system’s dominant oscillation mode. In contrast, the participation factors of state variables Δωpsc, Δφpsc, and Δx2 associated with the voltage loop and power loop are significantly higher, indicating a substantial contribution from these loops when changes occur in the SCR. Consequently, control mechanisms related to both voltage and power loops play a critical role in maintaining system stability. Moreover, as illustrated in Figure 3, an increase in the SCR leads to a reduction in the participation of the power loop while enhancing the involvement of the voltage loop; however, the state variables of the power loop consistently maintain dominance. The preceding analysis indicates that an increase in the SCR results in a deterioration of system stability, with both voltage and power loop controls playing a pivotal role in maintaining this stability.

3. Methodology for Calculating the SCR in New Energy Base Stations Featuring GFM Substations

3.1. Analysis of Short Circuit Capacity Provided by GFM Sources

Owing to the active and reactive power regulation characteristics of GFM sources, these systems can be effectively modeled as traditional power sources once integrated into the grid, thereby contributing short circuit capacity. The short circuit capacity Sac in an AC power grid is defined as follows:
S a c = U N 2 Z EQ
In this equation, UN denotes the rated voltage, while ZEQ signifies the multi-port Thevenin equivalent impedance.
Let the rms value of the short circuit current be denoted as Ik. Following approximately 0.01 s (half a cycle) at a power frequency of 50 Hz, both the periodic and direct current components of the short circuit current will attain their maximum values, referred to as the short circuit impulse current ish. In this study, the relationship between these two quantities is expressed as ish = 2.55 Ik. The expression for short circuit capacity is presented as follows:
S a c = 3 U N I k = 3 2.55 U N i sh
Given the known value of the short circuit impulse current ish, the short circuit capacity at the system node Sac is determined.

3.2. Definition of the SCR for Multi-Site Renewable Energy Systems

In high-proportion renewable energy power systems, multiple new energy stations are frequently interconnected simultaneously [27]. Ref. [28] employs the multi-port Thevenin method to simplify the AC system model, yielding a mathematical expression for the multi-station SCR at node i of the renewable energy station, defined as NMRSCR.
N MRSCR = S a c i S EQ i = U i U Ni / Z EQ i i U i I i + j = 1 , j i n Z EQ i j / Z EQ i i U i I j = U i U Ni / Z EQ i i S RE i + j = 1 , j i n U i Z EQ i j / U j Z EQ i i S RE j
In the equation, Saci, Ui, UNi, and Ii denote the short circuit capacity, operating voltage, rated voltage, and injected grid current of node i, respectively. SEQi signifies the equivalent apparent power at node i following feedback from other renewable energy stations, while SREi represents the apparent power of renewable energy injected into node i. ZEQii and ZEQij correspond to the self-impedance and mutual impedance of their respective nodes within the grid-side equivalent impedance matrix ZEQ.
In general, when the reactance exceeds the resistance, Equation (20) can be simplified as follows:
N MRSCR = U i 2 / Z EQ i i P RE i + j = 1 , j i n U i Z EQ i j / U j Z EQ i i P RE j
In the equation, PREi denotes the active power of renewable energy injected into node i.
Taking Ui as the reference voltage and the rated capacity of node j as the reference power, Equation (21) can be expressed in a simplified form as:
N MRSCR = 1 Z i i P i + j = 1 , j i n Z i j P j
In the equation, Pi, Pj, Zii, and Zij denote the per-unit values of PREi, PREj, ZEQii, and ZEQij, respectively.

3.3. The Mechanism of Enhancing Voltage Stability in Power Systems Through GFM Converters

From Equations (19) and (20), it is evident that the grid-connected power supply can be treated as an equivalent to a conventional power supply, contributing short circuit capacity to the grid system and thereby influencing the SCR while simultaneously altering the system’s equivalent impedance matrix. The analysis presented in the second section indicates that the voltage and power loop control strategies are essential for maintaining system stability. Upon the integration of the GFM source, it can be represented as a parallel branch to ground at node m within the grid connection point. Consequently, following this integration, the equivalent impedance matrix ZEQ is transformed into the equivalent node impedance matrix, expressed as follows:
Z EQ = Z EQ Z m T Z m Z EQ m m + z 0
In the equation, Z m T denotes the transpose of Zm, which represents the m row vector of the equivalent impedance matrix ZEQ, while z0 signifies the equivalent impedance of the GFM converter.
Upon expanding Z EQ , the expression for any element of Z EQ is presented as follows:
Z EQ i j = Z EQ i j Z EQm i Z EQm j Z EQ m m + z 0
Following the integration of the gGFM system, all elements within the equivalent impedance matrix ZEQ will experience a reduction, with the self-impedance ZEQmm at connection point m exhibiting the most significant decrease.
Assuming Ui = Uj, where Ui and Uj represent the voltages at the new energy substations, and given that the phase angles of these voltages are equal, Equation (21) can be expressed as follows:
N MRSCR = U N i 2 Z EQ i i P RE i + j = 1 , j i n Z EQ i j P RE j = U N i 2 j = 1 n Z EQ i j P RE j
By substituting Z EQ into equation (25), the expression for the multi-site SCR at grid-connected node i, corresponding to the i renewable energy plant, is reformulated as follows:
N MRSCR = U N i 2 j = 1 n Z EQ i j P RE j Z EQ 1 i Z EQ 11 z 0 j = 1 n Z EQ 1 j P RE j
It is evident from the preceding equation that the GFM source system exhibits an N MRSCR value that exceeds that of the NMRSCR.

4. Optimization Strategy for the Siting and Sizing of GFM Stations to Improve SCR of New Energy Integration System

The preceding analysis indicates that the installation location and capacity of GFM devices yield differing impacts on the enhancement of the system’s SCR. Additionally, Ref. [29] established a relationship between the capacity for new energy absorption and the SCR index, deriving the maximum absorption capacity of new energy at each integration point under the constraint of critical short circuit ratio. Consequently, a model can be formulated to optimally configure GFM converters with the objectives of maximizing new energy absorption while minimizing the total capacity of GFM equipment. This study employs a dual-layer optimization model. In the inner layer, the objective is to maximize the output of each new energy power station while adhering to short circuit ratio constraints that define their maximum output limits. Building upon this, the outer layer aims to minimize the configuration capacity of GFM equipment. The actual output of each new energy power station is calculated as the difference between its actual output and its maximum limit. The outer layer subsequently assesses the configuration capacity of GFM equipment, with mutual constraints established between both layers through iterative calculations, ultimately leading to an optimal solution.

4.1. Outer Layer Model

In the outer model, the objective is to minimize the configuration capacity of GFM devices while incorporating a penalty term for the new energy curtailment rate resulting from short circuit ratio constraints at each new energy station into the objective function. The specific expression is as follows:
min F Δ P ex = i = 1 N GFM u i GFM S i GFM + n = 1 N GFM Δ P n Δ P n = 10 8 , t = 1 T max ( P n , t new P n GFMmax , 0 ) > 5 % t = 1 T P n , t new 0 , t = 1 T max ( P n , t new P n GFMmax , 0 ) 5 % t = 1 T P n , t new n = 1 , N GFM
In the equation, F Δ P ex denotes the penalty function, while ΔP signifies the penalty term. u i GFM and S i GFM represent the location and capacity of the networked equipment, respectively; P n , t new represents the active power output of each new energy plant at time t; P n GFMmax represents the maximum active power output of each new energy plant under the short circuit ratio constraint, which is calculated by the inner model; NGFM represents the number of new energy plants, and T represents the total number of new energy output hours.

4.2. Inner Layer Model

In the inner model, to enhance the power dispatch capability of the new energy cluster system, the maximum output of each new energy plant is established as the objective. The maximum output limit for each new energy plant under short circuit ratio constraints is then determined and subsequently incorporated into the outer model. In the outer model, based on predefined installation locations and capacities of GFM equipment, the inner model iteratively adjusts these parameters through short circuit ratio constraints to derive optimal installation locations and capacities. The specific expression is as follows:
max F in = i = 1 N P i GFMmax
S ac i P i + j = 1 , j i n Z i j GFM Z i i GFM P j 1.5
S ac i = 1 Z i i GFM = 1 f ( u i GFM , z i GFM , Z i )
0 P i GFMmax P i M
In the equation, Fin denotes the objective function of the inner model; the function f quantifies the influence of various GFM device configurations on the system impedance matrix; P i M signifies the installed capacity of renewable energy station i; Z i j GFM and Z i i GFM represent the mutual and self-impedance of the system under different GFM device configurations, respectively; P i GFMmax indicates the maximum active power output of renewable energy station i constrained by short circuit ratio limits.

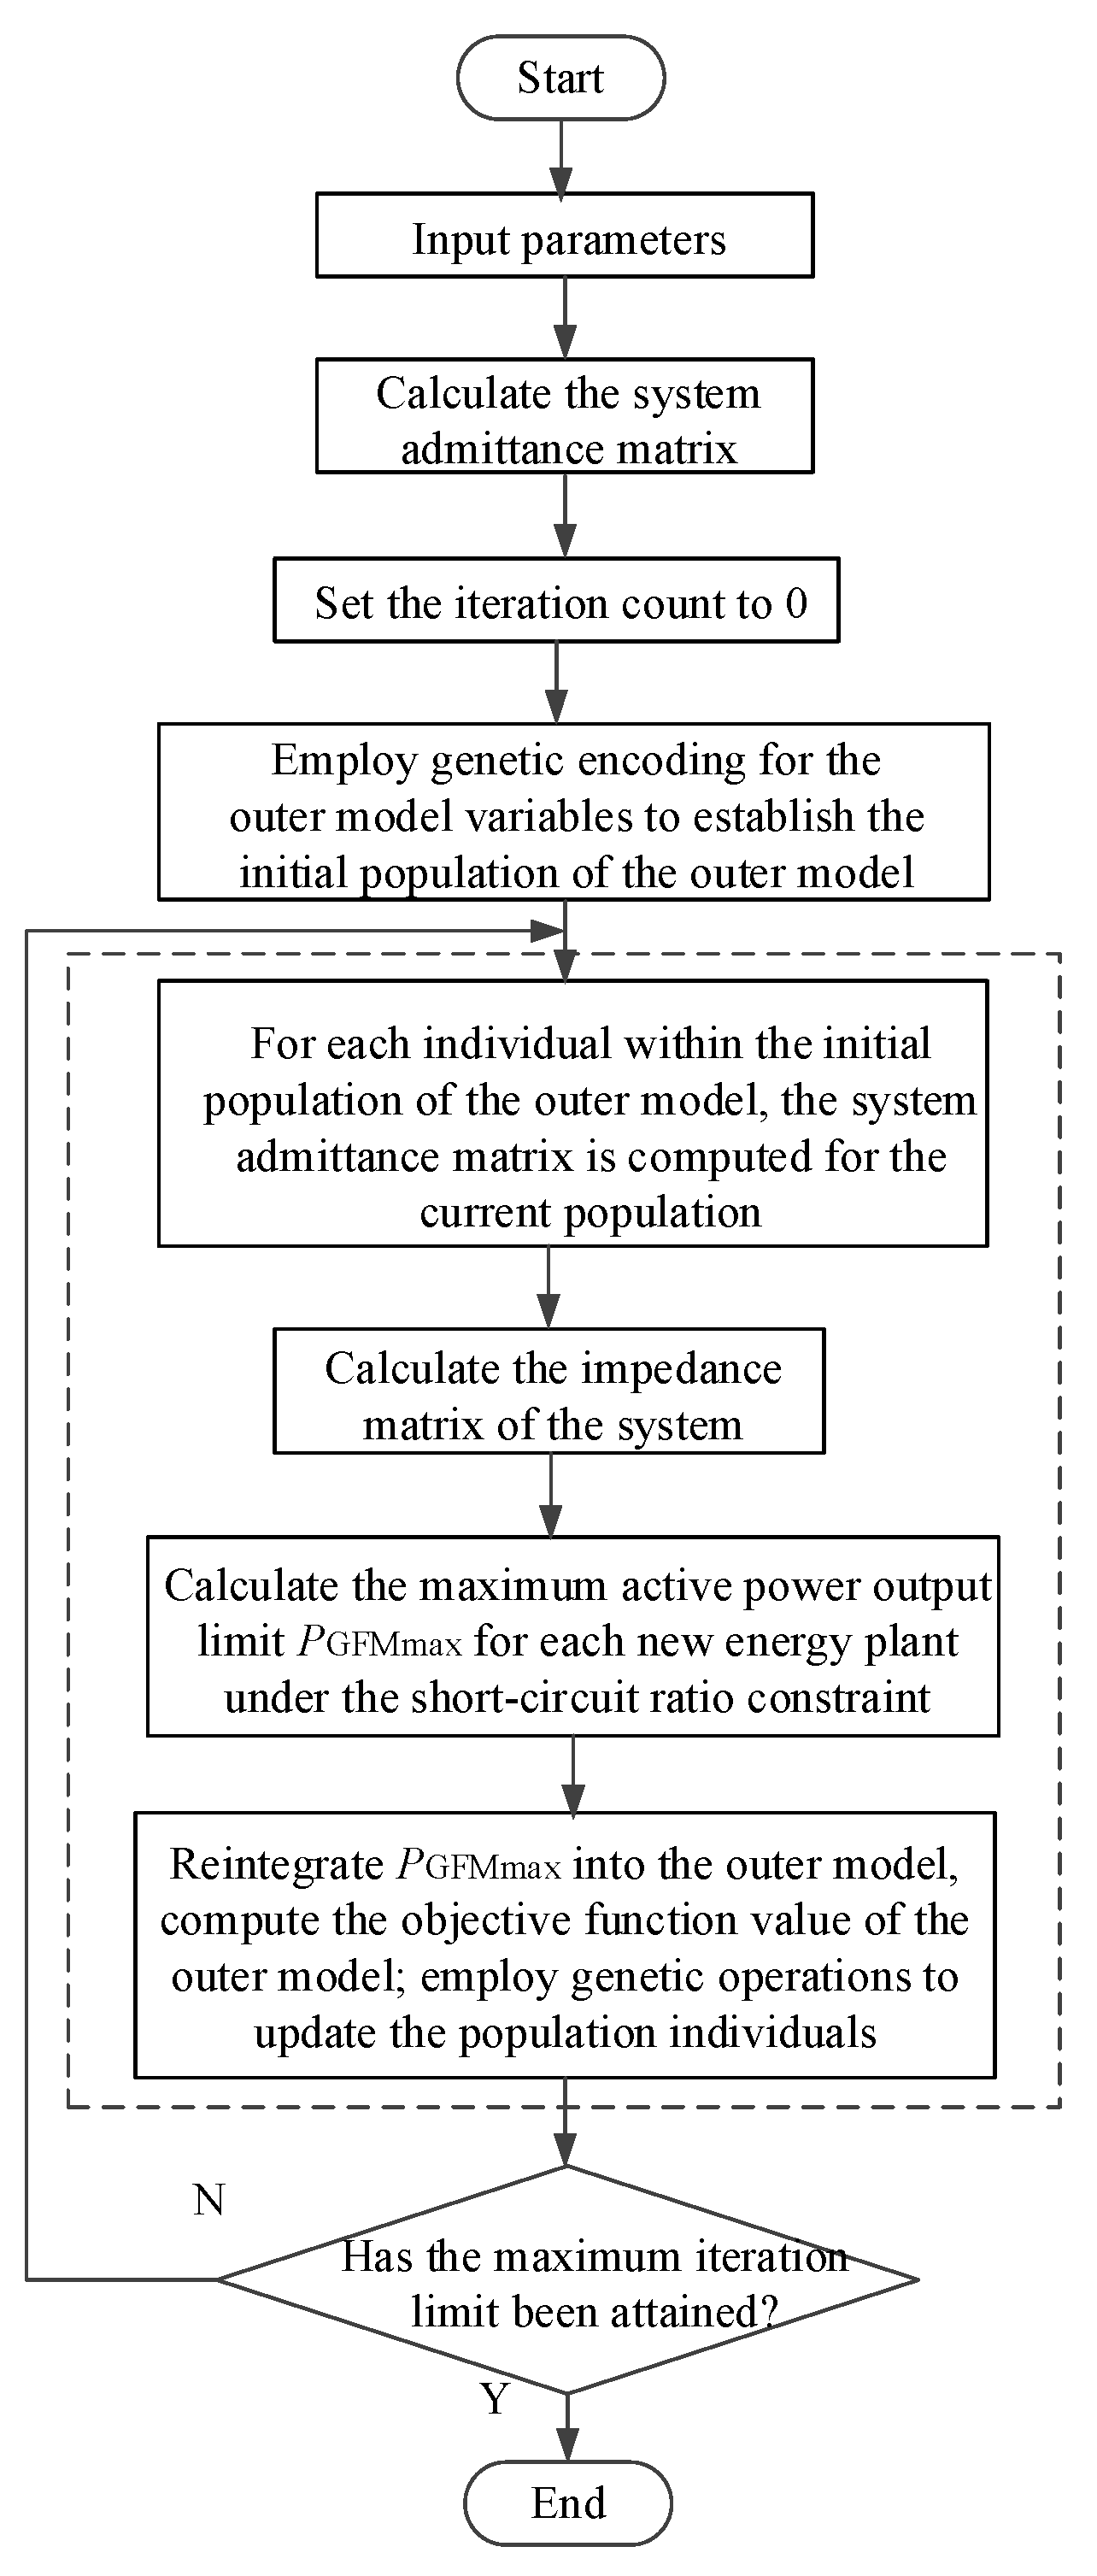
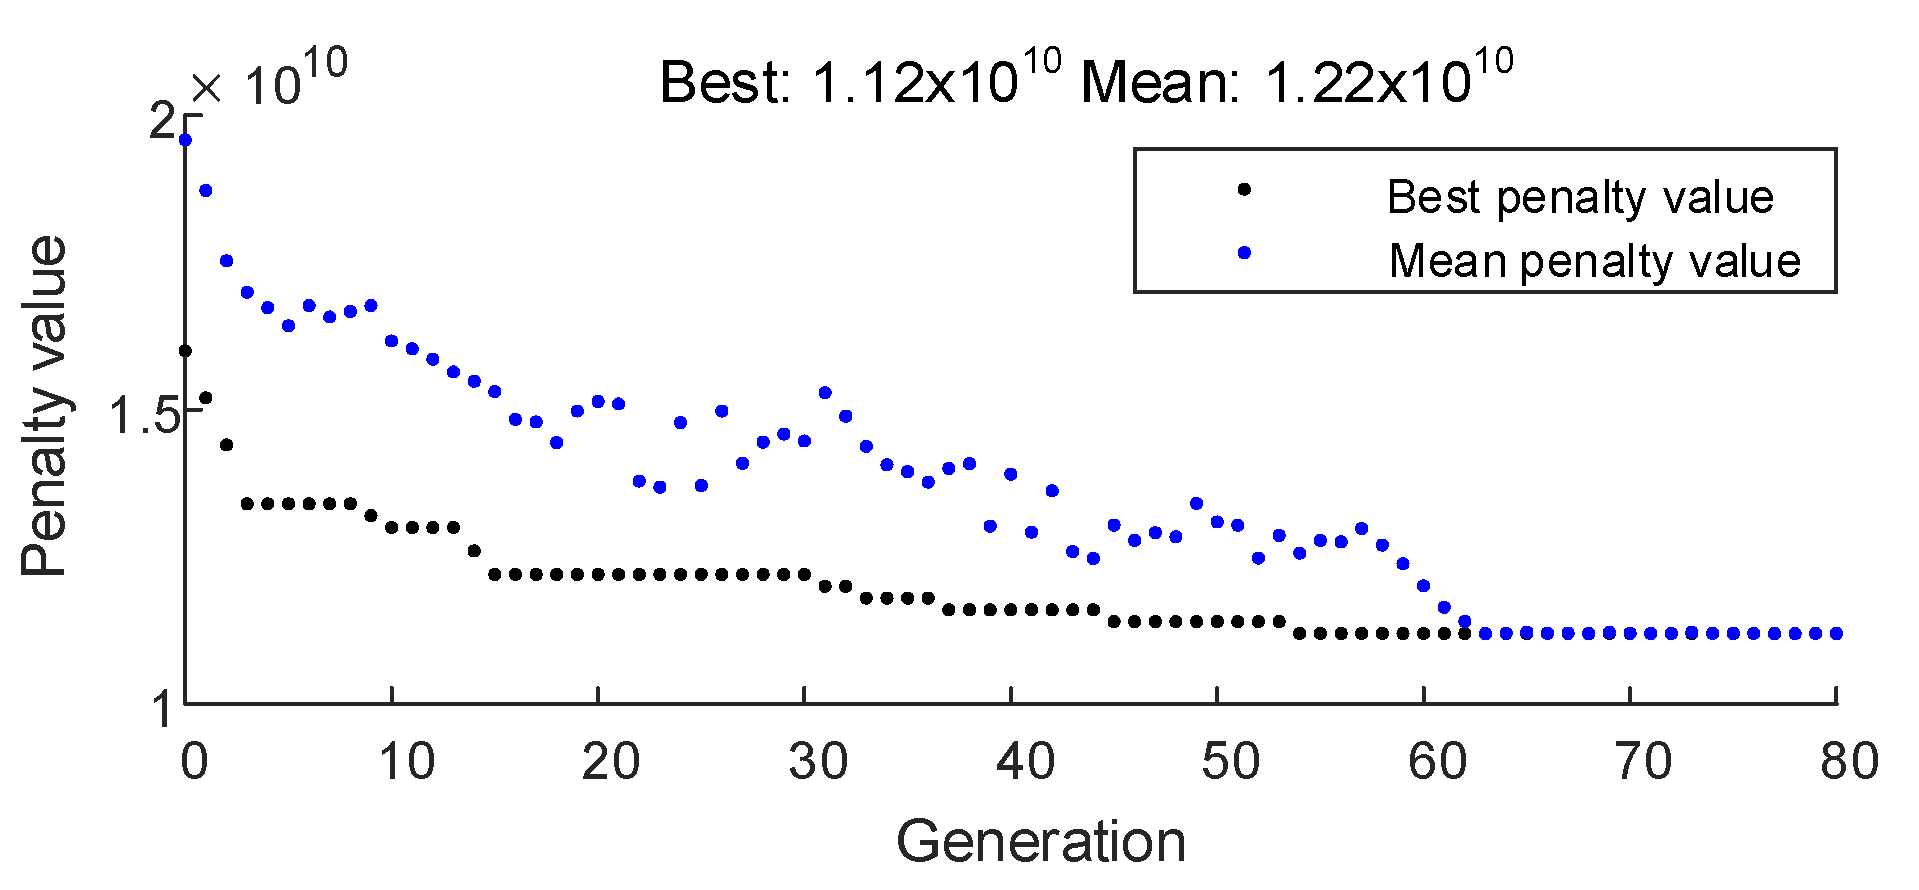
4.3. Model Solving Algorithm

In the outer model presented in this paper, the capacity of each GFM device is established at 50 MW. Consequently, the variable to be determined is the number of GFM devices installed at each node within the system, which constitutes a discrete variable and falls under mixed-integer programming. This problem can be addressed using a genetic algorithm. The structure of the chromosome is defined as follows:
X = [ u 1 GFM u N GFM GFM ]
In the equation, u i GFM represent the number of GFM devices installed at different nodes in the system, which are encoded using integer values.
In the inner model, the optimization variables encompass the maximum active power output limits P i GFMmax of each renewable energy station and the number of GFM devices installed at various nodes within the system, as specified in the outer model and represented by Equation (29). The short circuit ratio constraint is nonlinear; therefore, the inner model constitutes a mixed-integer nonlinear optimization problem. However, given that the number of GFM devices installed at various nodes in the outer layer model is represented as a variable within the genetic algorithm framework, the computation of the short circuit ratio at new energy nodes under different configurations of GFM devices constitutes a numerical calculation process that does not involve nonlinear operations on decision variables. Consequently, the inner layer model can be effectively solved using the CPLEX solver (v12.9.0) in Matlab R2024a. The detailed algorithmic flow is illustrated in Figure 4.

5. Simulation Verification–IEEE39 System

5.1. Parameter Settings of IEEE39 System

This study is conducted within the MATLAB environment, utilizing the CPLEX solver for the inner layer model’s optimization. The analysis is performed on the modified IEEE-39 system depicted in Figure 5, where nodes 30 to 35 and 37 to 39 serve as feed-in points for grid-following converters. The corresponding installed capacities of renewable energy sources at these nodes are 565 MW, 350 MW, 400 MW, 360 MW, 270 MW, 375 MW, 305 MW, 475 MW and 600 MW respectively. Node 36 functions as an infinite node while the remaining nodes act as intermediate passive nodes.
Based on the modified IEEE39 system, the installed capacity of each renewable energy power station is established, with the output set to 80% of this capacity. The SCR for each new energy power station is calculated and presented in Figure 6. As illustrated in Figure 6, under the 100% renewable energy scenario, the SCR of the renewable energy power stations within the simulation experiment system are predominantly concentrated below 1.0. The lowest short circuit ratio for the entire network is recorded at 0.3383, which falls below the critical threshold of 1.5. Consequently, it is imperative to enhance system robustness through optimized configuration of GFM equipment.
The parameters of the outer genetic algorithm are set as shown in Table 1.
Among them, npop is the population size of genetic algorithm; ngen is the evolution algebra of genetic algorithm; pc1 and Pc2 are the minimum and maximum crossover probabilities, respectively. Pm1 and Pm2 are the minimum and maximum mutation probabilities, respectively.

5.2. Analysis for Simulation Result 1

In the context of the 100% renewable energy system illustrated in Figure 5, the optimal configuration of GFM converters is implemented based on the configuration methodology proposed in this study. Figure 7 illustrates the iterative process of the genetic algorithm, indicating that the objective function value associated with the ’investment cost of GFM converters + penalty for curtailment of renewable energy’ gradually decreases during the optimization procedure. Consequently, this objective function value converges at the configuration result of the GFM equipment corresponding to the maximum iteration count, which represents the optimal solution. In addition, it should be noted that as the population size and the number of iterations increase, the results obtained by the genetic algorithm are more accurate, but the solution time also increases exponentially. Considering the accuracy of the optimal configuration results and the speed of the algorithm, the optimal number of iterations of the genetic algorithm in this paper is 80. As illustrated in Figure 8, the configuration results for the GFM equipment indicate that the total capacity of this configuration is 2200 MW. The distribution of installation locations for the GFM equipment is also depicted in Figure 8. Under constraints related to grid strength, each renewable energy power station can achieve a maximum absorption capacity reaching 95% of its theoretical limit as defined by the proposed configuration scheme. Thus, the GFM converter configuration method presented herein effectively balances system grid strength with the objective of large-scale dispatch and integration of clustered renewable energy sources. The short circuit ratios and the maximum absorption capacities of each renewable energy grid interconnection point, both before and after the configuration of the GFM converter, are presented in Figure 9 and Figure 10, respectively.

6. Simulation Verification—An Actual New Energy Station

6.1. Parameter Settings of the Actual New Energy Station

In this section, based on the actual scenario of a new energy cluster, the optimization configuration of the grid converter to promote the consumption of the new energy cluster is studied. The new energy convergence area has 70 new energy stations, with a total installed capacity of about 6500 MW. According to the output of each new energy station in the region at a certain time, the short circuit ratio of each new energy station is calculated as shown in Figure 11. As can be seen from Figure 11, the short circuit ratio of the new energy power station in the simulation test system is mainly distributed below 1.5, which is a system with a low short circuit ratio. Therefore, it is necessary to carry out research on the optimal configuration of GFM converters to promote the consumption of new energy clusters, and improve the system strength of each new energy station.
The parameters of the outer genetic algorithm are set as shown in Table 2.

6.2. Analysis for Simulation Result 2

The configuration results of the GFM equipment show that the total capacity of the GFM equipment is 3900 MW. Under this configuration scheme, there are as many as 65 new energy sites that meet the maximum allowable space of each new energy station under the constraint of power grid strength and reach 95% of the theoretical maximum allowable space of each new energy station. Therefore, the proposed network equipment configuration method can effectively take into account the strength of the system grid and the target of large-scale consumption of cluster new energy. Before and after the configuration of the GFM equipment, the short circuit comparison of each new energy connection point is shown in Figure 12. Due to limited space, only the comparison results of some new energy stations in this network equipment configuration scheme are shown, as seen in Table 3.
In addition, it is necessary to compare and explain that compared with the IEEE39 node system, the actual power grid system structure is more complex and the number of network nodes is larger. The optimization solution results show that the solution time required for the actual complex system is 10 min, while the IEEE39 node system only needs 1 min.

7. Conclusions

In addressing the challenge of selecting optimal locations and determining the capacities of GFM converters within low short circuit ratio weak grids for new energy base stations, a method based on genetic algorithms has been proposed for converter selection and capacity determination. The primary conclusions are as follows:
(1)
From the perspective of grid strength, the multi-station SCR index was employed to validate the contribution of GFM converters to system stability enhancement. Furthermore, a participation factor analysis was performed based on dominant oscillation modes under varying grid strengths, revealing that voltage and power loop controls are critical for maintaining system stability as the short circuit ratio fluctuates.
(2)
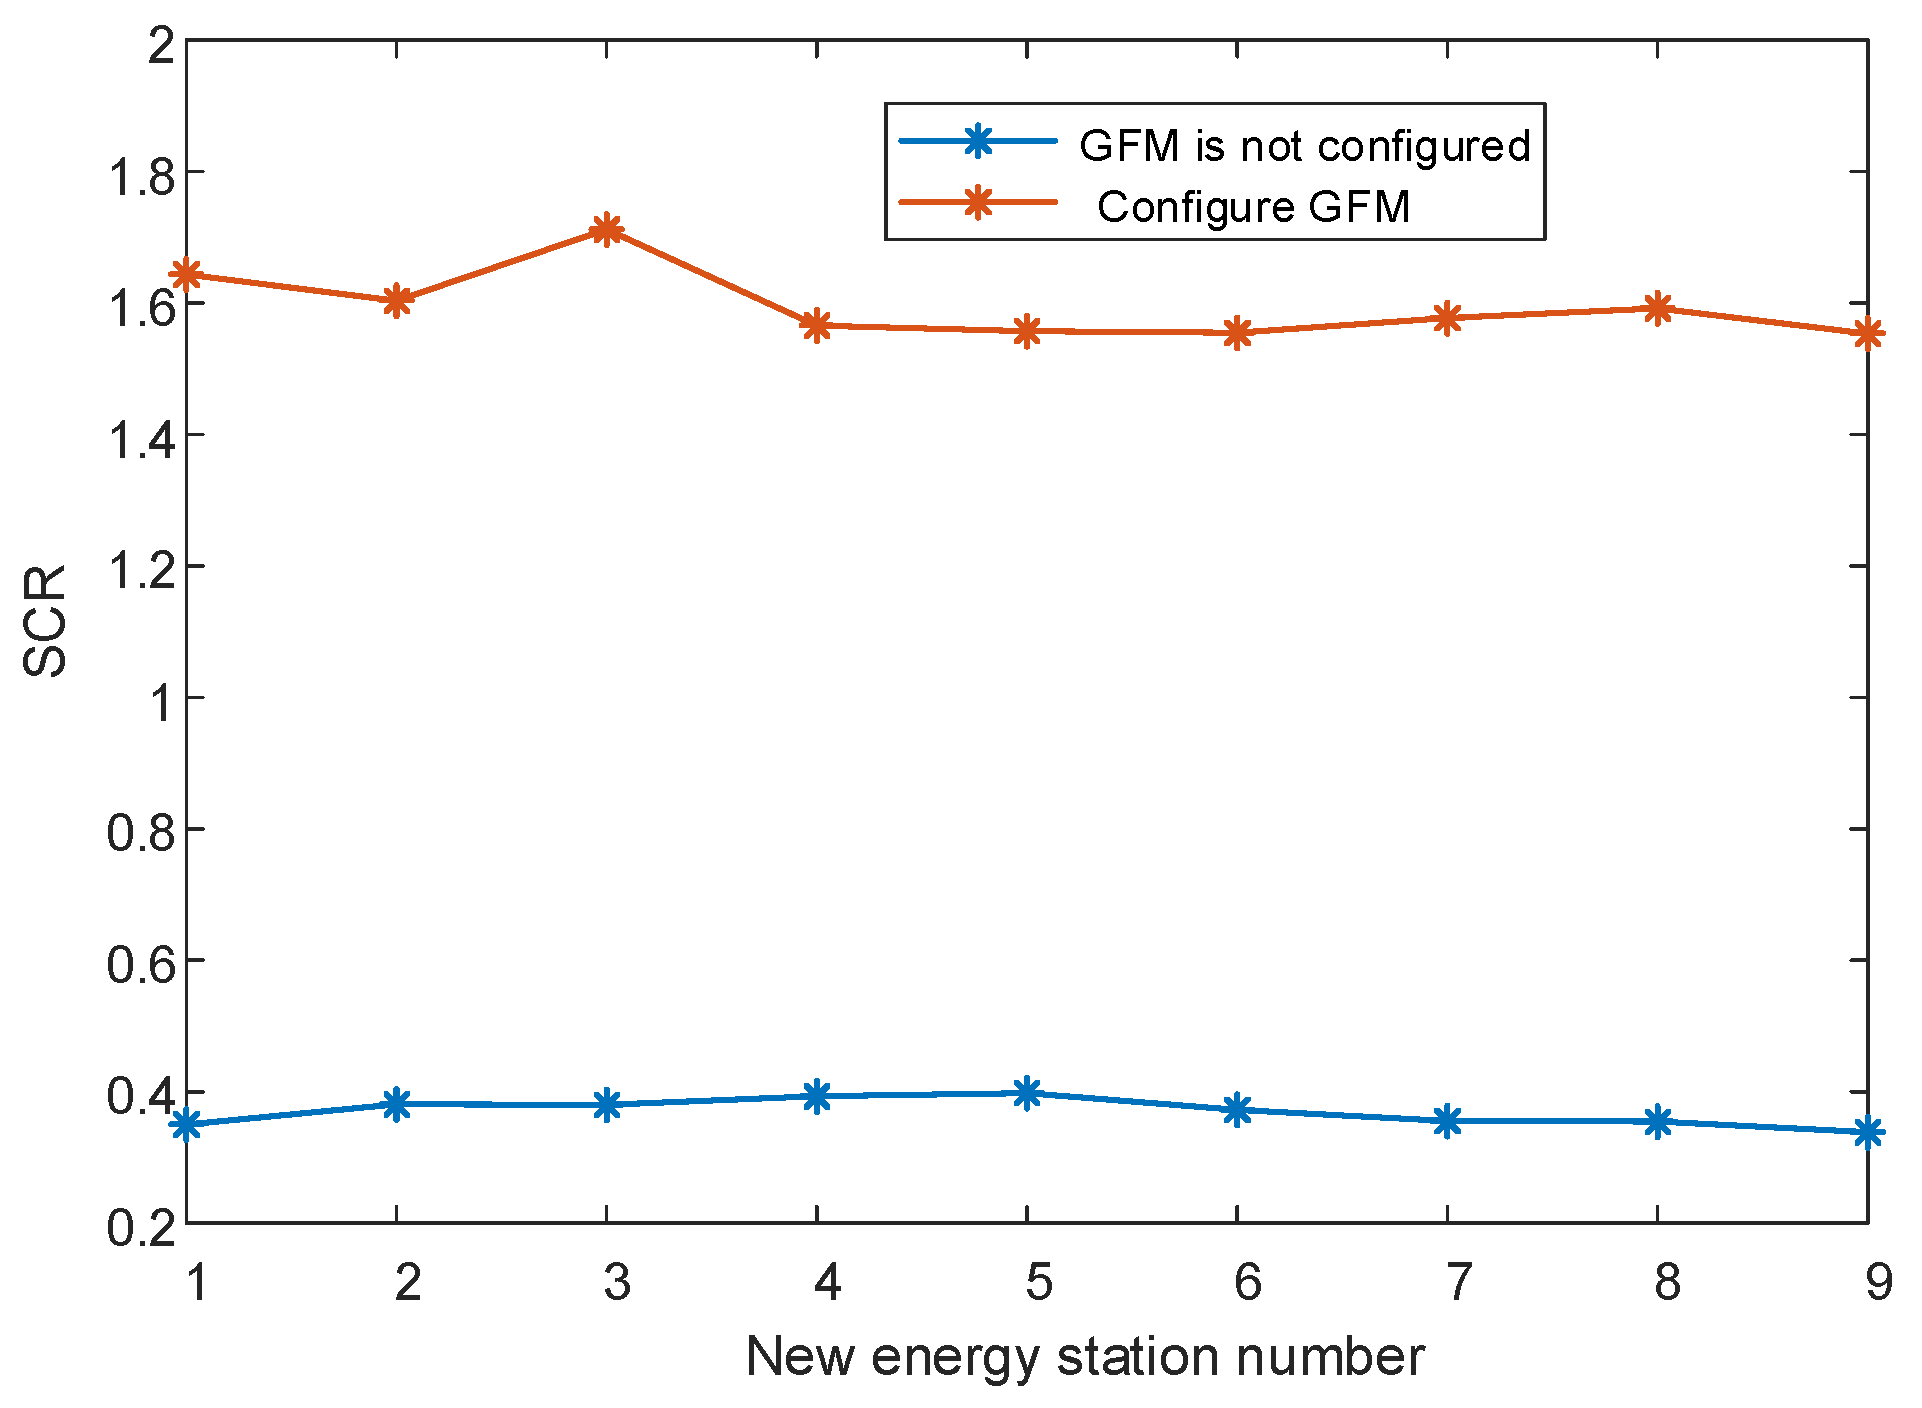
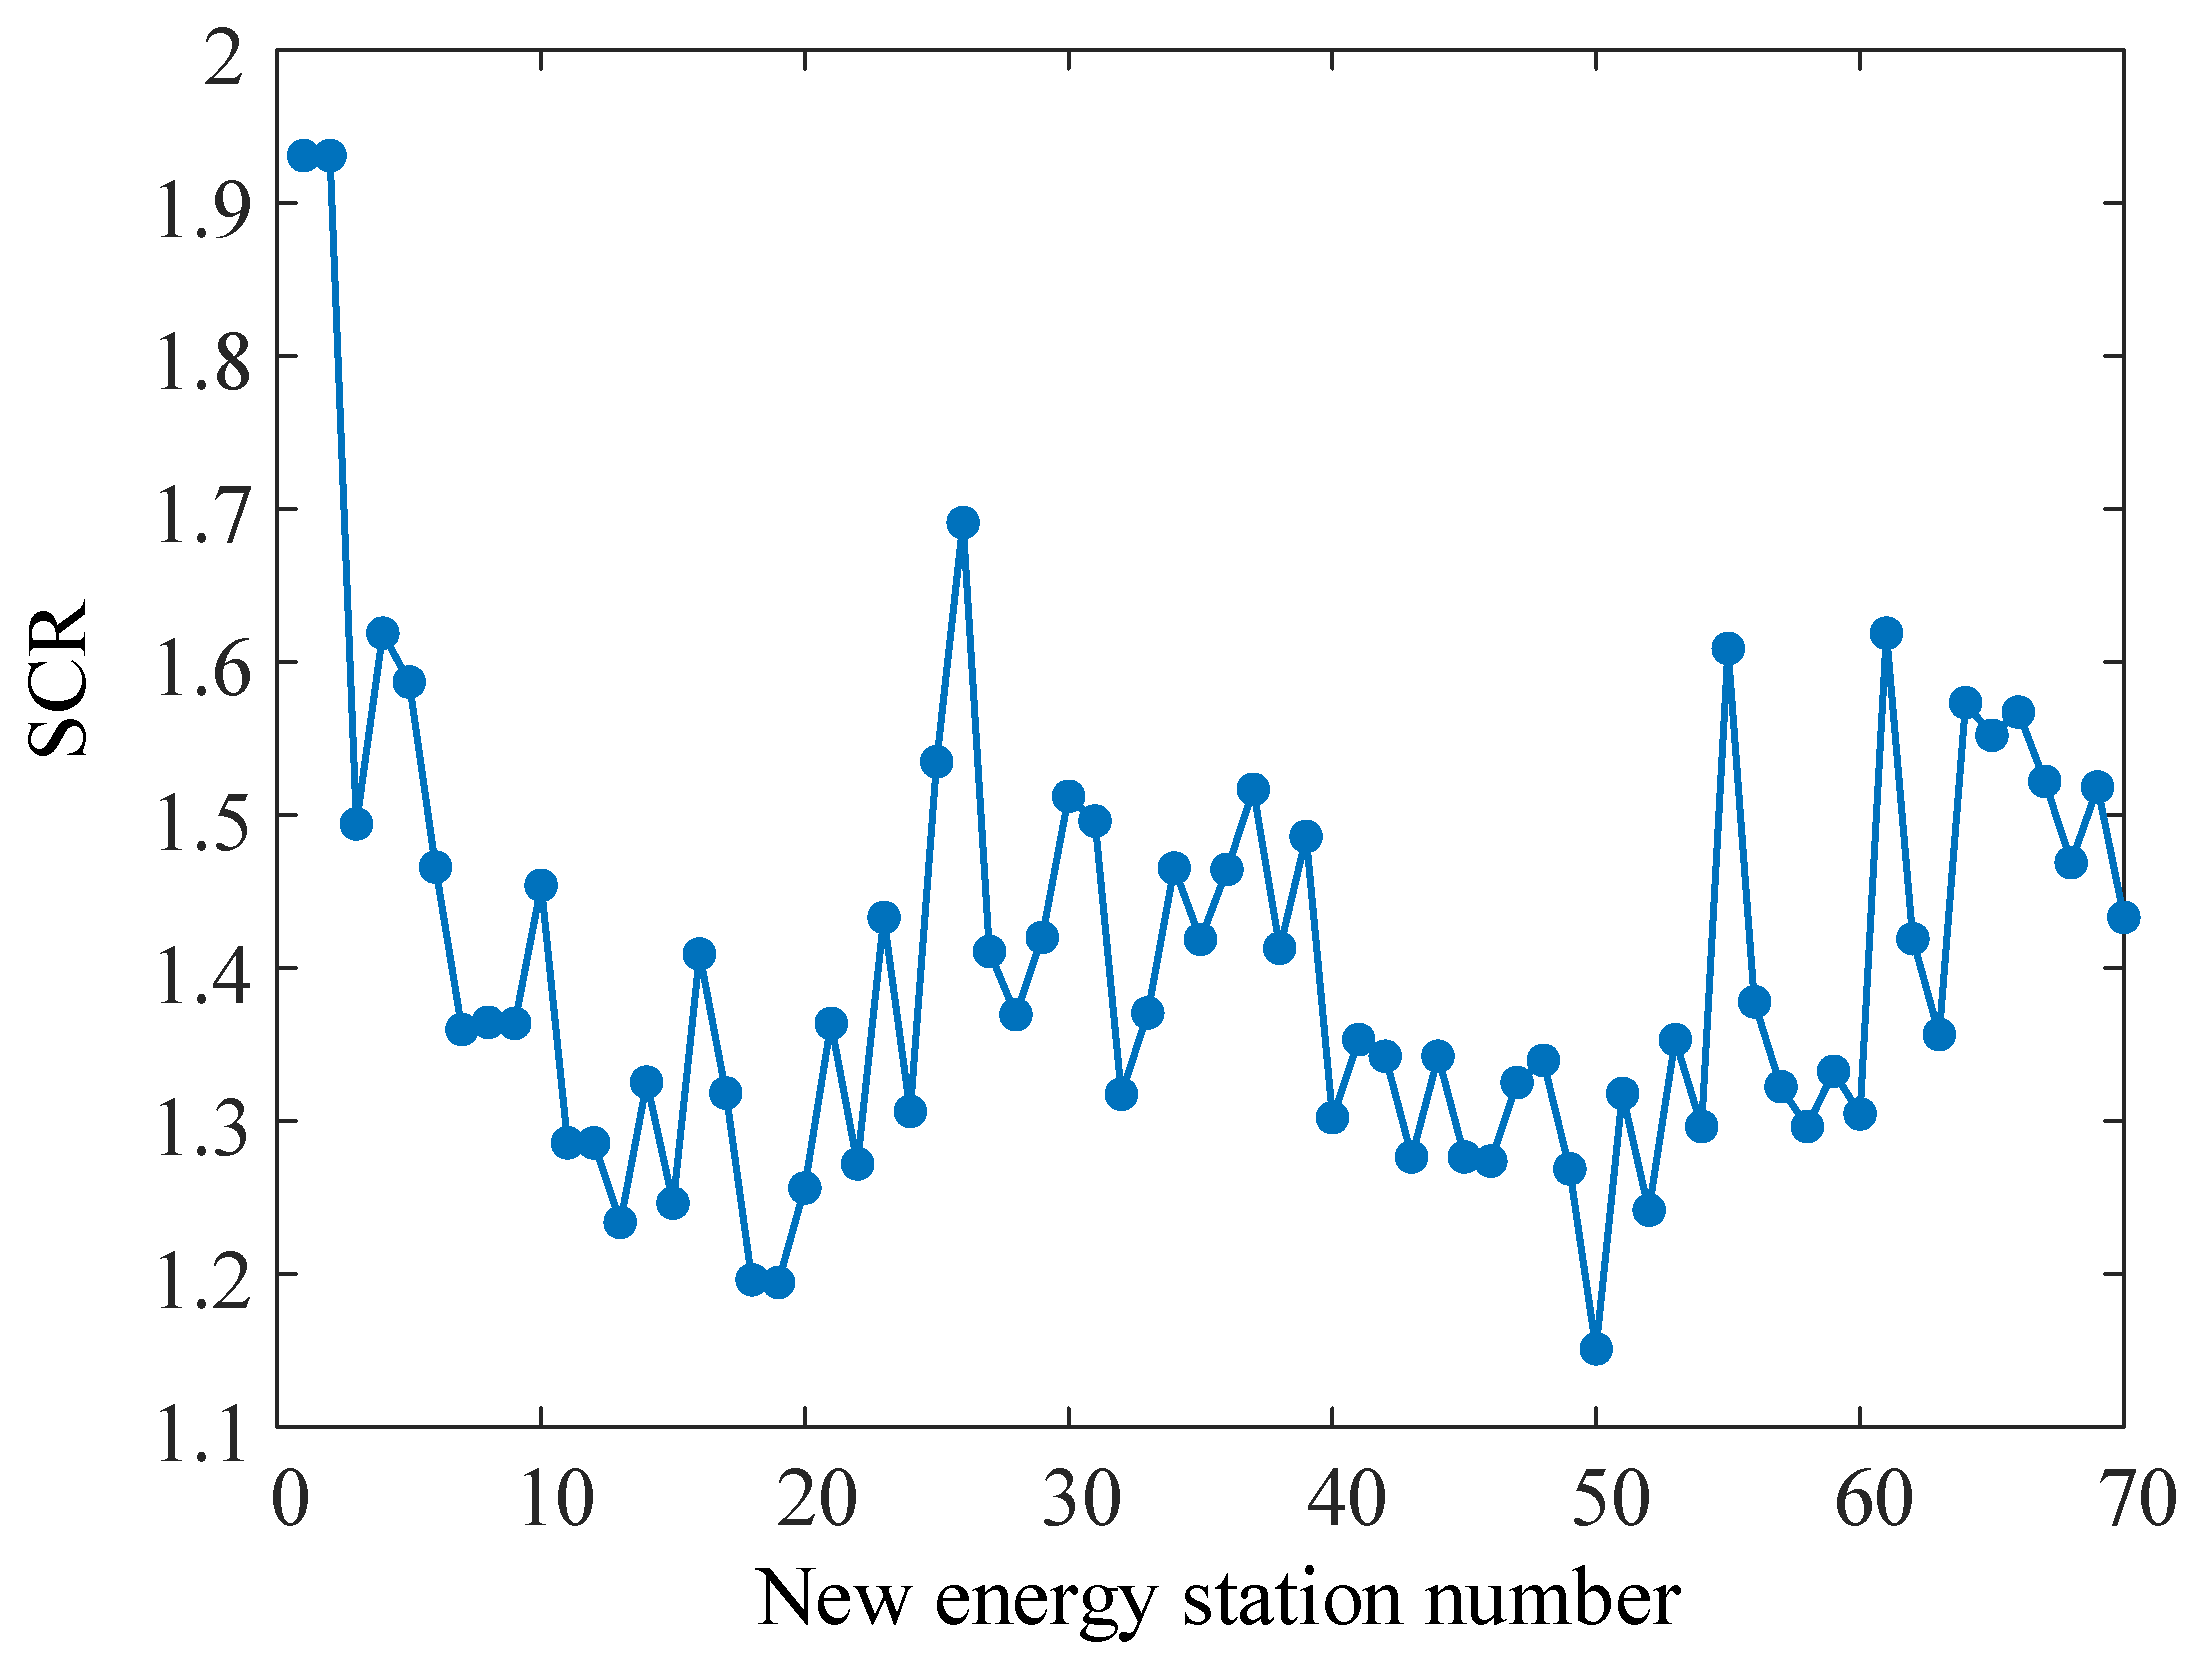
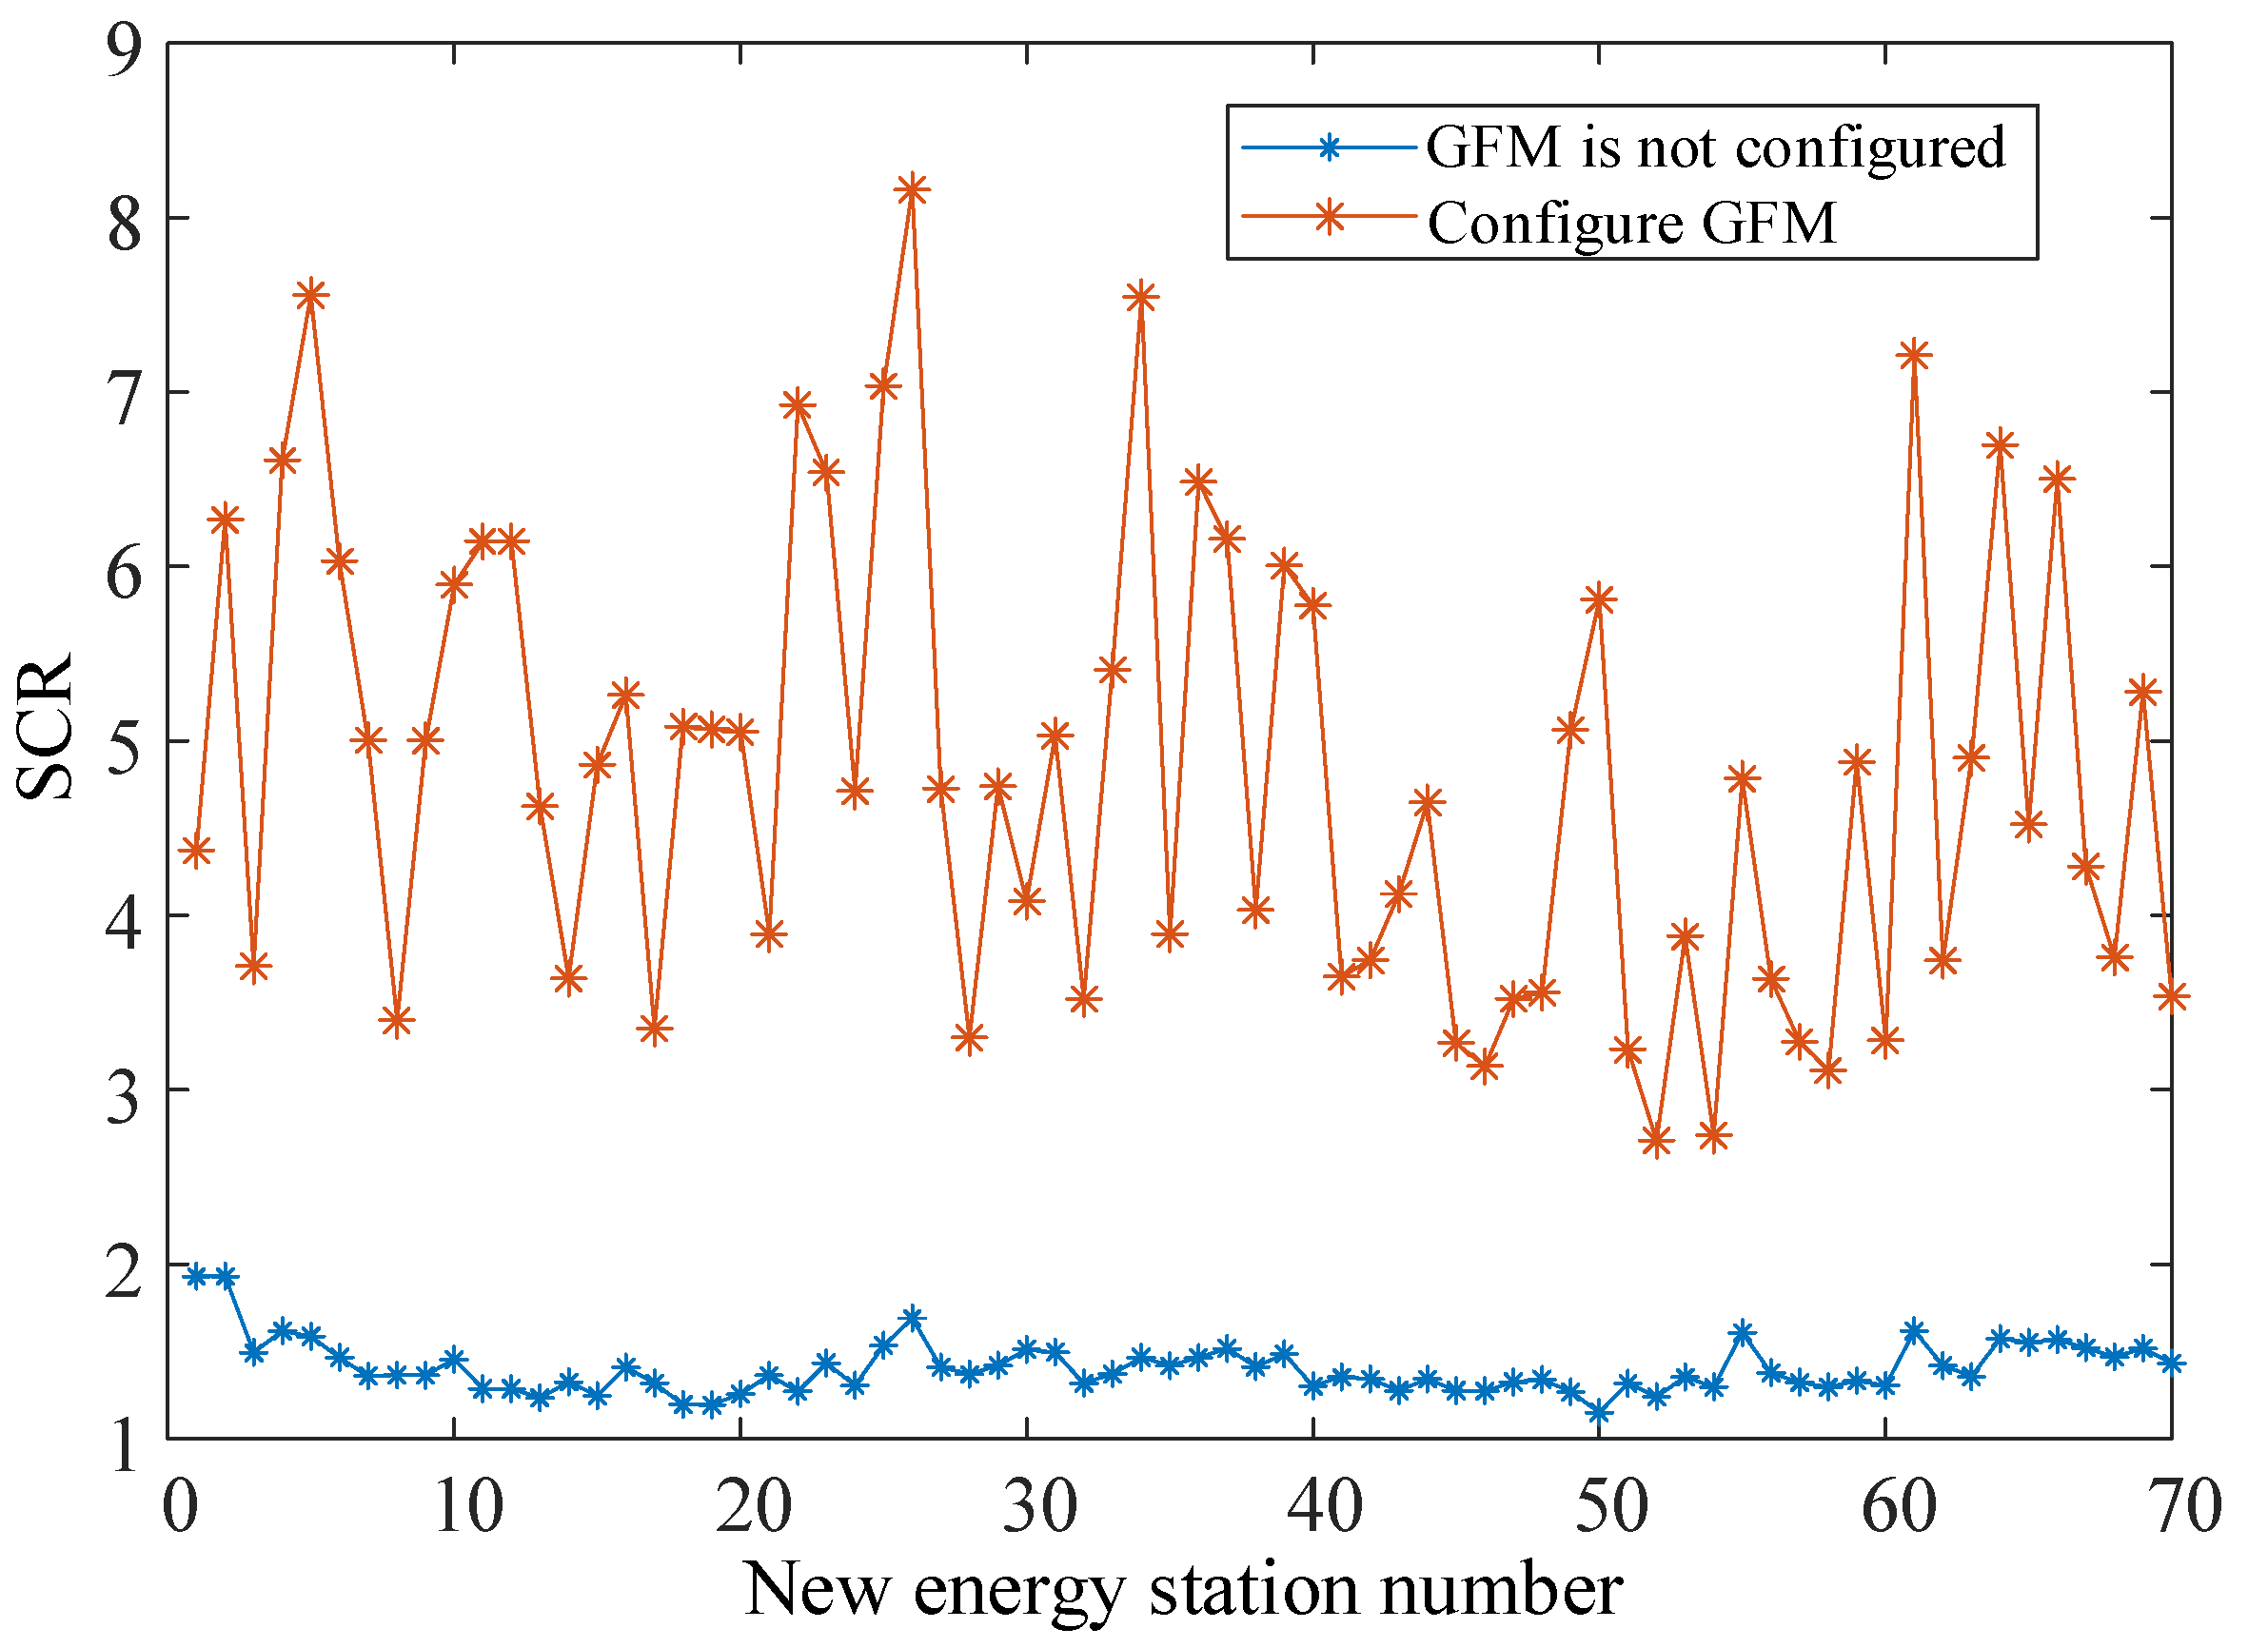
The GFM converter significantly enhances the MRSCR at each node within the system, with varying impacts depending on the installation location of the inverter. Notably, installations at new energy nodes yield the most substantial improvements in MRSCR for those specific nodes, and this effect becomes increasingly pronounced as the proximity to the installation site decreases.
(3)
The GFM converter enhances the short circuit capacity of the system and influences its impedance matrix, thereby improving the short circuit ratio. This enhancement subsequently increases the active power output limit PGFMmax for new energy stations within the cluster under short circuit ratio constraints, effectively quantifying the impact of the GFM converter on the dispatch and consumption capabilities of outgoing power from these clustered renewable energy sources.
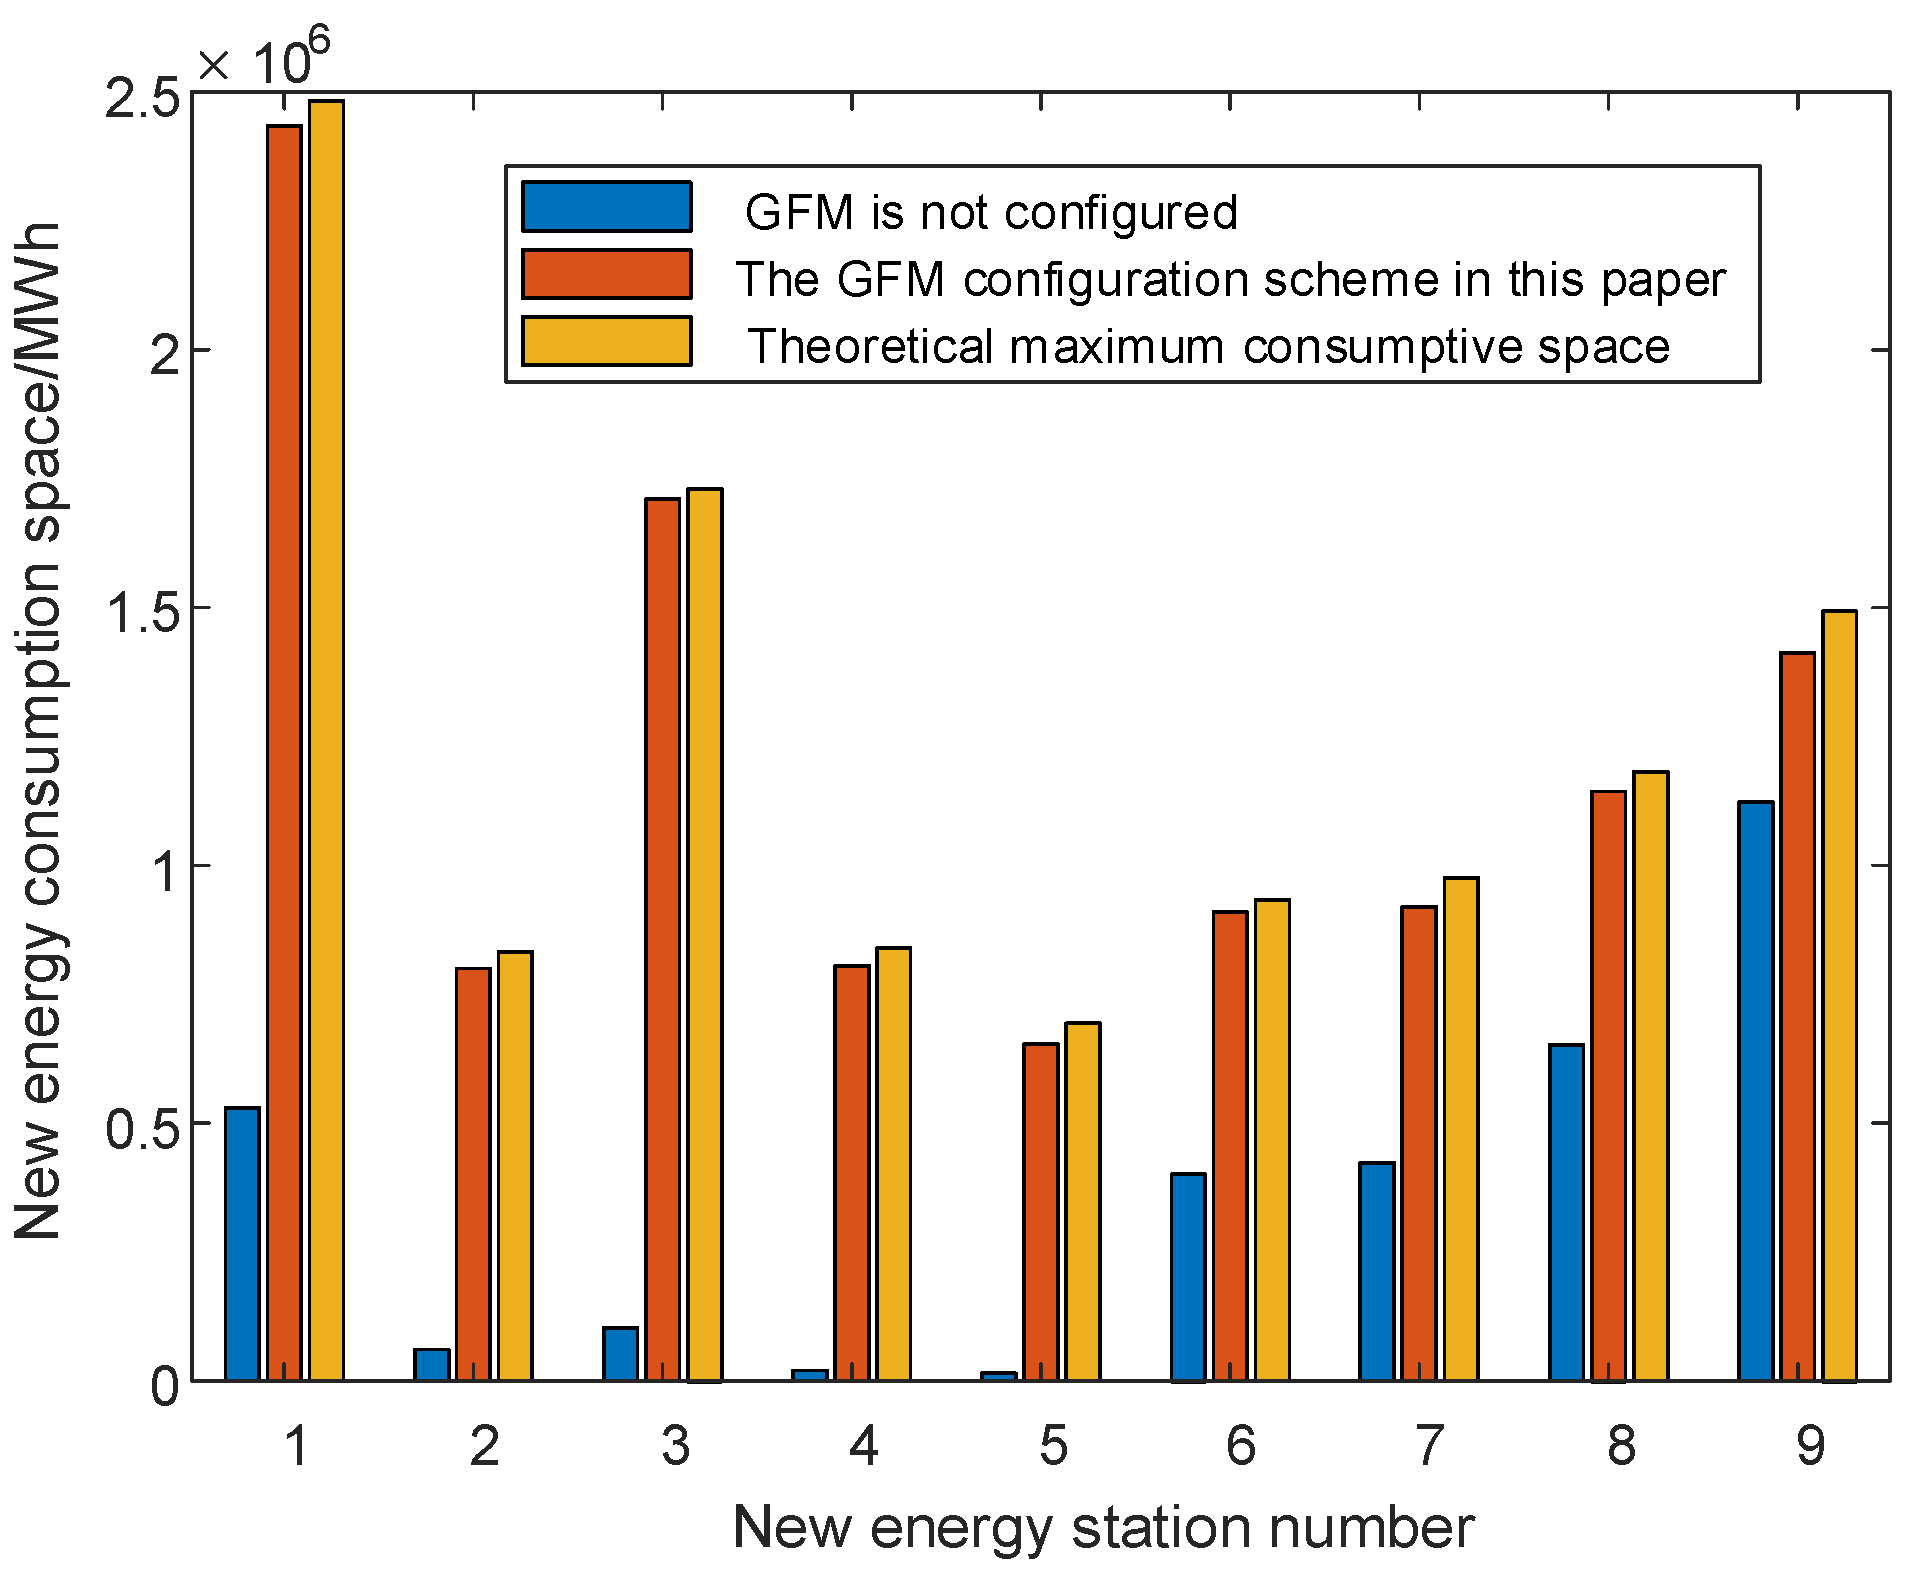
(4)
After the proposed GFM equipment optimization configuration method is adopted, the system strength and new energy absorption capacity are greatly improved, and the maximum absorption space of 90% of new energy stations reaches 95% of the theoretical maximum absorption space of each new energy station.

Author Contributions

Conceptualization, Y.G.; methodology, Y.G.; validation, W.S.; investigation, G.L. and H.C.; data curation, Q.W.; writing—original draft preparation, X.H. and W.Q.; writing—review and editing, Y.G. and W.S. All authors have read and agreed to the published version of the manuscript.

Funding

The author(s) declare that financial support was received for the research, authorship, and/or publication of this article. This study received funding from State Grid Jiangsu Electric Power Co., LTD. Science and Technology Project, SGJSJY00GHJS2310177. The funders had no role in the design of the study; in the collection, analyses, or interpretation of data; in the writing of the manuscript, or in the decision to publish the results.

Data Availability Statement

The data presented in this study will be available when required.

Conflicts of Interest

The authors declare that the research was conducted in the absence of any commercial or financial relationships that could be construed as a potential conflict of interest.

Appendix A

Table A1. Parameters of GFM converters.
ParameterValueParameterValue
Udc700VJ/kg·m20.3
Ut311VDp12
Ug311VKp15
Lc3mHKi1145
Lg1.1mHKp24
UN311VKi28
Table A2. List of participating variables in the grid-forming system.
NumberState ValueNumberState Value
1Δωpsc5Δx3
2Δφpsc6Δx4
3Δx17Δid
4Δx28Δiq

References

  1. Wang, X.; Taul, M.G.; Wu, H.; Liao, Y.; Blaabjerg, F.; Harnefors, L. Grid-Synchronization Stability of Converter-Based Resources—An Overview. IEEE Open J. Ind. Appl. 2020, 1, 115–134. [Google Scholar] [CrossRef]
  2. Fan, L.; Miao, Z. Wind in weak grids: 4 Hz or 30 Hz oscillations? IEEE Trans. Power Syst. 2018, 33, 5803–5804. [Google Scholar] [CrossRef]
  3. Liu, S.C.; Wang, X.Y.; Liu, P.X. A stochastic stability enhancement method of grid-connected distributed energy storage systems. IEEE Trans. Smart Grid 2017, 8, 2062–2070. [Google Scholar] [CrossRef]
  4. Rocabert, J.; Luna, A.; Blaabjerg, F.; Rodríguez, P. Control of power converters in AC microgrids. IEEE Trans. Power Electron. 2012, 27, 4734–4749. [Google Scholar] [CrossRef]
  5. Huang, L.; Yang, C.; Song, M.; Yuan, H.; Xie, H.; Xin, H.; Wang, Z. An adaptive inertia control to improve stability of virtual synchronous machines under various power grid strength. In Proceedings of the IEEE Power & Energy Society General Meeting, Atlanta, GA, USA, 4–8 August 2019. [Google Scholar]
  6. Arghir, C.; Jouini, T.; Dörfler, F. Grid-forming control for power converters based on matching of synchronous machines. Automatica 2018, 95, 273–282. [Google Scholar] [CrossRef]
  7. Matevosyan, J.; Badrzadeh, B.; Prevost, T.; Quitmann, E.; Ramasubramanian, D.; Urdal, H.; Achilles, S.; MacDowell, J.; Huang, S.H.; Vital, V.; et al. Grid-forming inverters: Are they the key for high renewable penetration? IEEE Power Energy Mag. 2019, 17, 89–98. [Google Scholar] [CrossRef]
  8. Li, Y.; Gu, Y.; Green, T.C. Revisiting Grid-Forming and Grid-Following Inverters: A Duality Theory. IEEE Trans. Power Syst. 2022, 37, 4541–4554. [Google Scholar] [CrossRef]
  9. D’arco, S.; Suul, J.A.; Fosso, O.B. A Virtual Synchronous Machine implementation for distributed control of power converters in Smart Grids. Electr. Power Syst. Res. 2015, 122, 180–197. [Google Scholar] [CrossRef]
  10. Johnson, B.B.; Dhople, S.V.; Hamadeh, A.O.; Krein, P.T. Synchronization of Parallel Single-Phase Inverters with Virtual Oscillator Control. IEEE Trans. Power Electron. 2024, 29, 6124–6138. [Google Scholar] [CrossRef]
  11. Zhou, W.; Torres-Olguin, R.E.; Wang, Y.; Chen, Z. A Gray-Box Hierarchical Oscillatory Instability Source Identification Method of Multiple-Inverter-Fed Power Systems. IEEE J. Emerg. Sel. Top. Power Electron. 2021, 9, 3095–3113. [Google Scholar] [CrossRef]
  12. Wu, B.; Li, J.; Li, Y.; Wang, Y.; Liu, Q.; Sun, W. Grey box identification method and application of DQ impedance of gird connected inverter. Proc. CSEE 2022, 42, 1534–1546. [Google Scholar]
  13. Liu, P.; Xie, X.; Li, Y.; Yi, S.; Su, P.; Dai, X.; Ma, N. Mechanism and characteristics of grid-forming control for improving sub/super synchronous oscillation stability of Grid-following-based gridconnected converter. Power Syst. Technol. 2024, 48, 990–997. [Google Scholar]
  14. Coelho, E.A.A.; Cortizo, P.C.; Garcia, P.F.D. Small-signal stability for parallel-connected inverters in stand-alone AC supply systems. IEEE Trans. Ind. Appl. 2002, 38, 533–542. [Google Scholar] [CrossRef]
  15. Zhao, L.; Jin, Z.M.; Wang, X.F. Small-signal synchronization stability of grid-forming converters with regulated DC-link dynamics. IEEE Trans. Ind. Electron. 2023, 70, 12399–124095. [Google Scholar] [CrossRef]
  16. Pogaku, N.; Prodanovic, M.; Green, T.C. Modeling, analysis and testing of autonomous operation of an inverter-based microgrid. IEEE Trans. Power Electron. 2007, 22, 613–625. [Google Scholar] [CrossRef]
  17. IEEE Std 1204—1997; IEEE Guide for Planning Dc Links Terminating at Ac Locations Having Low Short-Circuit Capacities. IEEE: Piscataway, NJ, USA, 1997.
  18. Conseil International des Grands Reseaux Elecctriques. Connection of Wind Farms to Weak AC Networks; CIGRE: Paris, France, 2016. [Google Scholar]
  19. Yu, L.; Sun, H.; Xu, S.; Zhao, B.; Zhang, J.; Li, Z. Overview of strength quantification indexes of power system with power electronic equipment. Proc. CSEE 2022, 42, 499–515. [Google Scholar]
  20. Xin, H.; Liu, C.; Chen, X.; Wang, Y.; Prieto-Araujo, E.; Huang, L. How Many Grid-Forming Converters Do We Need? A Perspective From Small Signal Stability and Power Grid Strength. IEEE Trans. Power Syst. 2025, 40, 623–635. [Google Scholar] [CrossRef]
  21. Wang, Y.; Xiang, W.; Zhang, H.; He, Y.; Wen, J. Triangulation Type Direct Drive Wind Turbine Ratio Optimization Configuration Analysis. Power Syst. Tech. 2025, 1–13. [Google Scholar] [CrossRef]
  22. Wu, C.; Liu, C.; Huang, W. Siting and sizing method of grid-forming converters for improving stability of power system with renewable energy. Autom. Electr. Power Syst. 2023, 47, 130–136. (In Chinese) [Google Scholar]
  23. Collados-Rodriguez, C.; Cheah-Mane, M.; Prieto-Araujo, E.; Gomis-Bellmunt, O. Stability and operation limits of power systems with high penetration of power electronics. Int. J. Electr. Power Energy Syst. 2022, 138, 107728. [Google Scholar] [CrossRef]
  24. NERC IRPS White Paper, Grid Forming Functional Specifications for BPS-Connected Battery Energy Storage Systems. 2023. Available online: https://www.nerc.com/comm/RSTC_Reliability_Guidelines/White_Paper_GFM_Functional_Specification.pdf (accessed on 1 September 2019).
  25. Zhao, X.; Flynn, D. Dynamic studies for 100% converter-based Irish power system. In Proceedings of the 9th Renewable Power Generation Conference (RPG Dublin Online 2021), Online Conference, 1–2 March 2021; IET: London, UK, 2021; pp. 389–394. [Google Scholar]
  26. Yang, C.; Huang, L.; Xin, H.; Ju, P. Placing Grid-Forming Converters to Enhance Small Signal Stability of PLL-Integrated Power Systems. IEEE Trans. Power Syst. 2020, 36, 3563–3573. [Google Scholar] [CrossRef]
  27. Wang, B.; Yang, D.; Cai, G. Review of research on power system inertia related issues in the context of high penetration of renewable power generation. Power Syst. Technol. 2020, 44, 2998–3007. [Google Scholar]
  28. Sun, H.; Xu, S.; Xu, T.; Guo, Q.; He, J.; Zhao, B.; Yu, L.; Zhang, Y.; Li, W.; Zhou, Y.; et al. Definition and Index of Short Circuit Ratio for Multiple Renewable Energy Stations. Proc. CSEE 2021, 41, 497–506. [Google Scholar]
  29. Ding, K.; Chen, B.; Qin, J. Evaluation Method of Consumption Ability of New Large Scale Energy Clusters Connected to Weak Grids. Electr. Power Constr. 2023, 44, 86–94. [Google Scholar]
Figure 1. Main circuit and control strategy of grid-forming converter.
Inventions 10 00013 g001
Figure 2. System characteristic root trajectory when SCR changes.
Inventions 10 00013 g002
Figure 3. Participation factors of dominant oscillation modes in grid-forming systems under different grid strengths.
Inventions 10 00013 g003
Figure 4. Algorithm flow chart.
Inventions 10 00013 g004
Figure 5. Schematic diagram of topology of New England IEEE 39-bus system.
Inventions 10 00013 g005
Figure 6. Short circuit ratio of each new energy station.
Inventions 10 00013 g006
Figure 7. Genetic algorithm iteration process diagram.
Inventions 10 00013 g007
Figure 8. Distribution of installation position of GFM converter.
Inventions 10 00013 g008
Figure 9. Short circuit ratio before and after the figuration of GFM converter in IEEE 39 system.
Inventions 10 00013 g009
Figure 10. New energy accommodation space before and after the figuration of the GFM converter.
Inventions 10 00013 g010
Figure 11. Short circuit ratio of each new energy station with GFM converter allocation.
Inventions 10 00013 g011
Figure 12. Short circuit ratio before and after the figuration of GFM converter in the actual system.
Inventions 10 00013 g012
Table 1. The parameters of genetic algorithm for simulation 1.
npopPc1Pc2Pm1Pm2ngen
300.60.90.010.180
Table 2. The parameters of the genetic algorithm for simulation 2.
npopPc1Pc2Pm1Pm2ngen
300.60.90.010.1100
Table 3. Comparison of new energy consumption space before and after GFM configuration in some new energy stations.
New Energy Station NumberNo GFM/Million MWhConfigure GFM/Million MWhTheoretical Maximum Consumption Space/Million MWh
114.6225.7525.75
211.5812.7512.75
317.7025.1925.75
412.4525.4925.49
514.3347.9747.97
615.5925.8825.88
719.0725.7525.75
819.6325.7225.75
930.8976.4777.26
102.0714.8551.50
Disclaimer/Publisher’s Note: The statements, opinions and data contained in all publications are solely those of the individual author(s) and contributor(s) and not of MDPI and/or the editor(s). MDPI and/or the editor(s) disclaim responsibility for any injury to people or property resulting from any ideas, methods, instructions or products referred to in the content.

