Life Cycle Cost Analysis of Three Types of Power Lines in 10 kV Distribution Network
Abstract
:1. Introduction
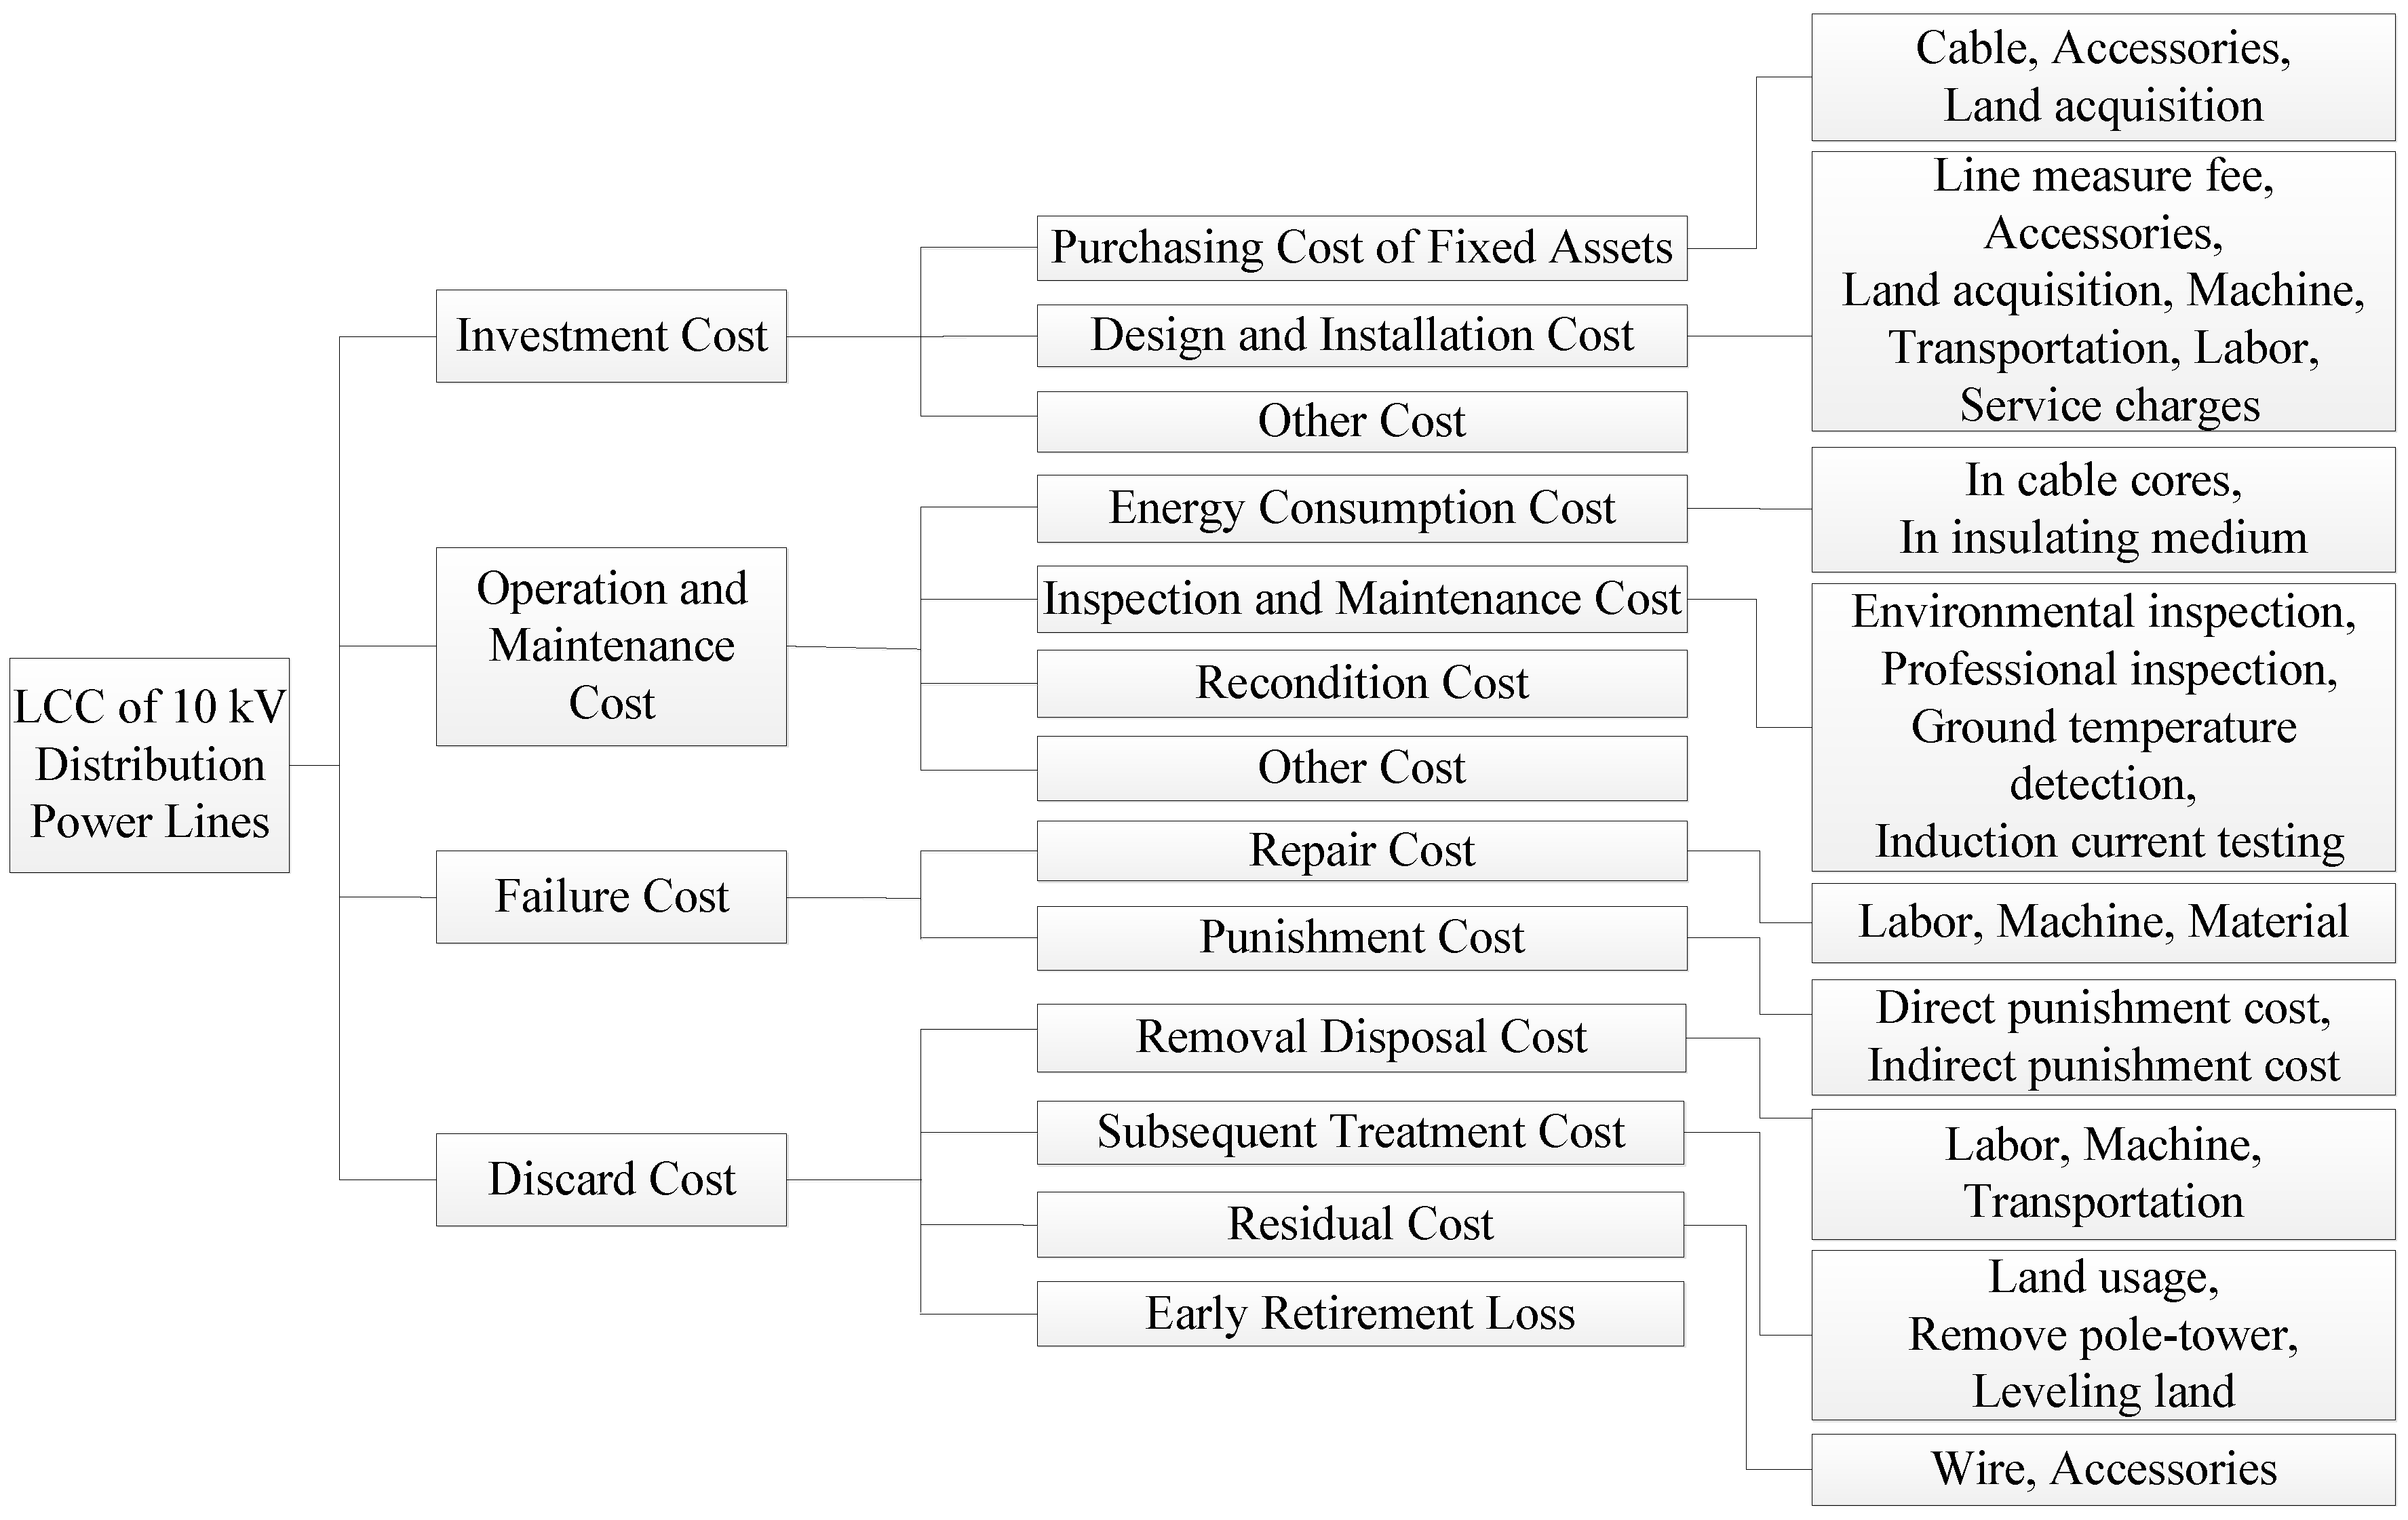
- A LCC model of the 10 kV distribution power lines is proposed, containing investment cost, operation and maintenance cost, failure cost and discard cost.
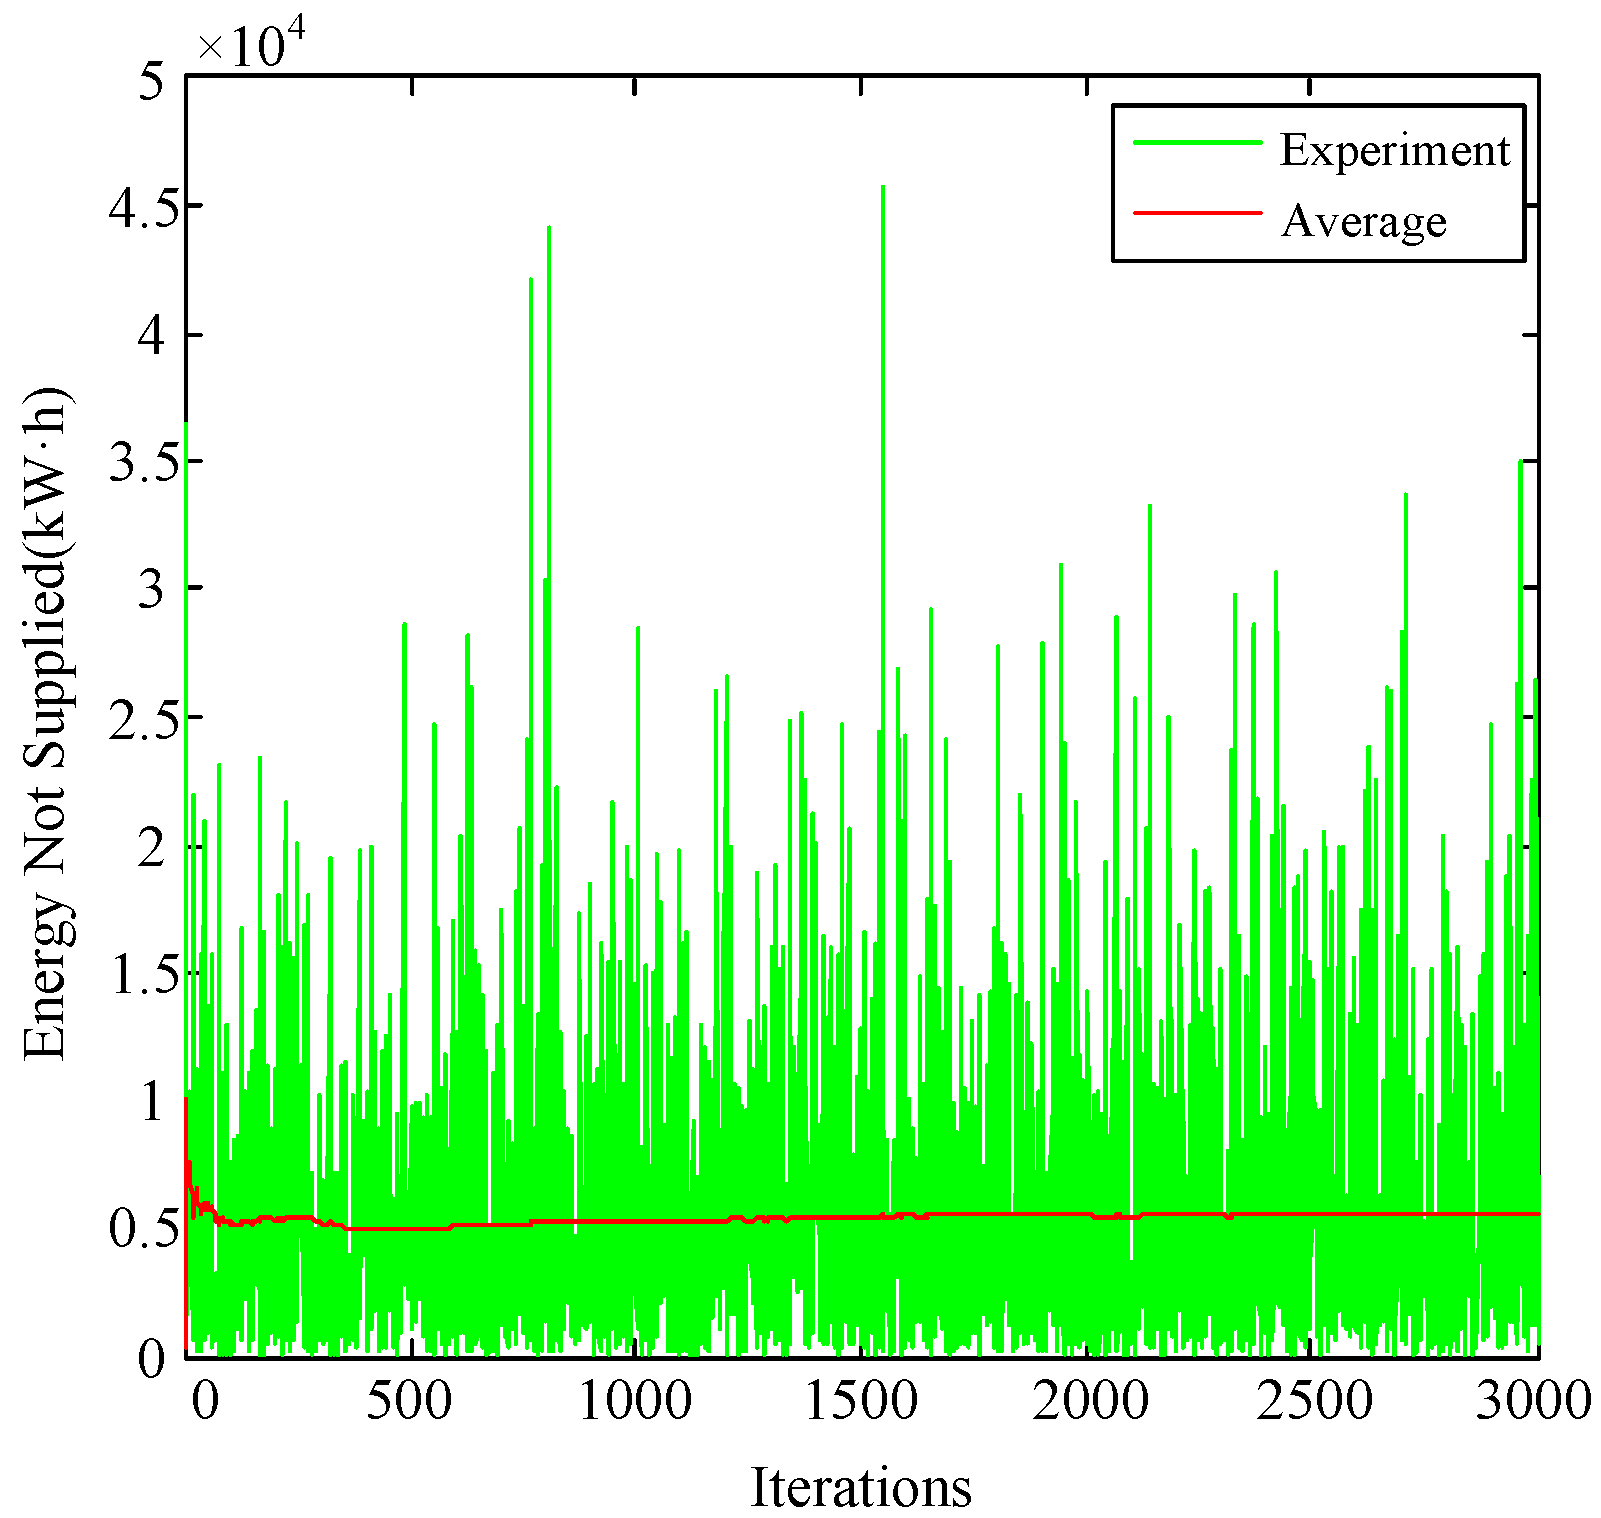
- A risk assessment model is proposed by using the Monte Carlo algorithm to evaluate the failure cost.
- Quantitative analysis and the comparison of the LCC of the 10 kV distribution lines are presented.
2. The Life Cycle Cost (LCC) Model
2.1. Investment Cost
2.2. Operation and Maintenance Cost
2.2.1. Energy Consumption Cost
2.2.2. Maintenance Cost
2.2.3. Recondition Cost
2.3. Failure Cost
2.3.1. Risk Assessment Model
2.3.2. Risk Assessment Method
Model of the Fault Rate
Failure Simulation Method
- Firstly, the normal distribution probability model of the deviation rate of the predictive load and the exponential distribution of the probability distribution of the fault maintenance time are established;
- Then, sampling the values of predictive load and fault maintenance time;
- Finally, calculating the indexes by the statistical method.
2.3.3. Line Fault Simulation
2.4. Discard Cost
2.5. Discussion of Three Types of Cable
3. Software Development and Case Analysis
3.1. Software Development
3.2. Case 1
3.2.1. Case 1 Result Analysis
Each part of LCC
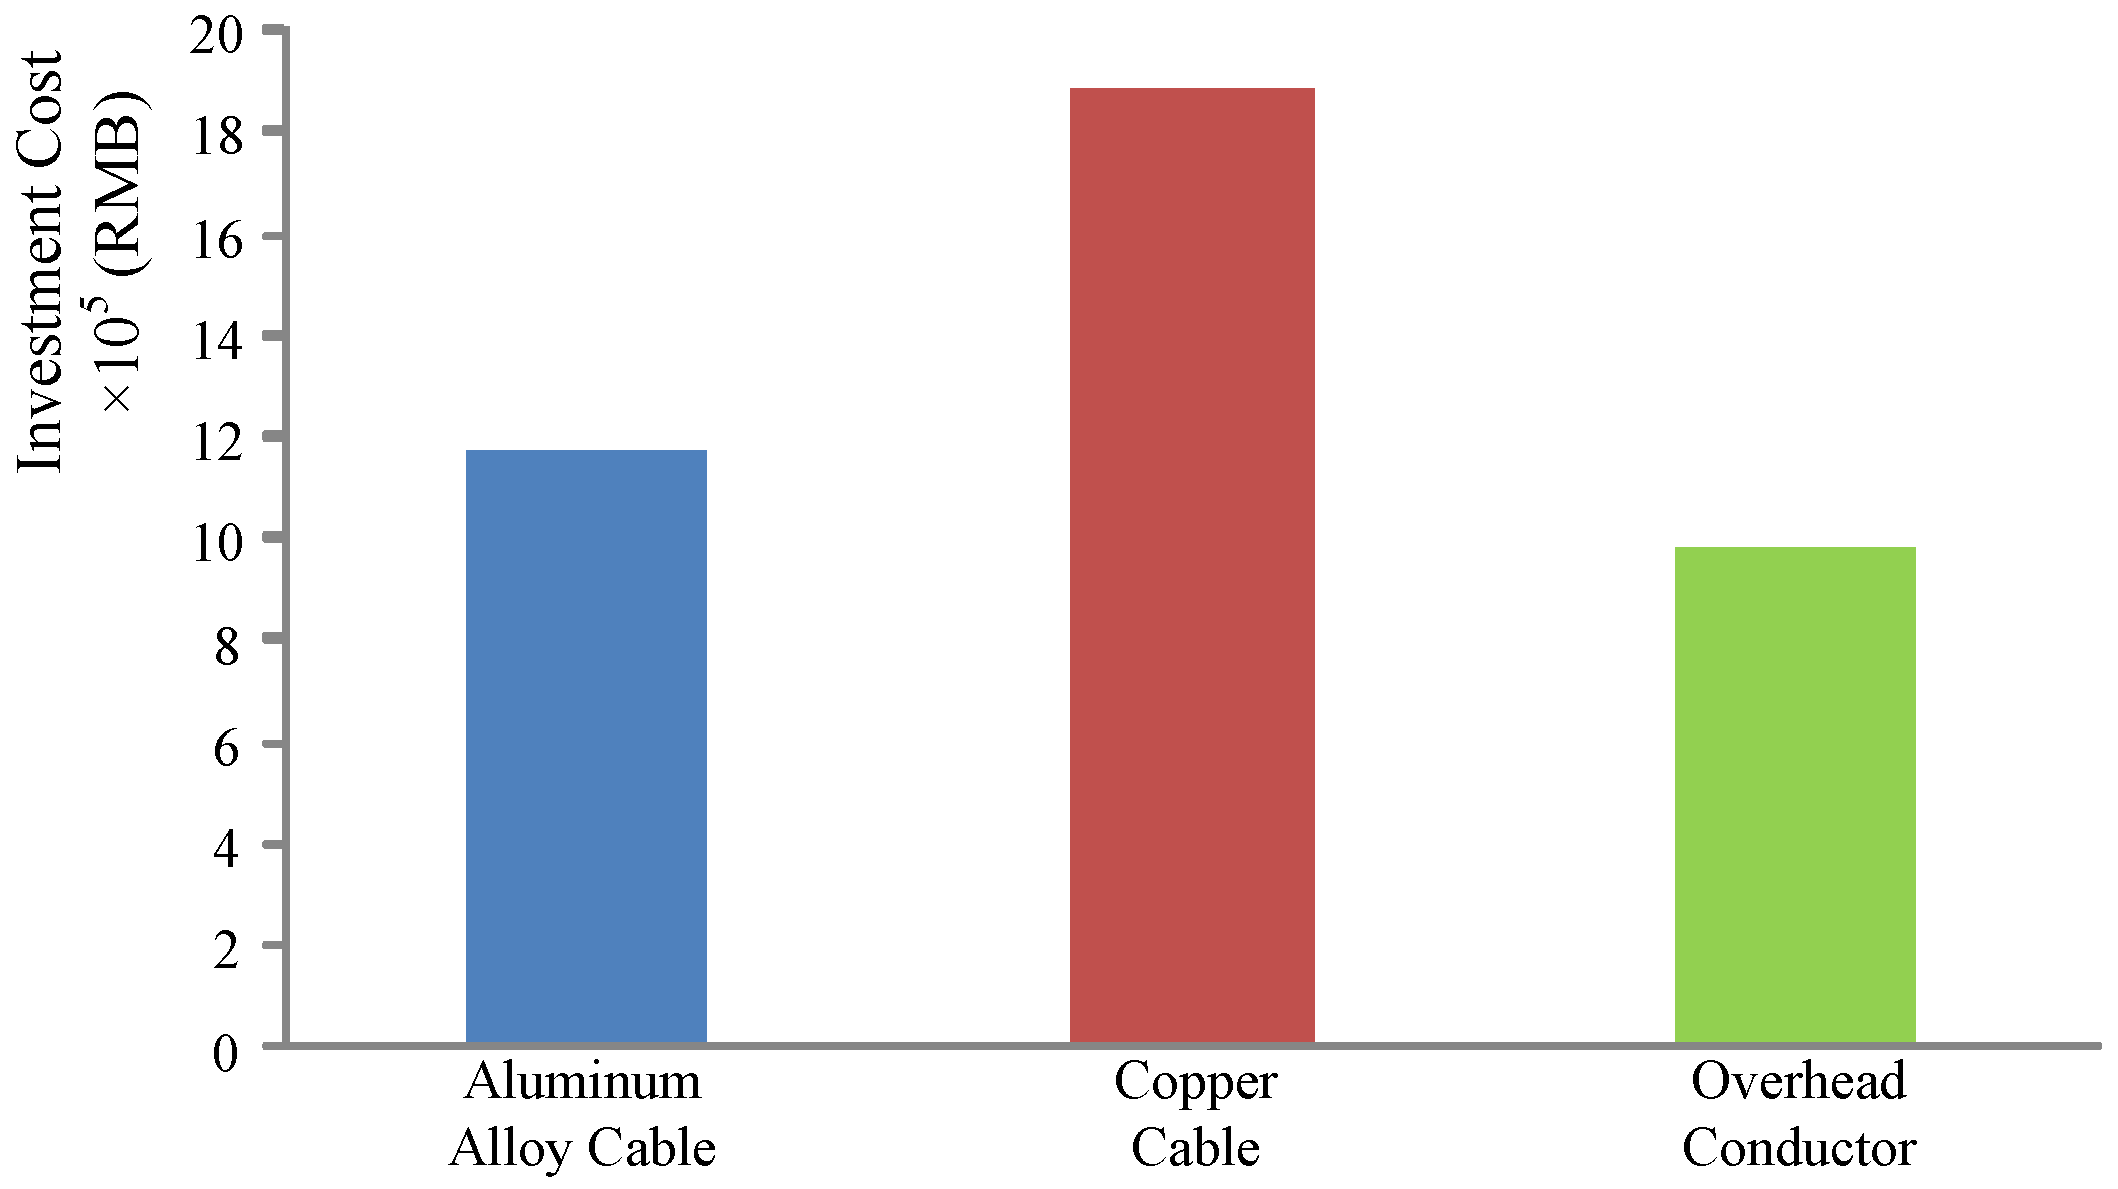
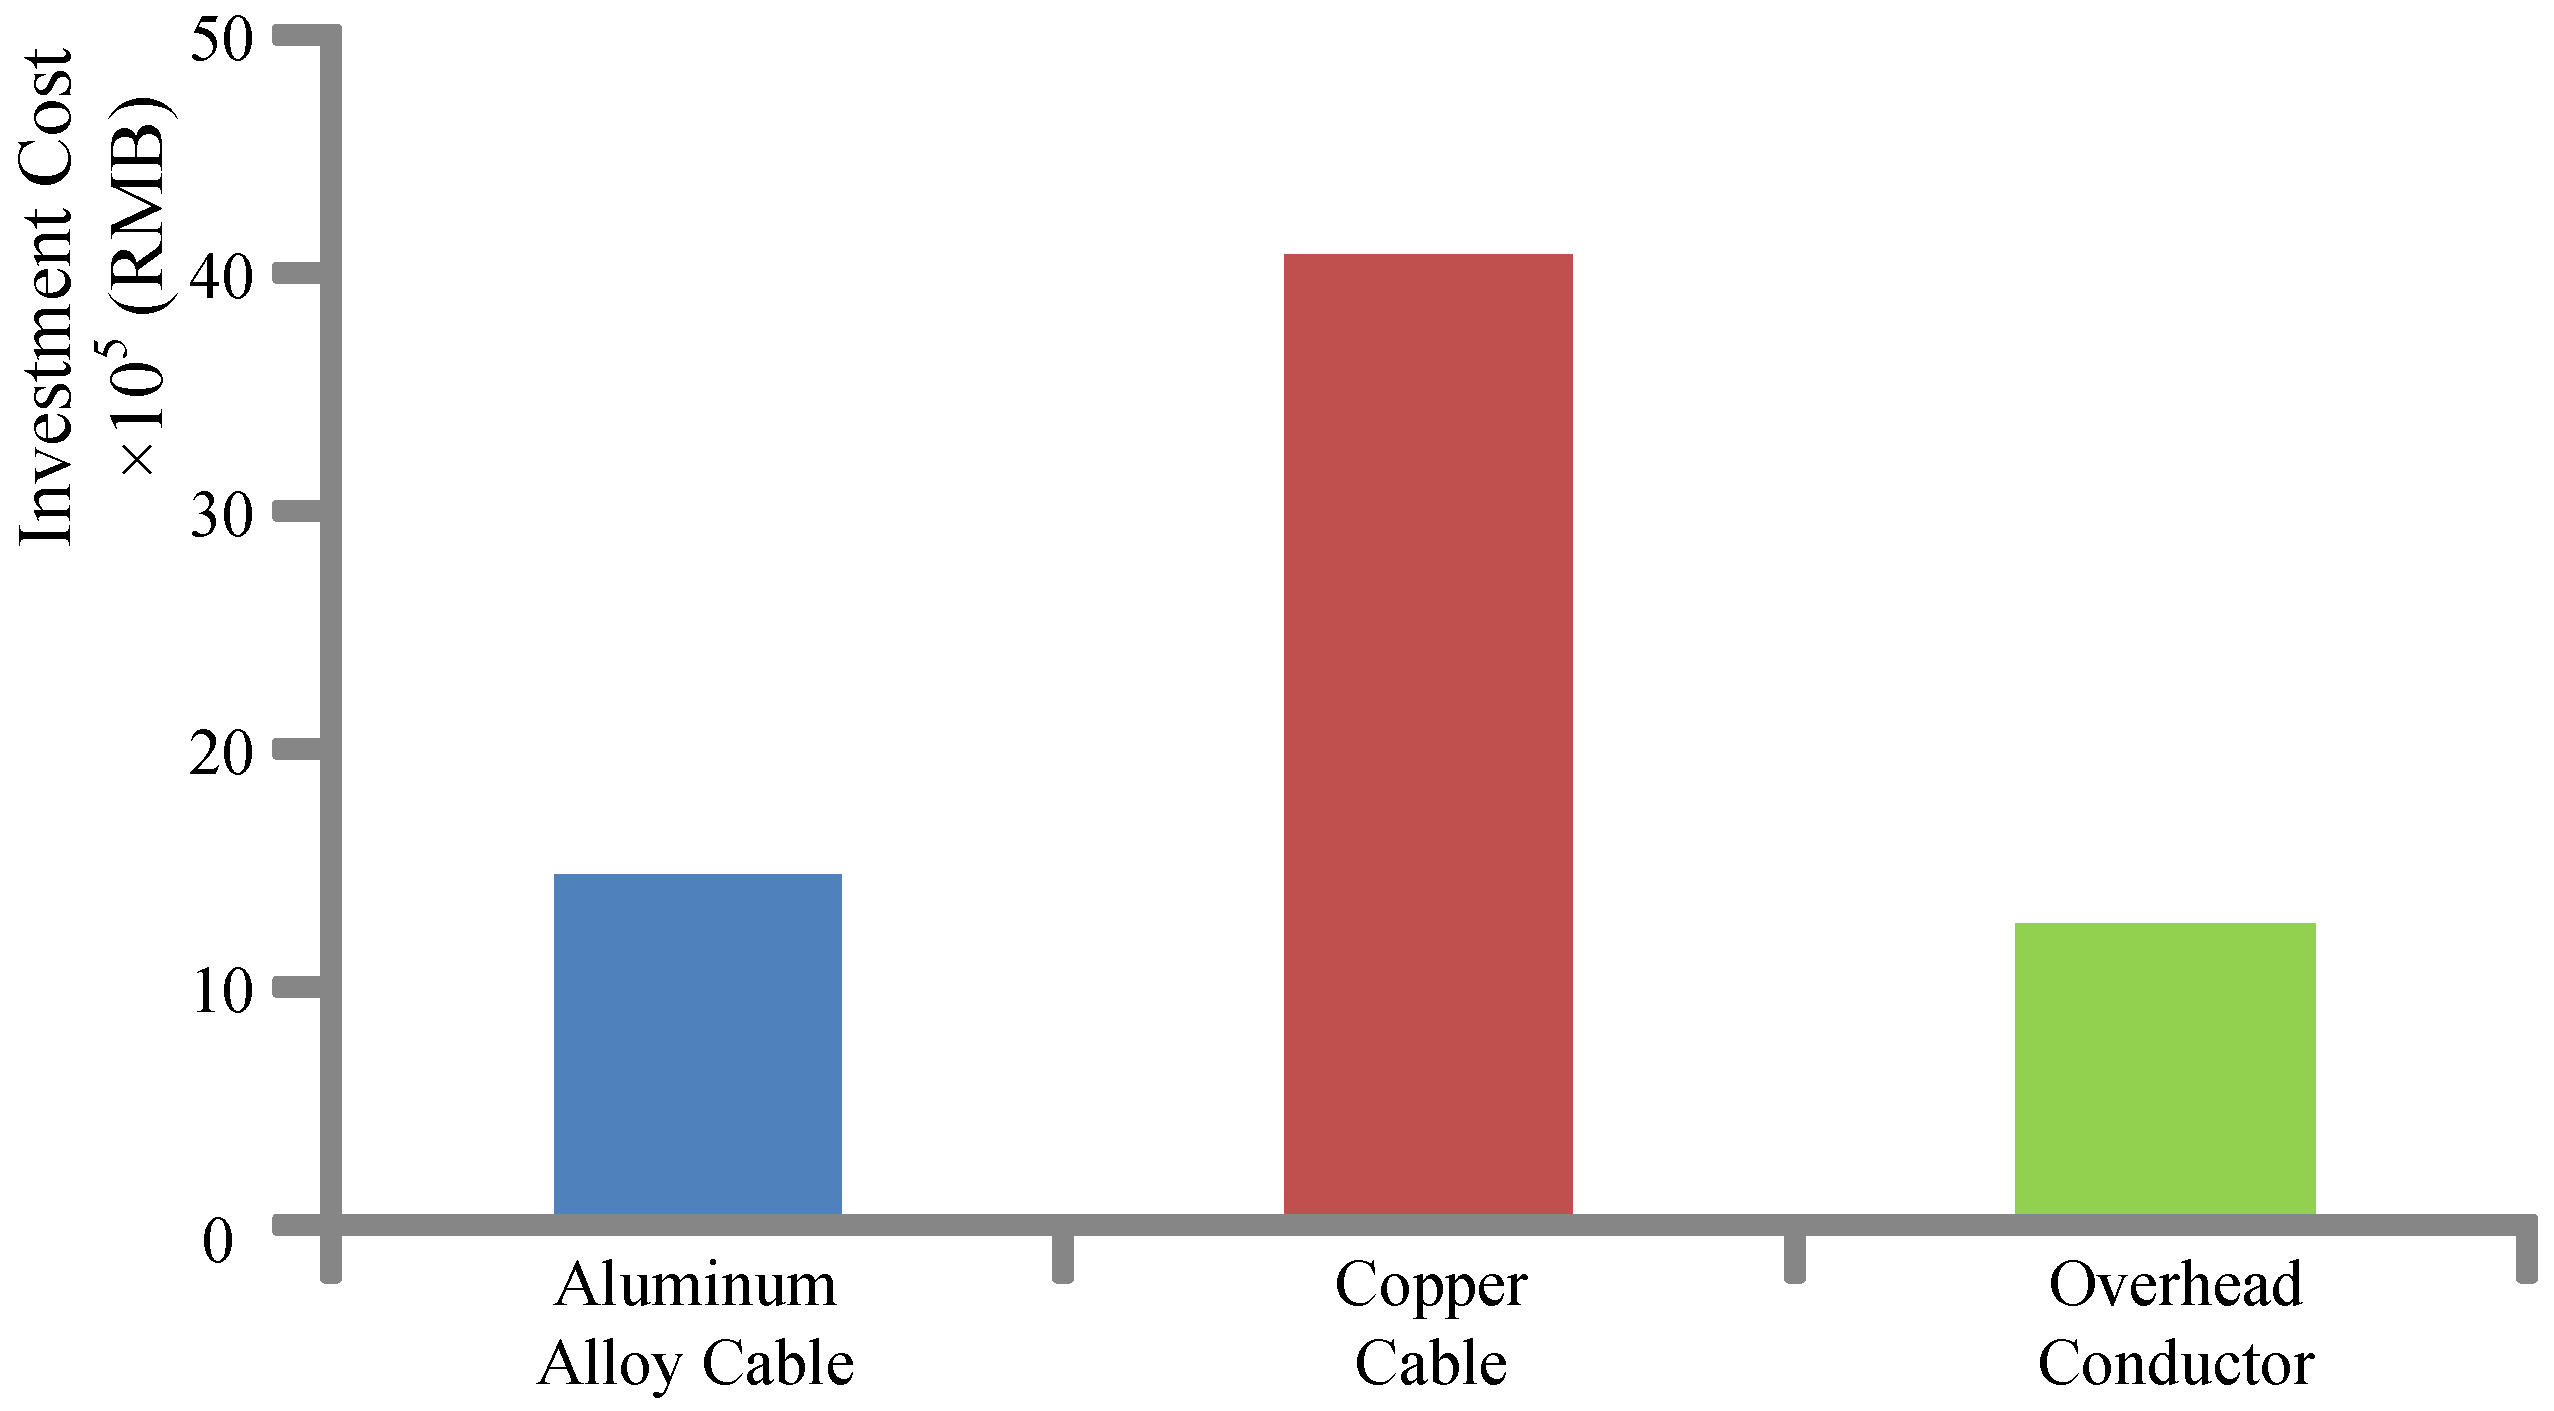
- Investment cost:From Figure 8, it is clear that the overhead conductor is the most economical line, while the copper cable requires the highest investment cost.
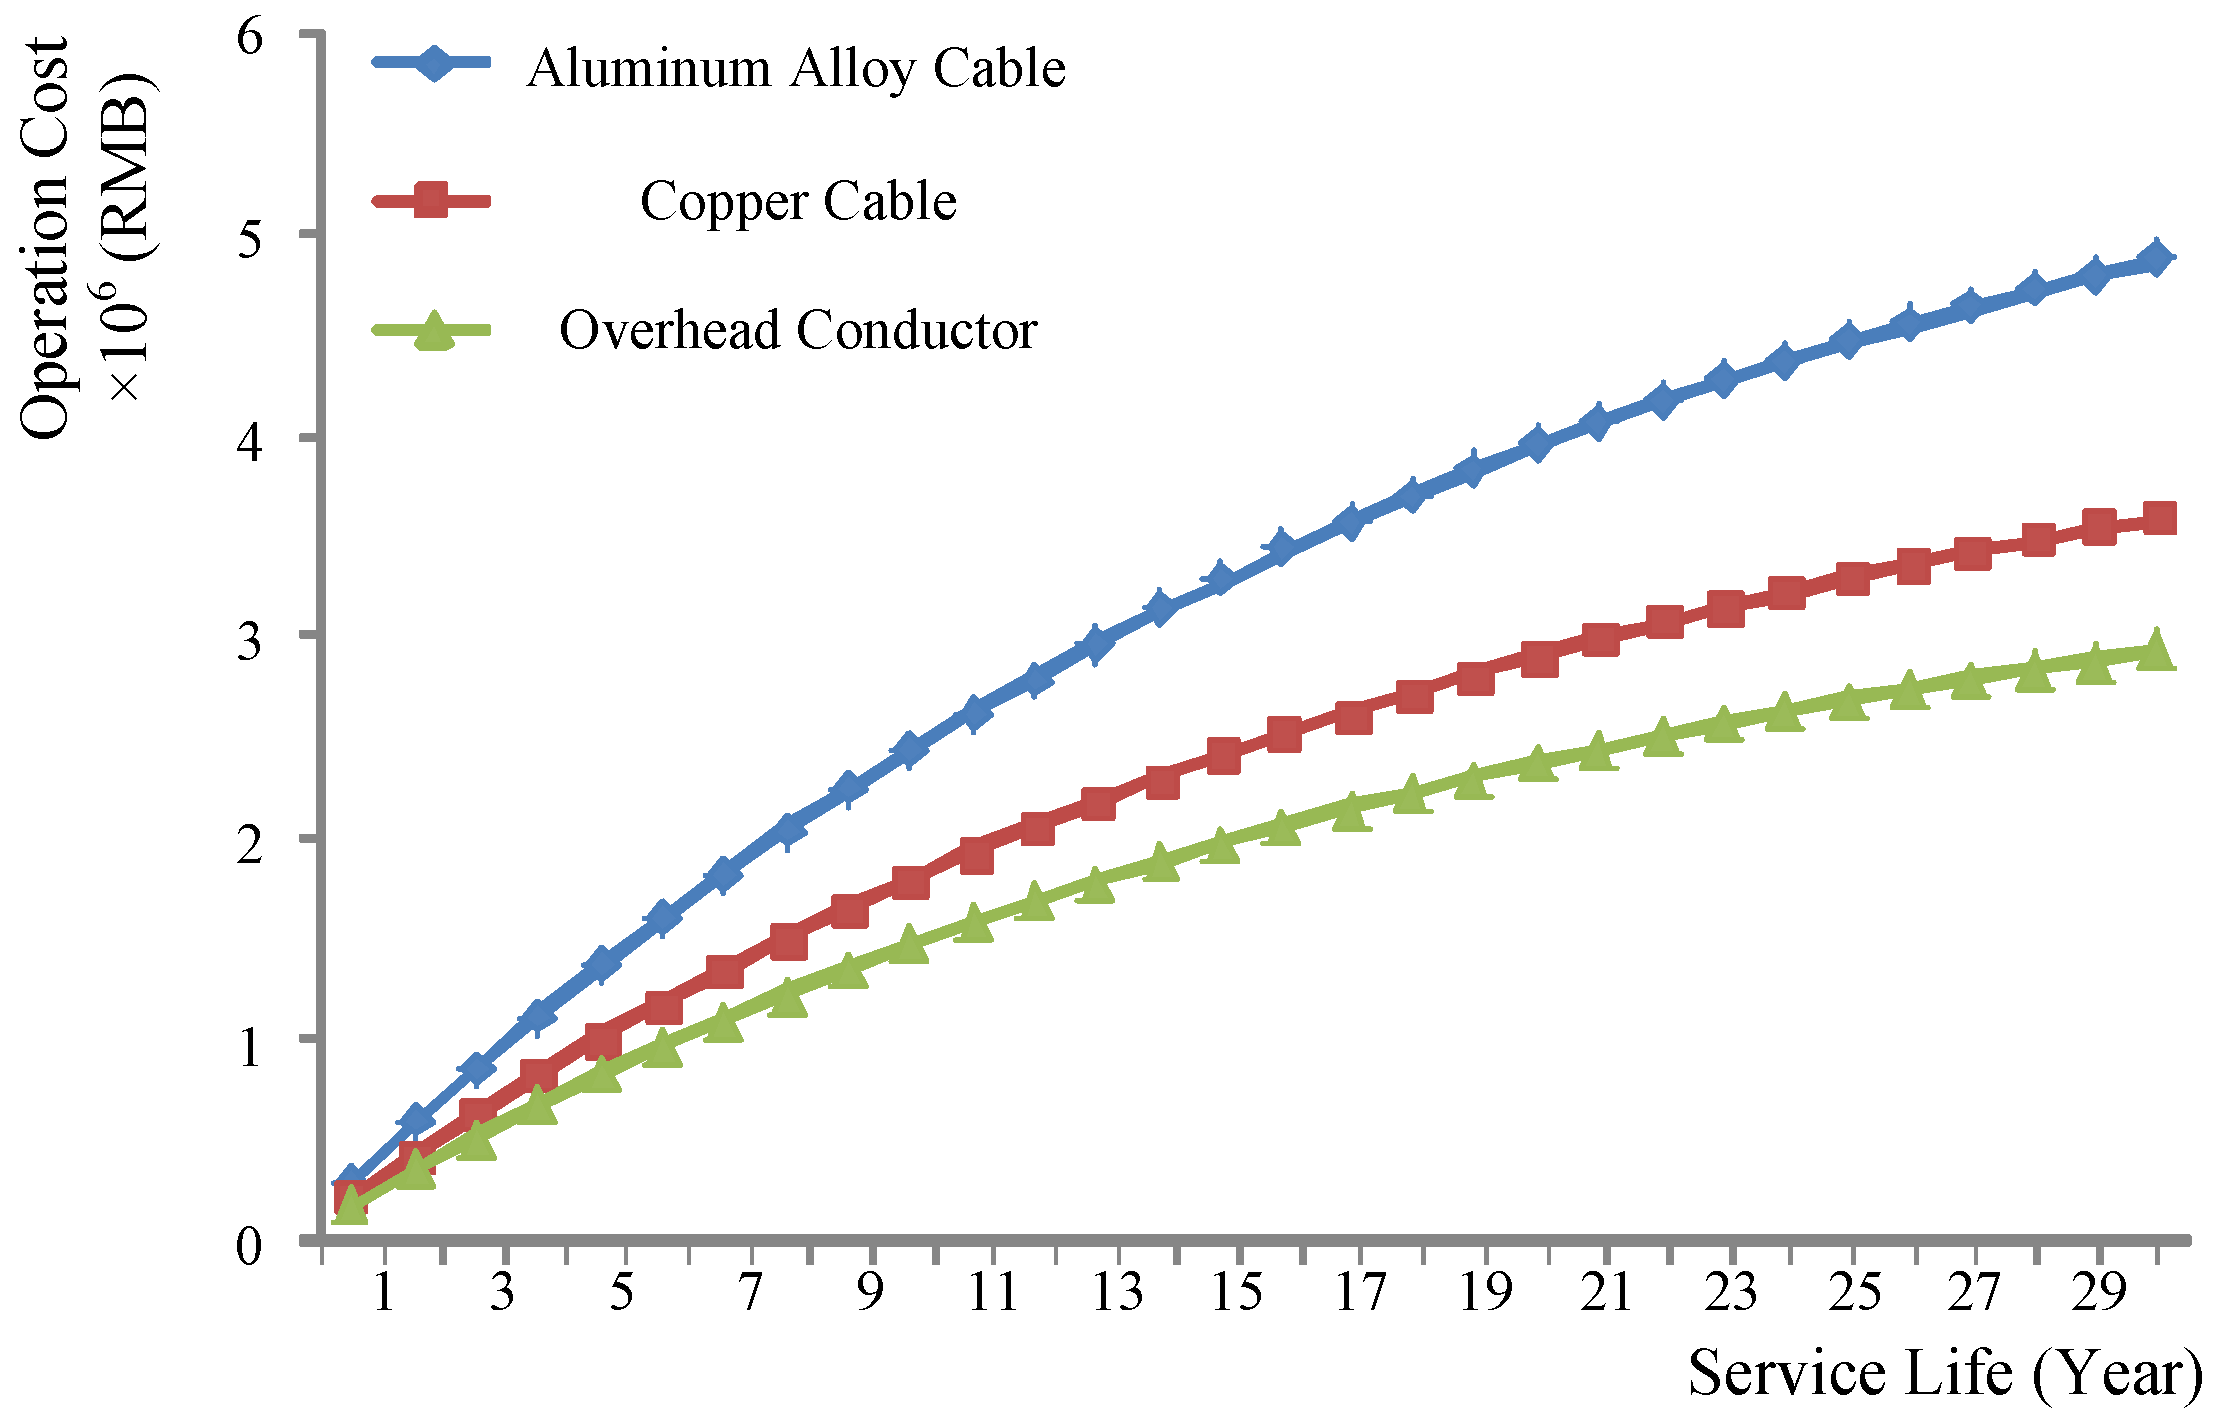
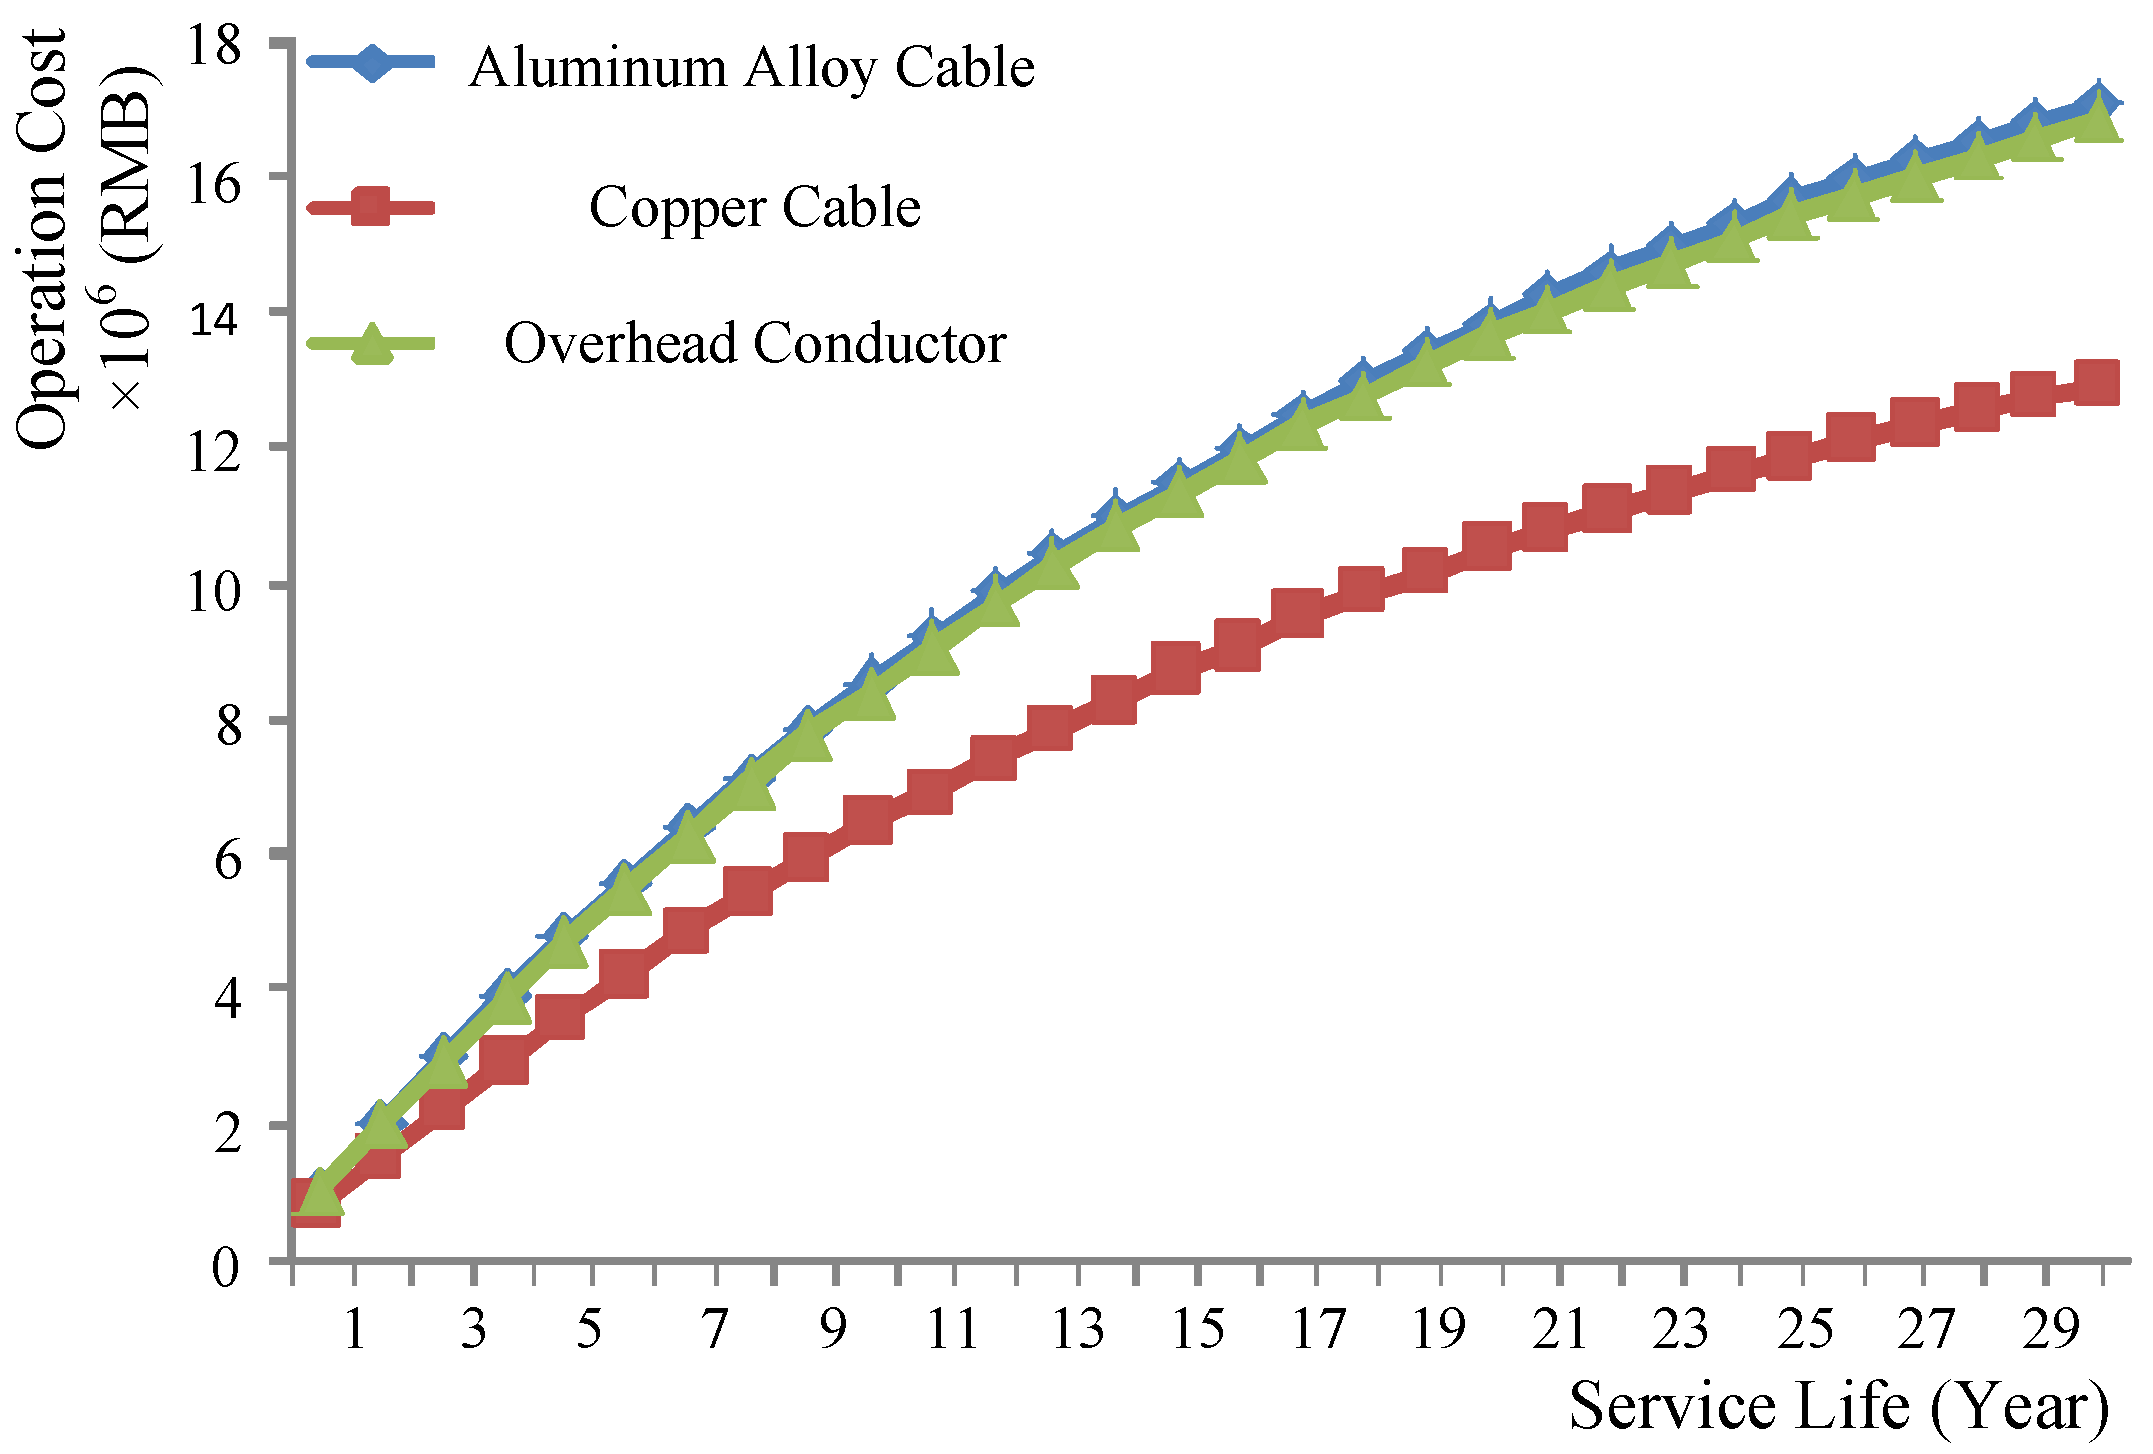
- Operation and maintenance cost:Figure 9 indicates that the overhead conductor is still the most economical line, but the aluminum alloy cable becomes the most expensive line in this period.
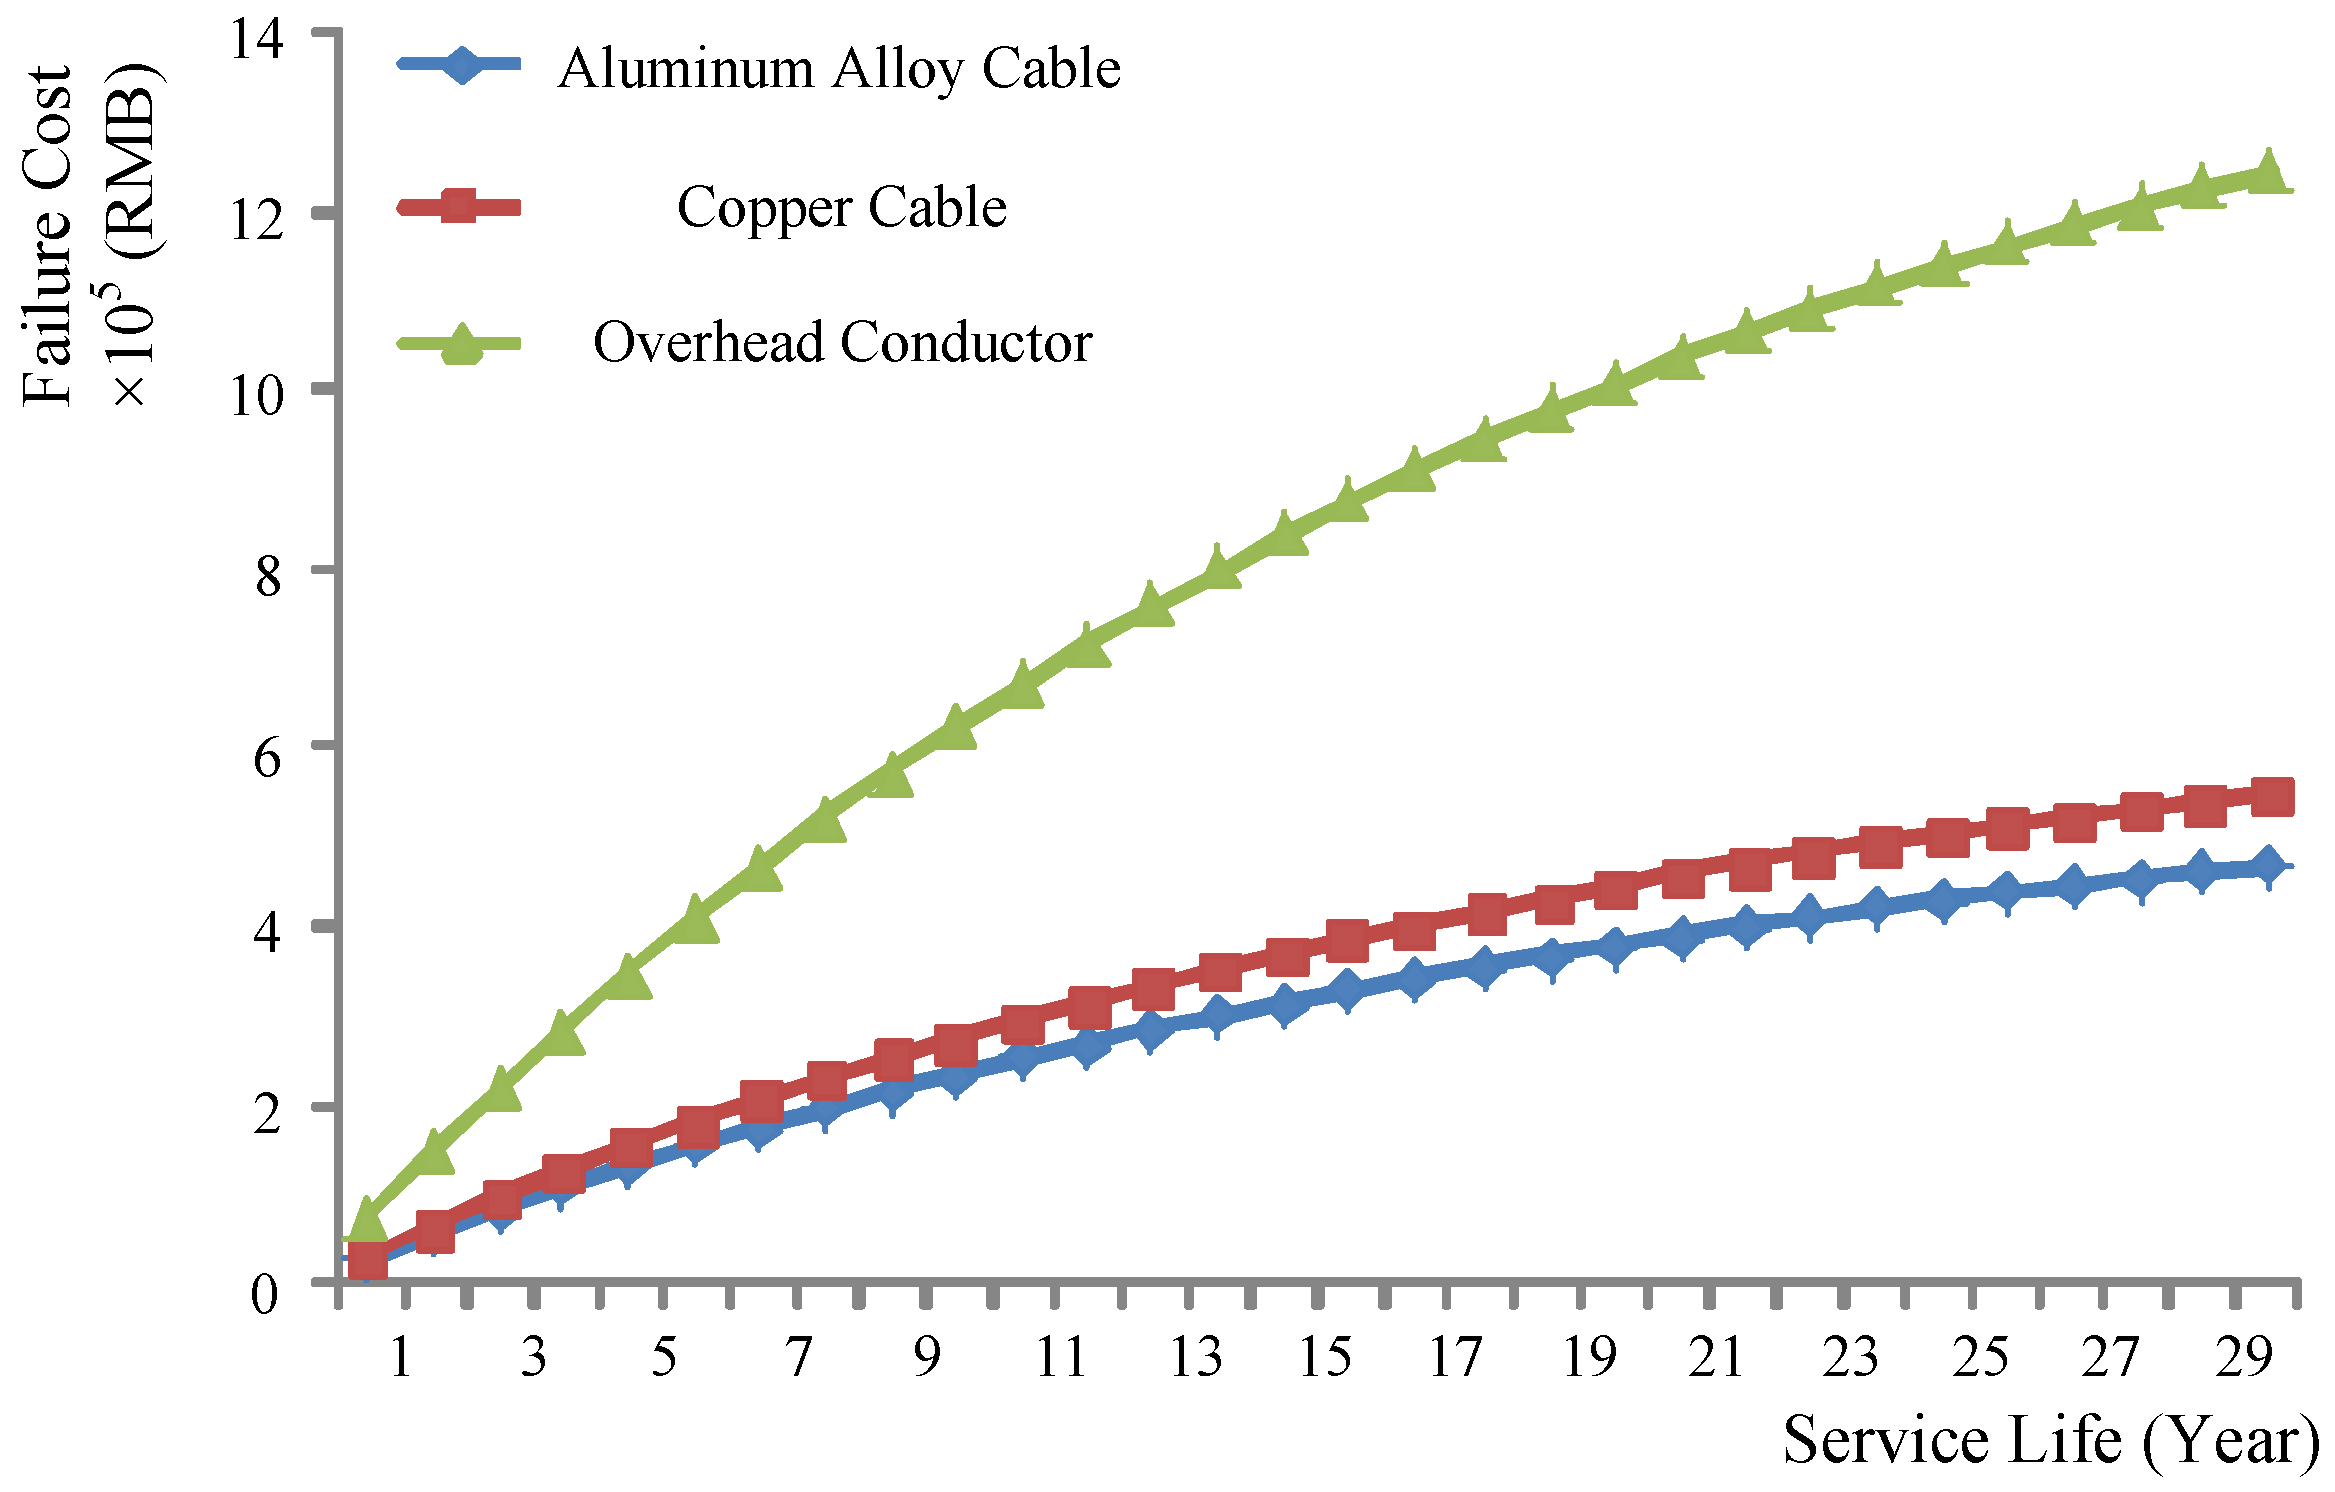
- Failure cost:From Figure 10, it can be seen that the aluminum alloy cable has the least failure cost, while the overhead conductor has the most.
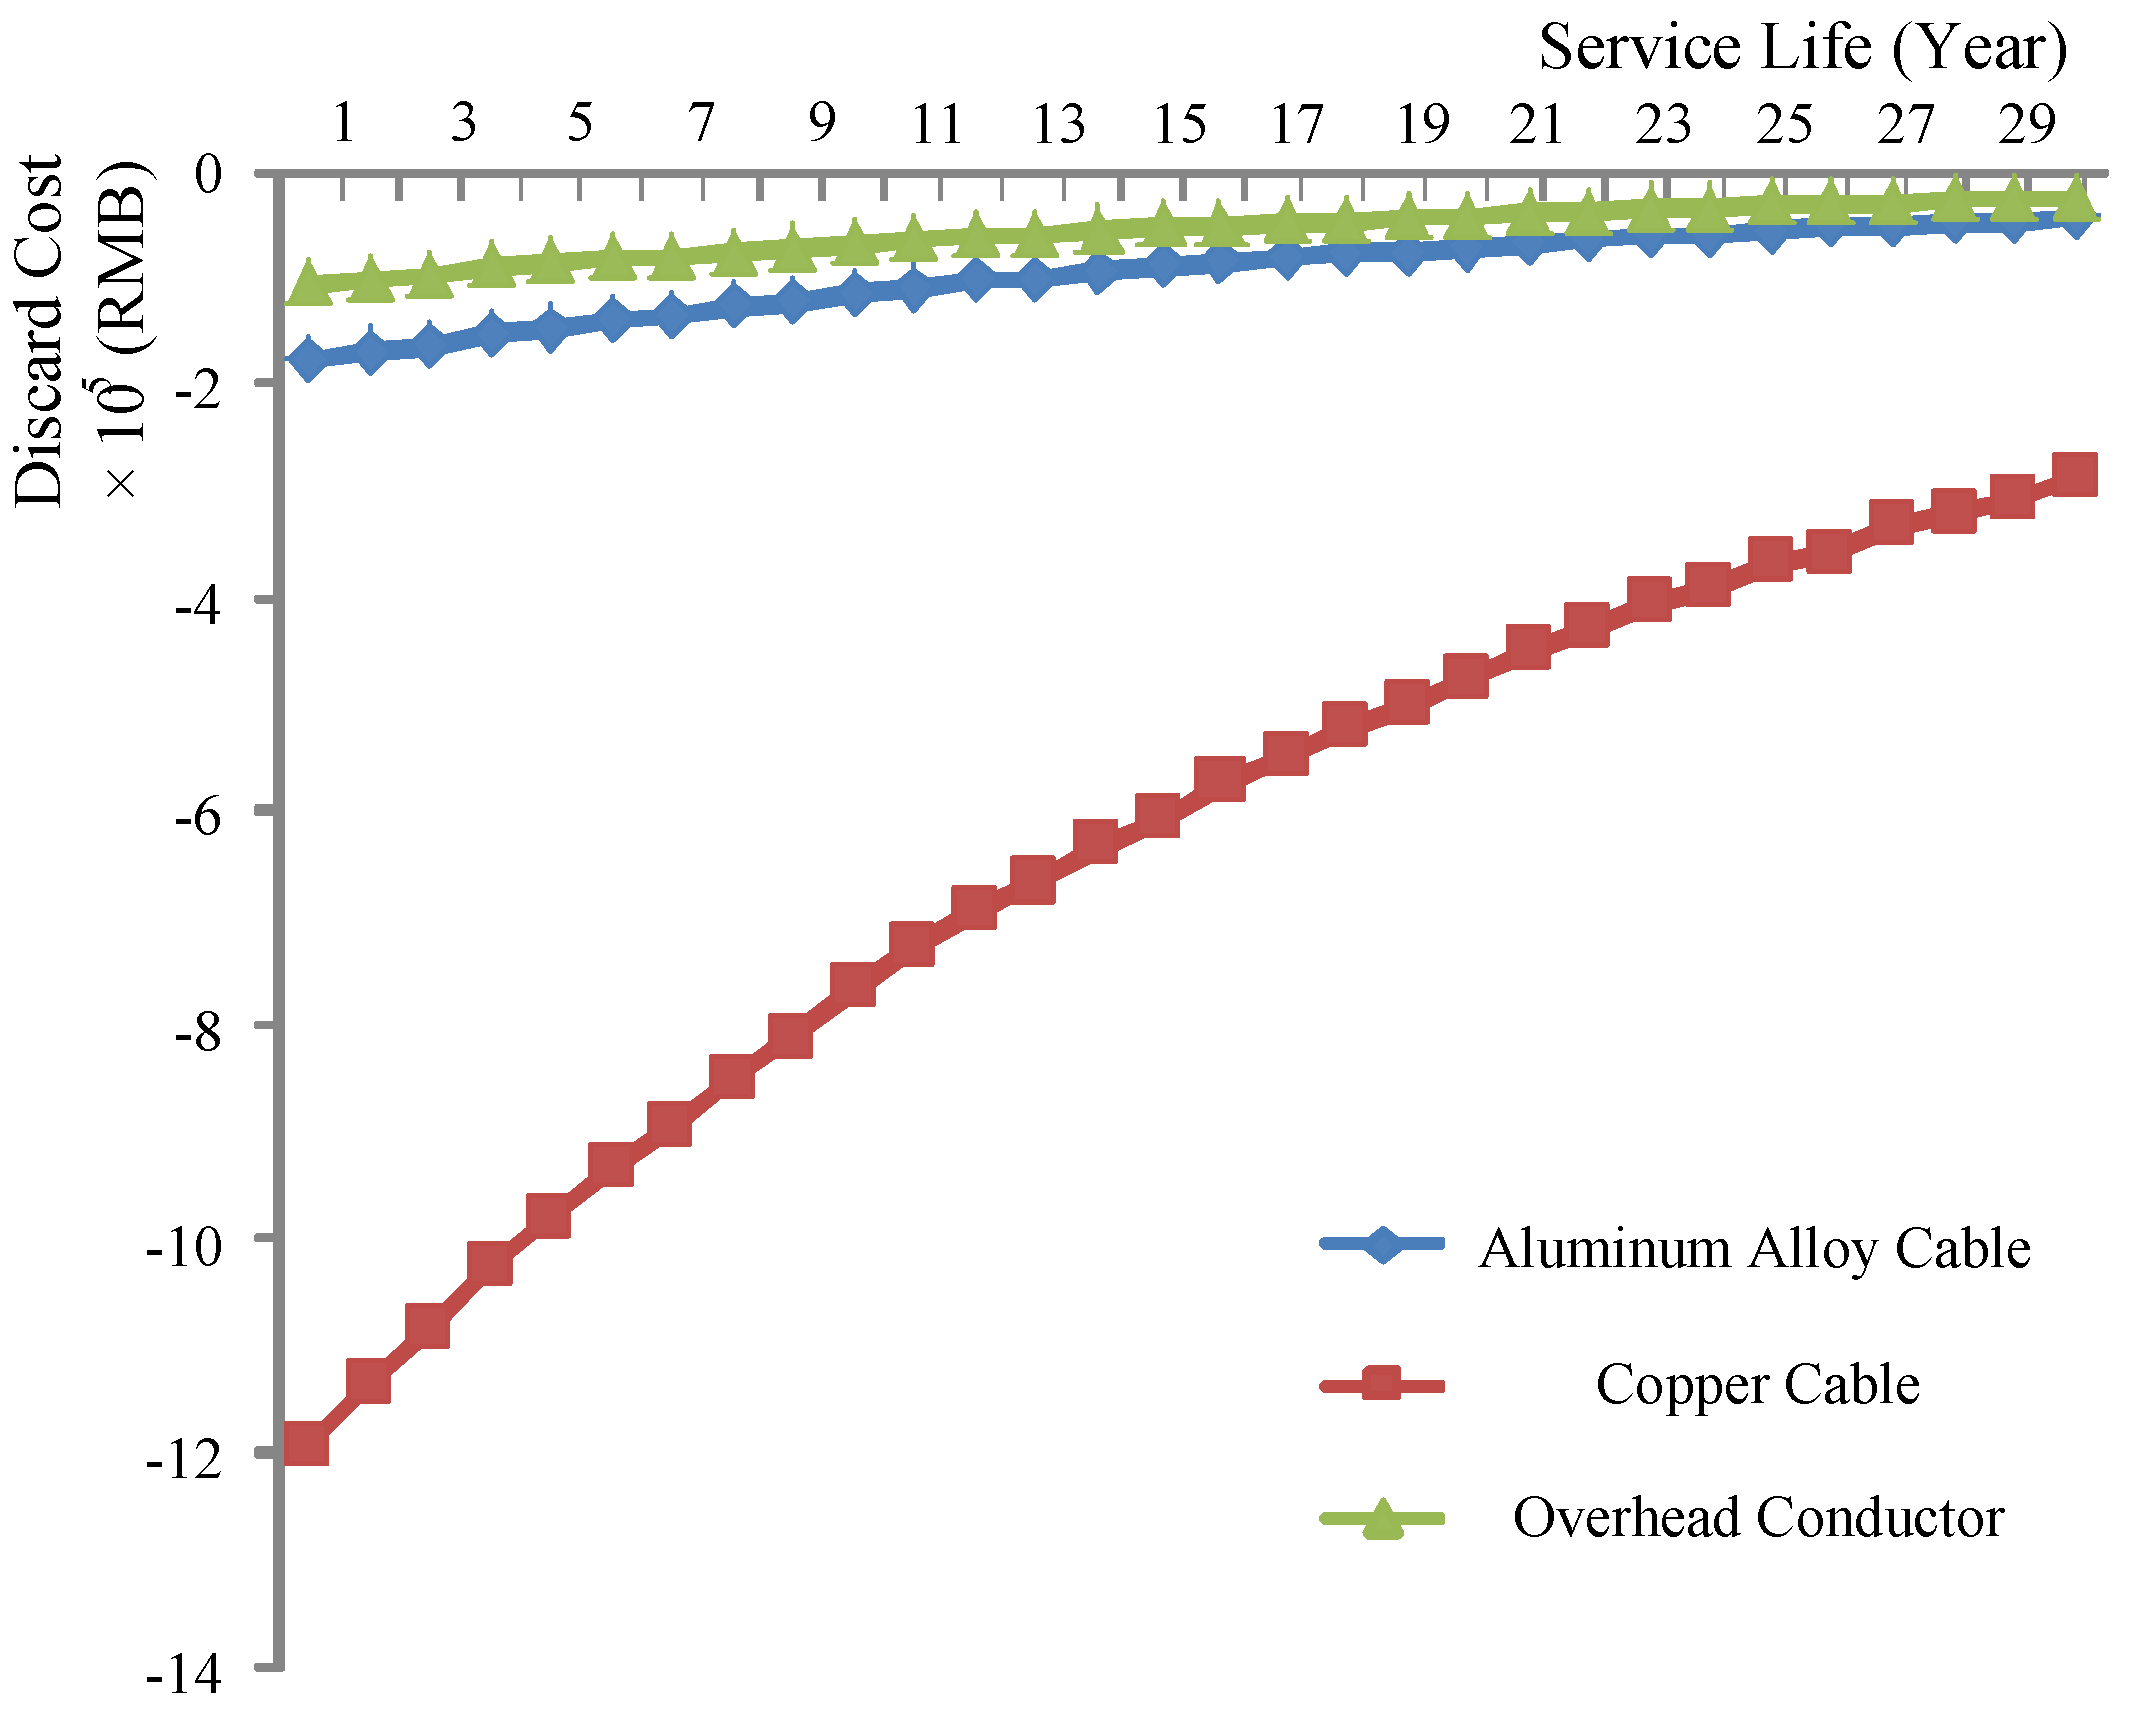
- Discard cost:Figure 11 illustrates that the copper cable has the least discard cost while the overhead conductor has the top cost. It is necessary to point out that the discard cost is negative because the residual cost of power lines is actually a kind of income. By recycling and selling the discard power line materials, the income can be used to offset the cost in other parts. As a result, the lower the discard cost is, the more it does to reduce the total LCC.
Influence degree of each part to LCC
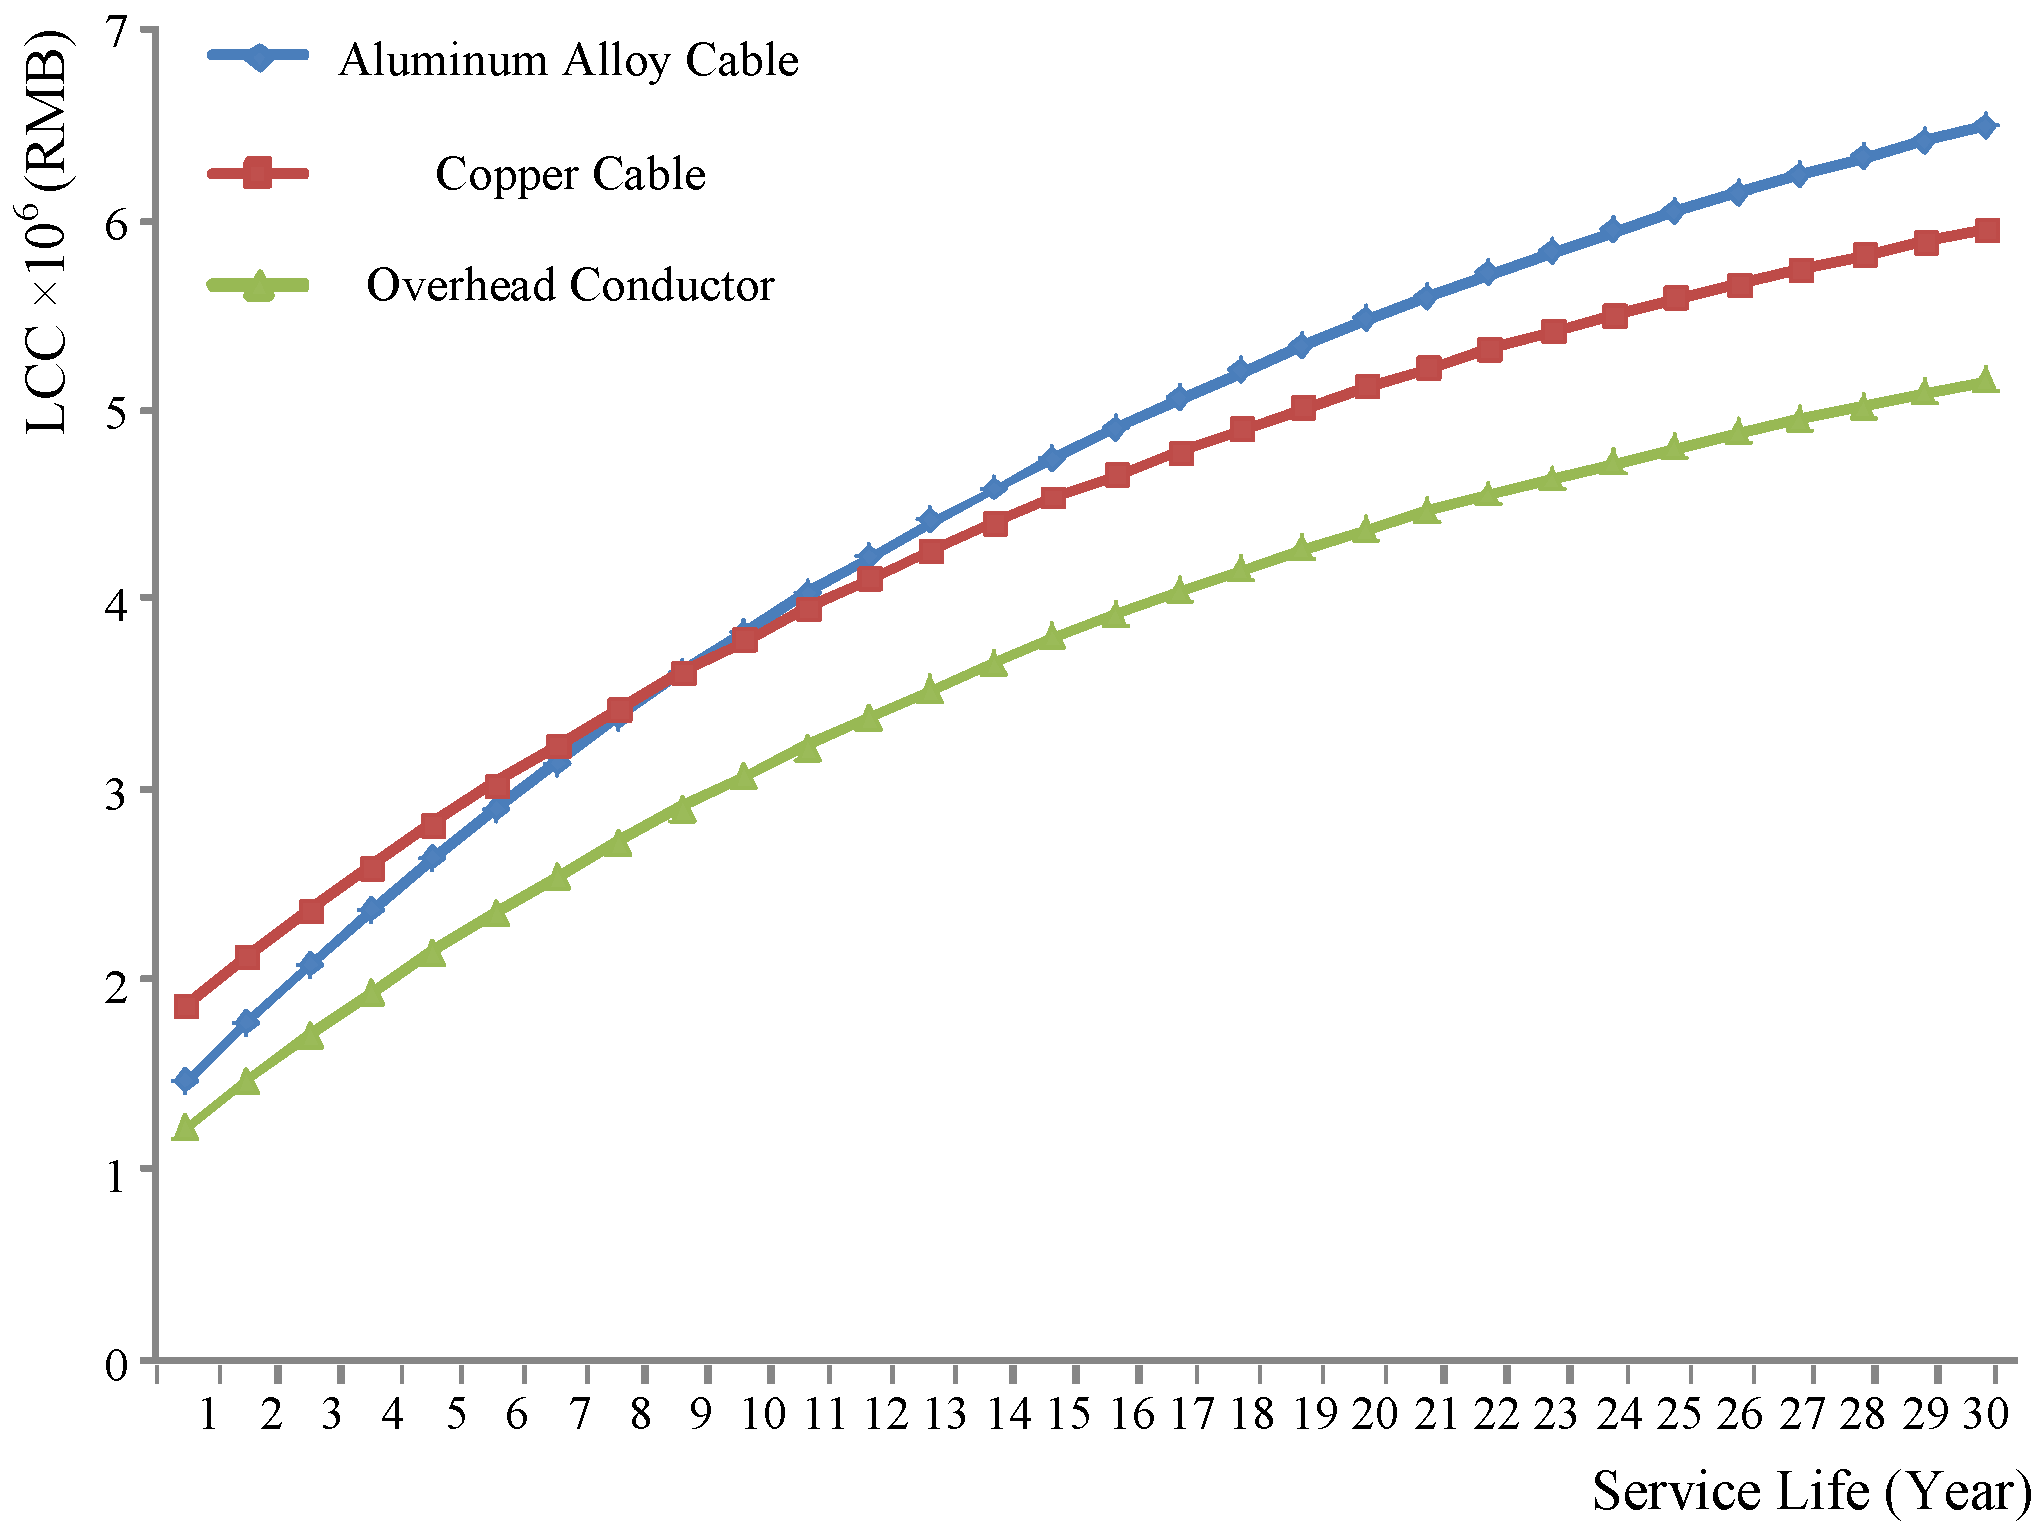
LCC balance point
3.3. Case 2
3.3.1. Case 2 Result Analysis
Each part of LCC
- Investment cost:Figure 13 shows that the investment cost of the overhead conductor is the least, while the investment cost of copper cable is the highest.
- Operation and maintenance cost:Figure 14 indicates that the operation and maintenance cost of copper cable is the least. However, the aluminum alloy cable and overhead conductor are similar.
- Failure cost:From Figure 15, it can be seen that the failure cost of aluminum alloy cable is less than copper, cable and the failure cost of copper cable is less than the overhead conductor.
- Discard cost:Figure 16 illustrates that the discard cost of copper cable is the least, while the discard cost of the overhead conductor is the most.
Influence degree of each part to LCC
LCC balance point
4. Conclusions
- Considering line length and capacity:When the line length is relatively short and its capacity is relatively small, the investment cost has the biggest influence on the LCC. Therefore, a low investment cost line is the better choice. However, when the line length is relatively long and its capacity is relatively large, the operation and maintenance cost takes the first place in the LCC, which leads to the low energy loss line becoming a better choice.
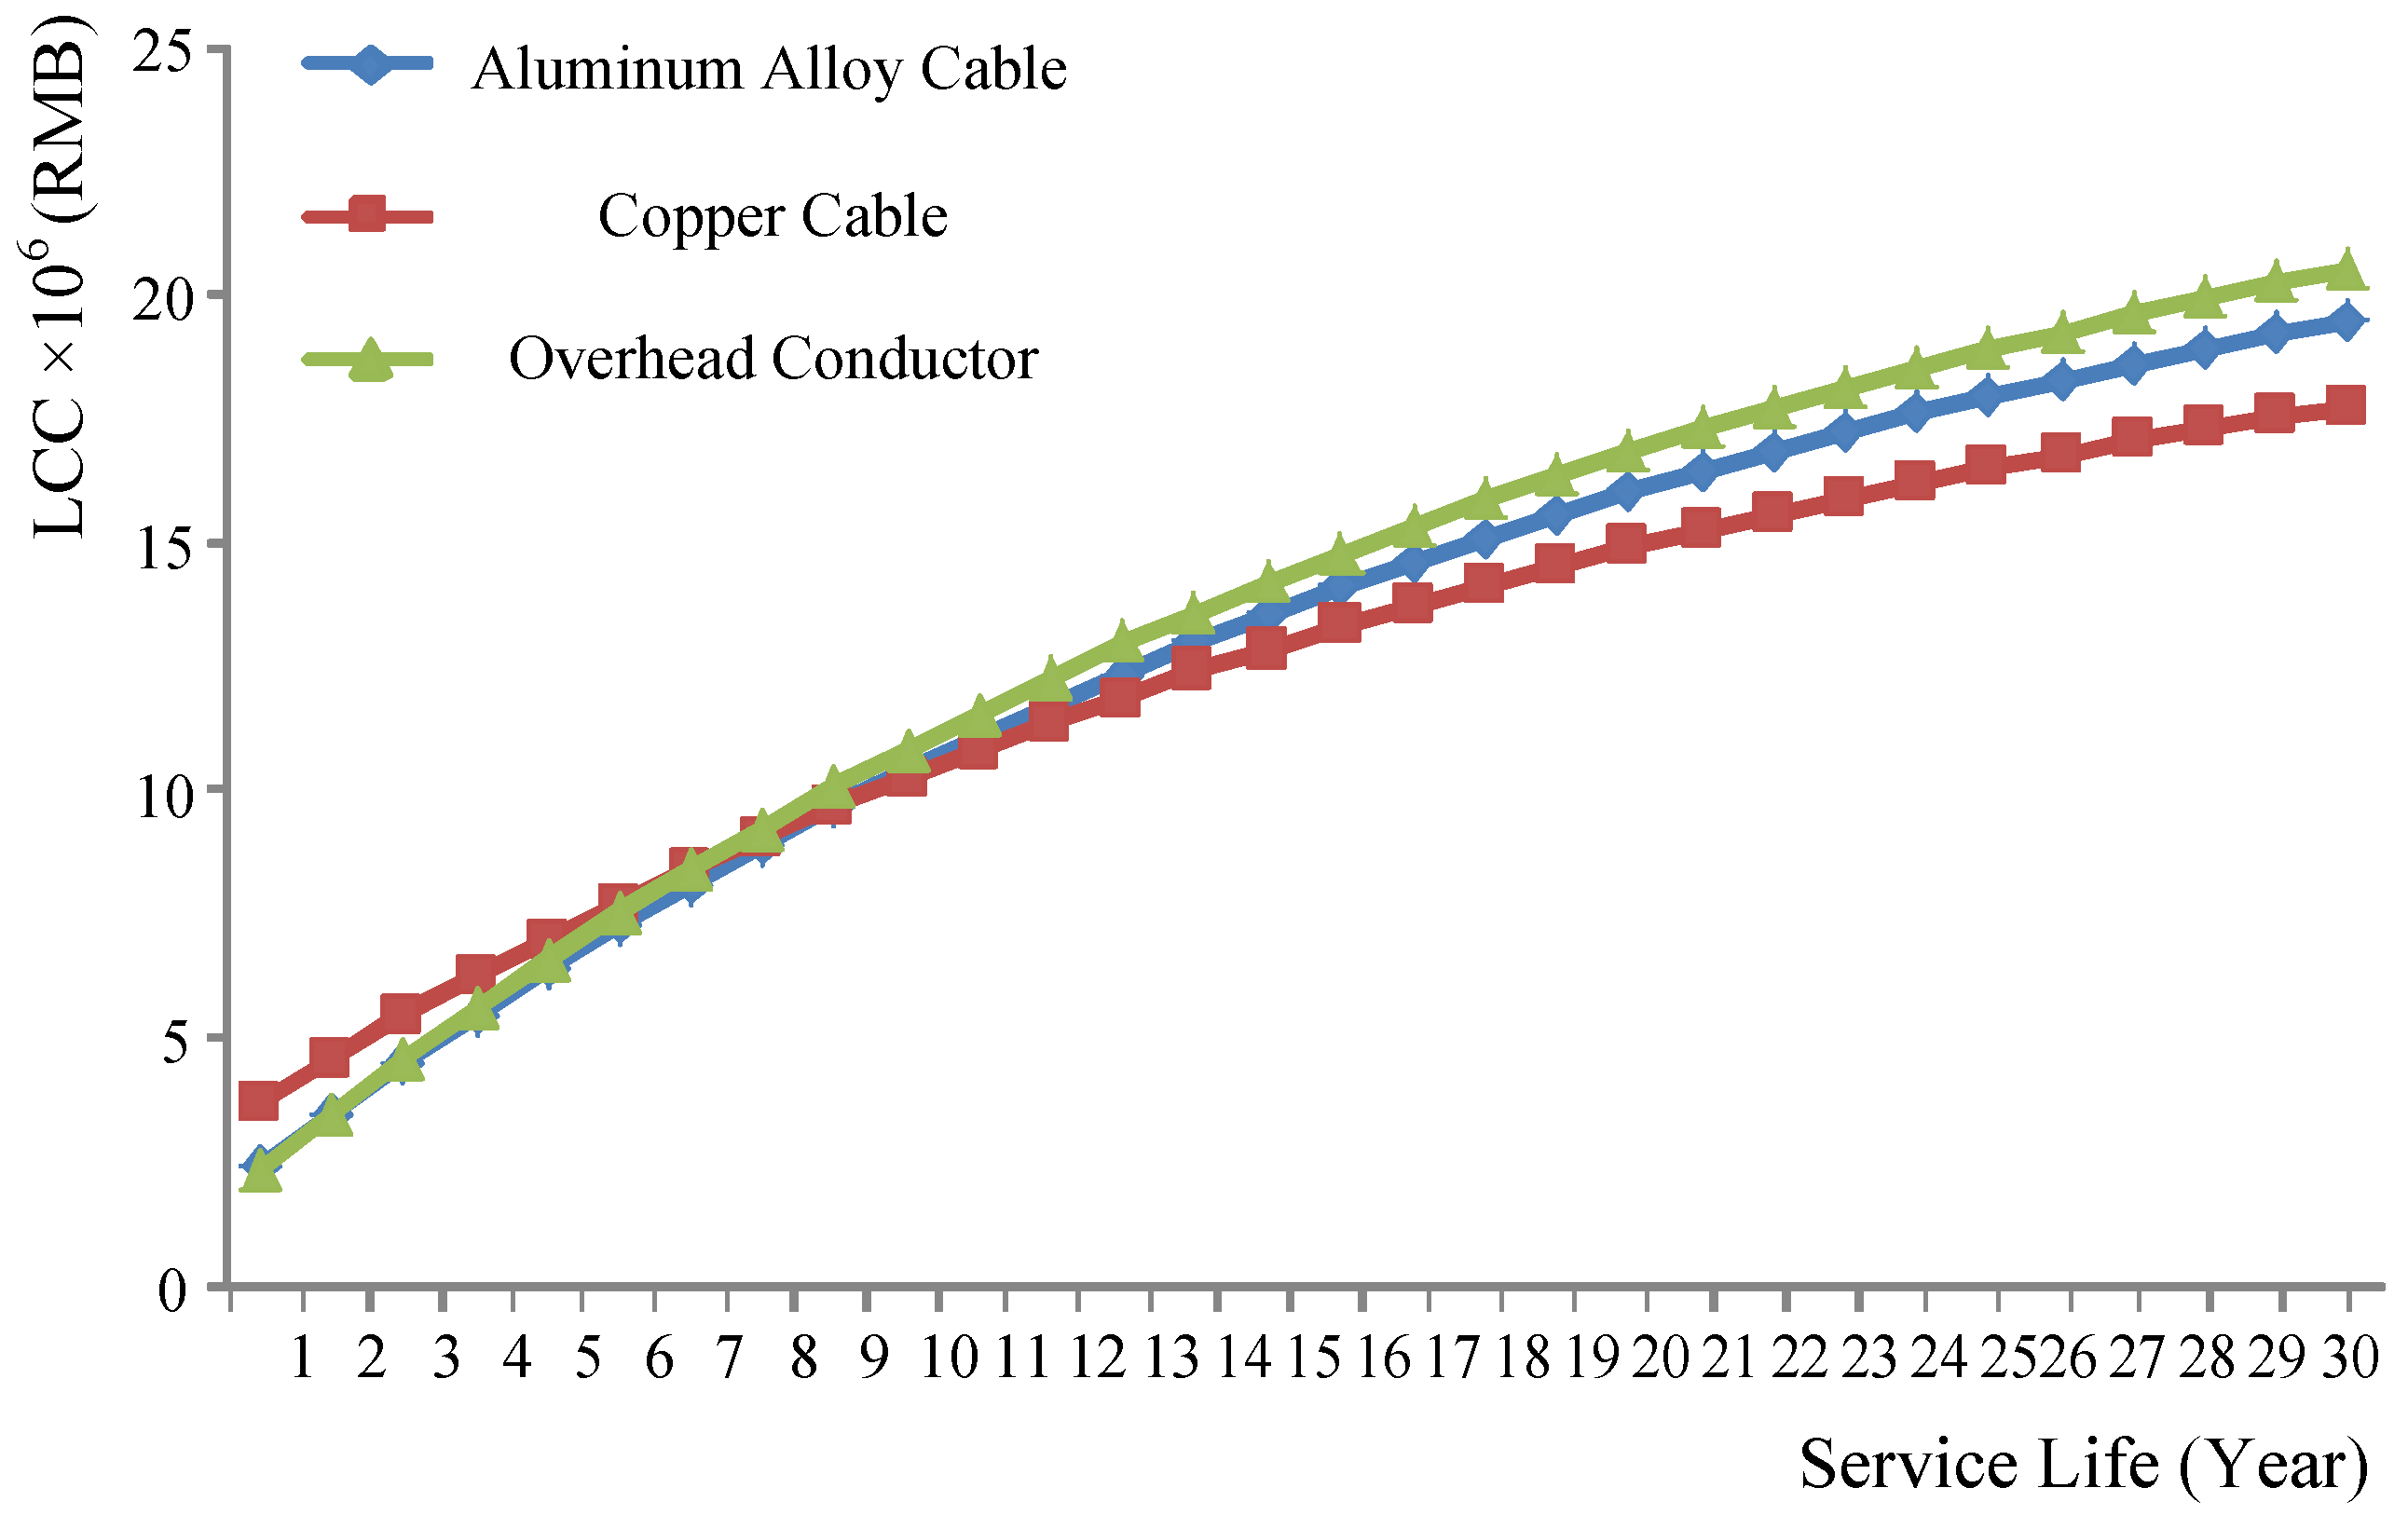
- Considering service life:When the service life is less than 10 years, the aluminum alloy cable or the overhead conductor is better than the copper cable. However, when the service life is more than 10 years, the copper cable is more economical.
Acknowledgments
Author Contributions
Conflicts of Interest
References
- Neumann, K.; Zimmermann, J. Procedures for Resource Leveling and Net Present Value Problems in Project Scheduling with General Temporal and Resource Constraints. Eur. J. Oper. Res. 2000, 127, 425–443. [Google Scholar] [CrossRef]
- Baroum, M.S.; Patterson, J.H. The Development of Cash Flow Weight Procedures for Maximizing the Net Present Value of a Project. J. Opera. Manag. 2014, 14, 209–227. [Google Scholar] [CrossRef]
- Anceaume, E.; Busnel, Y.; Gambs, S. Characterizing the Adversarial Power in Uniform and Ergodic Peer Sampling. In Proceedings of the 1st International Workshop on Algorithms and Models for Distributed Event Processing Collocated with the 25th International Symposium on Distributed Computing, Rome, Italy, 25–27 August 2011; pp. 12–19.
- Gorshkov, A.S.; Rymkevich, P.P.; Nemova, D.V.; Vatin, N.I. Method of calculating the payback period of investment for renovation of building facades. Constr. Unique Build. Struct. 2014, 2, 82–106. [Google Scholar]
- Mahlia, T.M.I.; Razak, H.A.; Nursahida, M.A. Life cycle cost analysis and payback period of lighting retrofit at the University of Malaya. Renew. Sustain. Energy Rev. 2011, 15, 1125–1132. [Google Scholar] [CrossRef]
- Georgakellos, D.A. Climate change external cost appraisal of electricity generation systems from a life cycle perspective: The case of Greece. J. Clean. Prod. 2012, 32, 124–140. [Google Scholar] [CrossRef]
- Hutchinson, T.; Burgess, S.; Herrmann, G. Current hybrid-electric powertrain architectures: Applying empirical design data to life cycle assessment and whole-life cost analysis. Appl. Energy 2014, 119, 314–329. [Google Scholar] [CrossRef]
- Perera, A.T.D.; Attalage, R.A.; Perera, K.K.C.K.; Dassanayake, V.P.C. Designing standalone hybrid energy systems minimizing initial investment, life cycle cost and pollutant emission. Energy 2013, 54, 220–230. [Google Scholar] [CrossRef]
- Katsigiannis, Y.A.; Georgilakis, P.S.; Karapidakis, E.S. Multiobjective genetic algorithm solution to the optimum economic and environmental performance problem of small autonomous hybrid power systems with renewables. IET Renew. Power Gener. 2010, 4, 404–419. [Google Scholar] [CrossRef]
- Georgilakis, P.S.; Hatziargyriou, N.D. A review of power distribution planning in the modern power systems era: Models, methods and future research. Electr. Power Syst. Res. 2015, 121, 89–100. [Google Scholar] [CrossRef]
- Li, M.J.; Ou, Y.Q.; Cai, D.H.; Mo, S.J.; Shen, H.Y. Research on Life-Cycle Reliability Costs of Transmission Lines. Smart Grid 2014, 4, 21–25. [Google Scholar] [CrossRef]
- Zhou, L.; Ge, Y.J. Determination of Discount Rate in Whole Life Economic Analysis. Shanghai Highway 2007, 26, 51–54. (In Chinese) [Google Scholar]
- DL/T 686-1999, Guide of Calculation of Grid Energy Loss; Electric Power Industry: Tokyo, Japan, 1999. (In Chinese)
- JB/T 10181-2000, Calculation of the Current Rating of Electric Cables; Electric Power Industry: Tokyo, Japan, 2000. (In Chinese)
- Patrik, H.; Vladimiro, M.; Manuel, A.M.; Lina, B. Multiobjective Optimization Applied to Maintenance Policy for Electrical Networks. IEEE Trans. Power Syst. 2007, 22, 1675–1682. [Google Scholar]
- Dang, P.; Su, H.; Liu, B.; Zheng, Q.; Zheng, W.; Wang, L. Life Cycle Assessment of Aluminum Alloy Cable and Copper Cable. J. Environ. Eng. Technol. 2014, 4, 74–79. [Google Scholar]
- Chen, Y.; Ma, L.; Mu, G.; Zhang, X.; Fan, G. Comparison Studies on Two Types of Accuracy Criteria for Short-term Load Forecast. Autom. Electr. Power Syst. 2003, 27, 73–77. [Google Scholar]
- Liu, G.; Cao, J.; Lu, Y.; Tan, G. Selection Criteria of High-voltage Aubmarine Cables for Offshore Wind Farms by Life Cycle Cost. High Volt. Eng. 2015, 41, 2674–2680. (In Chinese) [Google Scholar]
- Li, L.; Liu, F.; Xie, G. The Research on Overhead Line Selection Based on the Life Cycle Cost Theory. J. North China Electr. Power Univ. 2010, 37, 23–28. [Google Scholar]
- Yang, L.; Dai, Y.; Li, N. A Forecasting Method for Project Cost Probability at Completion Based on Monte Carlo Simulation. Comput. Simul. 2014, 31, 301–304. [Google Scholar]




| Parameter | AAC | CC | OC |
|---|---|---|---|
| Purchasing Cost of Wire (RMB) | 167,000 | 836,000 | 84,000 |
| Purchasing Cost of Accessories (RMB) | 751,100 | 754,200 | 813,500 |
| Land Acquisition Cost (RMB) | 800 | 800 | 400 |
| Design and Installation Cost (RMB) | 85,400 | 158,700 | 29,900 |
| Other Cost (RMB) | 70,600 | 71,000 | 22,500 |
| Parameter | AAC | CC | OC |
|---|---|---|---|
| Wire Length (m) | 1437 | 1437 | 1437 |
| Maximum Load Current (A) | 430 | 430 | 430 |
| Line Voltage (kV) | 10 | 10 | 10 |
| AC Resistance (Ω) | 0.131 | 0.0972 | 0.132 |
| Operating Hour of One Year (h) | 8760 | 8760 | 8760 |
| Annual Average Load Rate (%) | 45.66 | 45.66 | 45.66 |
| Frequency (Hz) | 50 | 50 | 50 |
| Phase Working Capacity (F) | 0.341 | 0.330 | 0 |
| Dielectric Loss Tangent | 0.008 | 0.008 | 0 |
| Parameter | AAC | CC | OC |
|---|---|---|---|
| Electricity Purchasing Price (RMB) | 0.4 | 0.4 | 0.4 |
| Electricity Sale Price (RMB) | 0.5 | 0.5 | 0.5 |
| Price Annual Increasing Rate (%) | 2.0 | 2.0 | 2.0 |
| Annual Discount Rate (%) | 5 | 5 | 5 |
| Inspection Cost (RMB) | 125,300 | 91,100 | 5600 |
| Inspection Cycle (times per year) | 1 | 1 | 1 |
| Maintenance Cost (RMB) | 6300 | 4353 | 5853 |
| Maintenance Cycle (times per year) | 12 | 12 | 12 |
| Recondition Cost (RMB) | 8350 | 6530 | 8780 |
| Recondition Cycle (times per year) | 12 | 12 | 12 |
| Parameter | AAC | CC | OC |
|---|---|---|---|
| Load Power (kW·h) | 4300 | 4300 | 4300 |
| Expectation of Load Forecasting Deviation Rate | 1.06 | 1.06 | 1.06 |
| Variance of Load Forecasting Deviation Rate | 0.66 | 0.87 | 0.95 |
| Failure Rate (times/year·100 km) | 2.2 | 2 | 2.1 |
| Average Failure Maintenance Time (h) | 8 | 8.8 | 6 |
| Coefficient between Indirect Failure Cost and Direct Failure Cost | 20 | 20 | 20 |
| Average Repair Cost (RMB/km) | 3740 | 3566 | 2114 |
| Parameter | AAC | CC | OC |
|---|---|---|---|
| Removal Disposal Cost (RMB) | 10,345 | 13,753 | 3129 |
| Subsequent Treatment Cost (RMB) | 2047.7 | 2047.7 | 8372 |
| Metal Weight of Wire (t/km) | 2.44 | 6.41 | 1.108 |
| Metal Weight of Accessories (t/km) | 0.3 | 0.3 | 1.0 |
| Recycling Price of Aluminum Alloy (RMB/t) | 12,110 | – | – |
| Recycling Price of Copper (RMB/t) | – | 30,800 | – |
| Recycling Price of Steel (RMB/t) | – | – | 5500 |
| Parameter | AAC | CC | OC |
|---|---|---|---|
| Purchasing Cost of Wire (RMB) | 817,000 | 3,249,000 | 288,000 |
| Purchasing Cost of Accessories (RMB) | 119,800 | 112,100 | 77,200 |
| Land Acquisition Cost (RMB) | 800 | 800 | 400 |
| Design and Installation Cost (RMB) | 467,500 | 597,000 | 865,500 |
| Other Cost (RMB) | 100,600 | 107,500 | 33,600 |
| Parameter | AAC | CC | OC |
|---|---|---|---|
| Wire Length (m) | 4908 | 4908 | 4908 |
| Maximum Load Current (A) | 495 | 495 | 495 |
| Line Voltage (kV) | 10 | 10 | 10 |
| AC Resistance (Ω) | 0.103 | 0.0788 | 0.132 |
| Operating Hour of One Year (h) | 8760 | 8760 | 8760 |
| Annual Average Load Rate (%) | 62.79 | 62.79 | 62.79 |
| Frequency (Hz) | 50 | 50 | 50 |
| Phase Working Capacity (F) | 0.382 | 0.370 | 0 |
| Dielectric Loss Tangent | 0.008 | 0.008 | 0 |
| Parameter | AAC | CC | OC |
|---|---|---|---|
| Electricity Purchasing Price (RMB) | 0.2 | 0.2 | 0.2 |
| Electricity Sale Price (RMB) | 0.5 | 0.5 | 0.5 |
| Price Annual Increasing Rate (%) | 2.0 | 2.0 | 2.0 |
| Annual Discount Rate (%) | 5 | 5 | 5 |
| Inspection Cost (RMB) | 250,600 | 182,200 | 18,800 |
| Inspection Cycle (times per year) | 1 | 1 | 1 |
| Maintenance Cost (RMB) | 4410 | 3208 | 1984 |
| Maintenance Cycle (times per year) | 12 | 12 | 12 |
| Recondition Cost (RMB) | 6614 | 4812 | 2976 |
| Recondition Cycle (times per year) | 12 | 12 | 12 |
| Parameter | AAC | CC | OC |
|---|---|---|---|
| Load Power (kW·h) | 4950 | 4950 | 4950 |
| Expectation of Load Forecasting Deviation Rate | 1.06 | 1.06 | 1.06 |
| Variance of Load Forecasting Deviation Rate | 0.66 | 0.87 | 0.95 |
| Failure Rate (times/year·100 km) | 2.2 | 2 | 2.1 |
| Average Failure Maintenance Time (h) | 8 | 8.8 | 6 |
| Coefficient between Indirect Failure Cost and Direct Failure Cost | 20 | 20 | 20 |
| Average Repair Cost (RMB/km) | 6588 | 10,980 | 2745 |
| Parameter | AAC | CC | OC |
|---|---|---|---|
| Removal Disposal Cost (RMB) | 17,666 | 23,486 | 5344 |
| Subsequent Treatment Cost (RMB) | 3496.9 | 3496.9 | 14,297 |
| Metal Weight of Wire (t/km) | 3.252 | 8.01 | 2.655 |
| Metal Weight of Accessories (t/km) | 0.3 | 0.3 | 1.0 |
| Recycling Price of Aluminum Alloy (RMB/t) | 12,110 | – | – |
| Recycling Price of Copper (RMB/t) | – | 30,800 | – |
| Recycling Price of Steel (RMB/t) | – | – | 5500 |
© 2016 by the authors; licensee MDPI, Basel, Switzerland. This article is an open access article distributed under the terms and conditions of the Creative Commons Attribution (CC-BY) license (http://creativecommons.org/licenses/by/4.0/).
Share and Cite
Zhu, Z.; Lu, S.; Gao, B.; Yi, T.; Chen, B. Life Cycle Cost Analysis of Three Types of Power Lines in 10 kV Distribution Network. Inventions 2016, 1, 20. https://doi.org/10.3390/inventions1040020
Zhu Z, Lu S, Gao B, Yi T, Chen B. Life Cycle Cost Analysis of Three Types of Power Lines in 10 kV Distribution Network. Inventions. 2016; 1(4):20. https://doi.org/10.3390/inventions1040020
Chicago/Turabian StyleZhu, Zhenyu, Siyao Lu, Bingtuan Gao, Tao Yi, and Bin Chen. 2016. "Life Cycle Cost Analysis of Three Types of Power Lines in 10 kV Distribution Network" Inventions 1, no. 4: 20. https://doi.org/10.3390/inventions1040020
APA StyleZhu, Z., Lu, S., Gao, B., Yi, T., & Chen, B. (2016). Life Cycle Cost Analysis of Three Types of Power Lines in 10 kV Distribution Network. Inventions, 1(4), 20. https://doi.org/10.3390/inventions1040020


