Article

A Two-Plane Proton Radiography System Using ATLAS IBL Pixel-Detector Modules

1
Department of Physics, TU Dortmund University, D-44221 Dortmund, Germany
2
West German Proton Therapy Centre Essen, D-45122 Essen, Germany
3
West German Cancer Center, D-45122 Essen, Germany
4
University Hospital Essen, D-45122 Essen, Germany
*
Author to whom correspondence should be addressed.
Instruments 2025, 9(4), 23; https://doi.org/10.3390/instruments9040023
Submission received: 26 August 2025 / Revised: 8 October 2025 / Accepted: 9 October 2025 / Published: 14 October 2025
(This article belongs to the Special Issue Medical Applications of Particle Physics, 2nd Edition)

Abstract

Accurate knowledge of a patient’s anatomy during every treatment fraction in proton therapy is an important prerequisite to ensure a correct dose deposition in the target volume. Adaptive proton therapy aims to detect those changes and adjust the treatment plan accordingly. One way to trigger a daily re-planning of the treatment is to take a proton radiograph from the beam’s-eye view before the treatment to check for possible changes in the water equivalent thickness (WET) along the path due to daily changes in the patient’s anatomy. In this paper, the Two-Plane Imaging System (TPIS) is presented, comprising two ATLAS IBL silicon pixel-detector modules developed for the tracking detector of the ATLAS experiment at CERN. The prototype of the TPIS is described in detail, and proof-of-principle WET images are presented, of two-step phantoms and more complex phantoms with bone-like inlays (WET 10 to 40 mm). This study shows the capability of the TPIS to measure WET images with high precision. In addition, the potential of the TPIS to accurately determine WET changes over time down to 1 mm between subsequently taken WET images of a changing phantom is shown. This demonstrates the possible application of the TPIS and ATLAS IBL pixel-detector module in adaptive proton therapy.

1. Introduction

Proton therapy is a common modality for cancer treatment, taking advantage of the high dose conformity due to the characteristic Bragg peak in the depth dose curve. This conformity is sensitive to uncertainties of the proton range in tissue. Among other things, variations in the patient’s anatomy between treatment fractions (inter-fractional changes) are the most significant contributors to range uncertainties [1]. An example is varying mucus filling of the nasal or sinus cavities when treating sinonasal tumors [2]. Therefore, re-planning of the treatment in terms of an (online) adaptive therapy needs to be considered [3,4]. Since the additional imaging dose applied by a CT scan counter indicates a daily re-scanning, a daily low-dose proton radiography scan of the patient directly before the treatment could be used to trigger a re-planning by comparing the image with an expected one [4,5,6,7].
Several collaborations are investigating proton and ion imaging using various detection systems comprising a complex setup of tracking and range detectors to obtain a highly resolved image of the water equivalent thickness (WET) projection along the beam direction onto a virtual image plane [8,9,10,11,12,13]. To replace large range detectors needed to stop the protons entirely, an effort was made to use thin pixelated semiconductor detectors, such as the Timepix detector, to measure the particle energy, which was successfully demonstrated in the publication of Metzner et al. [14]. The approach is to measure the WET along a proton path by detecting the two-dimensional deposited energy distribution in a thin sensor behind the phantom. To obtain a high WET resolution, the detector needs to be placed in the steep part of the depth dose curve.
This paper demonstrates the feasibility of a WET measurement system based on ATLAS IBL pixel-detector modules, which were originally designed for the particle tracking unit of the ATLAS experiment at CERN [15].
We introduce the Two-Plane Imaging System (TPIS), comprising two of those pixel-detector modules separated by a plastic absorber placed directly behind the irradiated object. The first detector is used to measure highly resolved proton transmission images for defining tissue contours, and the second detector is used to obtain the spatial WET distribution (WET images). The TPIS is designed to be compact and easy to integrate into routine clinical workflows, including operation under standard therapeutic beam intensities. Its intended application is the detection of anatomical changes along the treatment beam path, achieved with spatial resolution sufficient to support structure-based verification that the imaged patient section remains consistent across consecutive acquisitions. The approach presented, therefore, does not involve individual proton tracking with estimation of the most likely path, but only transmission imaging and spatially resolved residual energy measurement behind the patient [16].
The ATLAS IBL detector module offers high radiation hardness, high spatial resolution, and detection of a single particle’s position and deposited energy. A special challenge is the low measurement resolution of the deposited charge, which is designed for high-energy particle tracking rather than the large charge deposited by therapeutic proton beams. Previous studies investigating the application of the IBL detector module in the context of quality assurance in proton therapy showed promising results in detecting the proton’s energy accurately despite the low deposited charge resolution [17].
The present paper reports proof-of-principle WET image measurements using the TPIS for phantoms in the WET range between 10 and 40 mm. This range covers WET values occurring in small animal irradiation [18] and the lower WET range in sinonasal tumor treatment [2]. The first part of this study characterizes the accuracy of WET images of a two-step phantom. The second part of the paper investigates the accuracy of a WET difference or contrast detection between the two WET steps of the step phantom. Considerations about the influence of varying imaging doses on the image quality are discussed. As a step towards the application of the TPIS in terms of adaptive proton therapy, the last part of this study focuses on the capability of the TPIS to measure changes in WET over time between consecutive images of a variable-thickness phantom.

2. Materials and Methods

2.1. ATLAS IBL Pixel-Detector Module

The ATLAS IBL pixel-detector module is a hybrid silicon pixel detector designed as a tracking detector for the ATLAS experiment at CERN [19]. The sensor matrix is separated into 336 × 80 pixels with a pixel size of 50 μm × 250 μm. Each pixel is connected individually to the corresponding analog readout circuit in the IBL readout chip. When an ionizing particle hits the sensor, it deposits energy according to its stopping power, generating a corresponding amount of charge.
In the analog readout of the pixel that is hit, the charge signal is amplified with an adjustable gain and then digitized by a discriminator using an adjustable threshold. The duration of the discriminator output signal is proportional to the amount of charge generated and hence to the deposited energy. It can thus be measured using the time-over-threshold (ToT) approach.
Since the IBL detector module is designed for operation at the LHC accelerator, with a collision frequency of 40 MHz, the ToT measurement and triggering of the detector are conducted with the same frequency. Thus, one unit of ToT corresponds to 25 n s and 13 bins are available.
The IBL detector module uses a data-driven readout, meaning that while reading out one pixel, the other pixels are active and ready to measure additional hits. A stored hit can be read out using an externally generated trigger. It is possible to set a variable sensitive window up to 16 × 25  n s = 400  n s per trigger to measure small deposited charges that can be delayed due to timewalk. In the work at hand, a sensitive window of 3 × 25  n s = 75  n s is used.

2.2. Experimental Setup and Working Principle

2.2.1. The Two-Plane Imaging System Prototype

The Two-Plane Imaging System (TPIS) prototype consists of two ATLAS IBL pixel-detector modules separated by a PMMA absorber, as shown in the left panel in Figure 1.
A dedicated imaging field is used with an initial energy E kin , init (here 103 M e V ) set high enough, so that the protons pass through the phantom and the TPIS. The protons lose a certain amount of kinetic energy according to the WET along the path through the phantom, leading to varying residual energy when arriving at the TPIS. The upstream detector is used to image contours of the phantom by taking a transmission image. Because the energy resolution of the upstream detector is insufficient at higher kinetic energies, the protons are subsequently decelerated in the PMMA absorber before passing through the downstream detector. The downstream detector measures their residual energy, which is used to determine the WET distribution across the imaged section of the phantom (WET image).
Figure 2 shows the deposited charge in 50 μm-thick silicon for the relevant proton energies calculated using the stopping power table of the NIST pstar database [20]. The change in deposited charge Δ Q dep is more sensitive to phantom WET changes for lower proton energies due to the steepening slope of the stopping power. To minimize multiple Coulomb scattering effects, the upstream detector is placed in the shallow part of the deposited charge curve at proton energies between 75 and 95 M e V in the setup used. This energy regime is represented by the single red dashed line at 80 M e V in Figure 2. A phantom WET change of 0.8   c m results in the proton energy change Δ E kin . The corresponding small difference in measured deposited charge Δ Q dep leads to a low WET resolution using the upstream detector. Hence, the PMMA absorber is used to further slow down the protons to energies between 25 and 60 M e V before they impinge on the downstream detector. This range is represented by the red dashed line at 43 M e V in Figure 2. Here, the same WET change of 0.8   c m with the corresponding kinetic energy change Δ E kin results in the larger deposited charge difference Δ Q dep . Thus, the WET resolution is higher using the downstream detector.
The TPIS is intended to be used for triggering an adaptation of the treatment plan whenever a change in WET occurs within the imaged region of the patient. For this application, the initial proton energy and absorber thickness would be chosen such that the WET of the relevant part of the imaged section could be measured with high resolution. The expected WET, derived from the planning CT, together with the corresponding residual proton energy at the downstream detector, would define the operating point of the TPIS. Around this operating point, variations in WET could be detected with high sensitivity. Figure 2 illustrates an example operating point at 43 M e V .
The photo in the right panel of Figure 1 shows the TPIS prototype used for the proof-of-principle measurement. The first detector uses a 100 μm-thick silicon sensor and the second detector a 50 μm-thick silicon sensor to keep the deposited charge below the upper limit of processable charges of 100 ke of the ATLAS IBL readout chip [21]. The depletion voltages of the 100 μm- and 50 μm-thick sensors were measured to be 10 V and 2 V , respectively. The sensors are operated in over-depletion at bias voltages of 35 V and 30 V . The PMMA absorber between both detectors has a total thickness of 3.12   c m . Absorber thickness and an initial kinetic energy of 103 M e V are set to minimize the dose in the phantom while maximizing the WET resolution for the investigated WET range between 10 and 40 m m . The output of a scintillator detector mounted downstream of the TPIS is gated with a 4 k Hz signal using a trigger logic unit (TLU). Using this signal to trigger data readout, the system can be operated at clinical beam intensity.

2.2.2. Beam Characteristics and Imaging Dose

All measurements presented in this paper were performed in the fixed-beam treatment room of the West German Proton Therapy Centre Essen (WPE) using a Pencil Beam Scanning (PBS) nozzle (ProteusPlus system, IBA PT, Louvain-la-Neuve, Belgium). Proton beam energies in the range of 100 to 227 M e V are available [22].
For the measurements presented here, the TPIS was installed in the isocenter of the beam line perpendicular to the beam direction. The proton field consisted of one pencil beam with an initial proton energy of ( 103.0 ± 0.6 ) M e V and spot size of 0.79   c m ( 1 σ ) for each measurement. Both values were interpolated based on commissioning data provided by the WPE [22].
The trigger frequency of the used readout system is limited to 4 k Hz . To yield a sufficient image quality, around 3000 to 4500 hits per pixel (hits/pxl) need to be measured. This corresponds to an imaging dose of approximately 48 to 72 Gy . Image measurements were taken in multiple single data acquisitions, each using an imaging dose of 24 Gy at a clinical beam intensity.

2.2.3. Phantoms

In medical imaging, a phantom is an artificial object that simulates human tissue, used to test and calibrate imaging systems without exposing patients to radiation. Phantoms may either replicate human anatomy or consist of simplified material blocks. The phantoms used in this work are shown in Figure 3. All phantoms were 3D printed with standard polylactic acid (PLA, Material4Print, yellow or pink) or PLA mixed in equal proportions by weight with granite powder (gPLA, gray StoneFil, FormFutura, gray). According to Lascaud et al. [18], standard PLA can be used as organ tissue imitation and gPLA as bone-like tissue in the proton therapy context.
For the charge-to-WET calibration, 42 × 44  m m large PLA slabs were printed with four different thicknesses, resulting in target WET values of 1, 2.5, 5, and 10 m m . Those plates are stackable to obtain a block of desired WET. They were mounted in front of the TPIS using screws. The resulting ten different WET values were measured for each individual stack of slabs using the MLIC Giraffe detector (IBA Dosimetry, Schwarzenbruck, Germany) according to the procedure described by Behrends et al. [23]. They range from ( 5.70 ± 0.01 ) to ( 39.40 ± 0.02 ) mm and are listed under the title Calibration Phantom in Table 1. In addition, the thicknesses of the slabs were measured using a standard micrometer screw gauge and summed up to the total thicknesses of each stack of slabs listed in Table 1. The water equivalent ratio (WER) is also listed there and is calculated by dividing the WET by the corresponding material thickness [24].
In order to study the precision and trueness of WET maps measured with the TPIS, two 42 × 44  m m large two-step standard PLA phantoms with a WET difference of around 1 and 5 m m were used. The 1 m m contrast phantom is shown in Figure 3b. To obtain the seven different WET contrasts at the specific base WET values listed in Table 1 (Step Phantom), the corresponding step phantom was mounted in front of a stack of the calibration plates shown in Figure 3a.
To simulate a relevant case for online adaptive radiotherapy, where the WET of a structure in a phantom changes between subsequently taken images, a more complex rectangular cuboid phantom was used (Figure 3c). The cuboid is ( 35 × 35 )  m m 2 large and 24 m m thick in beam direction. A ( 9.9 × 9.9 × 9.9 ) m m 3 large cube and ( 6.9 × 6.9 × 15 ) m m 3 large arms can be placed in the phantom (Figure 3d). The cube was printed once with PLA and once with gPLA. Two arms were printed as a stack of 3.95   m m thick gPLA and 2.95   m m thick PLA. To later obtain the total WET along the beam path, the actual material thicknesses t in beam direction (perpendicular to cross-section planes shown in Figure 3) were measured using a micrometer screw gauge and listed in Table 1 (Complex Phantom) for each position (1 to 6 in Figure 3c) and for the two small cube inlays. For the arm inlay, the thickness of each material part was measured using a caliper. The listed corresponding WET values were calculated by multiplying the material thicknesses by the respective WER. For PLA, the WER is 1.163 ± 0.002 by calculating the weighted mean [25] of the WER values for material thicknesses below 26 m m of the calibration phantom. The WER used for gPLA is 1.25 ± 0.01 and was measured using a 19.7   m m thick 3D printed gPLA block with fill factor of 100% at beam energies of 90 to 110 M e V in the same way as described for the calibration phantoms.

2.2.4. Data Post-Processing

The charge cloud generated in the sensor by an ionizing particle can be detected by several adjacent pixels (charge sharing) [26]. Hence, hits in neighboring pixels that appear only 25 n s apart from each other are summarized to a cluster. The measured ToT in each pixel of the cluster is transferred to the corresponding charge using the pixel-wise ToT-to-charge calibration. By adding up the partial charges, the total cluster charge is determined. It is assigned to the pixel corresponding to the cluster charge-weighted center of gravity. The readout circuit of the first detector (100 μm-thick sensor) is tuned to a dynamic range of 13.5 to 76.6 ke. For the second detector (50 μm-thick sensor), the dynamic range is adjusted to 8.9 to 85.7 ke. To calculate the truncated mean Q ¯ dep of the cluster charges assigned to a pixel, only charges between the individual two charge thresholds are taken into account. By counting the number of those clusters per pixel, a transmission image is obtained in addition.
The uncertainty of the mean deposited charge per pixel is estimated using the standard error of the mean (SEM) with the sample standard deviation of the cluster charges measured by the pixel. To obtain a sufficiently low uncertainty for Q ¯ dep , superpixels are formed, consisting of five pixels in the row dimension and one pixel in the column dimension. Hence, the new pixel size is 250 μm × 250 μm. For the formation of superpixels, Q ¯ dep is calculated by averaging the cluster charges registered in the corresponding sub-pixels. An example of the originally measured mean deposited charge map for the homogeneous phantom with WET = 32.18  m m is shown in Figure 4 on the left side. On the right side, the corresponding downsampled mean deposited charge map using the superpixels is shown. Masked pixels are displayed in white.

2.3. First Detector: Determining Image Contours

Since the protons undergo scattering only in the phantom before they impinge on the first detector, the higher resolved transmission image measured with it is used to determine contours in the WET projection image. Those contours can be employed to obtain landmarks, such as prominent tissue structures, to do a structure-based verification of the imaged patient section. Additionally, they help define regions of interest (ROIs) in the image, where, e.g., an anatomical change is expected. In Figure 5, the transmission image taken with the first detector is shown on the left side for the rectangular cuboid phantom shown in Figure 3c arranged as the setup (a) in Figure 9.
Tissue boundaries appear as an image feature due to multiple Coulomb scattering in the tissue. This imaging technique was initially described by Cookson in 1974 [27]. As a first post-processing step, the underlying intensity profile of the single pencil beam spot in the center of the image is determined using a two-dimensional Gaussian fit. Its iso-intensity lines are displayed as white circles in the left image of Figure 5. The transmission image is divided by the Gaussian fit result to obtain an image in which only areas around tissue edges show a significant deviation from 1. Subsequently, the Canny edge finder algorithm [28] is applied to this ratio image. The found tissue edges are shown as white dots in the ratio image shown on the right side of Figure 5. Those contours are later mapped onto the calculated WET image employing the second detector measurement. The WET image acquisition is described in the following Section.

2.4. Second Detector: WET Image Calculation

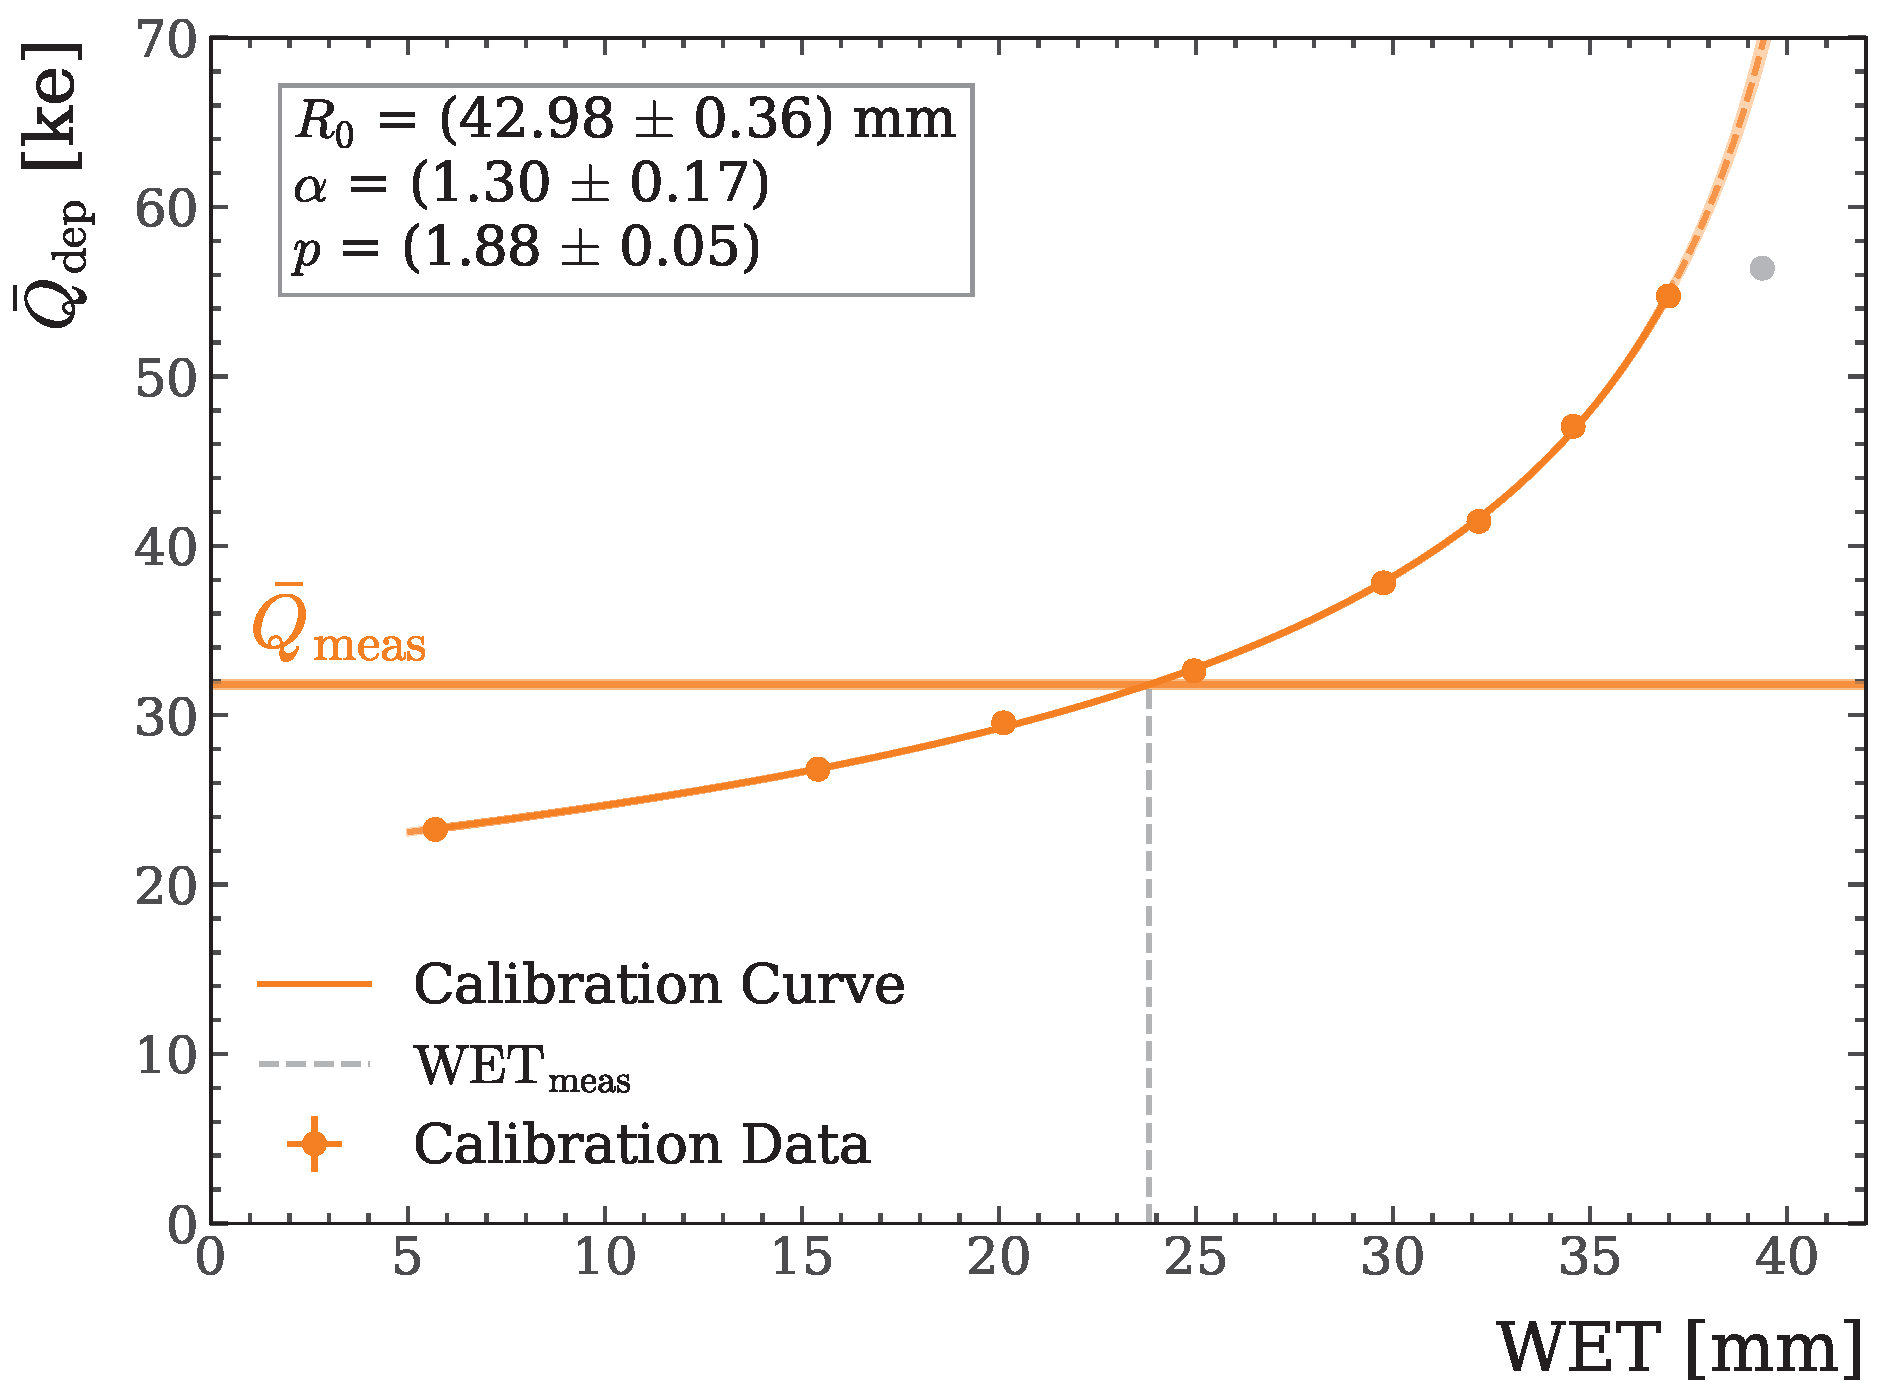
In order to take WET images with the TPIS, a measurement-driven calibration between deposited charge in the second detector and WET is carried out pixel-wise. This approach is based on the work of Metzner et al. [14], but is modified to a pixel-wise calibration. For each of the WET values listed in Table 1 under the title Calibration Phantom, the mean deposited charge Q ¯ dep per superpixel is measured using the second detector (e.g., for 32.18   m m WET in right image of Figure 4). For each WET value, three of the single acquisitions mentioned in Section 2.2.2 are taken. An inhomogeneous Q ¯ dep response across the detector is visible despite a homogeneously thick PLA phantom. For now, a pixel-wise Q ¯ dep -to-WET calibration counteracts this effect. Figure 6 shows the measured calibration data for a representative superpixel.
Additionally, the following fit function, according to [14], is shown and used to interpolate between the measured data points.
Q ¯ dep , cal ( WET ) = ( R 0 WET ) ( 1 p ) / p w e , h · p · a ( 1 / p )
Here, R 0 is the initial range of the protons and p and a are modified fit parameters of Geiger’s law extended by Bortfeld [29].
The gray data point in Figure 6 represents a measured charge distribution that is cut off by the upper threshold of the dynamic range. Thus, the mean value is lower than what is expected by the increasing trend of the mean deposited charge, and the data point is not taken into account for calibration.
This calibration procedure is carried out for each superpixel of the second detector. To obtain the WET projection image of a phantom, the measured mean deposited charge in each superpixel is compared with the corresponding Q ¯ dep -to-WET calibration curve. As shown in Figure 6, the calculated WET value (gray vertical line) lies at the x value of the intersection point between the measured mean deposited charge (orange horizontal line) and the calibration curve.
Figure 7 shows the resulting WET image of a representative two-step phantom after calibrating the Q ¯ dep map measured with the second detector.

2.5. WET Accuracy Study

To quantify the WET accuracy in terms of trueness and precision, WET images of seven different two-step phantoms were taken. The measured reference WET per step is listed in Table 1 under the title Step Phantom. Per step phantom, two data acquisitions were performed (see Section 2.2.2), and the WET images are calculated as described in the previous Section. Regions of interest (ROI) are manually chosen in the WET images to cover the homogeneous parts corresponding to each of the two WET steps of the phantoms. An example of those ROIs is shown in the WET image on the right side in Figure 7. While the ROIs span over each pixel row, they are separated in the column direction by the transition area between the WET steps. Here, the WET follows a sigmoid transition between two homogeneous areas due to multiple Coulomb scattering. The transition width spans columns 24 to 55, where the WET deviates from the homogeneous levels. For each WET step of the two-step phantom, the ROIs are set to cover the area where a constant WET is measured, leaving out the transition area around the edge.
As an example, Figure 8 displays the WET distributions as a histogram per ROI for the WET map shown in Figure 7. For each ROI corresponding to a certain reference WET value, the mean value, standard deviation, and standard error of the mean of the WET distribution over all pixels are calculated.
The WET trueness is quantified by the absolute deviation of the measured mean WET value per ROI from the reference WET value. For evaluating the WET precision, the standard deviation of the WET pixel values is used.

2.6. WET Contrast Study

To distinguish between regions of different WET in one image of the step phantom, the WET distributions in each region should not overlap, see Figure 8.
The measured WET contrast or difference is defined as Δ WET meas = WET 1 WET 2 , with WET 1 and WET 2 denoting the measured mean WET values of two distinct ROIs. To obtain a metric to quantify if that contrast can be detected reliably, the standard deviation σ Δ WET , meas of the Δ WET meas distribution over all superpixels in both ROIs is used (Equation (2)). The main criterion is that Δ WET meas must be greater than the sum of the standard deviations σ WET 1 and σ WET 2 of the two WET distributions (Equation (3)).
σ Δ WET , meas = ( σ WET 1 ) 2 + ( σ WET 2 ) 2 = 2 · ( σ WET 12 ) 2
Δ WET meas σ WET 1 + σ WET 2 = 2 · σ WET 12
It is assumed that σ WET 1 and σ WET 2 have approximately the same value σ WET 12 . Inserting Equation (3) into Equation (2) results in an upper limit σ Δ WET , limit for σ Δ WET , meas according to
σ Δ WET , meas σ Δ WET , limit = Δ WET meas 2 .
In this study, the trueness and precision of the WET difference measurement are investigated for each WET image taken in the WET Accuracy Study described in Section 2.5. For the trueness of the measured WET difference, the absolute deviation of the measured mean value Δ WET ¯ meas from the reference WET difference is investigated. The uncertainty of Δ WET ¯ meas is calculated by propagating the SEMs of the mean WET per ROI. The WET difference precision is quantified by σ Δ WET , meas . A WET difference is measured precisely if the criterion in Equation (4) is satisfied.

2.7. Varying Hits per Pixel Study

To study the dependence of WET accuracy and WET contrast measurements on the number of hits per pixel, the step-phantom measurement data were downsampled to mean values of 100, 500, 1000, and 2000 hits/pxl. In comparison, due to the pencil beam fluence profile, on average, 3000 up to a maximum of 4400 hits/pxl are measured, considering all measured hits. A smaller average of n hits per pixel was obtained by including measured clusters sequentially until the desired value was reached.

2.8. Changing WET Study

An aspect of the study at hand is the capability to detect changes in the WET of ROIs defined in the WET images taken of a phantom changing over time. This simulates the case where the patient’s anatomy changes between different treatment fractions. It is further investigated whether a non-changing WET per ROI is reproducibly measured in time using the TPIS. For this purpose, WET images of the rectangular cuboid phantom were taken for three different setups using the inlays shown in Figure 3. The three configurations are shown in Figure 9.
Per configuration, three single data acquisitions (see Section 2.2.2) were performed subsequently, and the WET images are calculated as described in Section 2.4. The phantom setup was changed from configuration (a) to (b) to (c), with a time difference of 8 min between each configuration.
The tissue contours are determined as explained in Section 2.3. The final WET images with mapped contours are shown in Figure 10. Three ROIs are defined and depicted as pink rectangles using the tissue contours. The first ROI covers the horizontal arm, and the second ROI covers the cube inlay. ROI three covers an entire PLA area without an inlay.
The mean WET and standard deviation of pixel WET values in each ROI are determined. Additionally, the accuracy of the measured WET change between the three WET images for all ROIs is investigated analogously to Section 2.6, for a changing WET over time instead of a measured WET contrast in one image. This is carried out for every combination of the phantom setups shown in Figure 9: (a–b), (b–c), (a–c). For example, (a–b) represents a change between setup (a) and setup (b). The Δ WET meas precision is studied based on Equation (4).
The reference WET values of each ROI are calculated by adding up the WET of each part along the beam direction. The WET of each inlay is taken from Table 1. In case the inlay is missing, the WET of the air is set to zero. For example, the WET of 10 m m air is approximately 0.01   m m using the stopping power ratio of air to water of 1.066 × 10 3 for proton energies up to 125 M e V [20] and the thin-target approach described in [24]. The WET of the phantom for each ROI is the sum of the WET for the two positions per ROI listed in Table 2. Those positions are the ones shown in Figure 3c. The resulting WET values per ROI are listed in Table 2.

3. Results

3.1. WET Accuracy Study

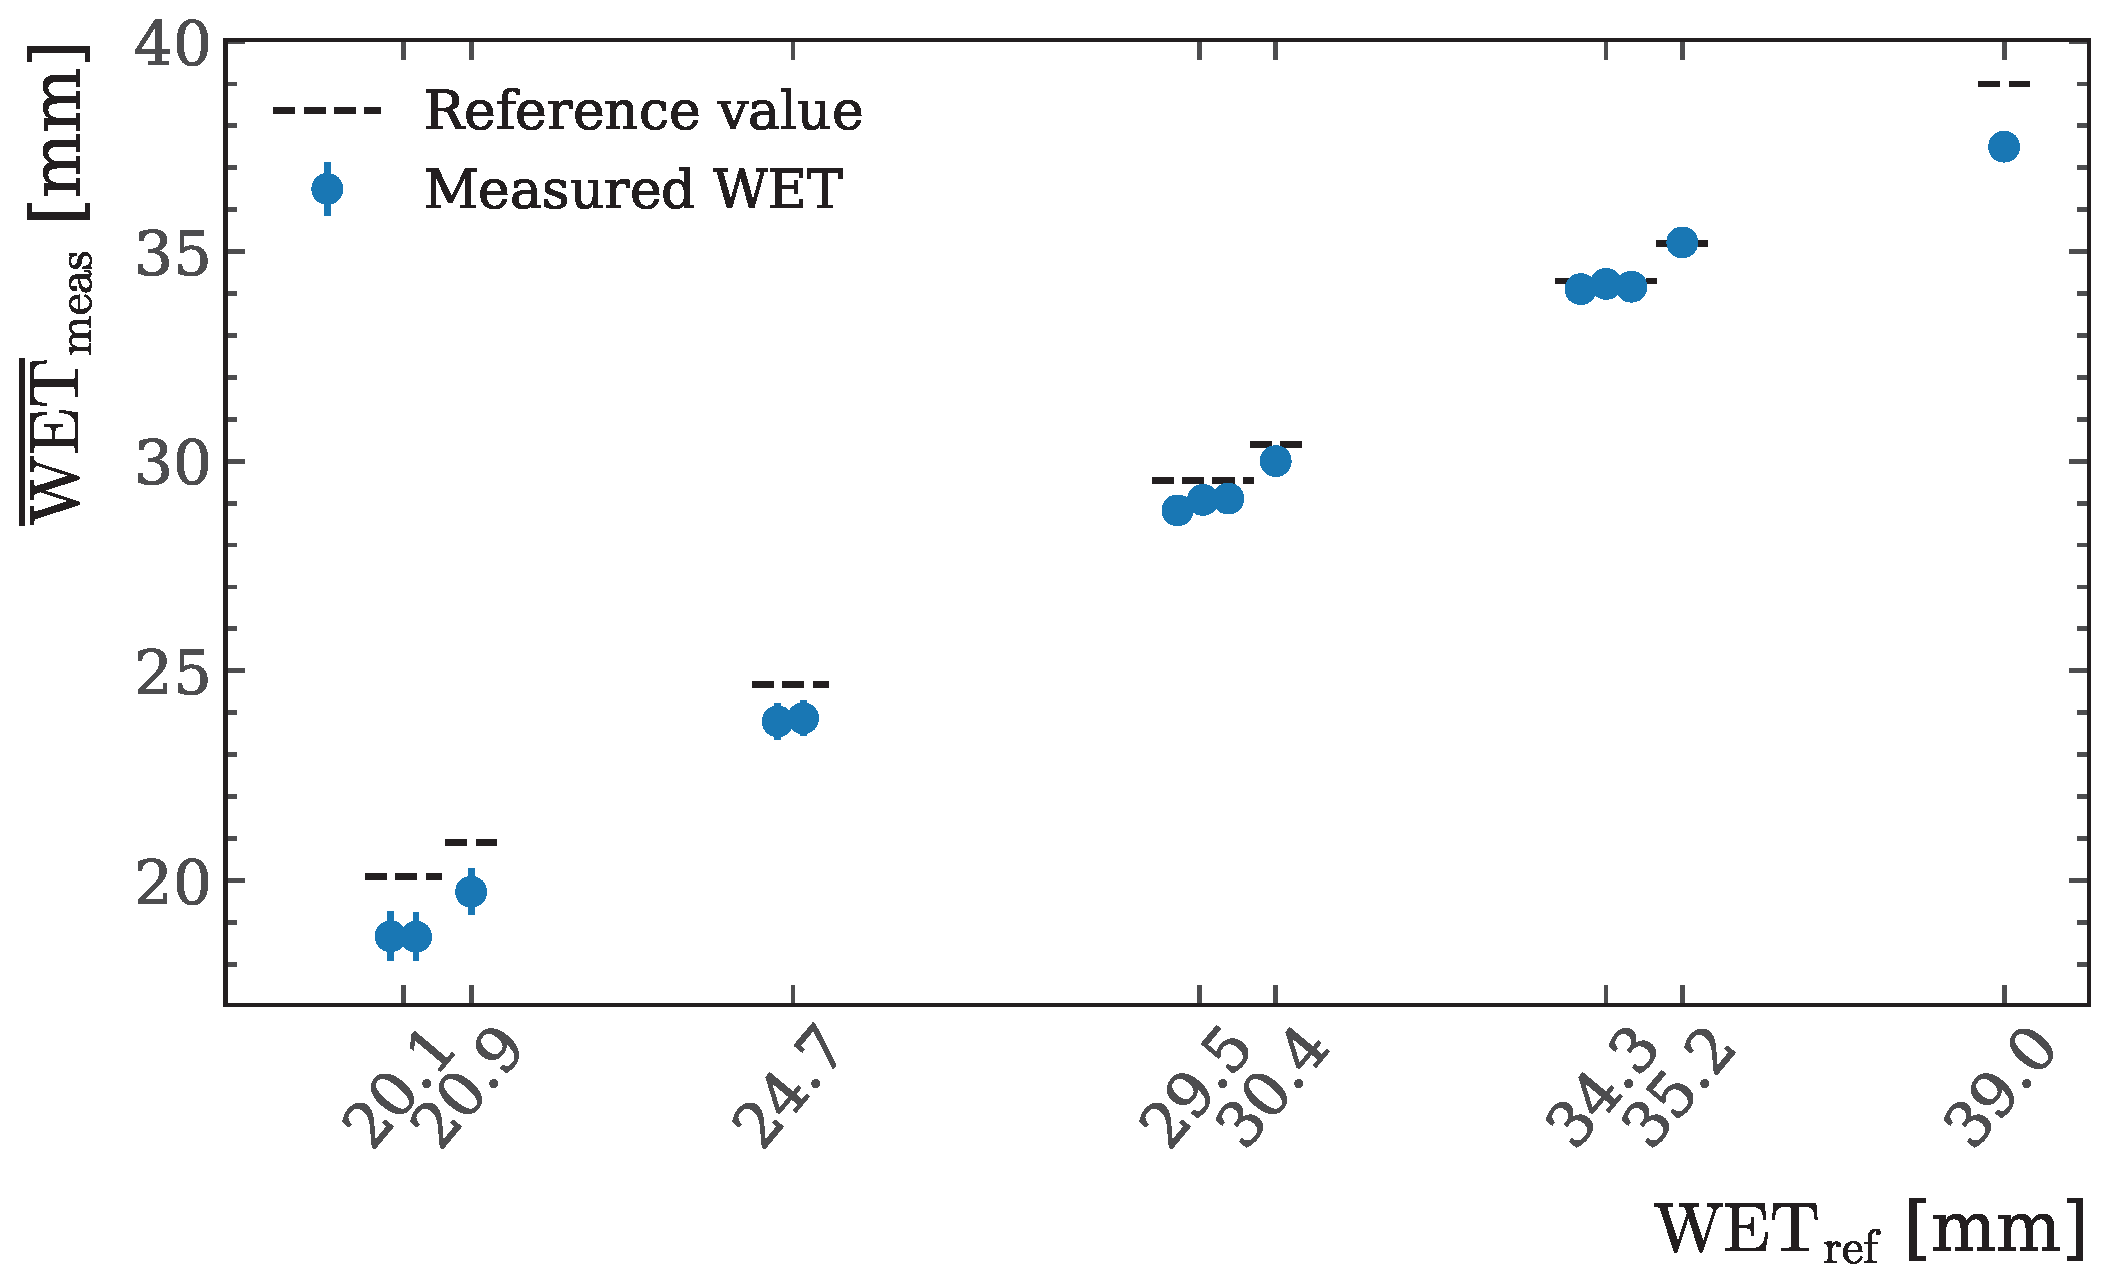
The determined mean values and standard deviations of each WET step are plotted as WET ¯ meas against the reference value WET ref in Figure 11. The theoretical values are depicted as black dashed horizontal lines. Please note that data points belonging to WET ref values that are close to each other are plotted against the same WET ref value for better visualization (compare with Table 1).
It can be seen that the TPIS is capable of reproducing the reference WET value in the investigated WET range of 20 to 39 m m .
For a more detailed analysis of the measured WET accuracy, the absolute deviation from the reference WET shown in the left plot of Figure 12 (trueness) and the standard deviation σ WET of the measured WET value shown in the right plot of Figure 12 (precision) is investigated.
Both plots are set up in the same way as the previous plot. The error bars of the absolute deviation represent the uncertainty of the deviation calculated using the SEM of WET ¯ meas . The measured WET value is systematically underestimated, and the deviation from the reference value decreases with higher WET. Overall, the absolute deviation is less than 1.5   m m down to less than 0.5   m m for WET values above 30.4   m m . For a WET of 39 m m , the deposited charge distribution exceeded partly the upper limit of the dynamic range (see Section 2.2.4 and Figure 6), resulting in a non-viable data point. Hence, it is not further taken into account.
The right plot in Figure 12 shows the dispersion σ WET of measured WET values within an ROI that corresponds to the reference values WET ref . A dashed horizontal line is plotted, which represents the value that the standard deviation must fall below so that a WET difference of 1 mm can be distinguished (compare with Equation (3)).
The steepening slope of the calibration curve (see Figure 6) reduces the standard deviation for increasing WET values. σ WET is between 0.14 and 0.6   m m for the entire investigated WET range. This yields the potential to resolve WET differences or changes between 0.3 and 1.2   m m depending on the reference WET value.

3.2. WET Contrast Study

This study concentrates on the measurement of the difference Δ WET between the determined WET value in each ROI of a single image taken for each step phantom listed in Table 1.
The upper plot of Figure 13 shows the measured mean WET difference Δ WET ¯ meas plotted against the corresponding reference WET values of the step phantom (trueness). The first three contrasts belong to a reference WET difference of about 0.8   m m and the last three contrasts correspond to a WET difference of 4.5 to 4.7   m m . The error bars represent the uncertainty in the mean value Δ WET ¯ meas , calculated by propagating the respective SEMs of the mean WET values for both ROIs in each image. The reference WET difference Δ WET ¯ ref per WET contrast is drawn as a horizontal dashed line.
Overall, WET differences down to 0.8   m m are measured with a deviation of less than 0.3   m m . The highest deviation of 0.6   m m was only measured for a contrast of 20.1/ 24.6   m m .
It is noticeable that despite the relatively large deviation between the WET ¯ meas and the reference value up to 1.5   m m of a single ROI (Figure 12), the deviation between the Δ WET ¯ meas and the reference WET contrast is rather low. The reason for this is the small difference between the absolute deviations for adjacent WET steps.
To evaluate whether the WET difference is measured with statistical significance, the precision of the measured WET contrast is studied. The lower plot in Figure 13 shows the uncertainty σ Δ WET , meas plotted against the WET values of the step phantoms. In addition, the maximum required uncertainty σ Δ WET , limit according to Equation (4) is plotted as horizontal dashed lines. Overall, σ Δ WET , meas decreases slightly with higher mean WET values per WET contrast and is lower than the required limit. Hence, except for the WET contrast 20.1/ 20.9   m m , WET differences down to 0.8   m m are determined with statistical significance using the TPIS prototype.

3.3. Varying Hits per Pixel Study

The plots representing the results of the WET Accuracy Study and WET Contrast Study for varying hits per pixel are shown in Appendix A in Figure A1 and Figure A2, respectively.
The WET trueness does not depend on the number of hits per pixel, except for 100 hits/pxl. Here, the absolute deviation is slightly increased to 1.7   m m for WET values below 25 m m . With fewer hits per pixel, the WET precision decreases to a WET standard deviation between 0.4 and 2.4   m m , compared to considering all measured hits (WET precision between 0.14 and 0.6   m m ). These results show that the required WET precision determines the counts per pixel needed to take the WET image. If WET changes larger than 5 m m need to be resolved, the WET precision of 2.4   m m at 100 hits/pxl on average is sufficient.
The trueness of the measured WET contrasts does not depend on the number of hits per pixel. WET contrasts of around 5 m m are determined with statistical significance using down to 100 hits/pxl on average. For larger WET values, small WET contrasts of up to 0.9   m m can be detected even with the fewest hits per pixel.
As an example of the influence of the number of hits per pixel on the ability to resolve the WET contrast, the WET maps for 29.6/ 30.4   m m WET contrast are shown in Figure 14 for 100, 500, and all measured hits per pixel (3000 hits/pxl) on average.
As shown in the left plot, the two ROIs cannot be distinguished easily by eye using 100 hits/pxl, while going to a higher number of average hits per pixel, the measured uncertainty σ Δ WET , meas is below the upper requirement limit and the two ROIs are clearly visible (center and right plot).

3.4. Changing WET Study

The mean and standard deviation of the WETs measured in each ROI are plotted against the phantom setup in Figure 15 for all three ROIs. The black horizontal dashed lines display the reference WET value per ROI and setup listed in Table 2.
Overall, the measured WET values are underestimated by about 1.7 to 2.7   m m . This does not match the WET deviation from the reference WET of around 0.5 to 1.5   m m observed in the WET accuracy study for WET values between 20 and 30 m m (Section 3.1). Since the reference WET values used in this section are estimated using WER values determined for phantoms different from the complex phantom, those WET values are likely error-prone. Visible air cavities observed on the surface of the cuboid phantom lead to the assumption that the reference WET value is lower than stated here due to a lower effective material density.
A significant measurable change in WET can be observed for ROI 1 and 2, where changes in the phantom setup are expected. For all setups in ROI 3 and setups (b) and (c) in ROI 1, where the expected WET does not change between the setups, the measured WET values do not vary significantly from each other, showing a good WET reproducibility of the TPIS for WET images taken with an 8 to 16 min time difference.
For the first and second ROI, the accuracy of the measured WET change Δ WET ¯ meas is investigated as described in Section 3.2. Towards the trueness of Δ WET meas , the absolute mean value Δ WET ¯ meas is plotted for each phantom setup change against the reference WET change in the upper plot of Figure 16. Above each data point, the two phantom setups between which the WET change occurs are displayed with naming based on Figure 9. For example, “a-b” represents the change between phantom setup (a) and (b).
Minor deviations up to ( 0.6 ± 0.1 ) m m from the reference WET changes are observed for ROI 2. For the theoretical WET change of around 8.6   m m in ROI 1, the deviations are below ( 1.0 ± 0.1 ) m m . The small theoretical WET change of ( 1.0 ± 0.1 ) m m in ROI 2 for phantom change a-b can be measured with a deviation of ( 0.36 ± 0.13 ) m m .
To quantify the precision of Δ WET meas , the bottom plot of Figure 16 shows the corresponding uncertainty σ Δ WET , meas of the measured WET change. Here, the required upper limits σ Δ WET , limit based on Equation (4) are displayed as horizontal black lines. The observed uncertainty σ Δ WET , meas is below the corresponding limit for all cases where the phantom changes. Hence, the WET change is measured as statistically significant. For ROI 1 and the phantom change b-c, the criteria for σ Δ WET , limit are not applicable because no WET change is expected and measured.

4. Discussion

Proof-of-principle WET images were successfully taken with the TPIS. The WET Accuracy Study showed a high WET precision, yielding the potential to resolve changes in WET below 1 m m in a WET range between 25 to 35 m m . The WET precision achieved with the TPIS is comparable to that of clinically used range detectors ( 0.4   m m ) [30]. Concerning the WET trueness, a systematic underestimation between 1.5 and 0 m m decreasing towards higher WET was observed. Even though this does not significantly affect the detection of WET changes and contrasts, the investigation of this underestimation will be the topic of future studies. Overall, the WET trueness of the TPIS matches that of range telescopes, which exhibit deviations of 0 to 1.3   m m [31]. The robustness and reproducibility of the Q ¯ dep –to–WET calibration require further investigation. Future studies will examine both the temporal stability of the calibration and its robustness under varying beam intensities.
In the WET Contrast Study, it was shown that WET contrasts down to 0.8   m m in an image of a step phantom with WET values between 30 and 35 m m can be determined with high accuracy and precision. For WET contrasts of 4.8   m m , this is true at WET values between 20 and 35 m m . The WET difference is slightly overestimated by 0.3   m m for all studied WET contrasts, except for one measurement at a WET contrast of 4.8   m m with an overestimation of 0.6   m m . If treatment plan adaptation is triggered by a WET change exceeding, for example, 1 m m , such a small overestimation would have minimal impact on the adaptation frequency. Characterization of the dependency of the WET difference precision on the number of needed hits per pixel offers an estimate of how much statistical data needs to be measured to resolve a desired WET difference. At the smallest statistic of 100 hits/pxl on average, a WET contrast of 0.9   m m is measured with statistical significance for WET values lying in the steep part of the charge-to-WET calibration curve (34 m m ). At smaller WET values, higher statistics of more than 500 hits/pxl are required.
The Changing WET Study showed that the TPIS resolves WET changes from 13 down to 1 m m between subsequently taken images within 8 and 16 min time difference with sufficient accuracy. Despite the demonstrated potential for using the TPIS as a re-planning trigger in terms of adaptive radiotherapy, further investigations according to WET changes over time scales of days or weeks need to be conducted.
One uncertainty in the Changing WET Study is the reference WET of the cuboid phantom and the inlays, since the structures are too small to measure the WET using a range detector such as the MLIC Giraffe detector (IBA Dosimetry, Schwarzenbruck, Germany). Imperfections due to the printing process are visible on the surface of the complex phantom. Those imperfections, which may also be present within the phantom, could lead to an overestimation of the phantom’s density and reference WET value. If all reference WET values of the complex phantom are systematically overestimated by almost a constant amount, the resulting WET variations should remain unaffected, which would not compromise the validity of this part of the study.
With the current setup, the image dose is estimated to be 50 to 70 Gy to take a WET image of the step phantom or cuboid phantom, respectively. In comparison, collaborations working on single-particle tracking systems report imaging doses of approximately 290 μGy for a helium radiograph of a human head phantom. However, to achieve this, the beam intensity must be reduced to below 100 k Hz , far lower than standard therapeutic beam intensities [32]. In contrast, the TPIS operates at full therapeutic beam intensities, facilitating integration into the clinical workflow. The limiting factor of the current setup is the maximum trigger rate of 4 kHz for the readout system used. Hence, only a fraction of the incident protons is used to take an image. The upper trigger limit of the ATLAS IBL pixel-detector module is 200 k Hz [21], whereas ongoing developments aim to increase the maximum trigger rate of readout chips, with the ATLAS ITkPixV2 reaching up to 1 M Hz [33]. As shown in Section 3.3 and Figure A1, using only one third of the total measured data per image is sufficient to achieve the required WET accuracy. Hence, with the ATLAS IBL pixel-detector module, the imaging dose can be reduced by a factor of 150 to approximately 33 to 47 c Gy , which is comparable to doses up to 60 c Gy reported by Seller Oria et al. for a flat-panel proton radiograph of a head phantom [34]. In addition, the application of a sensitive time window per trigger of up to 400 n s will be investigated. Compared to the 75 n s used in the presented studies, this adjustment is expected to further reduce the imaging dose.
The spatial resolution of WET images obtained with the TPIS, operated as an integrating system, is expected to be lower than that achievable with single-particle tracking systems [16]. Nevertheless, the application of the TPIS is conceptually comparable to range-probing approaches, which have demonstrated considerable potential for adaptive radiotherapy [35,36,37,38]. In addition, the imaging functionality of the TPIS, based on pixelated silicon detectors, is intended to provide further assurance that the same anatomical section of the patient is consistently imaged across treatment fractions.
The current image acquisition requires approximately 10 s to 15 s , while image processing takes up to 15 min . Given the reported duration of up to 30 min for a single treatment fraction [39], the imaging should not significantly extend the overall duration of the treatment and the possible adaptation of the treatment plan. As the current processing chain is still preliminary, further improvements are anticipated to reduce processing time.
WET values in a clinically relevant setting are estimated to range from 30 to 200 m m [36], for example, appearing for the mucus filling of nasal and sinus cavities between fractions of sinonasal tumors [2]. For the presented proof-of-principle studies, the TPIS setup discussed in this paper was applied to WET values ranging from 10 to 40 m m , corresponding to a span of 30 m m . To detect higher WET values, the initial proton energy must be increased accordingly while maintaining a constant absorber thickness. Calculations based on detector performance indicate that the TPIS can be applied to WET values up to 200 m m . The dynamic WET range of 30 m m does not pose a limitation to the intended use of the TPIS as a trigger for plan adaptation. The initial proton energy can be adjusted for the expected WET of the relevant patient section derived from the planning CT. This expected WET then defines the operating point from which changes can be measured with high accuracy. If a WET change is sufficiently large to exceed the dynamic range of the calibration curve, treatment re-planning will be triggered anyway.

5. Conclusions

In conclusion, the proof-of-principle measurements showed the ability of the TPIS using radiation-hard ATLAS IBL hybrid pixel tracking detector modules to take WET images of structured phantoms in a WET range of 10 to 40 m m at full clinical beam intensity. In addition, the potential usage as a re-planning trigger in adaptive proton therapy was demonstrated by reliably detecting small WET changes down to 1 m m in a changing complex phantom. It was shown that a low deposited energy resolution is no limit to taking accurate WET images.
As a further step towards clinical usage, future investigations will concentrate on the application of the TPIS using an anthropomorphic head phantom to simulate a clinically relevant case of a head and neck cancer treatment. One major aspect will be the significant reduction of the imaging dose by a dedicated detector readout workflow. In addition, the sufficiency of the spatial resolution of the WET images will be investigated.

Author Contributions

Conceptualization, H.S. and A.T. and J.W.; methodology, H.S. and H.T. and J.W.; software, H.S. and H.T.; investigation, H.S. and J.E. and A.H. and M.I. and A.-K.L. and J.W.; validation, H.S. and K.K. and J.W.; formal analysis: H.S.; resources, C.M.B. and J.E. and K.K.; data curation, H.S.; writing—original draft preparation, H.S. and J.W.; writing—review and editing, C.M.B. and J.E. and A.H. and M.I. and A.-K.L. and A.T. and H.T. and K.K. and J.W.; visualization: H.S.; supervision, K.K. and J.W.; project administration, K.K. and J.W. All authors have read and agreed to the published version of the manuscript.

Funding

This research received no external funding.

Data Availability Statement

Dataset available on request from the authors. The data cannot be made publicly available because they are not available in a format that is sufficiently accessible or reusable by other researchers. The data that support the findings of this study are available upon reasonable request from the authors.

Acknowledgments

The authors would like to thank the IBA PT and the WPE physics team for their support with the irradiations.

Conflicts of Interest

The authors declare no conflicts of interest.

Abbreviations

The following abbreviations are used in this manuscript:
IBLInsertable B-Layer
ROIRegion of interest
SEMStandard error of the mean
TLUTrigger logic unit
ToTTime over Threshold
TPISTwo-Plane Imaging System
WERWater equivalent ratio
WETWater equivalent thickness

Appendix A. Varying Hits per Pixel Study

Figure A1. WET Accuracy Study with varying hits per pixel. Left: Absolute deviation between measured WET and reference WET (trueness). Right: standard deviation of the measured WET plotted against the reference WET value (precision). Horizontal line marks the upper uncertainty limit to distinguish a WET difference of 1 mm. For the x-axis labels, the WET values are rounded to one digit for better visualization.
Instruments 09 00023 g0a1
Figure A2. WET Contrast Study with varying hits per pixel. Top: Measured WET difference plotted against the WET contrasts of each step phantom. Bottom: Corresponding uncertainty of the measured WET difference with the upper limit of the uncertainty displayed as horizontal black dashed lines. For the x-axis labels, the WET values are rounded to one digit for better visualization.
Instruments 09 00023 g0a2

References

  1. Lomax, A. SFUD, IMPT, and Plan Robustness. In Particle Radiotherapy: Emerging Technology for Treatment of Cancer; Rath, A.K., Sahoo, N., Eds.; Springer: New Delhi, India, 2016; pp. 169–194. [Google Scholar] [CrossRef]
  2. Van De Water, S.; Albertini, F.; Weber, D.C.; Heijmen, B.J.M.; Hoogeman, M.S.; Lomax, A.J. Anatomical Robust Optimization to Account for Nasal Cavity Filling Variation during Intensity-Modulated Proton Therapy: A Comparison with Conventional and Adaptive Planning Strategies. Phys. Med. Biol. 2018, 63, 025020. [Google Scholar] [CrossRef] [PubMed]
  3. Albertini, F.; Matter, M.; Nenoff, L.; Zhang, Y.; Lomax, A. Online Daily Adaptive Proton Therapy. Br. J. Radiol. 2020, 93, 20190594. [Google Scholar] [CrossRef]
  4. Paganetti, H.; Botas, P.; Sharp, G.C.; Winey, B. Adaptive Proton Therapy. Phys. Med. Biol. 2021, 66, 22TR01. [Google Scholar] [CrossRef]
  5. Sarosiek, C.; DeJongh, E.A.; Coutrakon, G.; DeJongh, D.F.; Duffin, K.L.; Karonis, N.T.; Ordoñez, C.E.; Pankuch, M.; Rykalin, V.; Winans, J.R.; et al. Analysis of characteristics of images acquired with a prototype clinical proton radiography system. Med. Phys. 2021, 48, 2271–2278. [Google Scholar] [CrossRef]
  6. Parodi, K. Latest developments in in-vivo imaging for proton therapy. Br. J. Radiol. 2020, 93, 20190787. [Google Scholar] [CrossRef]
  7. Knopf, A.C.; Lomax, A. In Vivo Proton Range Verification: A Review. Phys. Med. Biol. 2013, 58, 131–160. [Google Scholar] [CrossRef]
  8. Schneider, U.; Besserer, J.; Pemler, P.; Dellert, M.; Moosburger, M.; Pedroni, E.; Kaser-Hotz, B. First Proton Radiography of an Animal Patient. Med. Phys. 2004, 31, 1046–1051. [Google Scholar] [CrossRef]
  9. Esposito, M.; Waltham, C.; Taylor, J.T.; Manger, S.; Phoenix, B.; Price, T.; Poludniowski, G.; Green, S.; Evans, P.M.; Allport, P.P.; et al. PRaVDA: The first solid-state system for proton computed tomography. Phys. Med. 2018, 55, 149–154. [Google Scholar] [CrossRef]
  10. Johnson, R.P.; Bashkirov, V.; DeWitt, L.; Giacometti, V.; Hurley, R.F.; Piersimoni, P.; Plautz, T.E.; Sadrozinski, H.F.W.; Schubert, K.; Schulte, R.; et al. A Fast Experimental Scanner for Proton CT: Technical Performance and First Experience with Phantom Scans. IEEE Trans. Nucl. Sci. 2016, 63, 52–60. [Google Scholar] [CrossRef] [PubMed]
  11. Amato, C.; Martisikova, M.; Gehrke, T. A technique for spatial resolution improvement in helium-beam radiography. Med. Phys. 2020, 47, 2212–2221. [Google Scholar] [CrossRef] [PubMed]
  12. DeJongh, E.A.; DeJongh, D.F.; Polnyi, I.; Rykalin, V.; Sarosiek, C.; Coutrakon, G.; Duffin, K.L.; Karonis, N.T.; Ordoñez, C.E.; Pankuch, M.; et al. Technical Note: A Fast and Monolithic Prototype Clinical Proton Radiography System Optimized for Pencil Beam Scanning. Med. Phys. 2021, 48, 1356–1364. [Google Scholar] [CrossRef]
  13. Landry, G.; Dedes, G.; Collins-Fekete, C.A.; Krah, N.; Simard, M.; Rit, S. Ion and secondary imaging. Phys. Med. Biol. 2024, 69, 240301. [Google Scholar] [CrossRef]
  14. Metzner, M.; Zhevachevska, D.; Schlechter, A.; Kehrein, F.; Schlecker, J.; Murillo, C.; Brons, S.; Jäkel, O.; Martišíková, M.; Gehrke, T. Energy Painting: Helium-Beam Radiography with Thin Detectors and Multiple Beam Energies. Phys. Med. Biol. 2024, 69, 055002. [Google Scholar] [CrossRef] [PubMed]
  15. Grinstein, S. Overview of the ATLAS insertable B-layer (IBL) project. Nucl. Instrum. Methods Phys. Res. 2013, 699, 61–66. [Google Scholar] [CrossRef]
  16. Krah, N.; Khellaf, F.; Létang, J.M.; Rit, S.; Rinaldi, I. A Comprehensive Theoretical Comparison of Proton Imaging Set-Ups in Terms of Spatial Resolution. Phys. Med. Biol. 2018, 63, 135013. [Google Scholar] [CrossRef] [PubMed]
  17. Schilling, I.; Bäcker, C.M.; Bäumer, C.; Behrends, C.; Hötting, M.; Hohmann, J.; Kröninger, K.; Timmermann, B.; Weingarten, J. Measuring the Beam Energy in Proton Therapy Facilities Using ATLAS IBL Pixel Detectors. Instruments 2022, 6, 80. [Google Scholar] [CrossRef]
  18. Lascaud, J.; Dash, P.; Schnürle, K.; Bortfeldt, J.; Niepel, K.; Maas, J.; Würl, M.; Vidal, M.; Hérault, J.; Landry, G.; et al. Fabrication and Characterization of a Multimodal 3D Printed Mouse Phantom for Ionoacoustic Quality Assurance in Image-Guided Pre-Clinical Proton Radiation Research. Phys. Med. Biol. 2022, 67, 205001. [Google Scholar] [CrossRef] [PubMed]
  19. Garcia-Sciveres, M.; Arutinov, D.; Barbero, M.; Beccherle, R.; Dube, S.; Elledge, D.; Fleury, J.; Fougeron, D.; Gensolen, F.; Gnani, D.; et al. The FE-I4 pixel readout integrated circuit. Nucl. Instrum. Methods Phys. Res. 2011, 636, S155–S159. [Google Scholar] [CrossRef]
  20. International Commission on Radiation Units and Measurements. Stopping Powers and Ranges for Protons and Alpha Particles; Technical report; ICRU Report 49; International Commission on Radiation Units and Measurements: Bethesda, MD, USA, 1993. [Google Scholar]
  21. FE-I4 Collaboration. The FE-I4B Integrated Circuit Guide; The FE-I4 Collaboration; CERN: Geneva, Switzerland, 2012. [Google Scholar]
  22. Commissioning Data provided by the West German Proton Therapy Centre Essen, 2024.
  23. Behrends, C.; Bäcker, C.M.; Schilling, I.; Zwiehoff, S.; Weingarten, J.; Kröninger, K.; Rehbock, C.; Barcikowski, S.; Wulff, J.; Bäumer, C.; et al. The Radiosensitizing Effect of Platinum Nanoparticles in Proton Irradiations Is Not Caused by an Enhanced Proton Energy Deposition at the Macroscopic Scale. Phys. Med. Biol. 2022, 67, 155023. [Google Scholar] [CrossRef] [PubMed]
  24. Zhang, R.; Newhauser, W.D. Calculation of Water Equivalent Thickness of Materials of Arbitrary Density, Elemental Composition and Thickness in Proton Beam Irradiation. Phys. Med. Biol. 2009, 54, 1383–1395. [Google Scholar] [CrossRef]
  25. Barlow, R. Statistics: A Guide to the Use of Statistical Methods in the Physical Sciences, 1st ed.; John Wiley & Sons Ltd.: Chichester, England, 1989. [Google Scholar]
  26. Campbell, M.; Havranek, V.; Heijne, E.; Holy, T.; Idarraga, J.; Jakubek, J.; Lebel, C.; Leroy, C.; Llopart, X.; Novotny, J.; et al. Charge collection from proton and alpha particle tracks in silicon pixel detector devices. In Proceedings of the 2007 IEEE Nuclear Science Symposium Conference Record, Honolulu, HI, USA, 26 October–3 November 2007; Volume 2, pp. 1047–1050. [Google Scholar] [CrossRef]
  27. Cookson, J. Radiography with protons. Naturwissenschaften 1974, 61, 184–191. [Google Scholar] [CrossRef]
  28. Canny, J. A Computational Approach to Edge Detection. IEEE Trans. Pattern Anal. Mach. Intell. 1986, PAMI-8, 679–698. [Google Scholar] [CrossRef]
  29. Bortfeld, T. An Analytical Approximation of the Bragg Curve for Therapeutic Proton Beams. Med. Phys. 1997, 24, 2024–2033. [Google Scholar] [CrossRef]
  30. Bäumer, C.; Koska, B.; Lambert, J.; Timmermann, B.; Mertens, T.; Talla, P.T. Evaluation of Detectors for Acquisition of Pristine Depth-dose Curves in Pencil Beam Scanning. J. Appl. Clin. Med. Phys. 2015, 16, 151–163. [Google Scholar] [CrossRef]
  31. Dhanesar, S.; Sahoo, N.; Kerr, M.; Taylor, M.B.; Summers, P.; Zhu, X.R.; Poenisch, F.; Gillin, M. Quality Assurance of Proton Beams Using a Multilayer Ionization Chamber System. Med. Phys. 2013, 40, 092102. [Google Scholar] [CrossRef]
  32. Metzner, M.; Longarino, F.K.; Ackermann, B.; Schlechter, A.; Saphörster, M.; Xu, Y.; Schlecker, J.; Wohlfahrt, P.; Richter, C.; Brons, S.; et al. Accuracy of a Helium-beam Radiography System Based on Thin Pixel Detectors for an Anthropomorphic Head Phantom. Med. Phys. 2025, 52, 4757–4768. [Google Scholar] [CrossRef]
  33. Pottier, L.L.; Heim, T.; Garcia-Sciveres, M. Testing the limits of ITkPixV2: The ATLAS inner tracker pixel detector readout chip. arXiv 2025, arXiv:2502.05097. [Google Scholar] [CrossRef]
  34. Seller Oria, C.; Free, J.; Marmitt, G.G.; Knäusl, B.; Brandenburg, S.; Knopf, A.C.; Meijers, A.; Langendijk, J.A.; Both, S. Technical Note: Flat Panel Proton Radiography with a Patient Specific Imaging Field for Accurate WEPL Assessment. Med. Phys. 2023, 50, 1756–1765. [Google Scholar] [CrossRef] [PubMed]
  35. Mumot, M.; Algranati, C.; Hartmann, M.; Schippers, J.M.; Hug, E.; Lomax, A.J. Proton Range Verification Using a Range Probe: Definition of Concept and Initial Analysis. Phys. Med. Biol. 2010, 55, 4771–4782. [Google Scholar] [CrossRef] [PubMed]
  36. Farace, P.; Righetto, R.; Meijers, A. Pencil Beam Proton Radiography Using a Multilayer Ionization Chamber. Phys. Med. Biol. 2016, 61, 4078–4087. [Google Scholar] [CrossRef]
  37. Hammi, A.; Placidi, L.; Weber, D.C.; Lomax, A.J. Positioning of Head and Neck Patients for Proton Therapy Using Proton Range Probes: A Proof of Concept Study. Phys. Med. Biol. 2017, 63, 015025. [Google Scholar] [CrossRef] [PubMed]
  38. Hammi, A.; Koenig, S.; Weber, D.C.; Poppe, B.; Lomax, A.J. Patient Positioning Verification for Proton Therapy Using Proton Radiography. Phys. Med. Biol. 2018, 63, 245009. [Google Scholar] [CrossRef] [PubMed]
  39. Lim-Reinders, S.; Keller, B.M.; Al-Ward, S.; Sahgal, A.; Kim, A. Online Adaptive Radiation Therapy. Int. J. Radiat. Oncol. Biol. Phys. 2017, 99, 994–1003. [Google Scholar] [CrossRef] [PubMed]
Figure 1. Left: Schematic of the TPIS prototype using a step phantom. Right: Photo of the prototype detector system, including a plastic phantom.
Instruments 09 00023 g001
Figure 2. Deposited charge in 50 μm-thick silicon by protons plotted against kinetic energy based on NIST pstar stopping power database [20].
Instruments 09 00023 g002
Figure 3. 3D printed phantoms used in the presented studies. (a) PLA plates for WET calibration, (b) two-step phantom, (c) rectangular cuboid phantom with possibility to insert inlays made out of PLA and gPLA (shown in (d)).
Instruments 09 00023 g003
Figure 4. Left: Reconstructed mean deposited charge image for WET of 32.18 mm for original pixel size 50 μm × 250 μm. Right: Mean deposited charge image for WET of 32.18 mm for superpixel of 250 μm × 250 μm pixel size.
Instruments 09 00023 g004
Figure 5. Left: Transmission image (hit map) taken with the first detector for the rectangular cuboid phantom setup (a) from Figure 9. Contours of the 2D Gaussian fit function are shown in white, and the 1 σ iso-intensity contour is depicted as a red line. Right: Ratio map of transmission image and 2D Gaussian fit. Tissue boundaries found with the Canny filter are displayed as white dots.
Instruments 09 00023 g005
Figure 6. Q ¯ dep -to-WET calibration measurement data (dots) and calibration fit function plotted in orange for a representative superpixel. The horizontal orange line corresponds to a measured mean deposited charge in this superpixel for the phantom step with WET 24.64 mm. Gray vertical line depicts the calculated WET.
Instruments 09 00023 g006
Figure 7. Left: measured raw Q ¯ dep map of the step phantom with WETs of 29.46 mm and 24.69 mm. Right: calculated WET image using the Q ¯ dep -to-WET calibration. Each ROI per WET step is shown as an orange or blue box.
Instruments 09 00023 g007
Figure 8. Histogram of the WET values in the ROIs shown in Figure 7.
Instruments 09 00023 g008
Figure 9. Cross-section of the three cuboid phantom setups in beam’s-eye view. (a) cube inlay and vertical arm are bone-like; the horizontal arm is filled with air. (b) Horizontal and vertical arms are bone-like, cube inlay is filled with air. (c) Horizontal and vertical arms are bone-like, PLA cube inlay used.
Instruments 09 00023 g009
Figure 10. Final WET images of the corresponding three cuboid phantoms setups shown in Figure 9 with tissue contours mapped on (ac). For example, (a) shows the WET image of the phantom in setup (a) from Figure 9. Three ROIs are defined and displayed as pink rectangles for each WET image.
Instruments 09 00023 g010
Figure 11. Measured WET value plotted against the reference WET value. Error bars represent the standard deviation of the WET values per WET ROI. For the x-axis labels, the WET values are rounded to one digit for better visualization.
Instruments 09 00023 g011
Figure 12. Left: Absolute deviation between measured WET and reference WET (trueness). Right: standard deviation of the measured WET plotted against the reference WET value (precision). Horizontal line marks the upper uncertainty limit to distinguish a WET difference of 1 m m . For the x-axis labels, the WET values are rounded to one digit for better visualization.
Instruments 09 00023 g012
Figure 13. Top: Measured WET difference plotted against the WET contrasts of each step phantom. For the x-axis labels, the WET values are rounded to one digit for better visualization. Bottom: Corresponding uncertainty of the measured WET difference with the upper limit displayed as horizontal black dashed lines.
Instruments 09 00023 g013
Figure 14. WET map for 29.6/ 30.4 m m WET contrast at 100 (left), 500 (center), and all measured hits per pixel (3000 hits/pxl) on average.
Instruments 09 00023 g014
Figure 15. Measured WET per ROI plotted for each of the three different phantom setups shown in Figure 9. The error bars represent the standard deviation of the WET values per ROI. Each ROI is depicted in a certain color. The time difference between the measurements with setup (a) and (b) and setup (b) and (c) is approximately 8 min.
Instruments 09 00023 g015
Figure 16. For ROI 1 and 2, absolute measured mean WET change (top) and uncertainty (bottom) plotted against reference WET change (based on Table 2). Black horizontal lines in the bottom plot display the upper uncertainty limit according to Equation (4).
Instruments 09 00023 g016
Table 1. If stated in this table, the measured material thickness t, WET or WER is listed for the calibration phantom arrangements (Figure 3a), for the two-step phantom arrangements (under Step Phantom, see Figure 3a,b), for the positions on the complex phantom (Figure 3c) and inlays (Figure 3d).
Calibration PhantomStep PhantomComplex Phantom
t [mm]WET [mm]WERWET [mm] t [mm]WET [mm]
4.89(4)5.70(1)1.165(11)20.08(2)/20.89(2)Pos. 15.26(1)6.12(2)
9.13(5)10.56(1)1.157(6)20.08(2)/24.64(2)Pos. 28.28(1)9.63(2)
13.2(1)15.41(1)1.165(5)24.69(2)/29.46(2)Pos. 312.24(1)14.23(3)
17.3(1)20.12(1)1.164(5)29.58(2)/30.43(2)Pos. 412.21(1)14.20(3)
21.4(1)24.95(2)1.167(5)29.58(2)/34.32(2)Pos. 59.33(1)10.85(2)
25.7(1)29.76(2)1.160(4)34.29(2)/35.22(2)Pos. 69.20(1)10.70(2)
27.7(1)32.18(2)1.161(4)34.29(2)/39.00(2) Cube gPLA 9.96(1)12.5(1)
29.8(1)34.57(2)1.162(4) Cube PLA 9.86(1)11.47(2)
31.8(1)36.99(2)1.162(4) Arm gPLA 3.80(5)4.75(7)
34.1(1)39.37(2)1.156(4) Arm PLA 3.30(5)3.84(6)
Table 2. Reference WET value per ROI for the three different setups and the positions per ROI for which the WET values are listed in Table 1.
ROIPositionsWETsetup (a) [mm]WETsetup (b) [mm]WETsetup (c) [mm]
12 & 520.48(4)29.06(10)29.06(10)
21 & 629.26(11)16.81(4)28.28(6)
33 & 428.43(5)28.43(5)28.43(5)
Disclaimer/Publisher’s Note: The statements, opinions and data contained in all publications are solely those of the individual author(s) and contributor(s) and not of MDPI and/or the editor(s). MDPI and/or the editor(s) disclaim responsibility for any injury to people or property resulting from any ideas, methods, instructions or products referred to in the content.