Article

Novel Smart Glove for Ride Monitoring in Light Mobility

by
Michela Borghetti
1,*,
Nicola Francesco Lopomo
2 and
Mauro Serpelloni
1
1
Department of Information Engineering (DII), University of Brescia, Via Branze 38, 25123 Brescia, Italy
2
Department of Design, Politecnico di Milano, Via Durando 10, 20158 Milan, Italy
*
Author to whom correspondence should be addressed.
Instruments 2025, 9(1), 6; https://doi.org/10.3390/instruments9010006
Submission received: 3 March 2025 / Accepted: 13 March 2025 / Published: 18 March 2025

Abstract

:
Ensuring comfort in light mobility is a crucial aspect for supporting individuals’ well-being and safety while driving scooters, riding bicycles, etc. In fact, factors such as the hand grip on the handlebar, positions of the wrist and arm, overall body posture, and affecting vibrations play key roles. Wearable systems offer the ability to noninvasively monitor physiological parameters, such as body temperature and heart rate, aiding in personalized comfort assessment. In this context, user positions while driving or riding are, on the other hand, more challenging to monitor ecologically. Developing effective smart gloves as a support for comfort and movement monitoring introduces technical complexities, particularly in sensor selection and integration. Light and flexible sensors can help in this regard by ensuring reliable sensing and thus addressing the optimization of the comfort for the driver. In this work, a novel wireless smart glove is proposed, integrating four bend sensors, four force-sensitive sensors, and one inertial measurement unit for measuring the finger movements, hand orientation, and the contact force exerted by the hand while grasping the handlebar during driving or riding. The smart glove has been proven to be repeatable (1.7%) and effective, distinguishing between different grasped objects, such as a flask, a handlebar, a tennis ball, and a small box. Additionally, it proved to be a valuable tool for monitoring specific actions while riding bicycles, such as braking, and for optimizing the posture during the ride.

1. Introduction

Ensuring the well-being and safety of individuals during driving or riding involves assessing their comfort, particularly in light mobility scenarios, as it directly influences the user and his/her/their attention and performance. Comfort in light mobility encompasses various environmental and physiological factors, such as temperature, humidity, air quality, vibration, hand grip on the steering wheel or handlebar, position of the wrist and arm, and overall body posture. The scientific literature emphasizes the importance of vibrational behavior and transmissibility at contact points with the vehicle as key factors influencing ride comfort [1]. In this regard, custom contact force sensors and acceleration sensors are developed to provide reliable, repeatable measurements for evaluating comfort through the absorbed power method [2]. Experimental and numerical methods have been proposed to predict on-road comfort using frequency response functions and mathematical models considering tire and wheelbase filtering effects [3]. Further studies highlight factors such as road surface, speed, tire pressure, vehicle type, and environmental conditions in determining comfort levels [4]. Additionally, the rider’s skill level and cycling environment design impact comfort perception, as evidenced by the Cycling Comfort Index derived from bicycle dynamics and roadway characteristics [5].
Traditionally, assessing comfort parameters relied on external measurement tools and methods, often applied in an invasive, impractical, and non-ecological way. However, physiological indicators have emerged as valuable metrics to assess rider comfort. To provide personalized assessments, integrating various information on the status of the rider is crucial; stress level estimation metabolic response to ride conditions, annoyance rate, and postural variations to stressors represent indeed important factors to consider [6]. Recently, scientific interest has shifted towards using wearable systems for non-invasive, continuous data collection on individuals’ physical comfort while riding or driving. These systems, utilizing sensors embedded in wearable devices [7,8,9], like bracelets, watches [10], or smart clothing [11], enable real-time monitoring of parameters such as body temperature [12], heart rate, posture, and further comfort indicators [13]. Technologies embedding physiological sensing, such as electrocardiograms, electromyograms, skin conductance, and respiration rates, can accurately measure stress levels during travel. Posture monitoring devices utilize a combination of inertial measurement units (IMUs) and pressure sensors to assess the driver’s body position and ergonomic alignment while driving [14]; by capturing data on neck angle, shoulder rotation, and lumbar spine curvature, these devices provide valuable insights into ergonomic risk factors and potential sources of musculoskeletal discomfort. Furthermore, real-time posture feedback systems deliver visual or auditory cues to encourage optimal sitting posture and postural adjustments, thereby reducing the risk of fatigue-related injuries and enhancing driving comfort over prolonged periods [15]. Therefore, when evaluating user comfort in light mobility, it is fundamental to be able to track posture and movements, as well as the force exerted by the user during the interaction with the bicycle or scooter.
In the last decade, smart gloves [16] have emerged as a versatile and promising category of wearable devices and they are a viable solution for comfort evaluation in light mobility. These innovative devices are equipped with sensors capable of capturing hand and finger movements, as well as the force exerted by the fingertips. Over the years, numerous gloves with different designs, each one equipped with different kinds of sensors and interfaces tailored especially for clinical purposes [17,18,19,20,21,22,23,24], have been proposed and utilized. However, developing effective smart gloves for evaluating cyclists’ and bikers’ comfort poses several technical and design challenges; in fact, it is important to select appropriate sensor types and properly evaluate their placement, to ensure durability, ergonomics, and user-friendliness [25]. Moreover, the proposed gloves are equipped with many sensors to measure the movements of each phalanx with high accuracy (ten or more sensors), which increases the complexity and can raise the overall cost of the glove. Additionally, the gloves are primarily focused on measuring movements rather than the force exerted by the fingers and palm during the interaction with external objects [26]. While some solutions provide force measurements, most of the identified research typically focuses solely on the fingertips [27,28].
Given these challenges, the present work focuses on designing, developing, and exploring potential applications of a novel effective smart glove tailored specifically for evaluating cyclists’ and riders’ hand grasping and movements. The proposed glove compared to what is reported in the literature monitors the grip using a single sensor for each finger and at the same time the pressure exerted towards the handlebar or wheel, and the orientation of the hand in 3D space. To the authors’ knowledge, no other smart glove integrates force and movement measurements or is specifically designed for this application. Furthermore, smart gloves in general measure the force exerted by the fingertips, and they do not provide information on the force exerted by the palm. The development of printed electronics and sensors can help in this regard by reducing overall dimensions and weight, therefore reducing discomfort for the driver wearing the glove. Given its intended application, the proposed wireless smart glove is equipped with nine sensors: (1) four sensors measuring the flexion and extension of the index, middle, ring, and little fingers, (2) four sensors measuring the force exerted by the index and palm, and (3) one sensor for measuring hand orientation. The proposed smart glove was tested under various conditions, and its performance, in terms of kinematic estimation, was compared to that of a commercial glove.

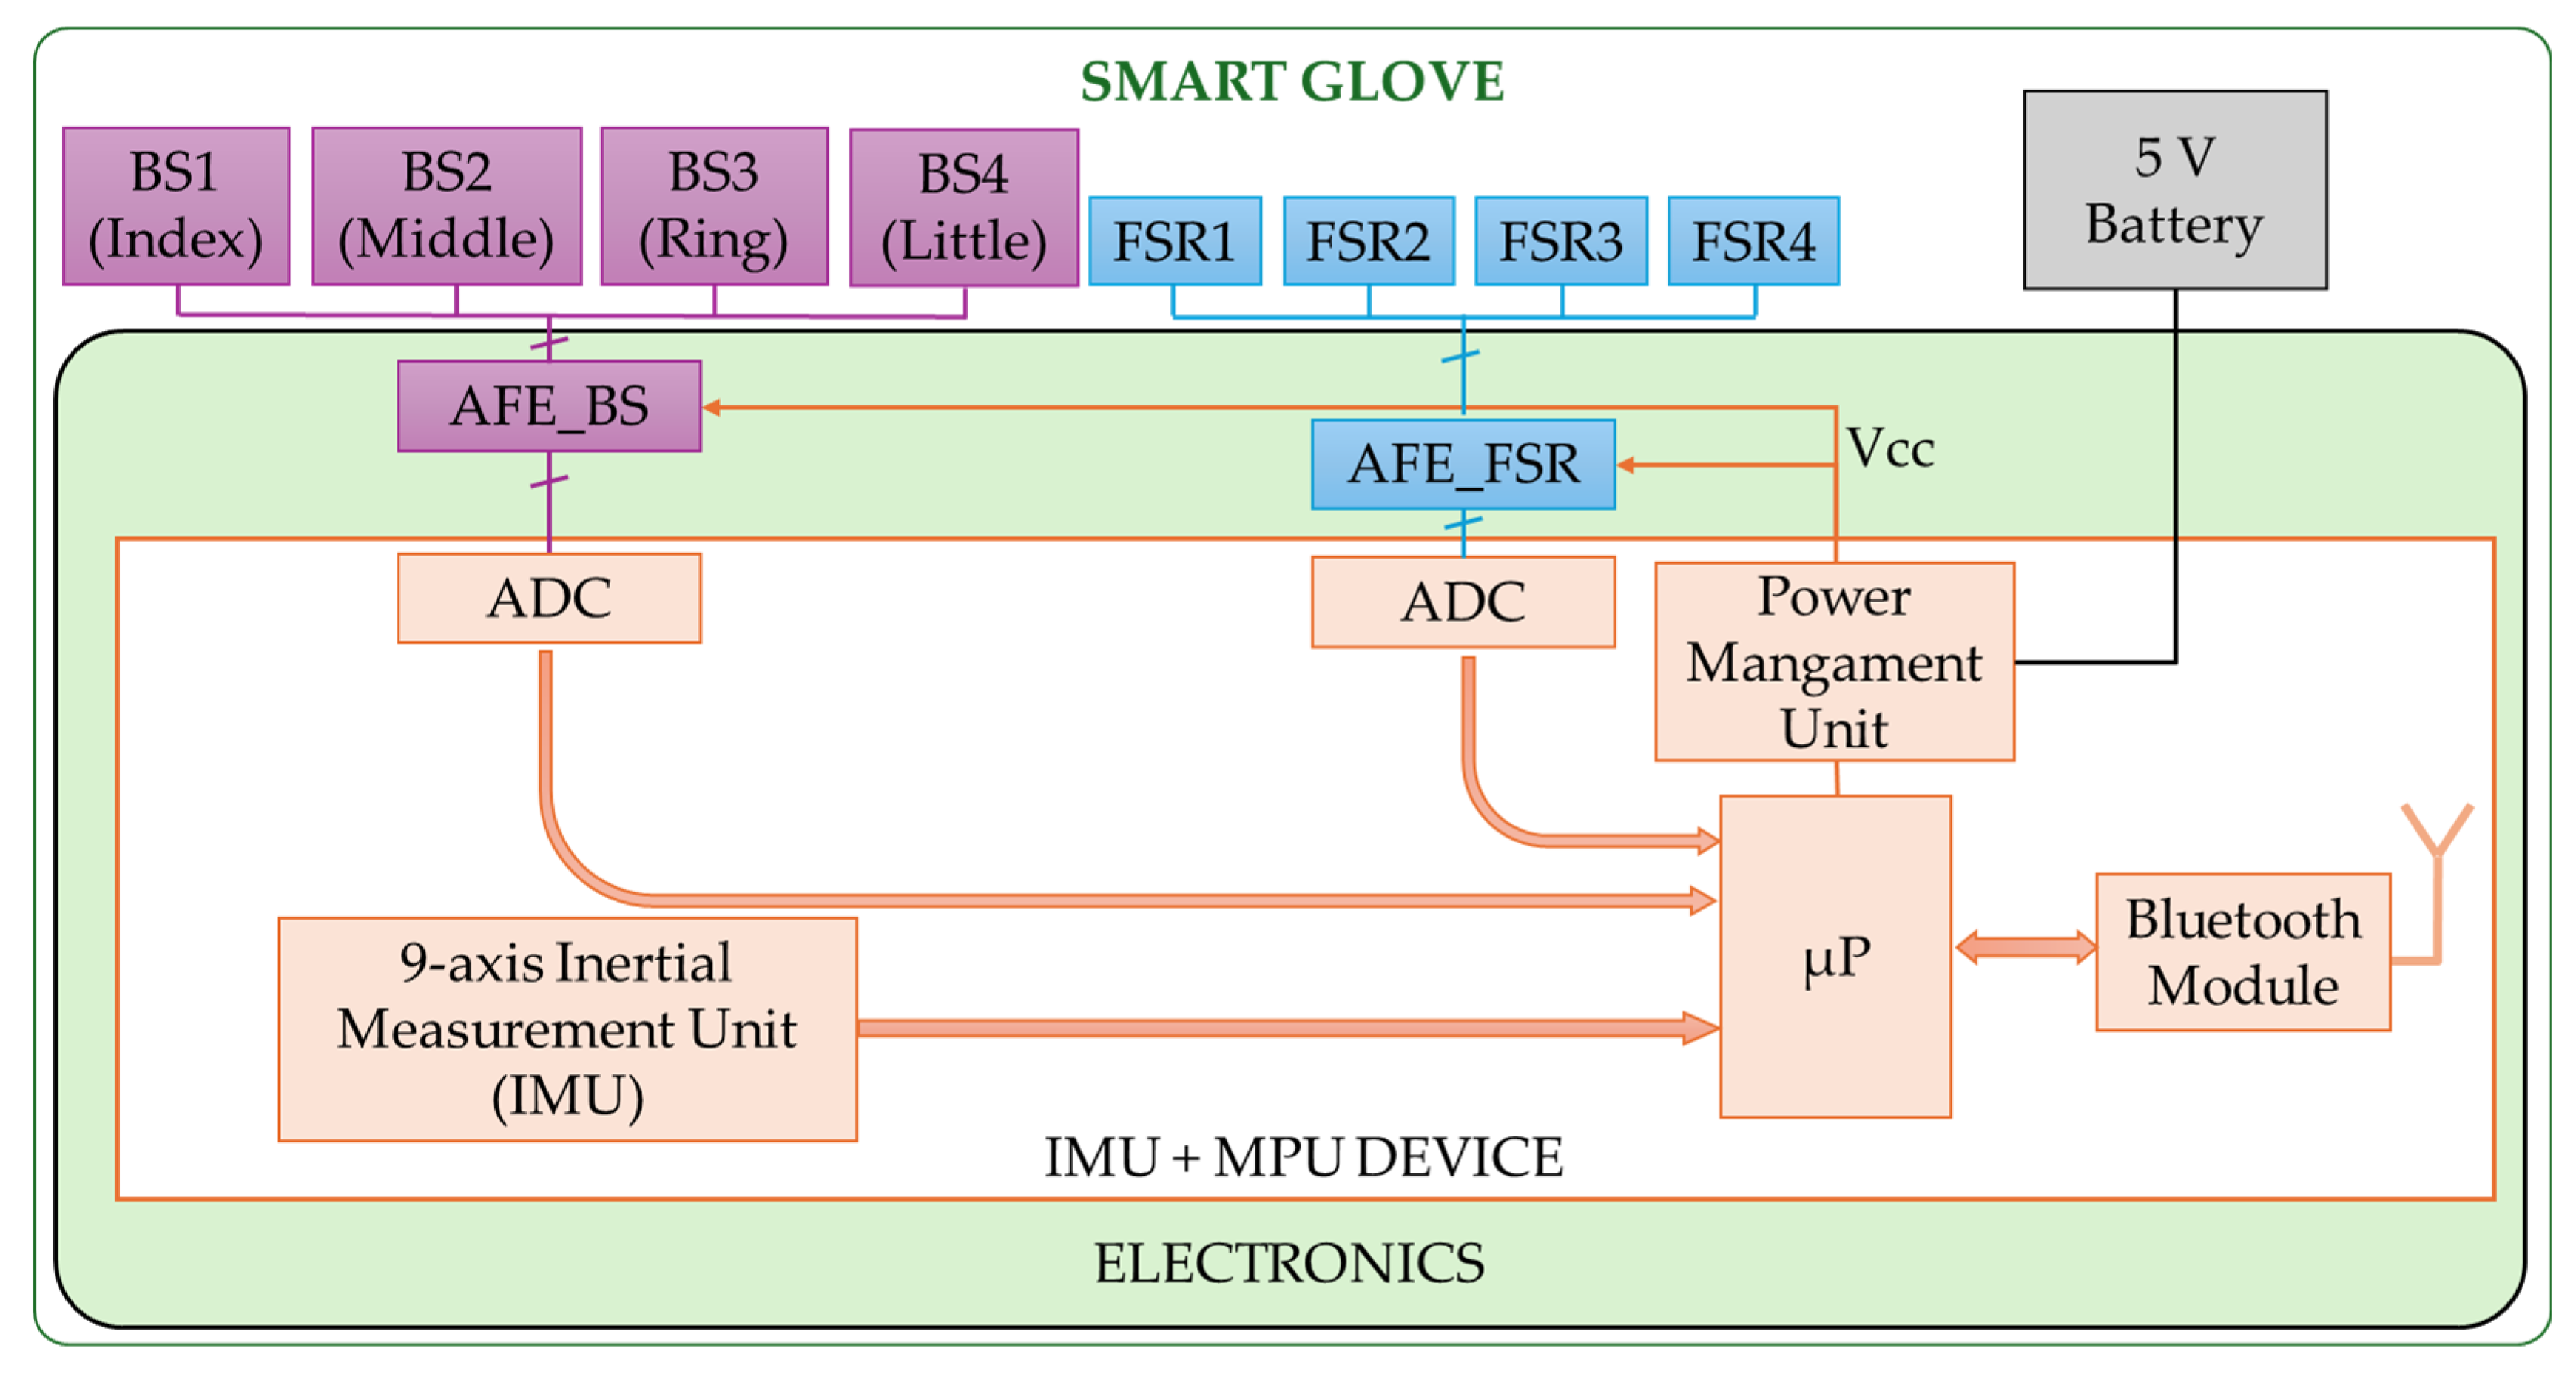
2. Smart Glove Design

The proposed smart glove (Figure 1) has been designed for ride-and-drive monitoring in light mobility, such as gripping a bicycle handlebar. For this purpose, the following parameters were identified for measurement:
  • The force and the pressure exerted by the finger and by the palm on the grasped object, especially the bicycle handlebar. Excessive pressure can lead to fatigue, discomfort, or physical issues over time, while too little pressure might not provide adequate support.
  • Finger flexion and extension. Like excessive pressure, improper finger positioning can lead to excessive fatigue and potential physical injuries. Furthermore, certain actions, such as braking, could enhance safety.
  • The position of the back of the hand. In addition to providing a reference for reconstructing finger positioning in space based on flexion–extension measurement, it provides information about the comfort level of the fingers and hand during movements and object grasping, as well as about optimizing the posture during the ride.
  • Furthermore, measuring pressure, finger movement, and hand position can also help customize the object design to meet individual users’ needs and therefore improve the user experience, well-being, and safety.
The proposed smart glove is composed of a conventional glove in which sensors and electronics for evaluating comfort are integrated.
From the perspective of reducing bulk, weight, and complexity, the following sensors and electronics have been chosen:
  • Four printed bend sensors (BSs) for flexion–extension finger movements and their analog front-end (AFE_BS).
  • Four printed force-sensitive resistors (FSRs) for finger and palm pressure and their analog front-end (AFE_FSR).
  • One six-axis inertial measurement unit (IMU) for hand position.
  • One microcontroller (MCU) for acquiring, elaborating, and sending the sensor signal via Bluetooth module.
The block diagram is shown in Figure 2.
The final weight of the glove (battery included) is 160 g, and the power consumption is less than 7 mA.

2.1. Glove Material

The glove chosen as the sensor support is commercial (Mountain Biking Gloves ST 500, Rockrider, Decathlon, Lille, France), specifically designed for light vehicle driving, such as bicycles, motorcycles, and scooters. This type of glove is designed to meet specific comfort and safety requirements during driving. It consists of two types of materials:
  • Lightweight and elastic fabric (3.0% Elastane, 97.0% Polyester on the back of the hand, and 24.0% Elastane, 76.0% Polyamide on the gusset), providing adequate freedom of movement and breathability during use.
  • Polyester (100%) in the thumb area and the palm, the area in contact with controls like handlebars or steering wheels for a firm and secure grip. Additionally, it is wear-resistant and offers a better grip on control elements.
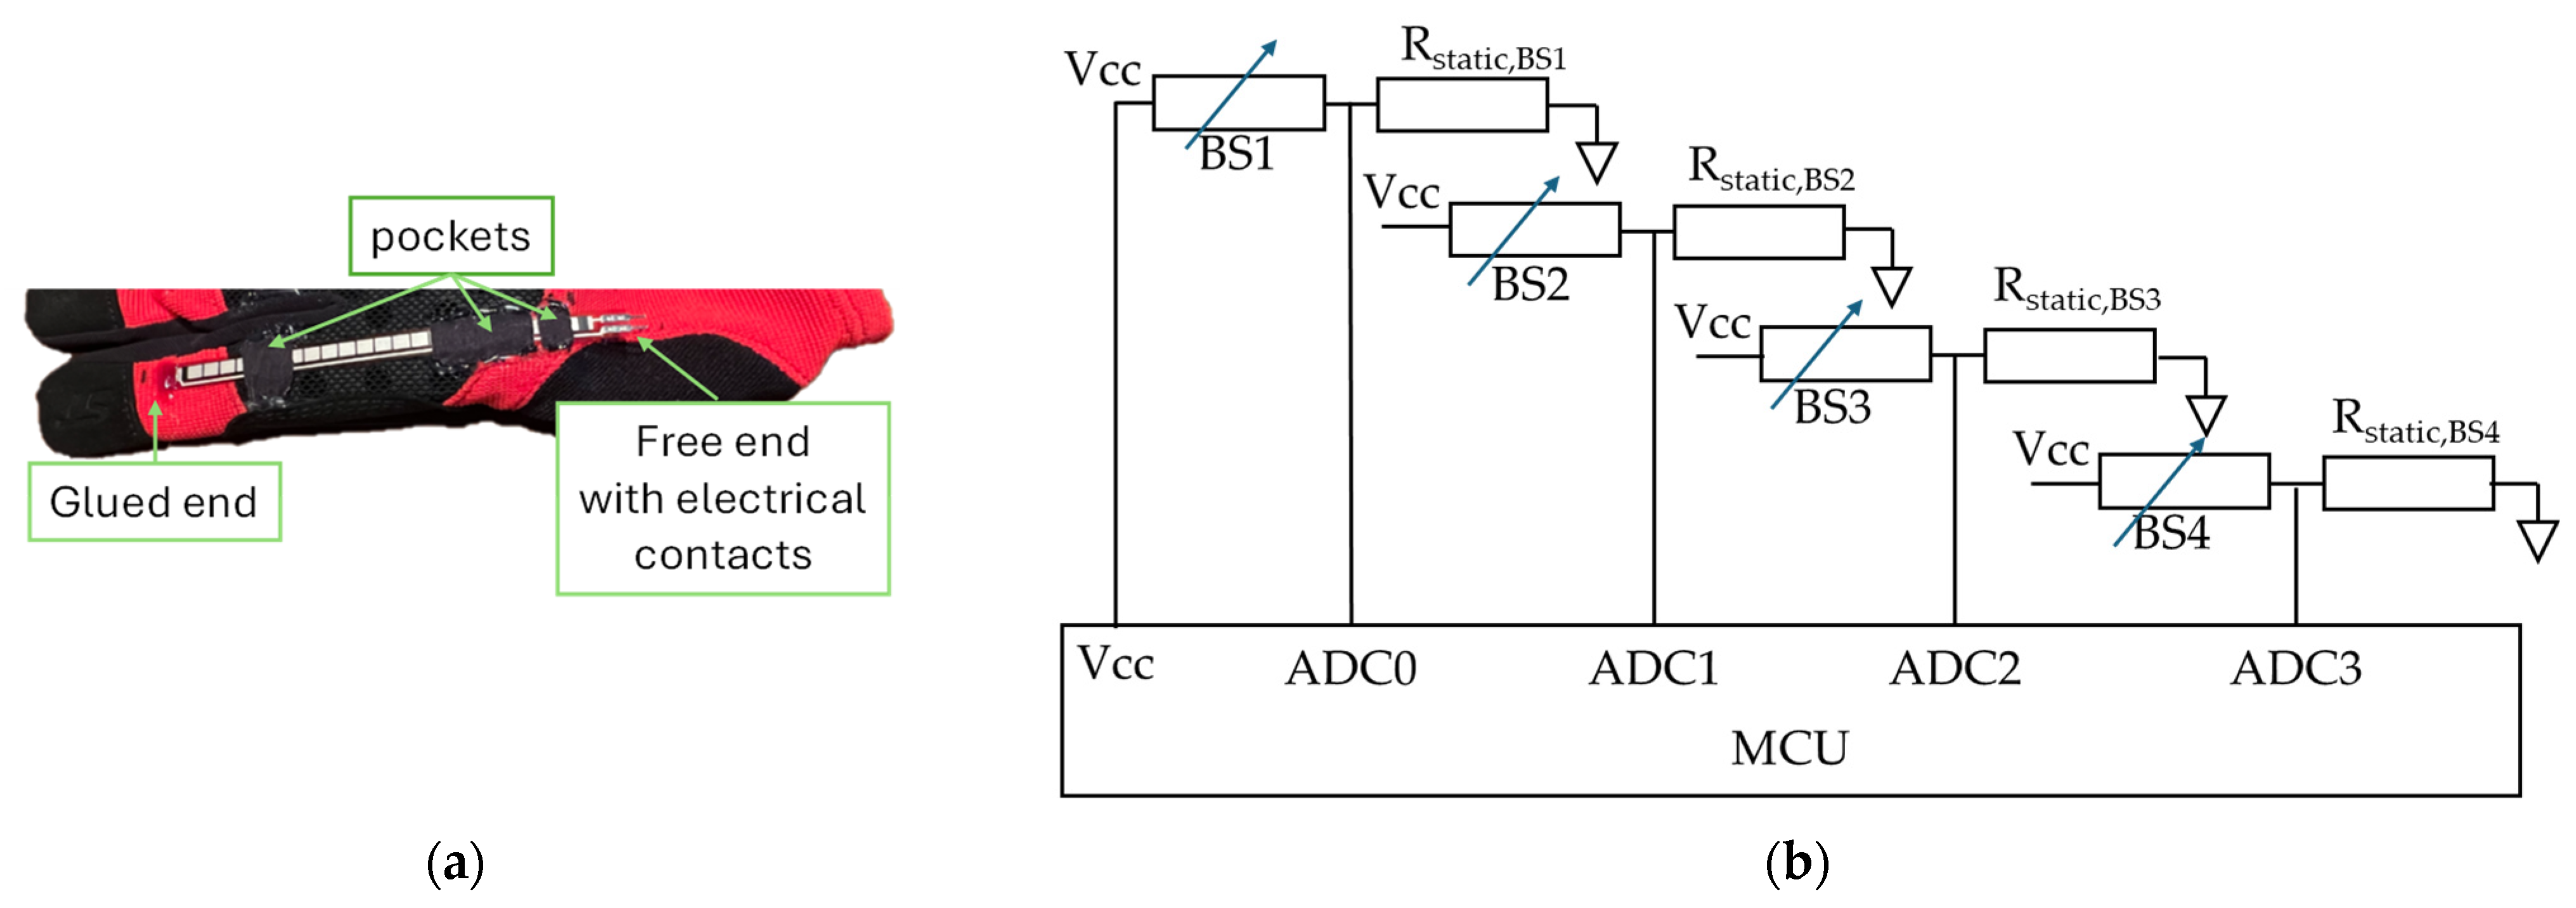
This combination of fabrics has allowed the integration of sensors and electronics through the creation of sewn inserts and 3D-printed supports.

2.2. Bend Sensors

Bend sensors are printed resistive sensors able to measure the bending. In this work, commercial sensors, Product No. FS-L-0095-103-ST, (Spectra Symbol, Salt Lake, UT, USA) [29], were selected, according to the results obtained in past projects in terms of linearity, repeatability, and hysteresis [30]. The sensitive area is a stripe made of carbon material (95.25 × 3.5 mm2), printed on a plastic substrate (112.24 × 6.35 × 0.43 mm3). The electrical resistance of the carbon layer increases according to the bending or the deflection. This sensor can be used to measure the rotation of one hinge modeling the flexion and extension of one finger joint (as in [30]) or two joints at once (as proved in [31]). In this work, the movements of the index, middle, ring, and little finger were then monitored by using these bend sensors. In particular, the flexion and extension of the metacarpophalangeal joint (MCP) and the proximal interphalangeal joint (PIP) were measured by one bend sensor. As already proved in the literature [32], the distal interphalangeal joint (DIP) can be estimated according to the PIP joint measurement since, during the execution of functional movements in the open kinematic chain, DIP and PIP joint positions are correlated. Using only one sensor for each finger, costs, weight, and complexity of the acquisition systems (both at the hardware and software levels) can be significantly reduced. Indeed, the final application of the proposed glove is to assess the comfort level of a healthy subject rather than measuring joint movement with maximum accuracy.
One end of the sensor was glued close to the DIP joint area, and the sensor was forced to slide on the finger during the flexion and extension movements of the joints in only one direction. To keep the sensor in contact with the glove, fabric pieces were sewn around the sensor, creating a sort of textile loop. These fabric pieces serve as support and fixation for the sensor, keeping it in place during glove use as shown in Figure 3a.
The analog front-end for measuring the sensor resistance consists of the sensor and a static resistor ((15.0 ± 0.1) kΩ) to create a voltage divider, as shown in Figure 3b. The value of the static resistor was selected according to the sensor range (10 kΩ–20 kΩ) for this application and it is approximately in the middle of the expected range of variation of the sensor resistance. The microcontroller reads sequentially the voltage across the static resistors ( V A D C , i , with i = 1, 2, 3, 4) by the dedicated analog–digital converter (ADC) and provides the power supply. The equation to calculate the sensor resistance R B S is shown in Equation (1). The relation between the resistance and the MCP-PIP angle was already found in a previous work [15].
R B S , i = R s t a t i c , B S i · V C C V A D C , i 1 ,   i = 0 ,   1 ,   2 ,   3

2.3. Force Sensor Resistors

Force sensor resistors are printed sensors able to measure the applied physical force (pressure). The electrical resistance decreases when the applied pressure increases. FSR™ 400 sensors (Interlink Electronics, Fremont, CA, USA) [33] were selected due to their good repeatability (2%) and their measurement range (0.2 N and 20 N). The usual range for grasp contact goes from 0.71 N for a pen with 16 g to 14.66 N for a hammer with 796 g [34] in accordance with the range of the selected FSR. These sensors are composed of a sandwich structure (0.3 mm thick): on the bottom (layer 1), a resistive ink is deposited to form a round area (4.06 mm2), on the top (layer 3), two interdigitated conductive traces are electrically isolated, and in the middle (layer 2), a thin air gap keeps the other two layers isolated without applied force. In this case, the resistance is greater than 1 MΩ. When a force is applied on the top, layer 1 and layer 3 are put in contact and a conductive path between the two interdigitated traces (layer 3) is created through layer 1. In this case, the resistance can be less than 1 kΩ, according to the applied force. As the bend sensors, FSRs are light, flexible, and easy to install on non-planar surfaces.
In [35], the authors simulated with an effective model the pressure distribution when the hand grasped an elliptic cylindrical handle and they found a similar pressure for all the fingers (excluding the thumb, which is not involved in the grasping action), and the maximum pressure is located in the middle of the phalanges. The pressure is the lowest in the palm. According to these results, in this work, four FSRs were integrated into the glove to detect the pressure in four areas, as shown in Figure 4a. Furthermore, the position of the sensors is compatible with the main anatomical landmarks of the hand in contact with the handlebar, as confirmed by professional cyclists. In this way, it is possible to measure the maximum force exerted by the distal and in the middle phalanx of the index finger (FSR2 and FSR3) and the minimum force exerted by the palm (FSR1 and FSR4) when the subject grasps a handle. Since the pressure is similar for all the fingers, the number of sensors can be reduced significantly, simplifying the glove design. The resistance of sensors was measured by using the AFE depicted in Figure 4b. The circuit diagram is the same as that used for the bend sensors as well as the equation to calculate the resistance R F S R , i , i = 4, 5, 6, 7 (Equation (1)). The value of the static resistance is set to (10.0 ± 0.1) kΩ, as the best compromise between linear response and accuracy. This AFE solution is suitable for bend sensors and FSRs, and it is simple, low-cost, and unbulky, but at the same time, effective, preserving the sensor’s linear response. A dedicated setup was designed to find the relationship between resistance and pressure.
A dedicated experimental setup, a compression tester (ESM1500, Mark-10, Copiague, NY, USA) equipped with a 50 N load cell, was used to characterize FSR sensors according to the applied force/pressure. The FSR sensor was connected to ADC4 of the smart glove electronics, in series to its static resistor. The voltage across that static resistor was sent via Bluetooth to a mobile. The crosshead was moved at 0.2 mm/min to increase the force exerted on the FSR until 15 N.
The results are shown In Figure 5. The voltage (VADC4) across the static resistance measured by the microcontroller is on the y-axis, while the applied force (F) is on the x-axis. The equation of the line of the best fit (found using the least squares method) is reported in Equation (2).
V ADC4 = 0.1169   V / N · F + 0.1442   V
R-squared is equal to 0.9825, confirming the adequate value of the static resistance for a linear response of the system. The error bars were obtained by repeating the calibration test four times and considering the maximum difference between the measurements and the average for the same applied load (1.5% in the worst case).

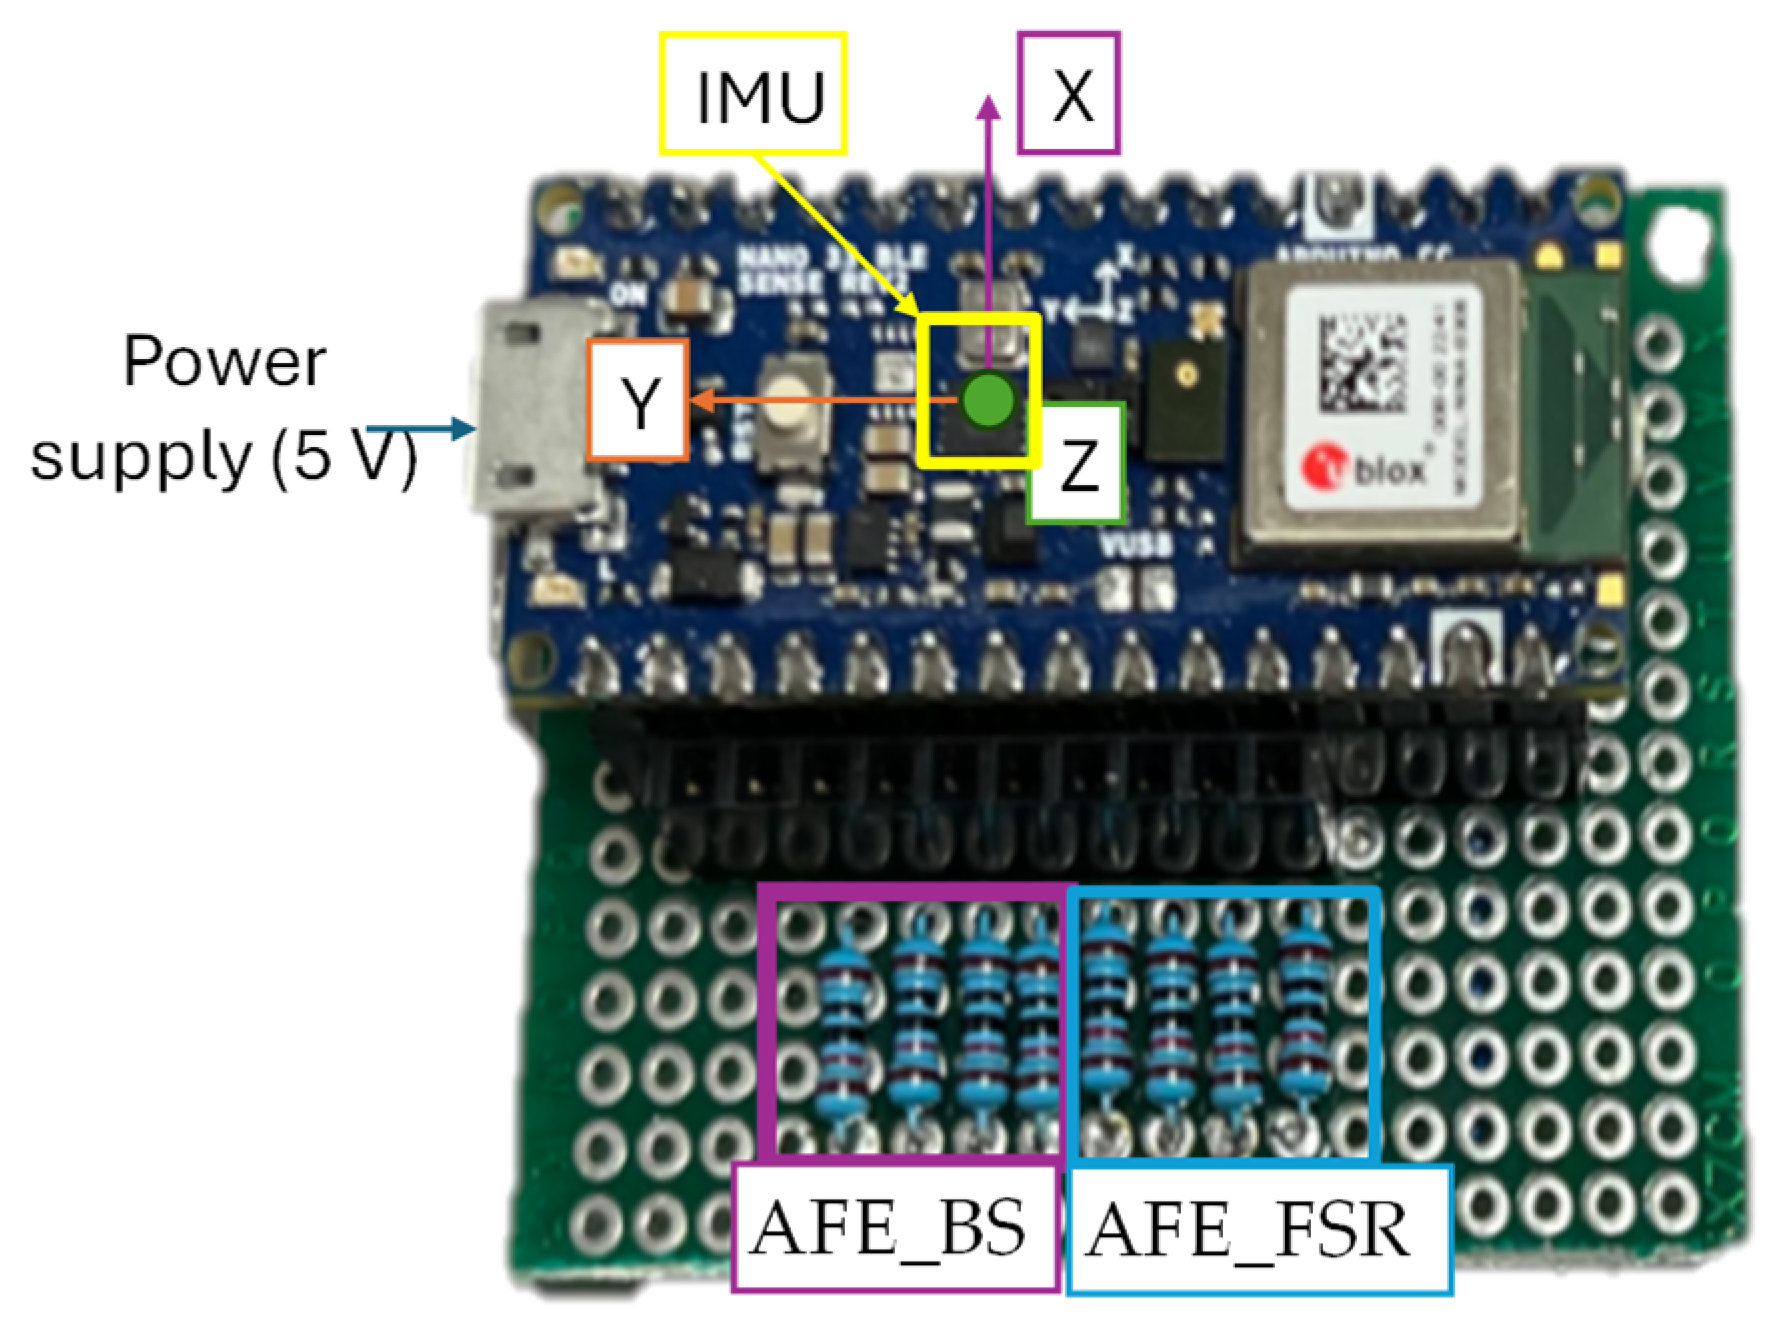
2.4. Microcontroller, Inertial Measurement Unit, and Analog Front-End Integration

Arduino Nano 33 BLE Sense Rev2 was adopted in this work to acquire, elaborate, and send measurement data to an external unit. A power bank (5 V, 2200 mAh rechargeable Li-ion battery pack) provided the power supply to Arduino via the USB port. With a weight of just 77 g and compact dimensions of 94 × 23 × 23 mm3, it enables integration of the battery pack inside a bracelet.
Furthermore, Arduino integrates a 9-DoF-axis inertial measurement unit (3D accelerometer and 3D gyroscope (Bosch BMI270), and 3D magnetometer (Bosch BMM150)) to determine the orientation of the hand, which can be used as a reference point for the finger. The roll (around the x-axis), pitch (around the y-axis), and yaw (around the z-axis) angles were calculated by acquiring the acceleration, the angular velocity, and the magnetic field data from the IMU and combining them with a Kalman filter [36], implemented in the Arduino program to estimate roll, pitch, and yaw angle every cycle time ( T s ). The variances of the accelerometer and the gyroscope were set to 9 degrees2 and 4 deg2/s2 according to the datasheet.
As described in Section 2.1 and Section 2.2, the resistive sensors are connected to the MCU through an analog front-end (AFE). The power supply for the AFE is 3.27 V ( V C C ). The voltage across each static resistor is acquired by devoted 12-bit analog–digital converters (ADCs) every 16 ms. The ADC resolution is adequate for measuring sensor resistance. Every 16 ms ( T s ), all measurements (angular positions and resistance of the sensors) are sent via Bluetooth to a smartphone. The MCU and the AFE are connected on the same breadboard (Figure 6). The resulting acquisition unit is fixed on a polyethylene–terephthalate (PETG) base (4.7 cm × 6.0 cm × 1.6 cm) fabricated by fused deposition modeling 3D printing and glued on the glove.

3. Characterization and Validation Protocols

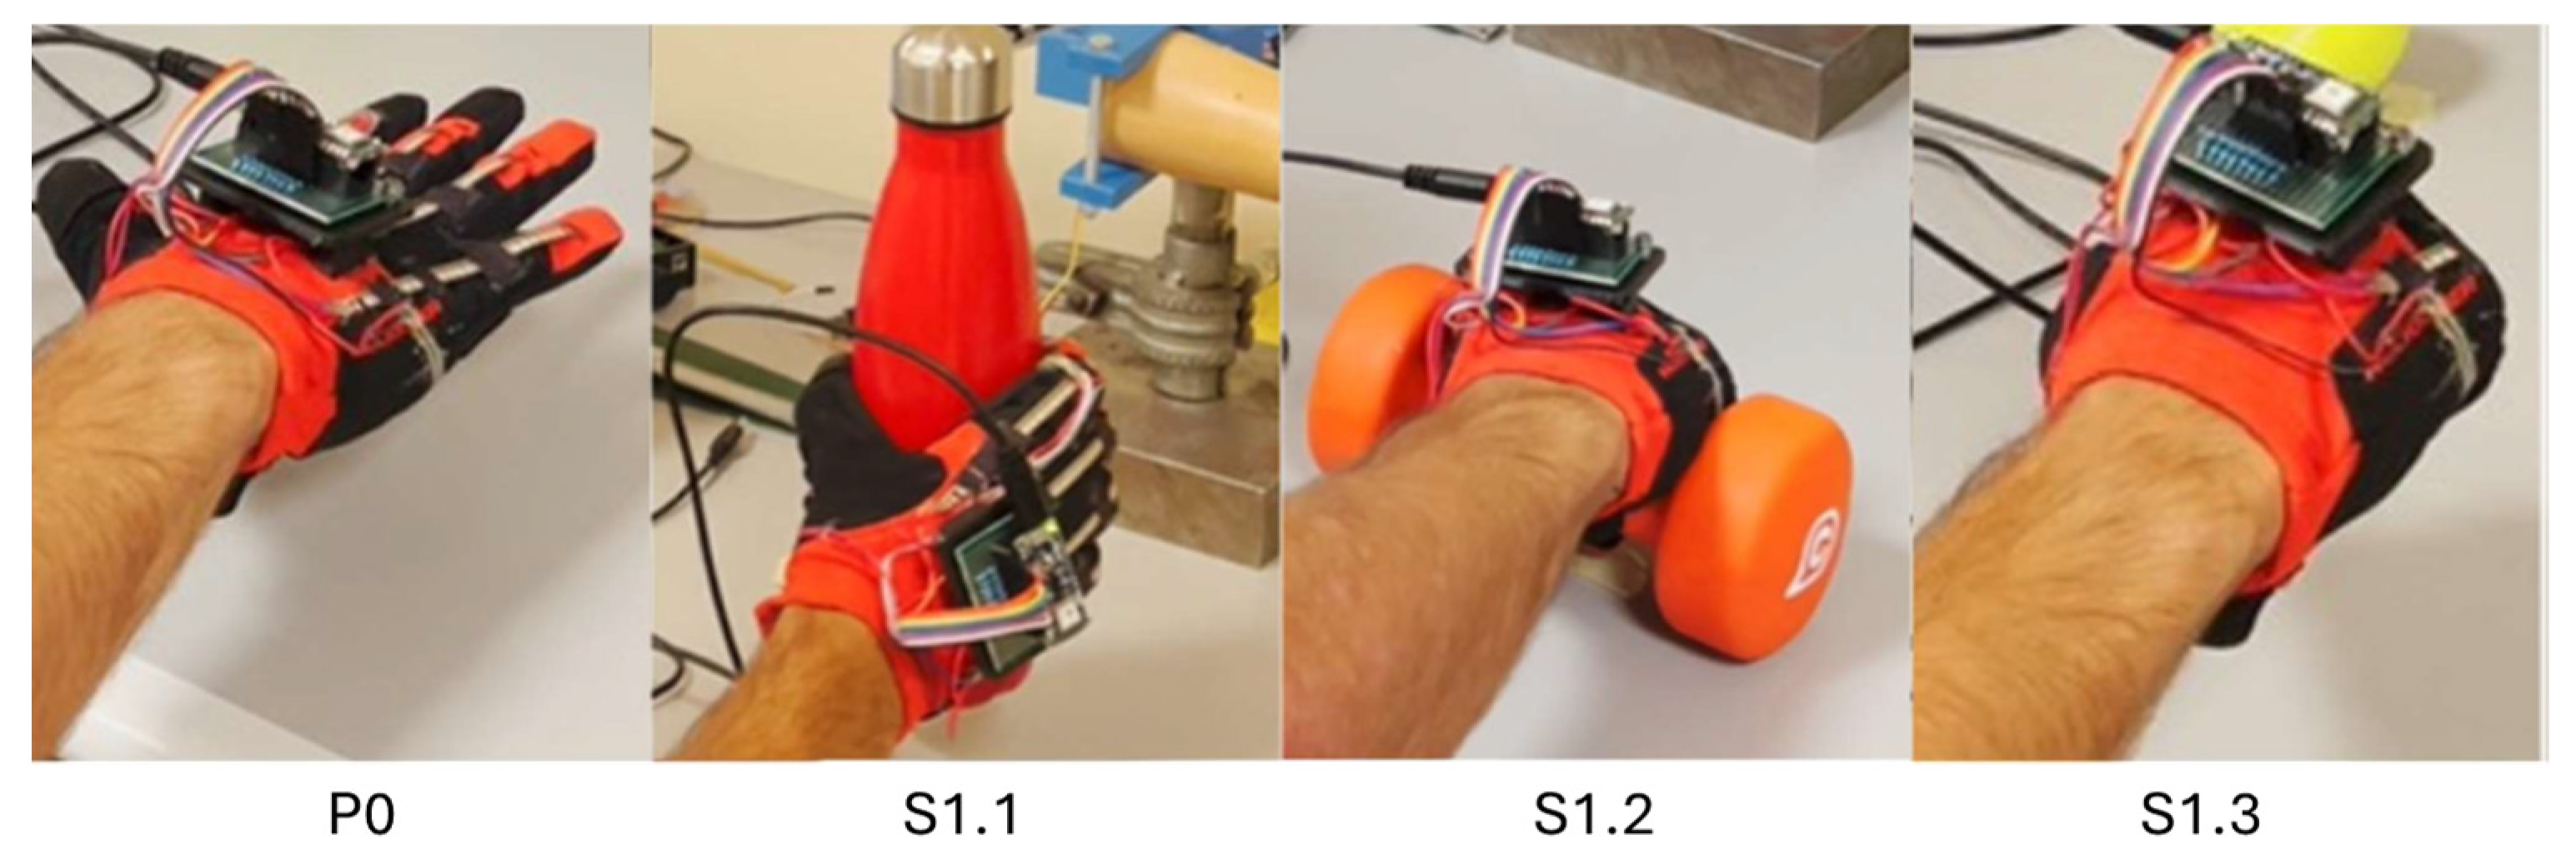
3.1. Laboratory Protocol

The smart glove was tested on one healthy subject (male, 25 years old) in two different sessions. The subject wore the smart glove on his right hand, which was his dominant side. Following at least 30 min of glove usage, participants completed the System Usability Scale (SUS) [37], a standardized and the most used questionnaire designed to evaluate the usability of products or systems based on subjective user feedback [38,39]. Follow-up questions were used to collect impressions of the proposed smart glove.
In the first session, the repeatability of the smart glove was assessed. The subject was placed in a seated position and asked to perform three tasks five times starting with the opened hand resting on the table (P0). Every repetition starts and ends when the subject takes the posture P0:
(S1.1)
Grasping a cylinder with a diameter of 70 mm (a flask) for a few seconds.
(S1.2)
Grasping a cylinder with a diameter of 38 mm (a handlebar) for a few seconds.
(S1.3)
Closing the hand for a few seconds. In this position, it is estimated that the subject grasps a virtual object with a diameter of 10 mm.
The two cylinders were positioned and fixed on the table.
The subject waited about five seconds between the repetitions.
The tasks are depicted in Figure 7.
In the second session, the smart glove was compared with a commercial glove focused on XR (Xsens Metagloves, Manus, The Netherlands). This commercial glove consists of five flex sensors for measuring the flexion and extension of MCP and PIP joints and one 9-axis IMU for measuring the orientation of the back of the hand. The sample rate is 60 Hz, and the declared orientation sensor accuracy is 2.5 degrees. The software supplied by the manufacturer provides the orientation of the hand (calculated from the IMUs sensors) and the flexion/extension of the MCP and the PIP joints. The two gloves were worn by the same subject at two different times. As in the first session, in the second session, the subject started in position P0 and he was asked to perform four more complex tasks five times:
(S1.1)
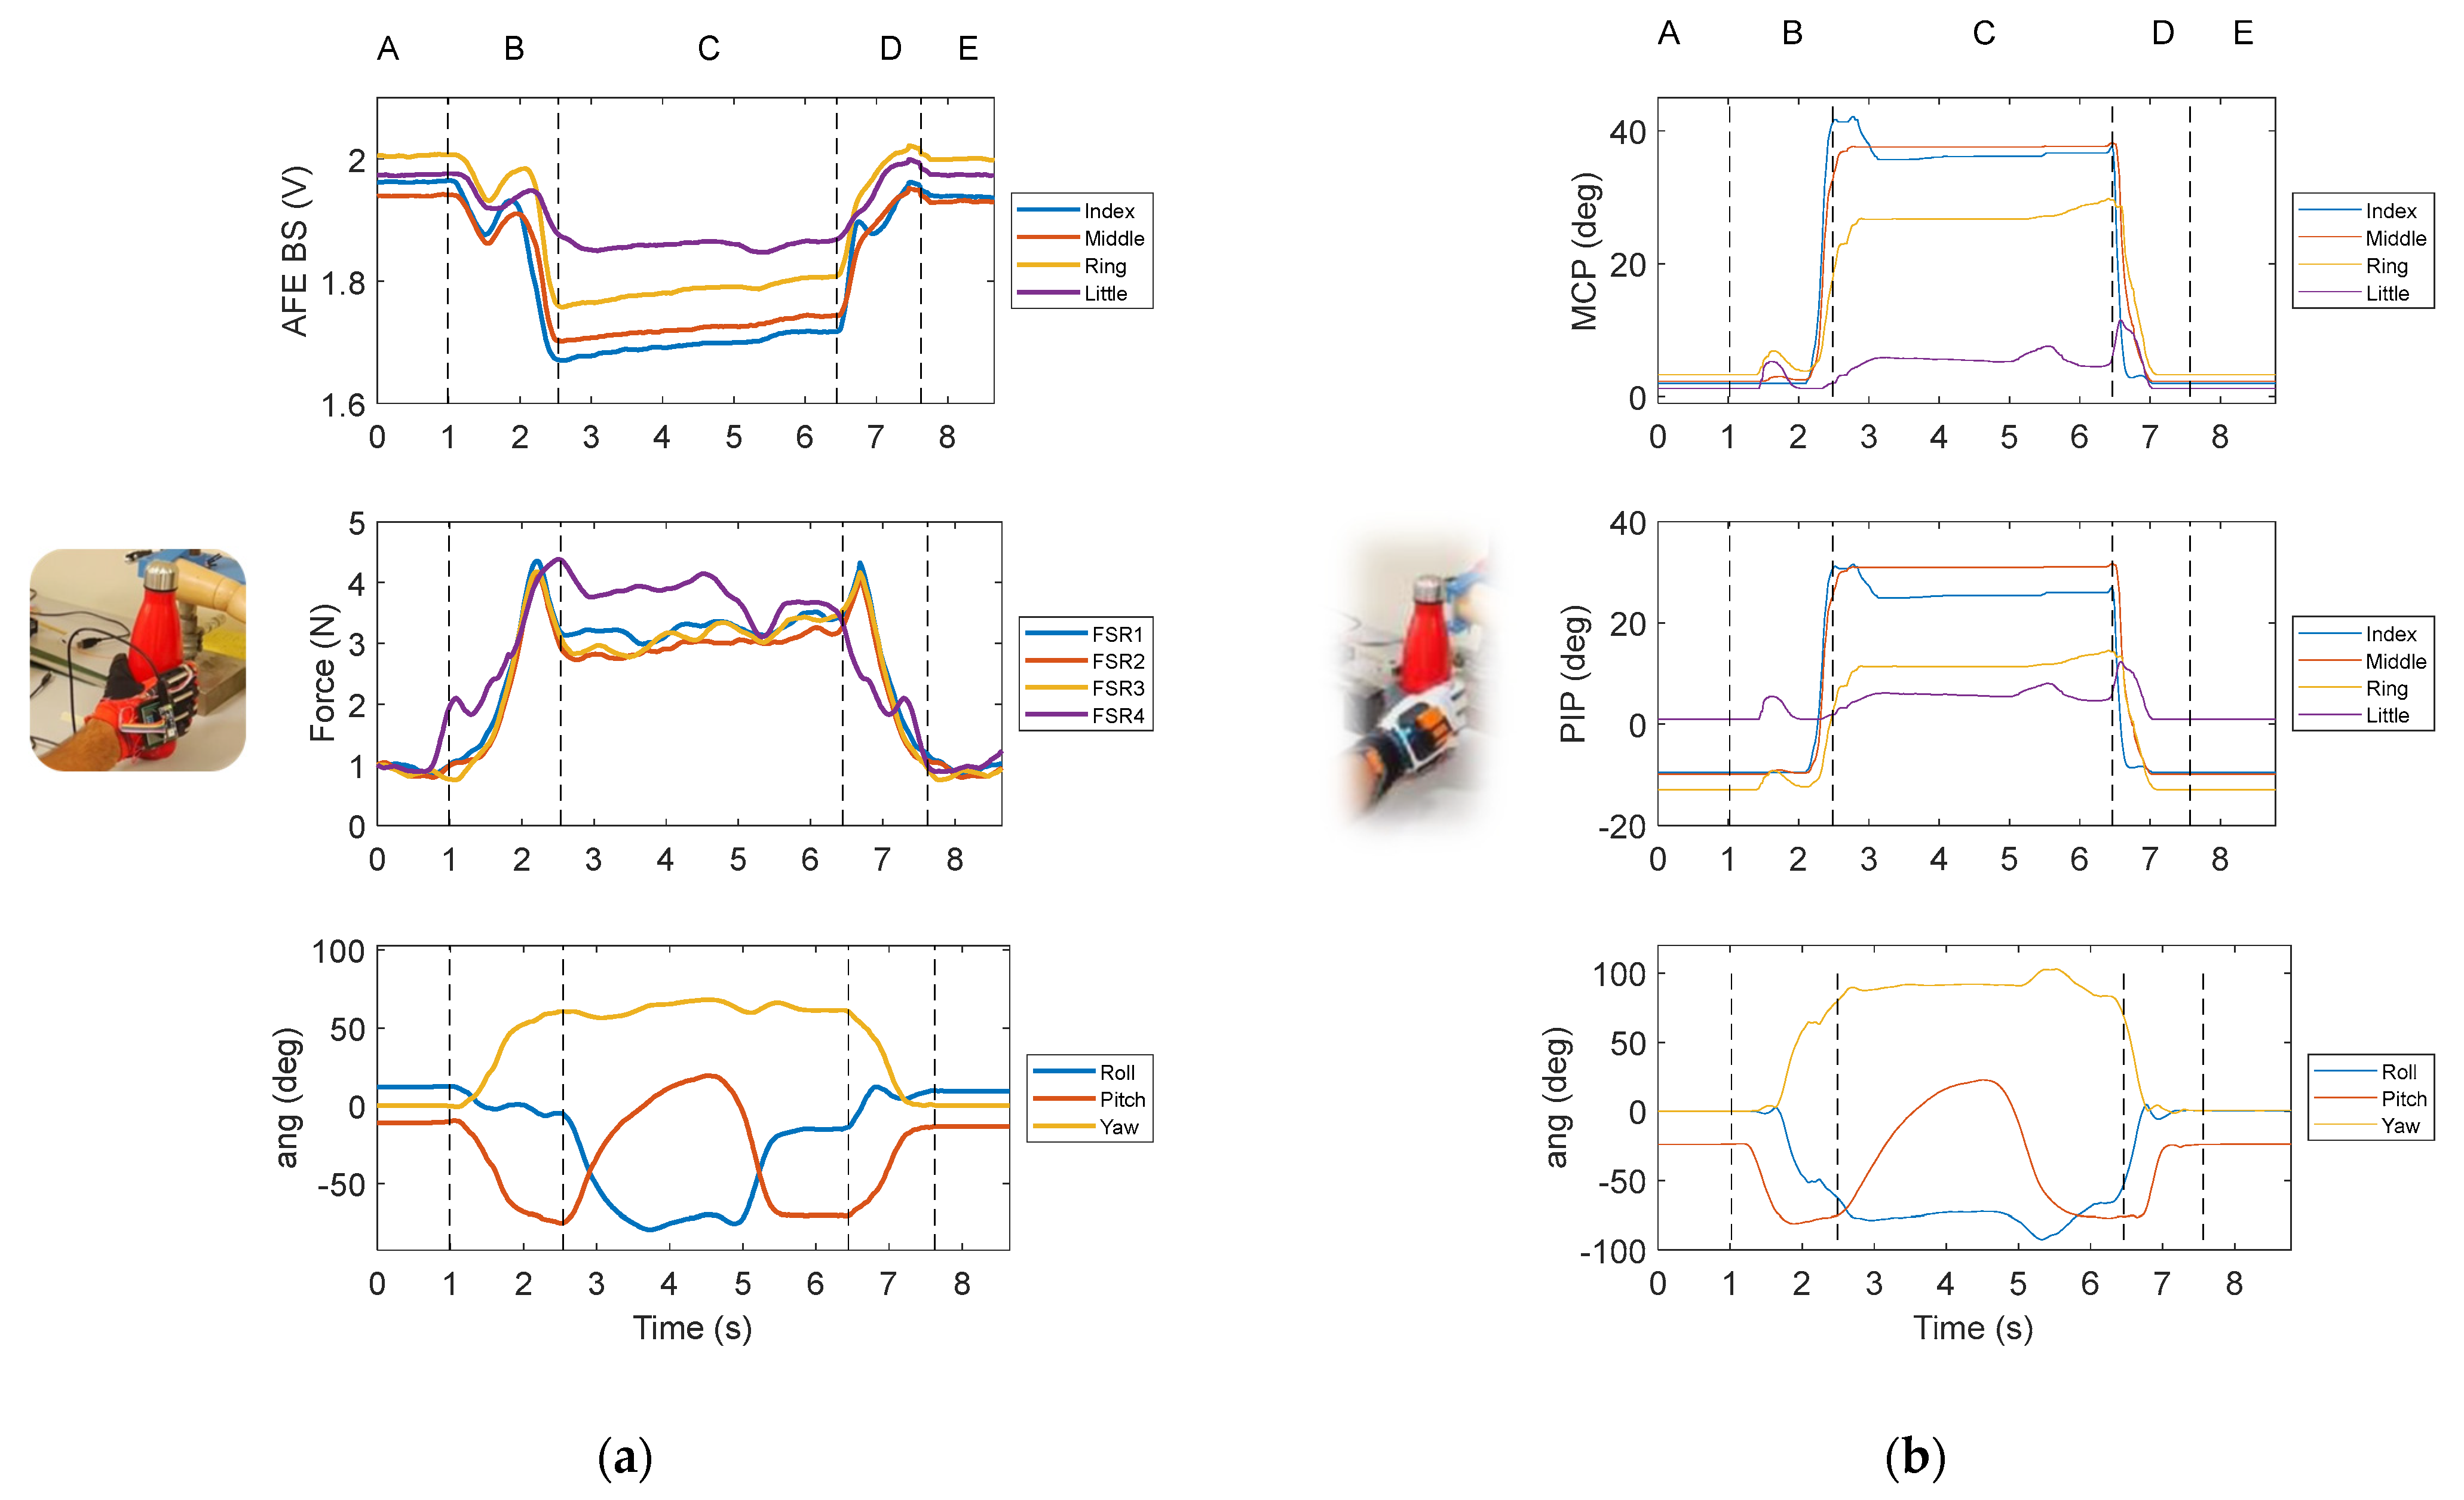
Grasping a flask (diameter of 70 mm), simulation of the drinking action, repositioning of the flask on the table (Figure 8).
(S1.2)
Grasping a handlebar (diameter of 38 mm), moving the object by 20 cm on the left without lifting it.
(S1.3)
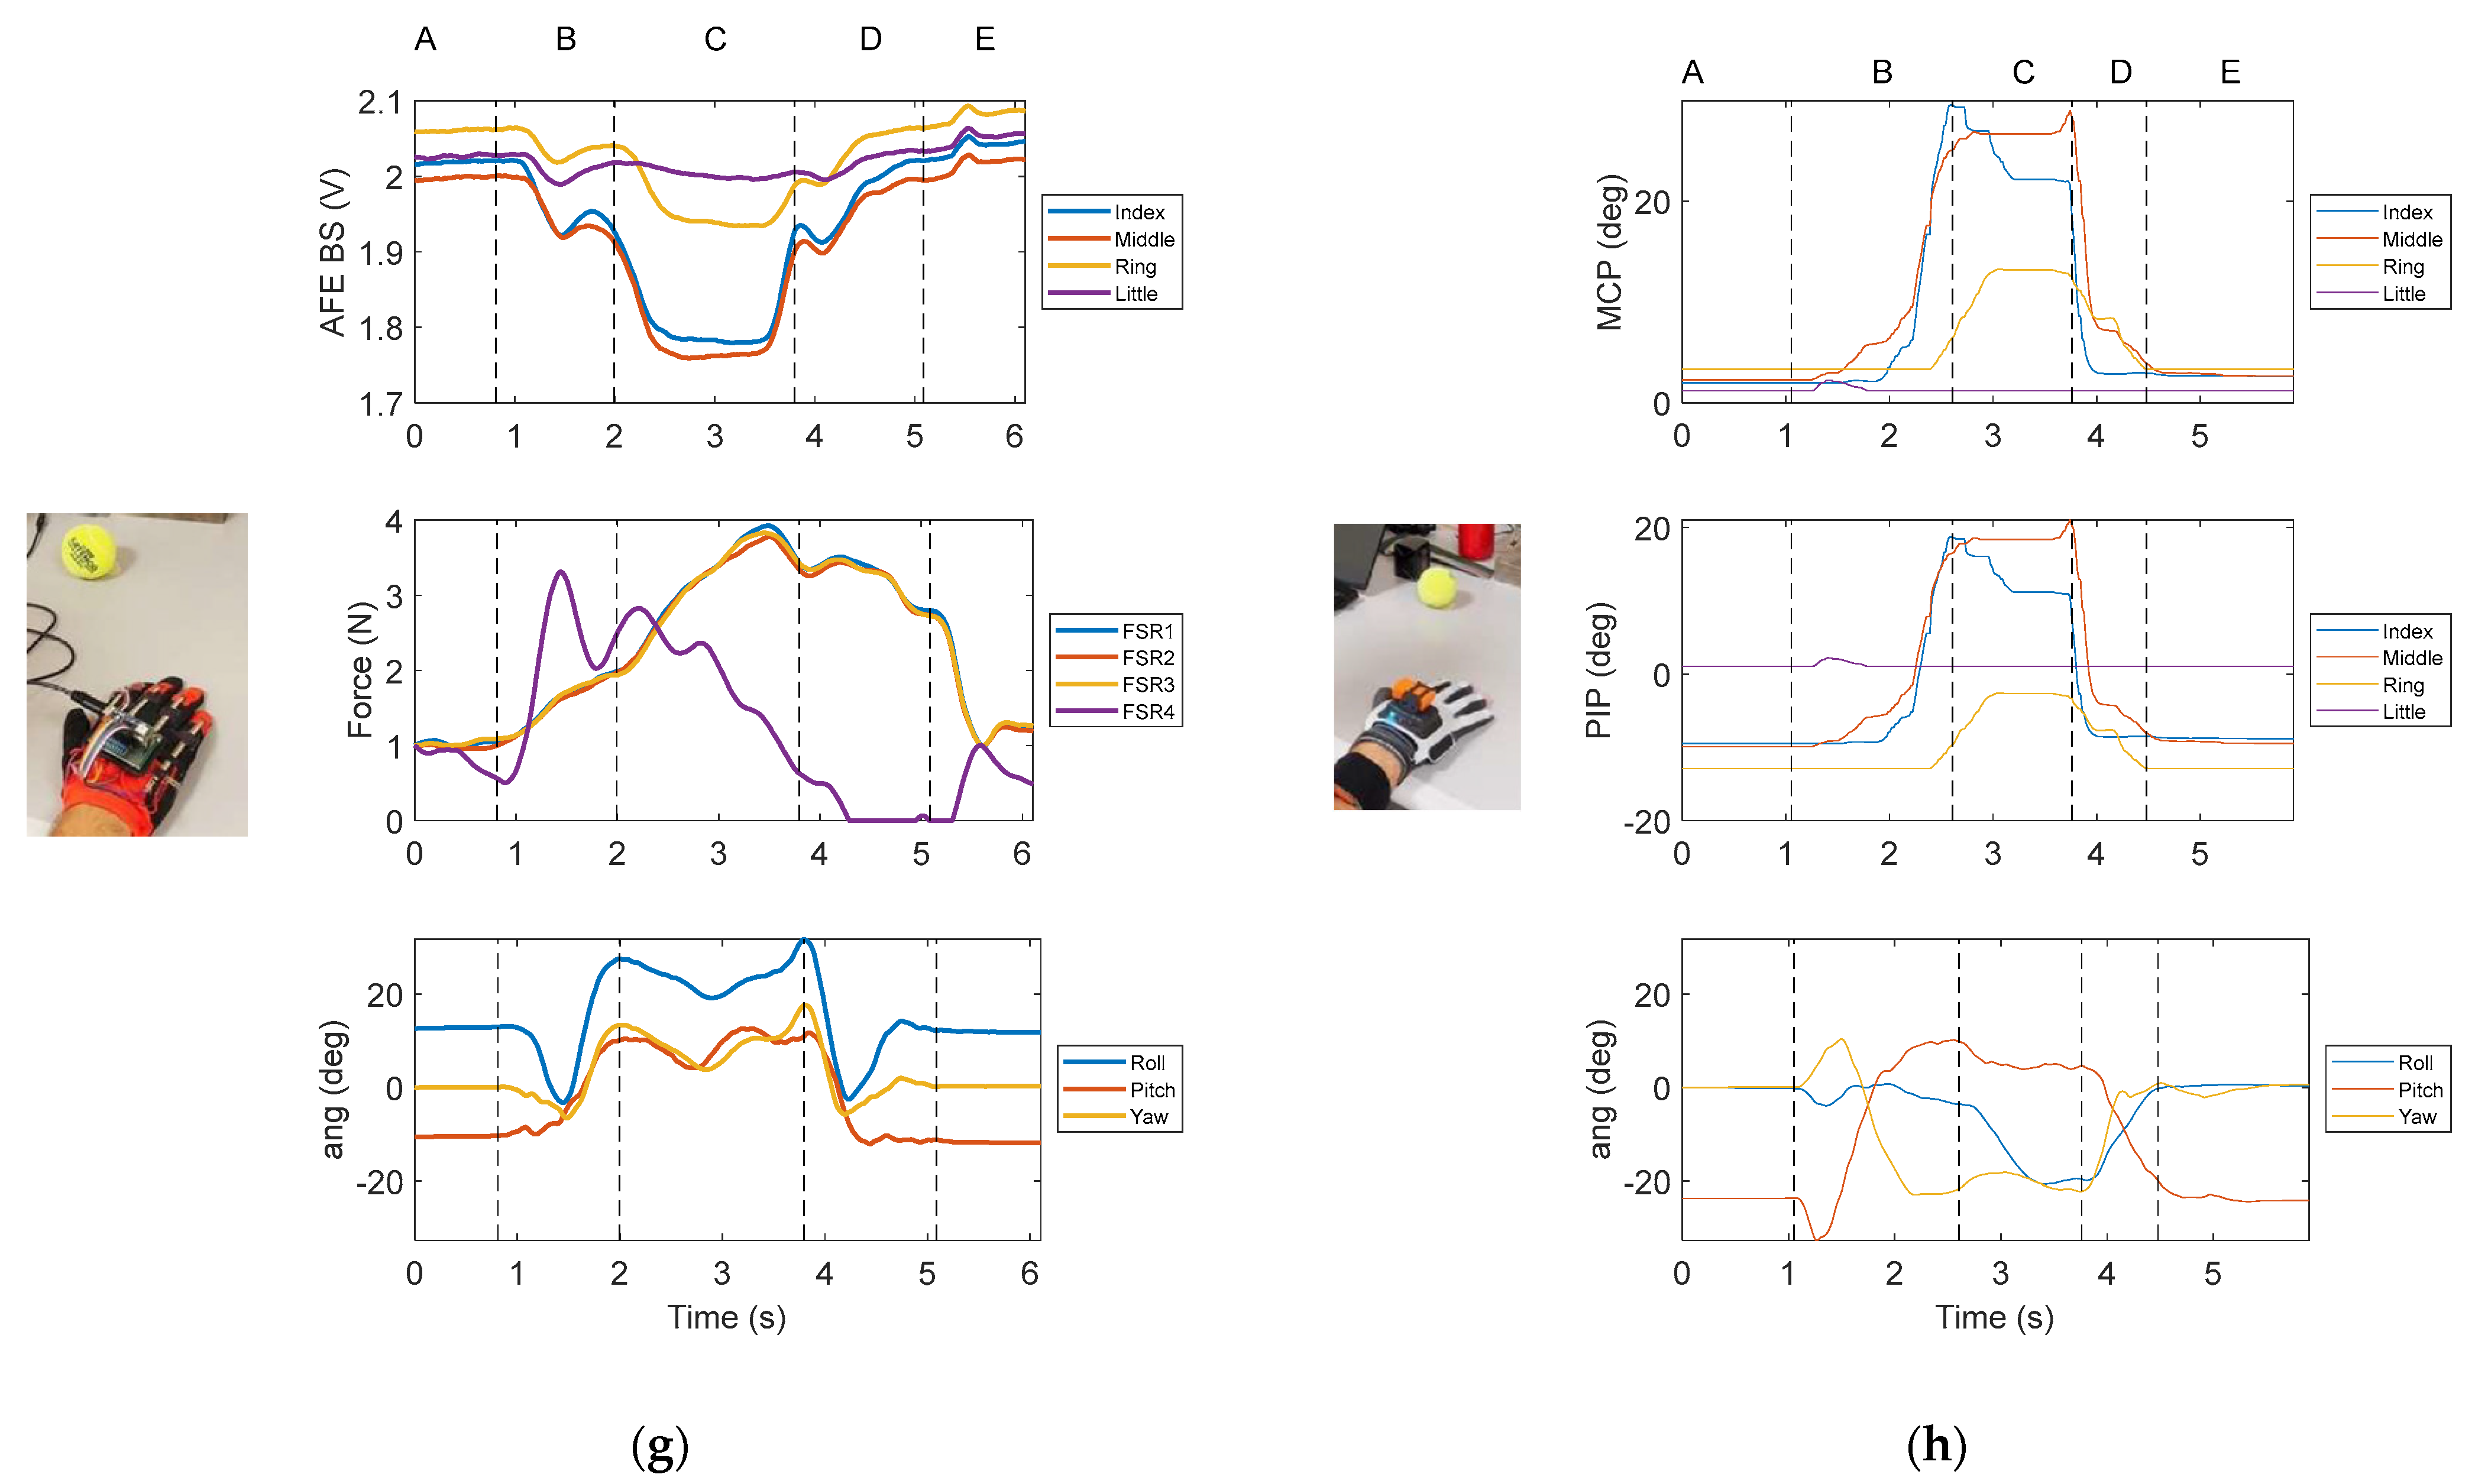
Grasping a tennis ball (diameter of 65 mm), moving the object by 20 cm on the left.
(S1.4)
Grasping a small box (48 mm × 48 mm × 66 mm), moving the object by 20 cm on the left (Figure 9).
As shown in Figure 8 and Figure 9, the tasks can be divided into five moments (A–E).

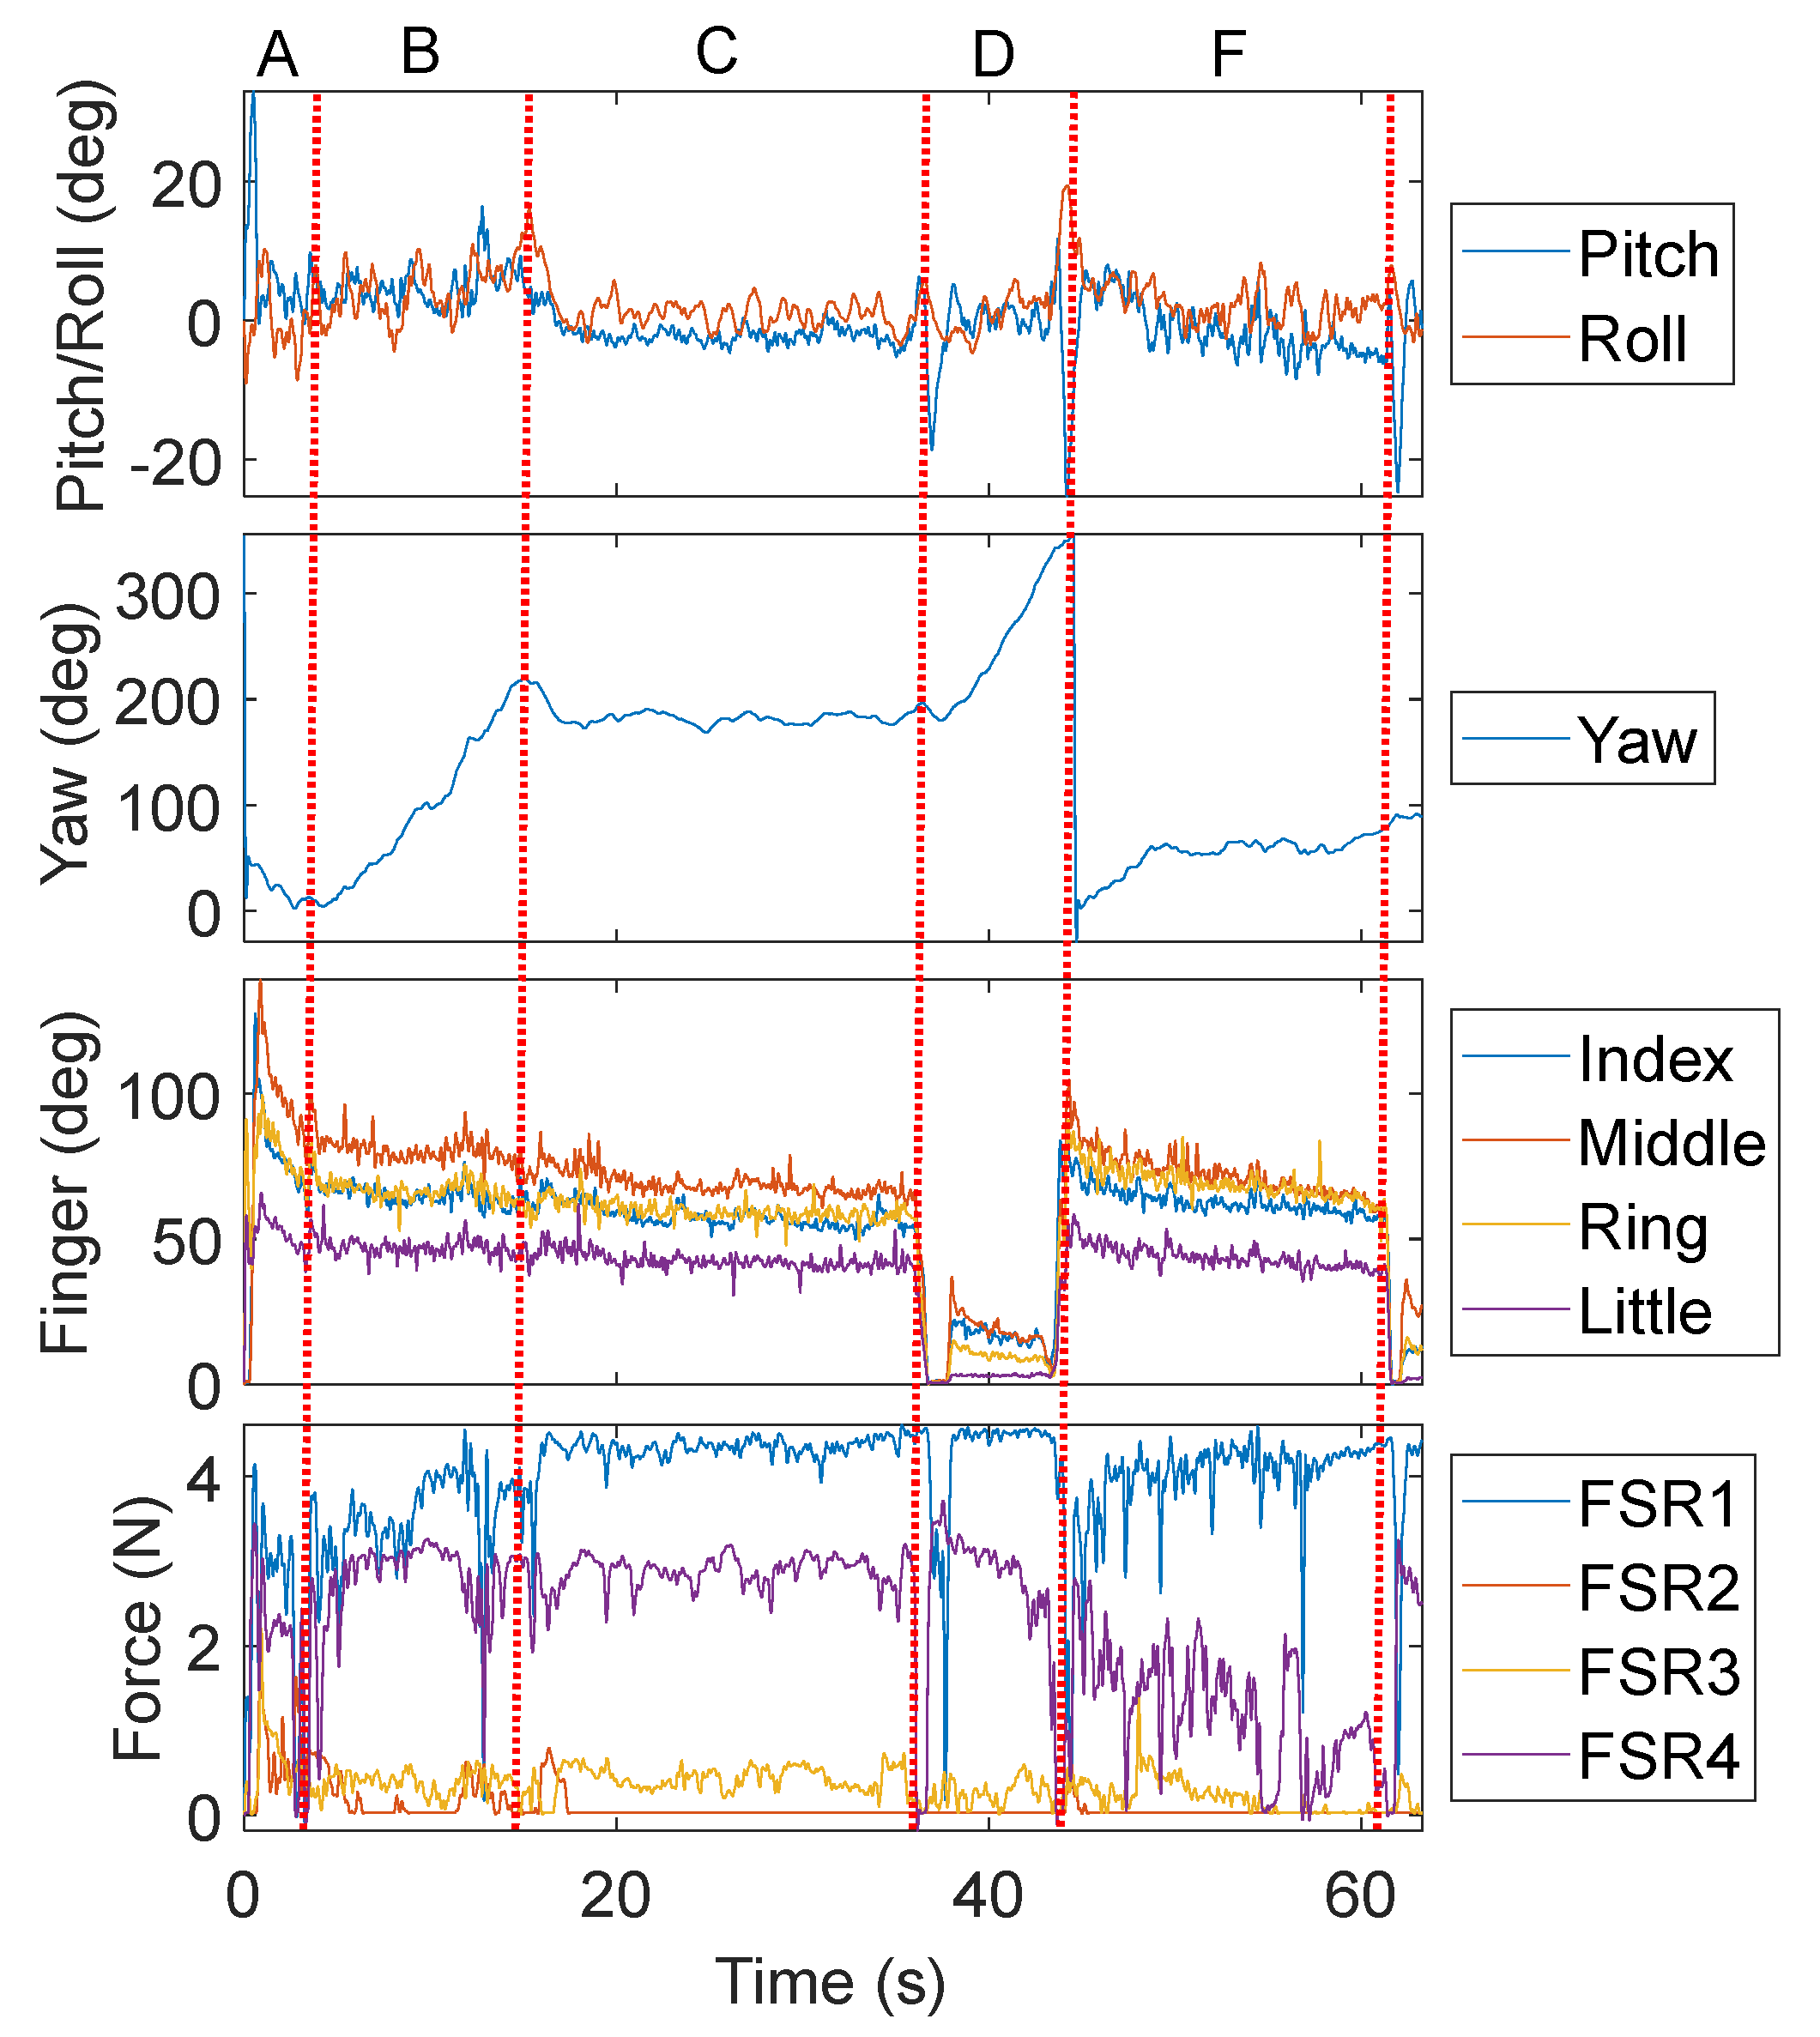
3.2. On-Field Protocol

The pilot experimental tests involved five right-handed healthy participants (three males and two females) aged between 37 and 46 years. All the subjects were informed about the experimental session, and they gave their free consent to participate. The task consisted of cycling along a 250 m track resembling an elliptic track. The section between the fourth and the first curve is characterized by a gravel surface, while the section between the second and the fourth curve has a tarmac surface. Participants were instructed to ride at their comfortable speed, brake at the third and fourth curves using their right hand (wearing the smart glove), and brake at the other curves using their left hand. The first curve is 25 m from the starting point. Each participant completed the circuit twice for each condition. Before starting, the participant has to keep the hand open, whereas the test starts when the hand is closed. The bicycle seat height was adjusted to three different positions, as depicted in Figure 10: the highest, the lowest, and the comfort level. Before starting the main trials, participants completed a practice lap to familiarize themselves with the procedure. After a 2 min rest, they performed two repetitions of the task for each seat position. All sessions were video-recorded.
Following 30 min of glove usage, participants completed the SUS.

4. Results and Discussion

4.1. Usability Results

SUS evaluation resulted in a score of 84.17, with a median of 85 and a standard deviation of 9.17. The grade assigned was A, indicating high acceptability and excellent performance. Individual question scores highlighted consistent positive feedback, with particularly strong ratings for ease of use and functionality. The conclusiveness of the study was measured at 35%, pointing to potential areas for further refinement.

4.2. Laboratory Results

In session 1, the repeatability was good, as shown in Figure 11a. For each, the trend of the output referred to each sensor is similar in each repetition of the same tasks. As expected, the bend sensors have a different response due to the size of the fingers: despite the object having a uniform section, the flexion/extension of the MCP and PIP joints are different according to the size of the phalanges, as also discussed in [15]. The output (the resistance) of the bend sensors on the index and the middle fingers is the smallest (greatest) since the flexion of these fingers is the greatest. By decreasing the diameter of the object, the output (resistance) decreases (increases) since the overall angle of finger flexion increases. Regarding the repeatability of the sensors, it was decided to take the resistance after Tbs seconds of grasping (in S1.1 is 1.5 s, in S1.2 is 0.6 s, in S1.3 is 2 s) and for 320 ms in order to calculate the mean output value. The considered period for each repetition is shown as shaded areas in Figure 11a. The resulting resistances of the same task were averaged, and the repeatability error was calculated as the experimental standard deviation multiplied by the coverage factor of 2.776 (based on t-distribution, level of confidence = 95%). In the worst case, the repeatability error is 1.7% in task S1.1. The relationship between the curvature (the reciprocal of the radius of the grasped object) and the output is shown in Figure 11b for each sensor.
Figure 12 shows some results obtained in the second session, and in particular the response of both gloves in one repetition for each task. Only one repetition is shown for better clarity since it was verified that the repeatability error was low and comparable to the one found in session 1. Regarding the hand orientation, deducted by the IMU of both gloves, the most significant task to analyze for comparison is S2.1 (Figure 12a) because in this task the subject significantly moves his hand. Both sensors (plotted on the bottom of Figure 12a,b) show the same trend. In the other cases, the hand orientation slightly changes during the grasping (phase B) and releasing actions (phase D) and is stable during the lifting phase (phase C). Regarding the measured force, only the proposed glove is able to provide force measurement: the force is obtained from the AFE_FSR outputs and their calibration curve. The maximum contact force between the glove and the grasped object is similar in all the tasks, except for S2.2 (here, the object, a handlebar, is the heaviest one). Indeed, the objects of S2.1, S2.3, and S2.4 (the flask, the ball, and the box, respectively) have similar weight, while the object of S2.2 needs greater force to perform the movements. Furthermore, as expected, all sensors measure similar force in S2.1 due to the flask shape that requires good contact with the palm and the fingers to perform the movements. Conversely, in S2.3 and S2.4, FSR4 (the force sensor located in the palm) measures the lowest force due to the shape of the ball and the box.
Regarding the flexion/extension of the finger, the AFE_BS outputs and the orientation of the MCP (ang_M) and PIP (ang_P) joints provided by the commercial glove were analyzed and compared. The obtained curves are comparable in terms of stability over time. The measurements of the proposed glove are similar to the ones obtained in S1: the greater the curvature of the object, the lower the signal of AFE_BS; for example, in the case of the ball, the flexion of the little is very low. The commercial glove is affected by overshooting in the first and final part of phase C and this overshoot increases according to the weight of the moved object; indeed, this phenomenon is more evident in S2.2, while in S2.1 the sensors show overshoot only in the initial part. Finally, the results in the middle of the task at Tbs (when the object is firmly grasped) were considered to obtain the calibration curve. In detail, the considered values of each bend sensor output are the average values of the ones measured at Tbs of each repetition. The relative change of the sensor resistance ΔR/R0 (R0 is the resistance when the hand is completely opened) was calculated by using Equation (1) and it is shown according to the sum of ang_M and ang_P in Figure 13. As expected, the relationship depends on the finger size, and it is not linear. The resistance is maximum when the subject grasped the handlebar because this is the object that needs the maximum flexion of the fingers, while it is the lowest when the subject grasped the ball because the grasping involves differently the rotation of the finger joints.
The accuracy of the proposed smart glove is less than other gloves reported in the literature specifically designed for measuring with high accuracy the range of motion of patients for diagnostic or rehabilitation purposes [40,41]. Indeed, in those cases, the smart gloves were designed to reach an accuracy between 0.5 and 2 degrees, but the complexity and the costs are greater, as reported in [40,41]. In this case, the final goal is the evaluation of the cyclists’ and riders’ movements and grasping to identify, for example, vibrational behavior or dynamics that can influence the user’s safety. Therefore, in this case, an accuracy of around 5 degrees can be considered sufficient to identify situations that can influence attention or performance while cycling. The proposed solution, despite its simplicity, can monitor the finger movements (excluding the thumb), the force exerted by the hand on the grasped object, and the orientation of the hand with smaller bulk and weight of component systems.

4.3. Field Results

Participant 1 and Participant 2 completed the course in (55 ± 5) seconds, Participant 3 and Participant 4 in (65 ± 5) seconds, and Participant 5 in (90 ± 5) seconds. Overall, when participants adjusted the seat to their comfort level, travel time was reduced by at least 2 s. In Figure 14, an example of the results collected during one field test is presented. These results correspond to the test in which Participant 3 rode the bicycle with the seat adjusted to a comfortable position. Throughout the test, the roll and pitch angles remained relatively stable (except for Phase D), because the participant kept the hand in a consistent position on the handlebar. A noticeable variation occurred at the beginning and end of Phase D. These fluctuations were attributed to the participant’s braking actions. Indeed, during Phase D, the participant opened their hand to use the brake and later re-grasped the handlebar after braking. These actions resulted in slight variations in the pitch and roll angles, as well as in finger positioning. When the right hand was gripping the handlebar, finger flexion was at its maximum. Conversely, during Phase D, the participant opened and closed their hand twice—once at the third curve and again at the fourth curve. Between these two actions, the participant briefly re-grasped the handlebar, adjusting finger positioning in preparation for the upcoming curve. The force sensor data further supported these observations, reinforcing the relationship between hand movements and mechanical interactions with the handlebar. When comparing data for a single participant, no significant differences in finger flexion or extension were observed regardless of the seat position; flexion was always greatest at the middle joints and minimal at the little joints. Monitoring finger flexion is essential for detecting braking actions. Handlebar grasping can be assessed by evaluating the pitch angle, which correlates with wrist flexion: the pitch angle is positive (around 25 ± 5 degrees) when the seat is at its highest position, negative (around −20 ± 10 degrees) when the seat is at its lowest, and nearly neutral in the comfort position. Additionally, the force sensor response varies with seat position: in the comfort position, the force is distributed evenly across the palm, particularly around FSR1 and FSR4, whereas in other seat positions, a significant force is recorded only by FSR1. Although the glove does not measure acceleration, the pitch angle and force sensor responses provide some information about vibrations from the road surface, as illustrated in Figure 14 by the amplitude of fluctuations. Specifically, in phases A, B, and F, the response of these quantities was more influenced by disturbances, while in phases C and D, the response remained more stable. Similar results were observed for all participants.

5. Conclusions

The present work investigated the implementation of a wearable system, specifically a smart glove, for comfort monitoring in light mobility. The main objective was to develop a new wearable solution while driving in order to make it possible to monitor a series of parameters in real time, mainly addressing hand postures and exerted forces while driving or riding. Through an in-depth review of the literature, it was possible to fabricate a working prototype of a wearable glove that incorporates sensors to collect data relating to the flexion of the phalanges, the pressure exerted by the hand, and the orientation in the space taken up by the hand. The results obtained during the experimental tests carried out demonstrated that the proposed wearable system can provide detailed information on the subject’s actions, driving style, and road surface, also thanks to the characterization phases performed individually on all types of sensors used. This information, in combination with experts’ experience, could be used as a support for improving the comfort and the safety of the users during biking.
However, it is important to highlight that the proposed wearable system is still in the development stage and requires further research and improvements. In the future, it may be useful to further explore the effect of other factors, such as the flexibility of the glove materials used or the location of the sensors on the glove. Furthermore, it is necessary to evaluate the reliability and durability of the sensors used to ensure accurate and consistent results over time. Aspects to consider for further development concern the external geometry of the gloves, which could be revised in order to optimally support the Arduino Nano board and the integration of a power source. Using additive manufacturing technology, a well-integrated housing for the microcontroller could be developed, making the visual appearance of the gloves lighter and more solid, making them suitable for real everyday use. Another aspect is energy management and the integration of a lighter and high-efficiency lithium battery.

Author Contributions

Conceptualization, M.S. and N.F.L.; methodology, M.S.; software, M.B.; validation, N.F.L. and M.B.; formal analysis, M.B.; investigation, M.B.; resources, M.B.; data curation, M.B.; writing—original draft preparation, M.B.; writing—review and editing, M.B.; visualization, M.B.; supervision, M.S.; project administration, N.F.L. and M.B.; funding acquisition, N.F.L. and M.B. All authors have read and agreed to the published version of the manuscript.

Funding

This study was carried out within the MOST—Sustainable Mobility National Research Center and received funding from the European Union Next-GenerationEU (PIANO NAZIONALE DI RIPRESA E RESILIENZA (PNRR)—MISSIONE 4 COMPONENTE 2, INVESTIMENTO 1.4—D.D. 1033 17/06/2022, CN00000023), Spoke 5 “Light Vehicle and Active Mobility”. This manuscript reflects only the authors’ views and opinions; neither the European Union nor the European Commission can be considered responsible for them.

Data Availability Statement

The raw data supporting the conclusions of this article will be made available by the authors on request.

Acknowledgments

The authors thank Nicola Dainesi for his technical support in the experimental results.

Conflicts of Interest

The authors declare no conflicts of interest.

References

  1. Olieman, M.; Marin-Perianu, R.; Marin-Perianu, M. Measurement of dynamic comfort in cycling using wireless acceleration sensors. Procedia Eng. 2012, 34, 568–573. [Google Scholar] [CrossRef]
  2. Vanwalleghem, J.; De Baere, I.; Loccufier, M.; Van Paepegem, W. Dynamic Calibration of a Strain Gauge Based Handlebar Force Sensor for Cycling Purposes. Procedia Eng. 2015, 112, 219–224. [Google Scholar] [CrossRef]
  3. Doria, A.; Marconi, E.; Munoz, L.; Polanco, A.; Suarez, D. An experimental-numerical method for the prediction of on-road comfort of city bicycles. Veh. Syst. Dyn. 2021, 59, 1376–1396. [Google Scholar] [CrossRef]
  4. Li, Z.; Wang, W.; Liu, P.; Schneider, R.; Ragland, D.R. Investigating Bicyclists’ Perception of Comfort on Physically Separated Bicycle Paths in Nanjing, China. Transp. Res. Rec. J. Transp. Res. Board 2012, 2317, 76–84. [Google Scholar] [CrossRef]
  5. Zhu, S.; Zhu, F. Cycling comfort evaluation with instrumented probe bicycle. Transp. Res. Part A Policy Pract. 2019, 129, 217–231. [Google Scholar] [CrossRef]
  6. Cai, Y.; Li, X.; Li, J. Emotion Recognition Using Different Sensors, Emotion Models, Methods and Datasets: A Comprehensive Review. Sensors 2023, 23, 2455. [Google Scholar] [CrossRef]
  7. Stefana, E.; Marciano, F.; Rossi, D.; Cocca, P.; Tomasoni, G. Wearable Devices for Ergonomics: A Systematic Literature Review. Sensors 2021, 21, 777. [Google Scholar] [CrossRef]
  8. Huang, X.; Xue, Y.; Ren, S.; Wang, F. Sensor-Based Wearable Systems for Monitoring Human Motion and Posture: A Review. Sensors 2023, 23, 9047. [Google Scholar] [CrossRef]
  9. Millour, G.; Velásquez, A.T.; Domingue, F. A literature overview of modern biomechanical-based technologies for bike-fitting professionals and coaches. Int. J. Sports Sci. Coach. 2023, 18, 292–303. [Google Scholar] [CrossRef]
  10. Chandel, R.; Sharma, S.; Kaur, S.; Sehijpal, S.; Kumar, R. Smart watches: A review of evolution in bio-medical sector. Mater. Today Proc. 2021, 50, 1053–1066. [Google Scholar] [CrossRef]
  11. Angelucci, A.; Cavicchioli, M.; Cintorrino, I.; Lauricella, G.; Rossi, C.; Strati, S.; Aliverti, A. Smart Textiles and Sensorized Garments for Physiological Monitoring: A Review of Available Solutions and Techniques. Sensors 2021, 21, 814. [Google Scholar] [CrossRef] [PubMed]
  12. Medical, S. Starboard Medical’s Skin Temperature Sensor. Available online: https://starboardmedical.com/skin-sensors/ (accessed on 30 January 2025).
  13. Katsis, C.D.; Katertsidis, N.; Ganiatsas, G.; Fotiadis, D.I. Toward Emotion Recognition in Car-Racing Drivers: A Biosignal Processing Approach. IEEE Trans. Syst. Man Cybern.-Part A Syst. Hum. 2008, 38, 502–512. [Google Scholar] [CrossRef]
  14. Wilkinson, R.D.; Lichtwark, G.A. Evaluation of an inertial measurement unit-based approach for determining centre-of-mass movement during non-seated cycling. J. Biomech. 2021, 126, 110441. [Google Scholar] [CrossRef]
  15. Borghetti, M.; Lopomo, N.F.; Serpelloni, M. Characterization Method for Bending Sensor Applied for Smart Glove. In Proceedings of the 2024 IEEE International Workshop on Metrology for Industry 4.0 & IoT (MetroInd4.0&IoT), Firenze, Italy, 29–31 May 2024. [Google Scholar]
  16. Williams, N.W. The virtual hand: The Pulvertaft prize essay for 1996. J. Hand Surg. Am. 1997, 22, 560–567. [Google Scholar] [CrossRef]
  17. Simone, L.K.; Sundarrajan, N.; Luo, X.; Jia, Y.; Kamper, D.G. A low cost instrumented glove for extended monitoring and functional hand assessment. J. Neurosci. Methods 2007, 160, 335–348. [Google Scholar] [CrossRef]
  18. Gentner, R.; Classen, J. Development and evaluation of a low-cost sensor glove for assessment of human finger movements in neurophysiological settings. J. Neurosci. Methods 2009, 178, 138–147. [Google Scholar] [CrossRef]
  19. Pompili, G.; Baldi, T.L.; Barcelli, D.; Prattichizzo, D. Development of a Low-cost Glove for Thumb Rehabilitation: Design and Evaluation. In Proceedings of the 2020 IEEE International Conference on Human-Machine Systems (ICHMS), Rome, Italy, 7–9 September 2020; pp. 1–7. [Google Scholar]
  20. O’Flynn, B.; Torres, J.; Connolly, J.; Condell, J.; Curran, K.; Gardiner, P. Novel smart sensor glove for arthritis rehabiliation. In Proceedings of the 2013 IEEE International Conference on Body Sensor Networks, Cambridge, MA, USA, 6–9 May 2013; pp. 1–6. [Google Scholar]
  21. Castro, M.C.F.; Cliquet, A. A low-cost instrumented glove for monitoring forces during object manipulation. IEEE Trans. Rehabil. Eng. 1997, 5, 140–147. [Google Scholar] [CrossRef]
  22. Yu, H.; Zheng, D.; Liu, Y.; Chen, S.; Wang, X.; Peng, W. Data Glove with Self-Compensation Mechanism Based on High-Sensitive Elastic Fiber-Optic Sensor. Polymers 2023, 15, 100. [Google Scholar] [CrossRef]
  23. Büscher, G.H.; Kõiva, R.; Schürmann, C.; Haschke, R.; Ritter, H.J. Flexible and stretchable fabric-based tactile sensor. Rob. Auton. Syst. 2015, 63, 244–252. [Google Scholar] [CrossRef]
  24. Tavares, R.; Abreu, P.; Quintas, M. Instrumented glove for rehabilitation exercises. In Proceedings of the 2015 3rd Experiment International Conference (exp.at’15), Ponta Delgada, Portugal, 2–4 June 2015; pp. 107–108. [Google Scholar]
  25. O’Flynn, B.; Sanchez-Torres, J.; Tedesco, S.; Walsh, M. Challenges in the Development of Wearable Human Machine Interface Systems. In Proceedings of the Technical Digest-International Electron Devices Meeting, IEDM, San Francisco, CA, USA, 7–11 December 2019; pp. 10.4.1–10.4.4. [Google Scholar]
  26. Austin, E.F.J.; Kearney, C.P.; Chacon, P.J.; Winges, S.A.; Acharya, P.; Choi, J.-W. A Fabricated Force Glove That Measures Hand Forces during Activities of Daily Living. Sensors 2022, 22, 1330. [Google Scholar] [CrossRef]
  27. Mohd Ali, A.; Ambar, R.; Abdul Jamil, M.M. Development of Artificial Hand Gripper by using Microcontroller. Int. J. Integr. Eng. 2011, 3, 47–54. [Google Scholar]
  28. Park, J.; Heo, P.; Kim, J.; Na, Y. A Finger Grip Force Sensor with an Open-Pad Structure for Glove-Type Assistive Devices. Sensors 2020, 20, 4. [Google Scholar] [CrossRef]
  29. Spectraflex Flex Sensors. Available online: https://www.spectrasymbol.com/resistive-flex-sensors/spectraflex-flex-sensors (accessed on 30 January 2025).
  30. Borghetti, M.; Sardini, E.; Serpelloni, M. Evaluation of bend sensors for limb motion monitoring. In Proceedings of the IEEE MeMeA 2014—IEEE International Symposium on Medical Measurements and Applications, Lisbon, Portugal, 11–12 June 2014. [Google Scholar]
  31. Yu, S.-H.; Chang, J.-S.; Tsai, C.-H.D. Grasp to See—Object Classification Using Flexion Glove with Support Vector Machine. Sensors 2021, 21, 1461. [Google Scholar] [CrossRef]
  32. Kamper, D.G.; Cruz, E.G.; Siegel, M.P. Stereotypical Fingertip Trajectories During Grasp. J. Neurophysiol. 2003, 90, 3702–3710. [Google Scholar] [CrossRef]
  33. Interlink Electronics FSR® 400 Series. Available online: https://www.interlinkelectronics.com/fsr-400-series (accessed on 30 January 2025).
  34. Starke, J.; Chatzilygeroudis, K.; Billard, A.; Asfour, T. On Force Synergies in Human Grasping Behavior. In Proceedings of the 2019 IEEE-RAS 19th International Conference on Humanoid Robots (Humanoids), Toronto, ON, Canada, 15–17 October 2019; pp. 72–78. [Google Scholar]
  35. Qiang, T.G.; Yuan, L.J.; Feng, J.X. Research on virtual testing of hand pressure distribution for handle grasp. In Proceedings of the 2011 International Conference on Mechatronic Science, Electric Engineering and Computer (MEC), Jilin, China, 19–22 August 2011; pp. 1610–1613. [Google Scholar]
  36. Lee, J.K.; Choi, M.J. Robust Inertial Measurement Unit-Based Attitude Determination Kalman Filter for Kinematically Constrained Links. Sensors 2019, 19, 768. [Google Scholar] [CrossRef]
  37. Brooke, J. SUS-A quick and dirty usability scale. Usability Eval. Ind. 1996, 189, 4–7. [Google Scholar]
  38. Andreoni, G. Investigating and Measuring Usability in Wearable Systems: A Structured Methodology and Related Protocol. Appl. Sci. 2023, 13, 3595. [Google Scholar] [CrossRef]
  39. Moulaei, K.; Moulaei, R.; Bahaadinbeigy, K. The most used questionnaires for evaluating the usability of robots and smart wearables: A scoping review. Digit. Health 2024, 10, 20552076241237384. [Google Scholar] [CrossRef]
  40. Caeiro-Rodríguez, M.; Otero-González, I.; Mikic-Fonte, F.A.; Llamas-Nistal, M. A Systematic Review of Commercial Smart Gloves: Current Status and Applications. Sensors 2021, 21, 2667. [Google Scholar] [CrossRef]
  41. Henderson, J.; Condell, J.; Connolly, J.; Kelly, D.; Curran, K. Review of Wearable Sensor-Based Health Monitoring Glove Devices for Rheumatoid Arthritis. Sensors 2021, 21, 1576. [Google Scholar] [CrossRef]
Figure 1. (a) Front view and (b) back view of the proposed smart glove for comfort level evaluation. The glove is equipped with four bend sensors (BSs) for flexion–extension finger measurements, four force-sensitive resistors (FSRs) for pressure measurements, and one inertial measurement unit (IMU) for hand position measurement. The signals of BSs and FSRs are conditioned by a simple analog front-end (AFE) and they are acquired by a microcontroller (MCU). The MCU elaborates and sends data via Bluetooth.
Instruments 09 00006 g001
Figure 2. Block diagram of the smart glove. The glove is battery-powered. BSs are bend sensors for measuring flexion and extension of the fingers and FSRs are force sensor resistors for measuring the force exerted by index and palm on the grasped object. The analog sensors are connected to the dedicated analog front-end (AFE), whose outputs are voltage signals connected to a microcontroller (IMU + MPU device) through a dedicated analog-to-digital converter for each sensor (ADC). The microcontroller provides the power to the AFEs and includes an inertial measurement unit. The data acquired by the MPU are sent via Bluetooth.
Instruments 09 00006 g002
Figure 3. (a) Bend sensor attachment; (b) analog front-end for the four bend sensors (AFE_BS).
Instruments 09 00006 g003
Figure 4. (a) FSR positions on the glove and their label; (b) analog front-end for the four bend sensors.
Instruments 09 00006 g004
Figure 5. ADC4 output according to the applied load and its fitting line calculated by using the least squares method.
Instruments 09 00006 g005
Figure 6. Smart glove electronics. The board is composed of MCU, IMU, and AFE blocks.
Instruments 09 00006 g006
Figure 7. Tasks performed in session 1. In P0, the hand is kept open. In S1.1, the subject grasps a flask. In S1.2, the subject grasps a handlebar. In S1.3, the hand is kept closed.
Instruments 09 00006 g007
Figure 8. Task S2.1 performed in session 2. (A) start position P0; (B) grasping; (C) drinking action; (D) positioning; (E) end position P0.
Instruments 09 00006 g008
Figure 9. Task S2.4 performed in session 2. (A) start position P0; (B) grasping; (C) moving action; (D) positioning on the left; (E) end position P0.
Instruments 09 00006 g009
Figure 10. Bicycle seat positions for field protocol: (A) the highest, (B) the lowest, and (C) the comfort level.
Instruments 09 00006 g010
Figure 11. Results of session 1. (a) Bend sensor resistance in the three tasks. Each curve is the response of each bend sensor. The shaded areas (width of 320 ms) indicate where the resistance was considered to evaluate the repeatability. (b) Relationship between the curvature of the grasped objects and the measured resistances for each finger.
Instruments 09 00006 g011
Figure 12. Results of session 2. (a,c,e,g) S2.1-4 using the proposed smart glove. The resistance four bend sensors are shown on the top plot, the resistance of the FSRs is shown in the middle, and the orientation of the hand is shown on the bottom plot. (b,d,f,h) S2.1-4 using the commercial glove. The calculated flexion of the MCP and PIP joints are shown on the top and middle plots, respectively, and the orientation of the hand is shown on the bottom plot.
Instruments 09 00006 g012aInstruments 09 00006 g012bInstruments 09 00006 g012c
Figure 13. Relationship between the resistance of the bend sensors and the measured MCP and DIP joint angle (from Xsens Metagloves by Manus) for each finger. The values were taken when the object was firmly grasped.
Instruments 09 00006 g013
Figure 14. Results of one field test (Participant 3, seat in the comfort position). In B, the participant navigated through the first and second curves using the left hand for braking. In D, at the third and fourth curves, he applied the brake with his right hand, which is equipped with the smart glove. In C and D, the road surface is tarmac, while in A, B, and F, the road surface is gravel.
Instruments 09 00006 g014
Disclaimer/Publisher’s Note: The statements, opinions and data contained in all publications are solely those of the individual author(s) and contributor(s) and not of MDPI and/or the editor(s). MDPI and/or the editor(s) disclaim responsibility for any injury to people or property resulting from any ideas, methods, instructions or products referred to in the content.

