1. Introduction
Raman spectroscopy is a widely used technique for studying sample properties thanks to its many advantages, among which various sample types can be investigated, such as solids, liquids, and gases. From a theoretical perspective, Raman spectroscopy is a vibrational spectroscopy method in which the interaction of light with molecular vibrations is studied. It is a two-photon event where the incident light is scattered, the incident photon having greater energy than the scattered one (Raman Stokes scattering). If the scattered radiation has a greater energy than the incident one, it is called Raman anti-Stokes scattering. Temperature is the factor that determines the ratio between the intensities of the Stokes and anti-Stokes bands, according to Boltzmann’s law. At room temperature, the anti-Stokes Raman lines have a very weak intensity compared to the Stokes ones [
1]. Almost all materials exhibit Raman scattering, except pure metals, because they are highly reflective. Also, this method has a high degree of molecular specificity, differentiating between similar molecular structures. That being said, a small change in the material’s structure can be detected, or mixtures of different components can be analyzed. Thus, analytes may be studied in aqueous or other types of solvent solution, with almost no sample preparation needed [
1]. This comes in handy when considering systematic errors. Additionally, a small quantity of samples is needed for a short evaluation period [
2] in a wide range of temperatures and pressures [
3]. Another great advantage is that Raman spectroscopy can be combined with other techniques such as atomic force microscopy (AFM), scanning electron microscopy (SEM), confocal laser scanning microscopy (CLSM), and others [
4].
These advantages made Raman spectroscopy a tool used in numerous fields, both in research and technology [
5]. Speaking of areas such as the pharmaceutical industry [
2], medicine [
6,
7], analytical chemistry [
8,
9,
10,
11], mineralogy [
12,
13], materials science [
14], historical research [
9,
15], and even forensic science [
16], it has revealed many applications. It is easy to see the importance of this technique, but is it suitable for its wide use in highly regulated environments? Even if, at present, it is difficult to imagine such a performance, with small steps and in a short time, the use of Raman spectroscopy for analytical applications will be implemented. However, to succeed, we must consider the disadvantages and limitations that Raman spectroscopy still presents and find ways to overcome them.
An important aspect when using Raman spectroscopy is the fact that although it is a generally non-destructive technique, due to the heating of the sample by laser radiation, it can be destroyed (partially or fully) [
17]. This can be solved using a lower laser power or changing the Raman signal’s acquisition time. Parameters must be suitable according to the sample proposed for analysis. One of the main disadvantages, besides the equipment cost, is that a weak signal is recorded at low analyte concentrations. This, combined with the possibility of fluorescence of the probe, leads to uninterpretable results. Thus, Raman measurements require intense monochromatic sources (lasers) and very sensitive detection systems [
17]. The selection of the optimal laser wavelength depends on the physical and optical properties of the molecule and the particular objects of study. Raman measurements using shorter wavelength incident radiation result in significantly higher Raman intensities and an improved signal-to-noise ratio [
17].
On the other hand, these limitations may be overcome using surface-enhanced Raman spectroscopy (SERS) or tip-enhanced Raman spectroscopy (TERS). SERS is a sensitive and powerful technique that requires the investigated molecule to be adsorbed on a nanostructured metal surface to amplify the molecule’s Raman signal [
17,
18,
19]. In the case of TERS, the interaction between a plasmonically enhanced metallic nano-tip and a sample of interest [
1] leads to the enhancement of the Raman signal of the molecule in the nanometer-sized region directly beneath the tip [
3]. Further details about the theory of Raman spectroscopy, SERS, TERS, their experimental setups, and data analysis can be found here [
1,
17,
20,
21].
It is accepted that there is a need for harmonizing measuring methods. This can be obtained using directives or rules, but this does not completely solve the issues. In fact, studies needed to put these standards and guidelines into practice can occasionally be so challenging that, even when using the same technique, laboratories may still come up with different conclusions. Such disagreements amongst laboratories prevent the standards and instructions from being followed. As a result, policies, procedures, and accreditation systems were formed to assure high analytical quality standards. Their primary objective is to guarantee the correctness of the data generated, resulting in their comparability. The current tendency is to use Raman spectroscopy to obtain the same results regardless of location, equipment, or user. These results could lead to the development of personalized medicine, individualized diagnostics and treatment, the development of work protocols, and obtaining uniform and reproducible results in any field. However, to be implemented in analytical applications, Raman spectroscopy still has some limitations that must be eliminated, and the best method for this to happen, up to this point, is by conducting interlaboratory studies.
4. Interlaboratory Studies Involving Raman Spectroscopy Labs
Only a few interlaboratory studies involving Raman labs have aimed to bring Raman spectroscopy closer to analytical applications. A good and relatively recent example is provided by Guo et al. [
32]. This round-robin study was meant to investigate the dependence of Raman spectra on the setup. They use the term “setup” to describe all measurement-related phenomena, such as temporal drifts, changes in the measurement environment, or instrument setups (such as laser sources and spectral resolution). The study was carried out by 50 European institutions, but in the end, data from 35 setups of 15 institutes were used for unified data processing and evaluation. In a nutshell, aliquots of the same samples were prepared in one partner lab and sent to all other labs, where data were collected using Raman spectrometers from different manufacturers with different laser sources having different spectral resolutions. Assessments and data processing were performed by evaluating the positions, intensities, and widths of the characteristic peaks and considering the noise levels. These four criteria were chosen as a standard for evaluating the peak position reproducibility, analytical sensitivity, reproducibility of measuring the relative intensities, and spectral resolution. Agar, gelatin, paracetamol, polystyrene, and cyclohexane were among the compounds whose Raman spectra were examined together with those of the NeAr glow lamp, with lasers of various wavelengths (514, 532, and 785 nm). The cross-setup comparability was the central focus of this research.
The authors stated [
32] that eliminating the setup-induced spectral changes from the spectral “database” is a practical strategy for correctly predicting the newly measured samples on the other setups. This is the general function of pre-processing. The simplest method to eliminate a setup’s influence is the calibration of the spectrometer, which includes adjusting the intensity and the wavenumber. By obtaining the right values from measurements of well-known reference materials, spectrometer calibration can compensate for the impact of a setup on the Raman signals. Spectrometer calibration does reduce setup reliance but seldom eliminates it; thus, the accuracy of data analysis can still be compromised via the setup-derived spectral variations.
Moreover, the authors discovered that wavenumber calibration was crucial to reducing peak shifts. So that they could develop a calibration function based on the difference between the measured and theoretical positions for well-defined bands, they used paracetamol as the reference substance. For some of the used substances, the wavenumber calibration improved the setup independence; however, it barely decreased the peak shifts (see
Table 1). This may be because the reference material and the rest of the samples were studied under different setups. Additionally, the setup may exhibit short-term instability, which might explain why the spectra of samples and reference materials differ. Also, the intensity calibration had no effect on the peak widths.
In the end, it was shown [
32] that the spectrometer calibration does not completely eliminate setup-related effects on Raman spectra when the same substance is studied on several Raman platforms. Numerous factors can lead to inadequate calibration, including the fact that the exact conditions for measuring the standard material and the actual samples are difficult to reproduce. If the standard is crystalline and the setup (laser/grating) is polarization sensitive, the Raman spectra may be angle and relative orientation dependent. If the reference material is not changed often, contaminations may have an impact. Also, because the complete technical specifics of automatic calibrations are typically unavailable, it is difficult to confirm that the various manufacturers or installations employ exactly the same calibration techniques. Therefore, it is necessary to develop computational methods to eliminate setup-induced spectrum fluctuations.
Guo et al. [
32] also came up with a few suggestions to help the standardization of Raman spectroscopy. First, it was recommended that the manufacturers include spectrometer calibration as a standard feature and make the entire technical specifications for the correction explicit and available to the public. Then, to unravel data closer to the “physical reality”, the equipment producers should grant access to the raw data before any processing is carried out. Also, scientists and researchers should actively participate in creating larger databases and make their data readily accessible.
Following the development of graphene and its related 2D materials and heterostructures, an interlaboratory study was carried out with the aim of comparing Raman measurements achieved from chemical vapor deposition (CVD)-grown graphene transferred onto Si/SiO
2 substrates using the same measurement protocol in different institutes and laboratories [
14]. With its numerous applications, graphene has become a crucial material in various industries. However, variations in material properties due to different production methods highlight the need for standardized measurement protocols for graphene characterization to ensure material quality throughout the supply chain. Thus, participants from academia, industry (including instrument manufacturers), and national metrology institutes focused on investigating the uncertainty contribution of both Raman measurement and data analysis procedures to find solutions to improve accuracy and precision and to develop consistent and standardized procedures for graphene characterization. The Raman spectrum of graphene exhibits a few characteristic bands [
33]. Among these, the most important ones from ∼1350 cm
−1 (D band), ∼1580 cm
−1 (G band), and ∼2700 cm
−1 (2D band, also known as the G’peak) were chosen to be discussed in this interlaboratory study. Thus, the results of the Raman bands intensity ratio (ID/IG and I2D/IG), Raman bands position, and their full width at half maximum (FWHM) were analyzed. The standard operating protocol (SOP) submitted to all participants (17 organizations from 13 countries) included instrumentation requirements, measurement protocols, data analysis procedures, and instructions about data reporting.
Turner et al. [
14] found that the band-fitting methods used to calculate the I
2D/I
G ratio and band positions were similar for all participants, but significant differences were obtained in the absolute values of the I
2D/I
G ratios and the FWHM of the 2D band. The root-mean-square error (RMSE) value of I
2D/I
G was 0.031 for data analysis and 0.69 for measurements, and the RMSE value of the FWHM of the 2D band from all participants was 2.2 cm
−1 for data analysis and 1.2 cm
−1 for measurement. These results showed that the measurement differences and data analysis are important aspects of Raman spectroscopy analysis. The authors [
14] suggested that these error sources, which have negative influences on the development of graphene-based technologies, can be reduced by performing a relative intensity calibration of the Raman spectrometer using a pseudo-Voigt function for the fitting of the 2D band and by employing band-fitting boundary parameters so that negative ratios are not achieved. The study highlighted the need for standardized measurement protocols in graphene characterization to ensure material quality and enable informed decisions in various applications. By understanding the sources of uncertainty and implementing consistent procedures, graphene technologies can be better developed and commercialized.
Some interlaboratory studies were conducted on the use of Raman spectroscopy in the analysis of geological samples. Thus, a round-robin experiment [
13] involving 28 laboratories from 15 countries has outlined the advantages and limitations of using the so-called Raman maturity method (RaMM) to evaluate the thermal maturity of dispersed organic matter (DOM) in complex samples. The RaMM is based on a multi-linear regression analysis of a few parameters taken from the Raman spectra of the DOM and compared to a calibration set of Australian coals. In general, 20 to 30 grains of vitrinite, inertinite, and solid bitumen were used to acquire Raman spectra analyzed throughout this study. It was discovered that RaMM might improve in the discrimination between vitrinite and inertinite as well as the suppression or increase of vitrinite reflectance brought on by variations in the H/C of isometamorphic vitrinites; however, it can alter the precision of the results. Additionally, the authors suggested that since RaMM was created for everyday practical use, the curve-fitting method must be reliable, quick, and universally applicable to various minerals in the vitrinite and inertinite groups. As in the case of other Raman or SERS studies, Wilkins et al. [
13] and Meyers et al. [
34] agreed that there is a disconcerting lack of agreement across various laboratories, both in the stated experimental settings, making it very challenging to compare laboratory data. It is vital that an international working group obtains a consensus on the normative criteria for Raman spectroscopic investigation. Furthermore, of course, they suggested that RaMM take the excitation wavelength under careful consideration.
Another geology-related round-robin experiment was carried out by I. Dunkl et al. [
12] with the aim to provide a heavy mineral analysis and to illustrate the applicability of Raman spectroscopy. Heavy minerals play a crucial role in sedimentary petrography and provide valuable information on source rocks, environmental conditions, and diagenetic processes. Despite their importance, there was no systematic comparison of heavy mineral analysis results obtained via different methods and operators. A total of 67 contributors participated in this study intended to compare results achieved from different methods, including classical microscopic analyses and emerging automated techniques like electron-beam chemical analysis or Raman spectroscopy. The study was performed with samples of synthesized heavy minerals such that the composition of a synthetic target may be adjusted by combining well-characterized mineral samples. The starting materials for the mineral samples were either high-purity monocrystals or polycrystal minerals that ranged in size from a few mm to cm or pure monomineralic heavy mineral fractions. The participant laboratories were asked to analyze the samples using standard procedures typically used in their laboratories. Also, the organizing lab did not distribute templates for submitting the results. Most laboratories decided to use more than one method, some of them choosing Raman spectroscopy or SERS, generally for identifying the grains that could not be identified using optical parameters.
Regarding the criterion for the “best-match average”, which was met by all analyses (12 out of 12), Raman techniques produced extremely good results. Similarly, the results that were quantified with a 95% confidence level for the number of key components gave the best outcomes. However, certain investigations have difficulties identifying some minerals, which implies that relying just on Raman spectroscopy may not be ideal. Overall, Raman spectroscopy yielded the best results from all the methods used in this study.
Other interlaboratory studies have focused on contrasting Raman spectroscopy with other techniques to explore the circumstances in which the anticipated results can be achieved. The study performed by Frank et al. [
6] falls within this category as it focused on determining the total hemoglobin (Hb) concentration in an approved reference material using different methods, including Raman spectroscopy. Hemoglobin concentration in blood is a crucial diagnostic parameter for assessing a person’s health status. The conventional spectrophotometric cyanmethaemoglobin (HiCN) method, although widely used in clinical diagnostics, lacks traceability to the International System of Units (SI) and involves the use of toxic potassium cyanide. This interlaboratory study aimed to develop alternative SI-traceable, non-toxic methods and provide accurate Hb measurements. The authors tried to validate several isotope dilution-based approaches and the spectrophotometric alkaline haematin detergent method against the HiCN method. A disadvantage of this method was that the purity of the analyzed solution influenced the obtained spectra. However, they found a good agreement when using Raman spectroscopy with mass spectrometry, which indicates that using more methods may be useful for analytical studies.
Colombini et al. [
9] came to the same conclusion after conducting a similar experiment. The aim of the study was to evaluate the performance of various analytical methods in identifying the components of a replicated pharmaceutical ointment with the target of improving the strategies for the characterization of complex residues and providing insights into ancient medical practices. As part of this round-robin study, 11 laboratories performed a blind sample analysis. The blind sample was a replica of an XVIIth-century pharmaceutical ointment based on a historically documented recipe. The ointment was composed of both organic and inorganic materials. Depending on their experience, numerous analytical methods were approached. The complicated formulation could not be fully reconstructed by any of the laboratories despite the use of spectroscopic, chromatographic, or mass spectrometric (MS) methods; nonetheless, each of them produced some partially favorable results. It was concluded that Raman spectroscopy had difficulty in detecting some compounds in the sample that had either a small concentration or were not uniformly distributed. Thus, the significance of a homogenous sample was inferred. Because the fluorescence background is reduced when using SERS, such components may be more easily detected using this technique. These methods should be used in more studies since they do not require sample pretreatment or just a minimal amount of it and because they only utilize a very small sample. The study showed the need for a laboratory’s complete reference library for building a database of NMR, FTIR, Raman, and MS spectra of materials used in various investigations (in this case, ancient pharmaceutical formulations) and comparing the results. It also showed that achieving the desired result using Raman spectroscopy alone is not always attainable; other techniques are typically required. In this case, the laboratories that used more analytical techniques were able to identify the most components. An advantage of using Raman spectroscopy was that it was able to identify organic compounds with a fair level of detail. The study highlighted the importance of a multi-analytical approach for reliable characterization of complex residues in archaeometry.
Recently, a Raman round-robin study [
16] was performed to determine the authenticity of a document consisting of a real estate rental contract consisting of three pages prepared under controlled conditions at the Portuguese Police Forensic Laboratory. Seventeen laboratories from 16 countries dealing with investigation methods classified in several categories such as optical spectroscopy, vibrational spectroscopy, including Raman spectroscopy, X-ray spectroscopy, mass spectrometry, electrostatic imaging, and other non-imaging methods were involved and tried to solve some particular issues [
16]. The study assessed several performance indicators, including whether the headings and signatures were written with the same ink and if they were of the same age on all pages. Additionally, the ability of the techniques to detect alterations in the printing process, differences in the paper used, and any staples or staple marks that may indicate tampering was examined. The techniques’ performance was evaluated based on discriminated sample pairs against all possible sample pairs. Raman spectroscopy was involved in the task related to printer discrimination and the one related to the comparison of the inks used, and despite the success reported so far in the literature, in this case, identical Raman spectra were obtained from different writing ink (bright blue, black, and dark blue). The authors concluded [
16] that the increase in the amount of the recorded data will not consequently lead to an increased testimony credibility and that none of the methods employed can separately solve all issues. Thus, they suggested using several methods targeting inorganic analytes and organic analytes and finally obtaining compatibility by employing non-invasive methods first and, if still necessary, more destructive techniques.
An interlaboratory study performed by de Frond et al. [
10] involving 22 laboratories from 6 countries was intended to set out a method to monitor and characterize the microplastics in drinking water. Three simulated clean water samples that had been spiked for this purpose were provided to each laboratory, along with a blank sample and a SOP for particle extraction, measurement, and characterization. The samples contained known amounts of microplastic particles of different sizes, polymer types, and colors, along with false positives that may be mistaken for microplastics. Participating laboratories were unaware of the precise amount of spiked particles present in each sample, and they used stereomicroscopy, Raman spectroscopy, or FTIR spectroscopy as investigation methods. The mean particle recovery using stereomicroscopy and the accuracy of chemical identification using FTIR and Raman spectroscopy were investigated throughout the study. The precision of the methods and time requirements for analysis were also evaluated. All subsampled particles were chemically identified by laboratories using Raman spectroscopy to examine particle composition. Additionally, using spectroscopic data, the effectiveness of employing visual microscopy to distinguish between plastic and non-plastic was evaluated. Even considering particles in the lowest size fraction, Raman analysis was 94% successful in recognizing plastics. However, it struggled with dyed cellulose fibers. However, another advantage was that of all the used methods, Raman spectroscopy was the quickest one. On the other hand, other studies have noted a deficiency in Raman spectroscopy caused by fluorescence interference from dyes and pigments.
This study also showed the importance of a SOP. Other multi-laboratory studies using blind samples reported lower mean recovery among laboratories and attributed underestimation to particle loss during sample extraction, which was reduced by complying with the SOP tested before use to ensure minimal procedural particle loss. The inclusion of a SOP is likely the reason for this decrease in variability across laboratories. Another suggestion was that in this kind of study, blank contamination should be taken into consideration to improve results.
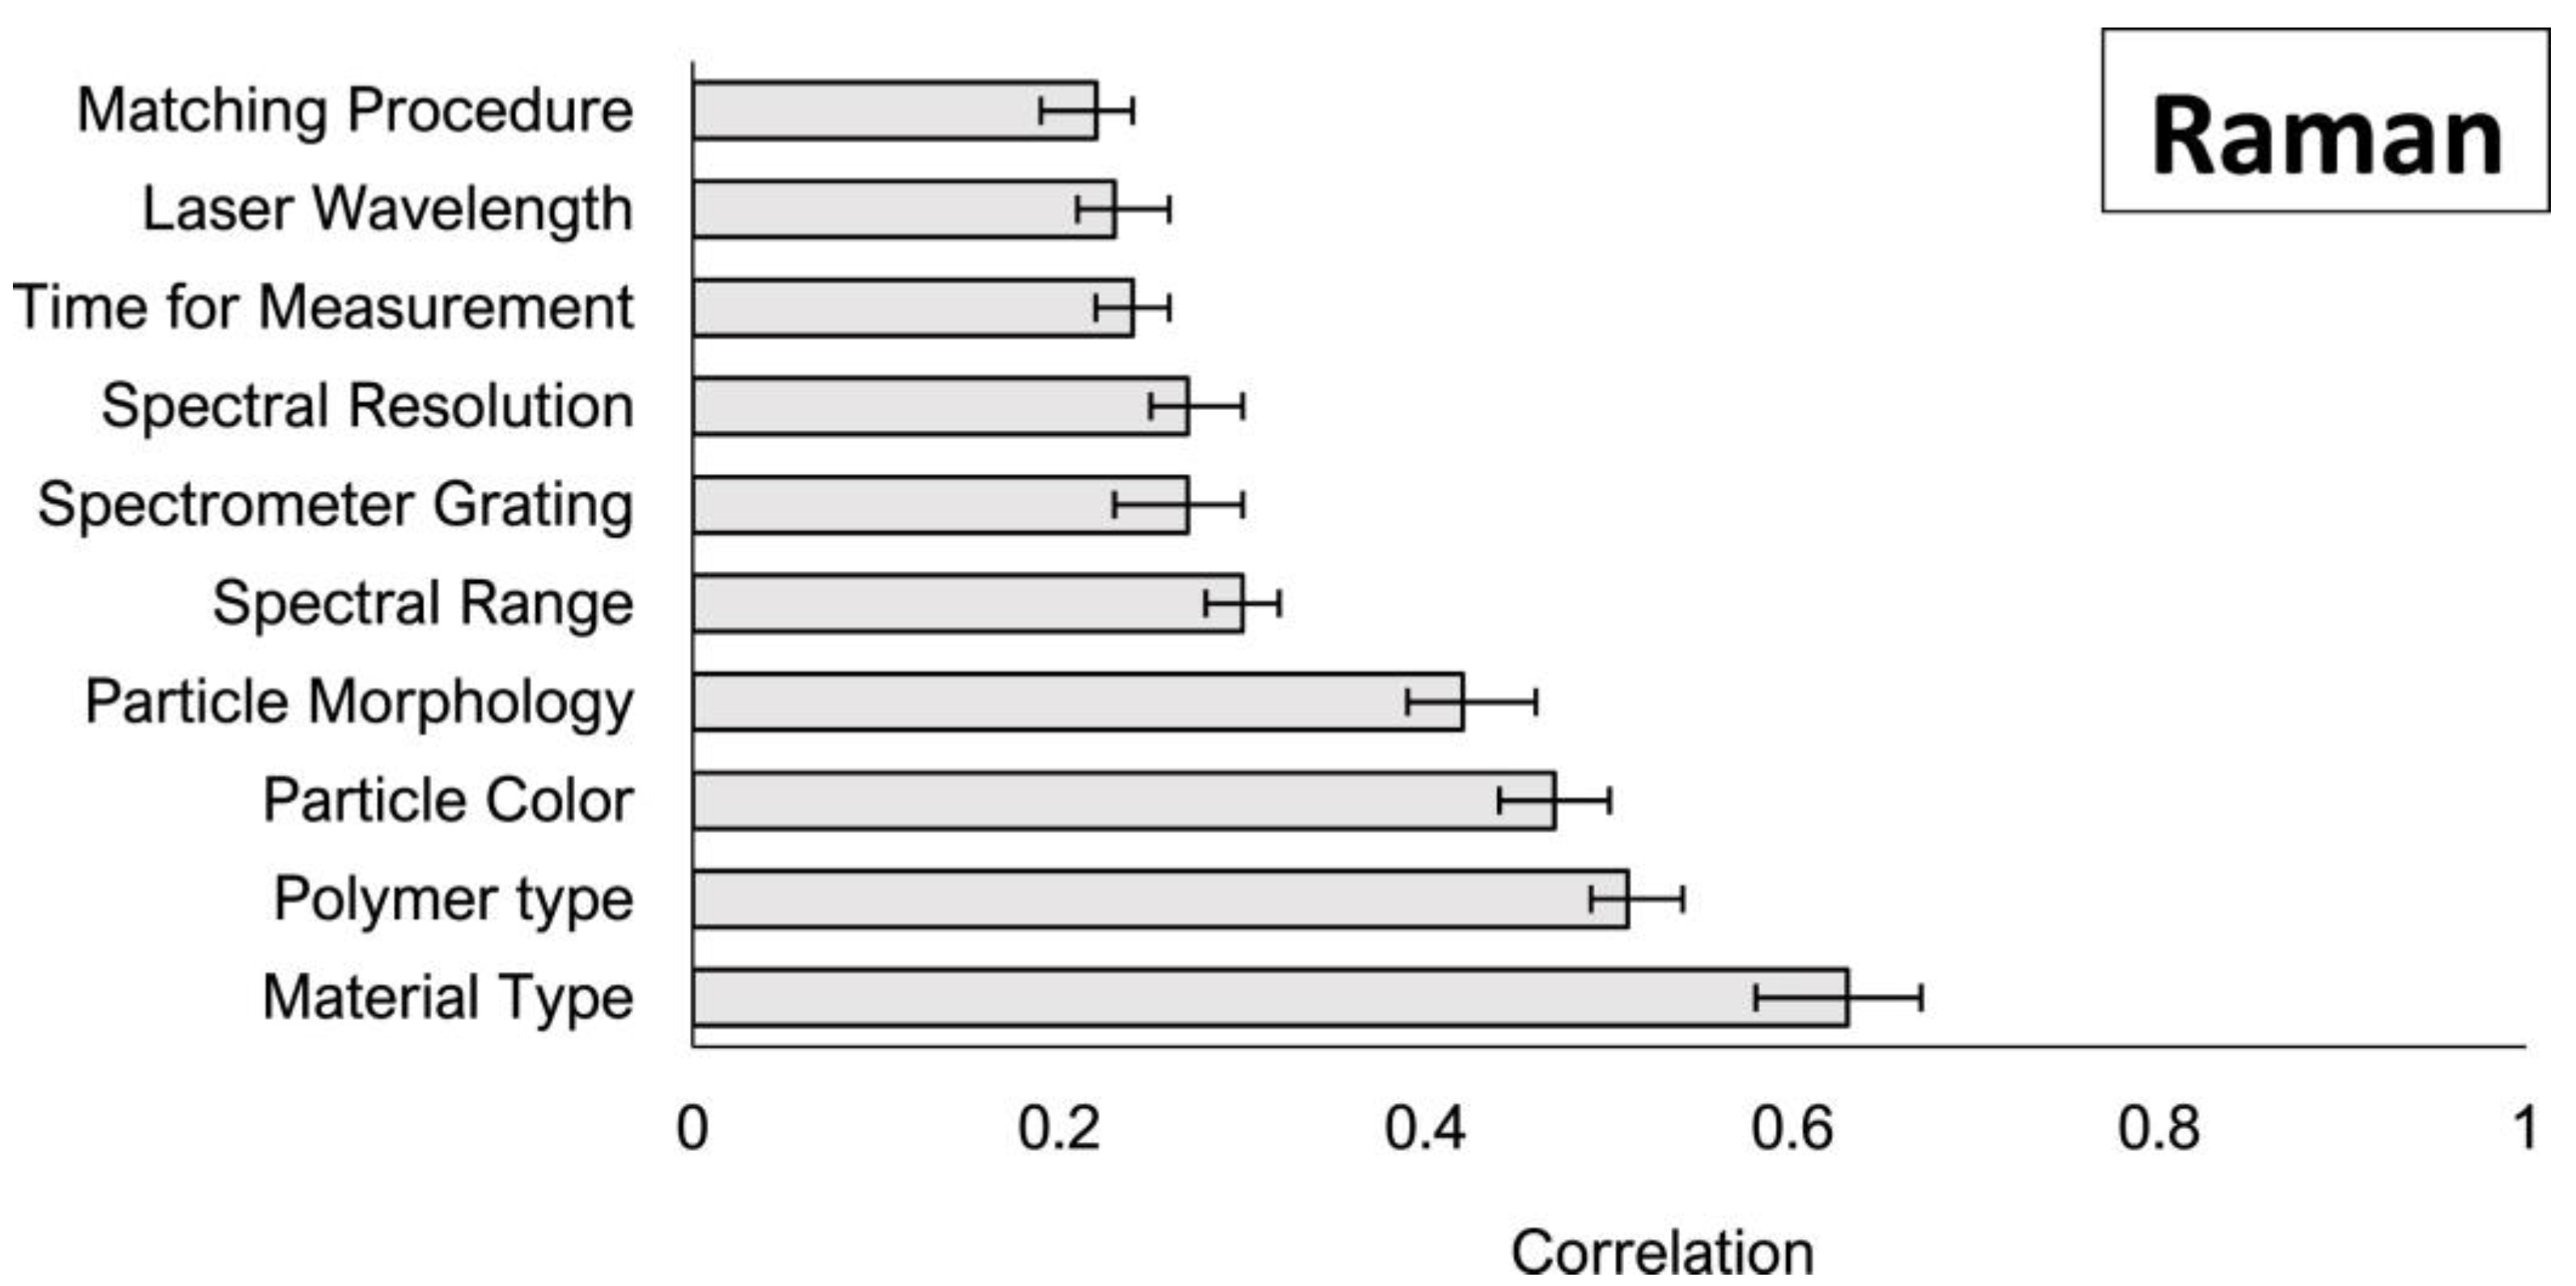
Following this interlaboratory experiment [
10], the collected metadata were further used to correlate the influence of particle and instrument variables with accuracy of chemical identification using microspectroscopy to compile method recommendations and priorities for further research [
11]. A number of parameters were found to act as an influential variable for the chemical identification of plastic nanoparticles using Raman microspectroscopy. The most correlated variables are illustrated in
Figure 1 and relate to physical particle features (color, morphology, size, and polymer type) and instrumental parameters such as spectral collection mode and range. Data analysis demonstrated that Raman spectroscopy is suitable for analyzing many particle types; however, instrument parameters should be adjusted to decrease particle burning and fluorescence occurrence. In addition, spectral processing methods should be used before comparing spectra with reference libraries [
11].
In their small-scale interlaboratory study, Ainsbury et al. [
7] discussed the results of an intercomparison of different biological and physical dosimetry approaches, one of which included Raman spectroscopy on blood cells. The study aimed to compare and validate four new dosimetry methods: dicentric chromosome analysis with telomere and centromere staining, gene expression assay in whole blood, Raman spectroscopy on blood lymphocytes, and detection of radiation-induced thermoluminescent signals in glass screens taken from mobile phones. The homogeneity of scores among laboratories was determined using the chi-square test. The scoring system and dosage were examined using an ANOVA test to determine how they affected the variance between the test dose and the real dose for each measurement. The results evidenced good agreement between laboratories and methods within expected levels of uncertainty, indicating the potential of each candidate technique. This study showed that the majority of Raman spectral characteristics alter with dosage. The higher spectral variation may be caused by the transport of the samples and other experimental conditions since Raman spectroscopy is particularly sensitive to sample preparation. The authors suggested that more research must be performed in order to completely develop and verify the methodologies for the entire range of doses for which biodosimetry is likely to be utilized, even though the results for the lower dosage reflect the success for Raman spectroscopic analysis as a biodosimeter.
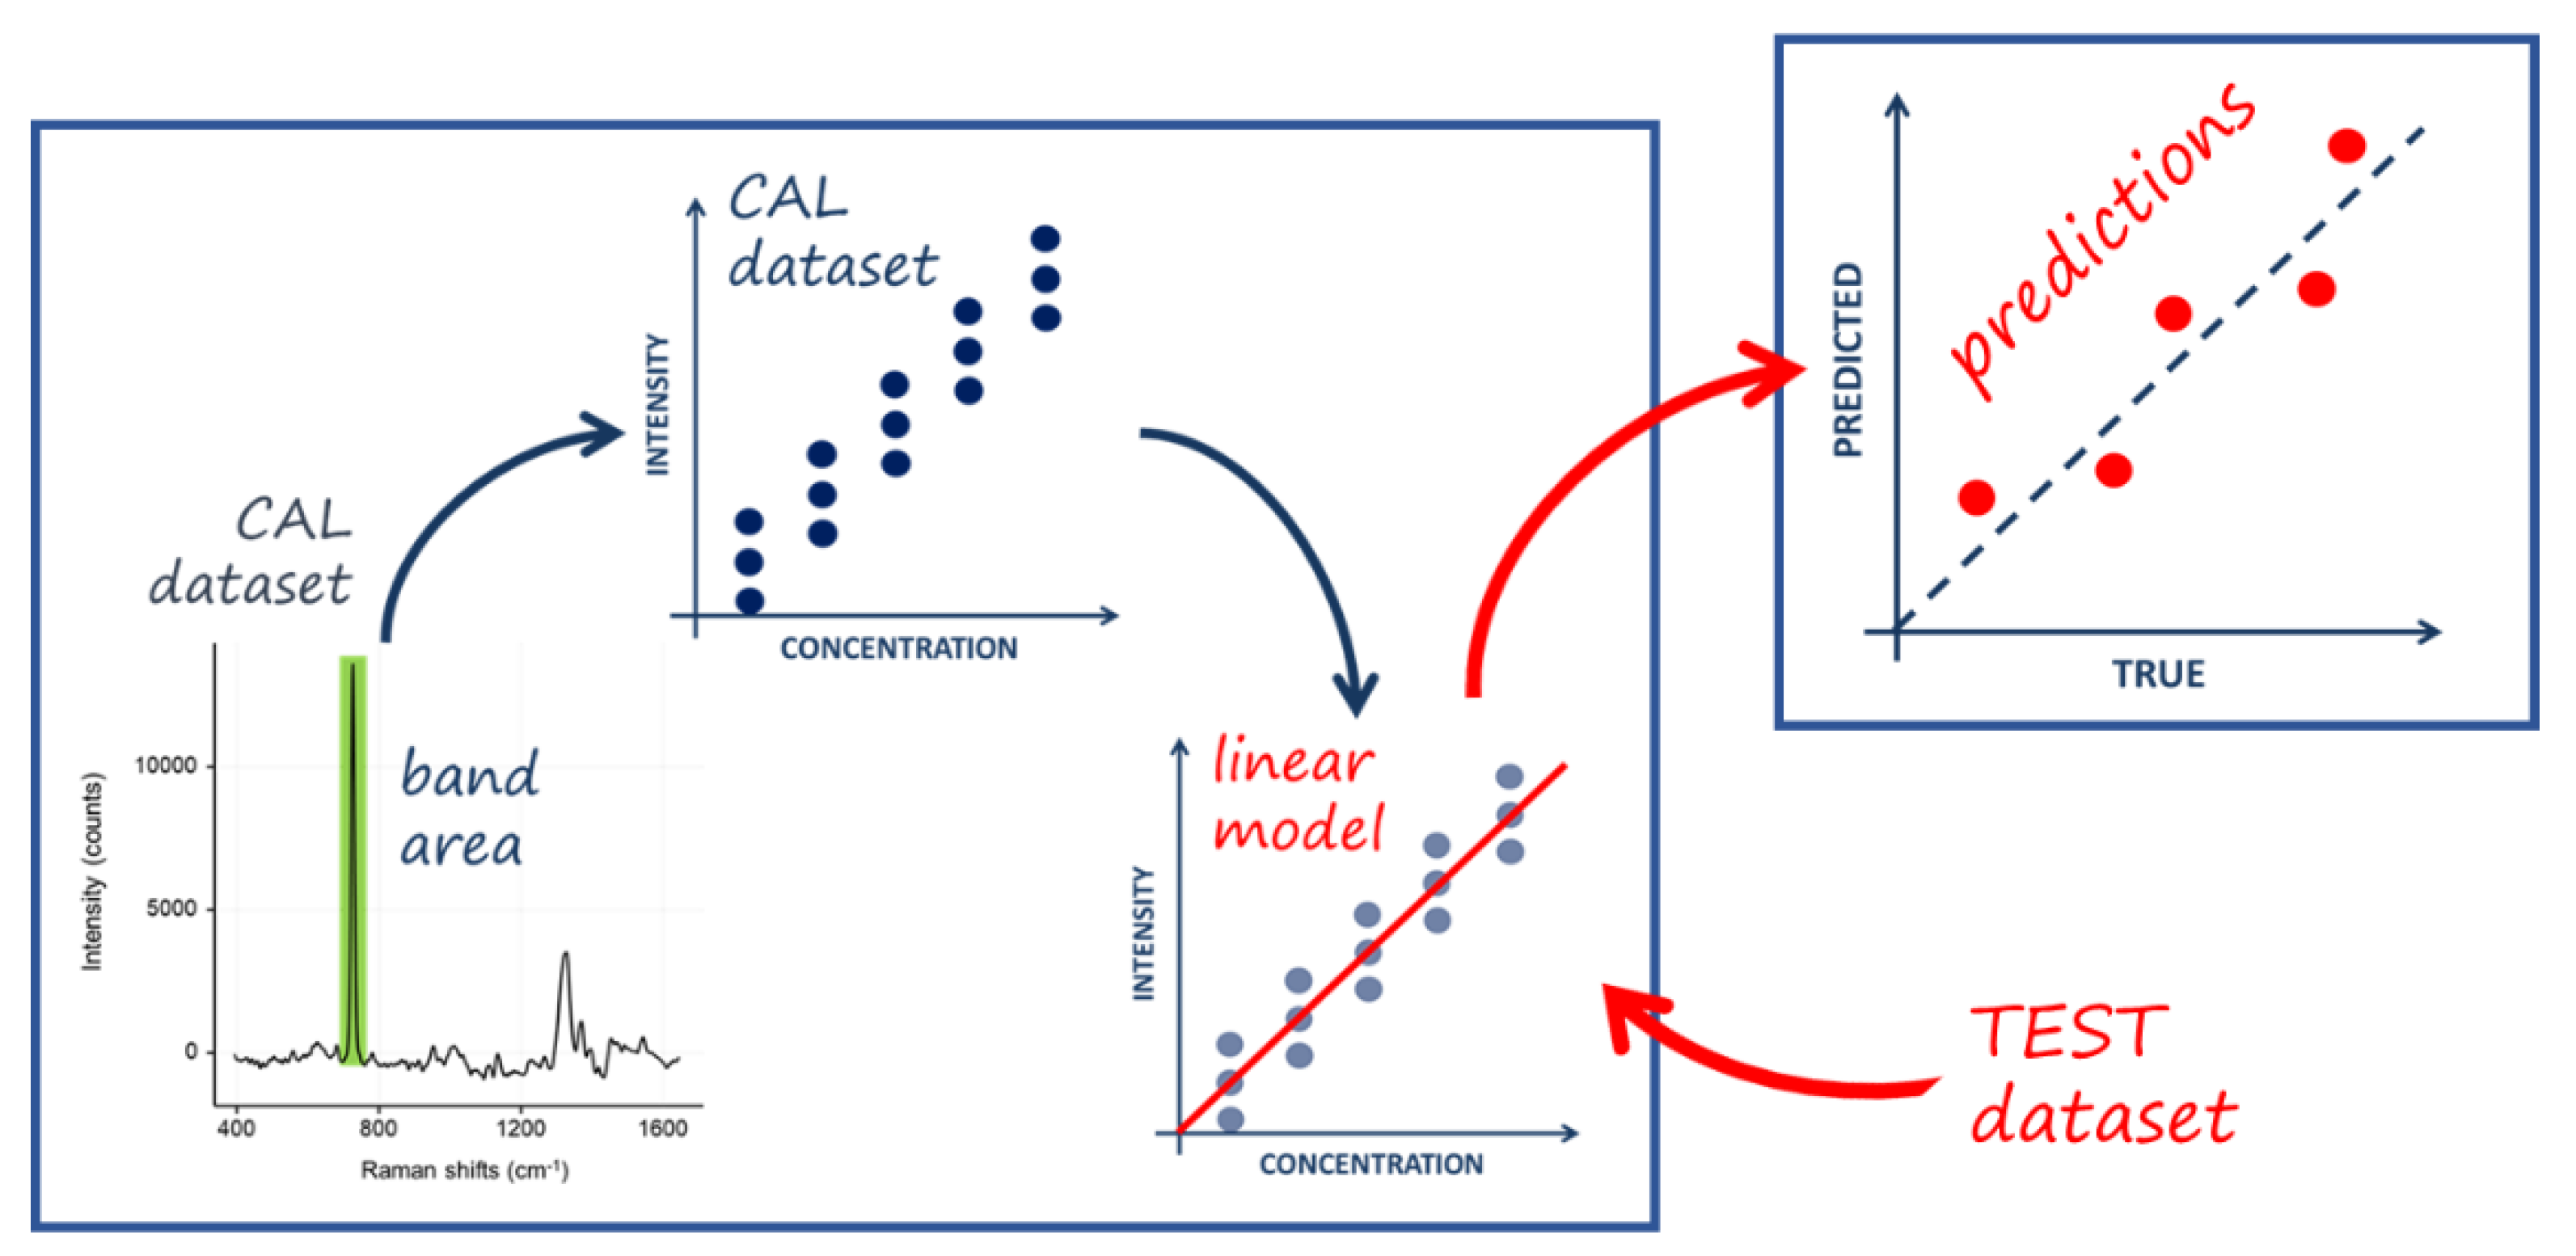
Another round-robin study, which was intended to change the negative view of quantitative SERS approaches, was conducted by S. Fornasaro et al. [
19]. It involved 44 researchers from 15 laboratories that attempted to create a method to evaluate the accuracy and repeatability of a quantitative SERS approach. The two questions that this study wanted an answer to were: “How reproducible are the results when the SERS technique is used in several laboratories with various instrumental configurations?” and “How “true” are the results?” As a result of many trials, adenine in the form of aqueous solutions of various concentrations was chosen as the reference analyte. The samples were studied using both silver and gold colloidal nanoparticles, as well as solid substrates and several laser lines. For this experiment, six different Raman spectrometers were used by the participants.
The protocol suggested (see
Figure 2) that participants should first record the spectra of known concentrations of the adenine solution to obtain the so-called “calibration set”. It was employed to create a linear regression model used to determine the concentration of an adenine solution of unknown concentration. The “test set” consisted of five adenine solutions of concentrations known only by the organizing laboratory. The participant laboratories sent the recorded spectra to the organizing laboratory, which analyzed the results based on the intensity of a characteristic band observed in the adenine spectrum. All the conditions for conducting an interlaboratory test have been met. The authors concluded that multiple laboratories can consistently apply a quantitative SERS approach, provided it is extremely clearly specified (and has a comprehensive standard operating procedure). The tested methods produced a range of reproducibility results, but the best ones were reasonably reproducible, with an average standard error of performance (SEP) as low as 12% and 13% (see
Table 2). This is encouraging given that various instruments were used over a broad period, with different setups and acquisition parameters such as acquisition time and laser power, and that the methods varied in terms of the instruments used and the obtained results. They recommended that future SERS research should focus its efforts on a single approach rather than multiple approaches to more easily convince a larger number of laboratories to become involved.
Usually, in SERS-based analytes quantification, the concentration of an analyte in an unknown sample is predicted using a calibration model based on the dependence between peak intensity and the analyte’s concentration, as described by S. Fornasaro et al. [
19] and S. E. J. Bell et al. [
35]. However, to ensure that SERS detection can produce more than just correct predictions on the set of data it was calibrated with, S. E. J. Bell et al. [
35] recommended a validation phase in addition to the calibration method to be performed. Thus, the use of SERS for an analytical application should be questioned in the absence of a validation step. The authors [
35] also asserted that even though the majority of SERS studies devoted to proving the analyte quantification potential tend to concentrate on the ultra-sensitivity of SERS through the perspective of the limit of detection (LOD) and, occasionally, the limit of quantification, more crucial than the LOD is the capacity to accurately predict concentrations in the range of concentrations relevant to the study. Therefore, they advised sensor development to focus on concentration ranges that correspond to the particular quantification issue faced. Additionally, they suggested that for interlaboratory comparisons, the instrument performance should also be reported, for example, by displaying the typical Raman spectrum of a standard solvent along with clearly stated experimental conditions. This is because high-performance instruments will provide higher signal-to-noise ratios than lower ones with the same sample.
Two more performance indicators that are frequently estimated when evaluating chemical analysis methods should be given in addition to the sensitivity range. In order to determine if the sensor is overestimating or underestimating the real analyte concentration, one must first determine the recovery rate, which is the ratio of the detected concentration to the actual concentration in the sample. Second, it is important to establish the root-mean-square error of prediction, which provides a measure of the accuracy of the SERS sensors readout [
36].
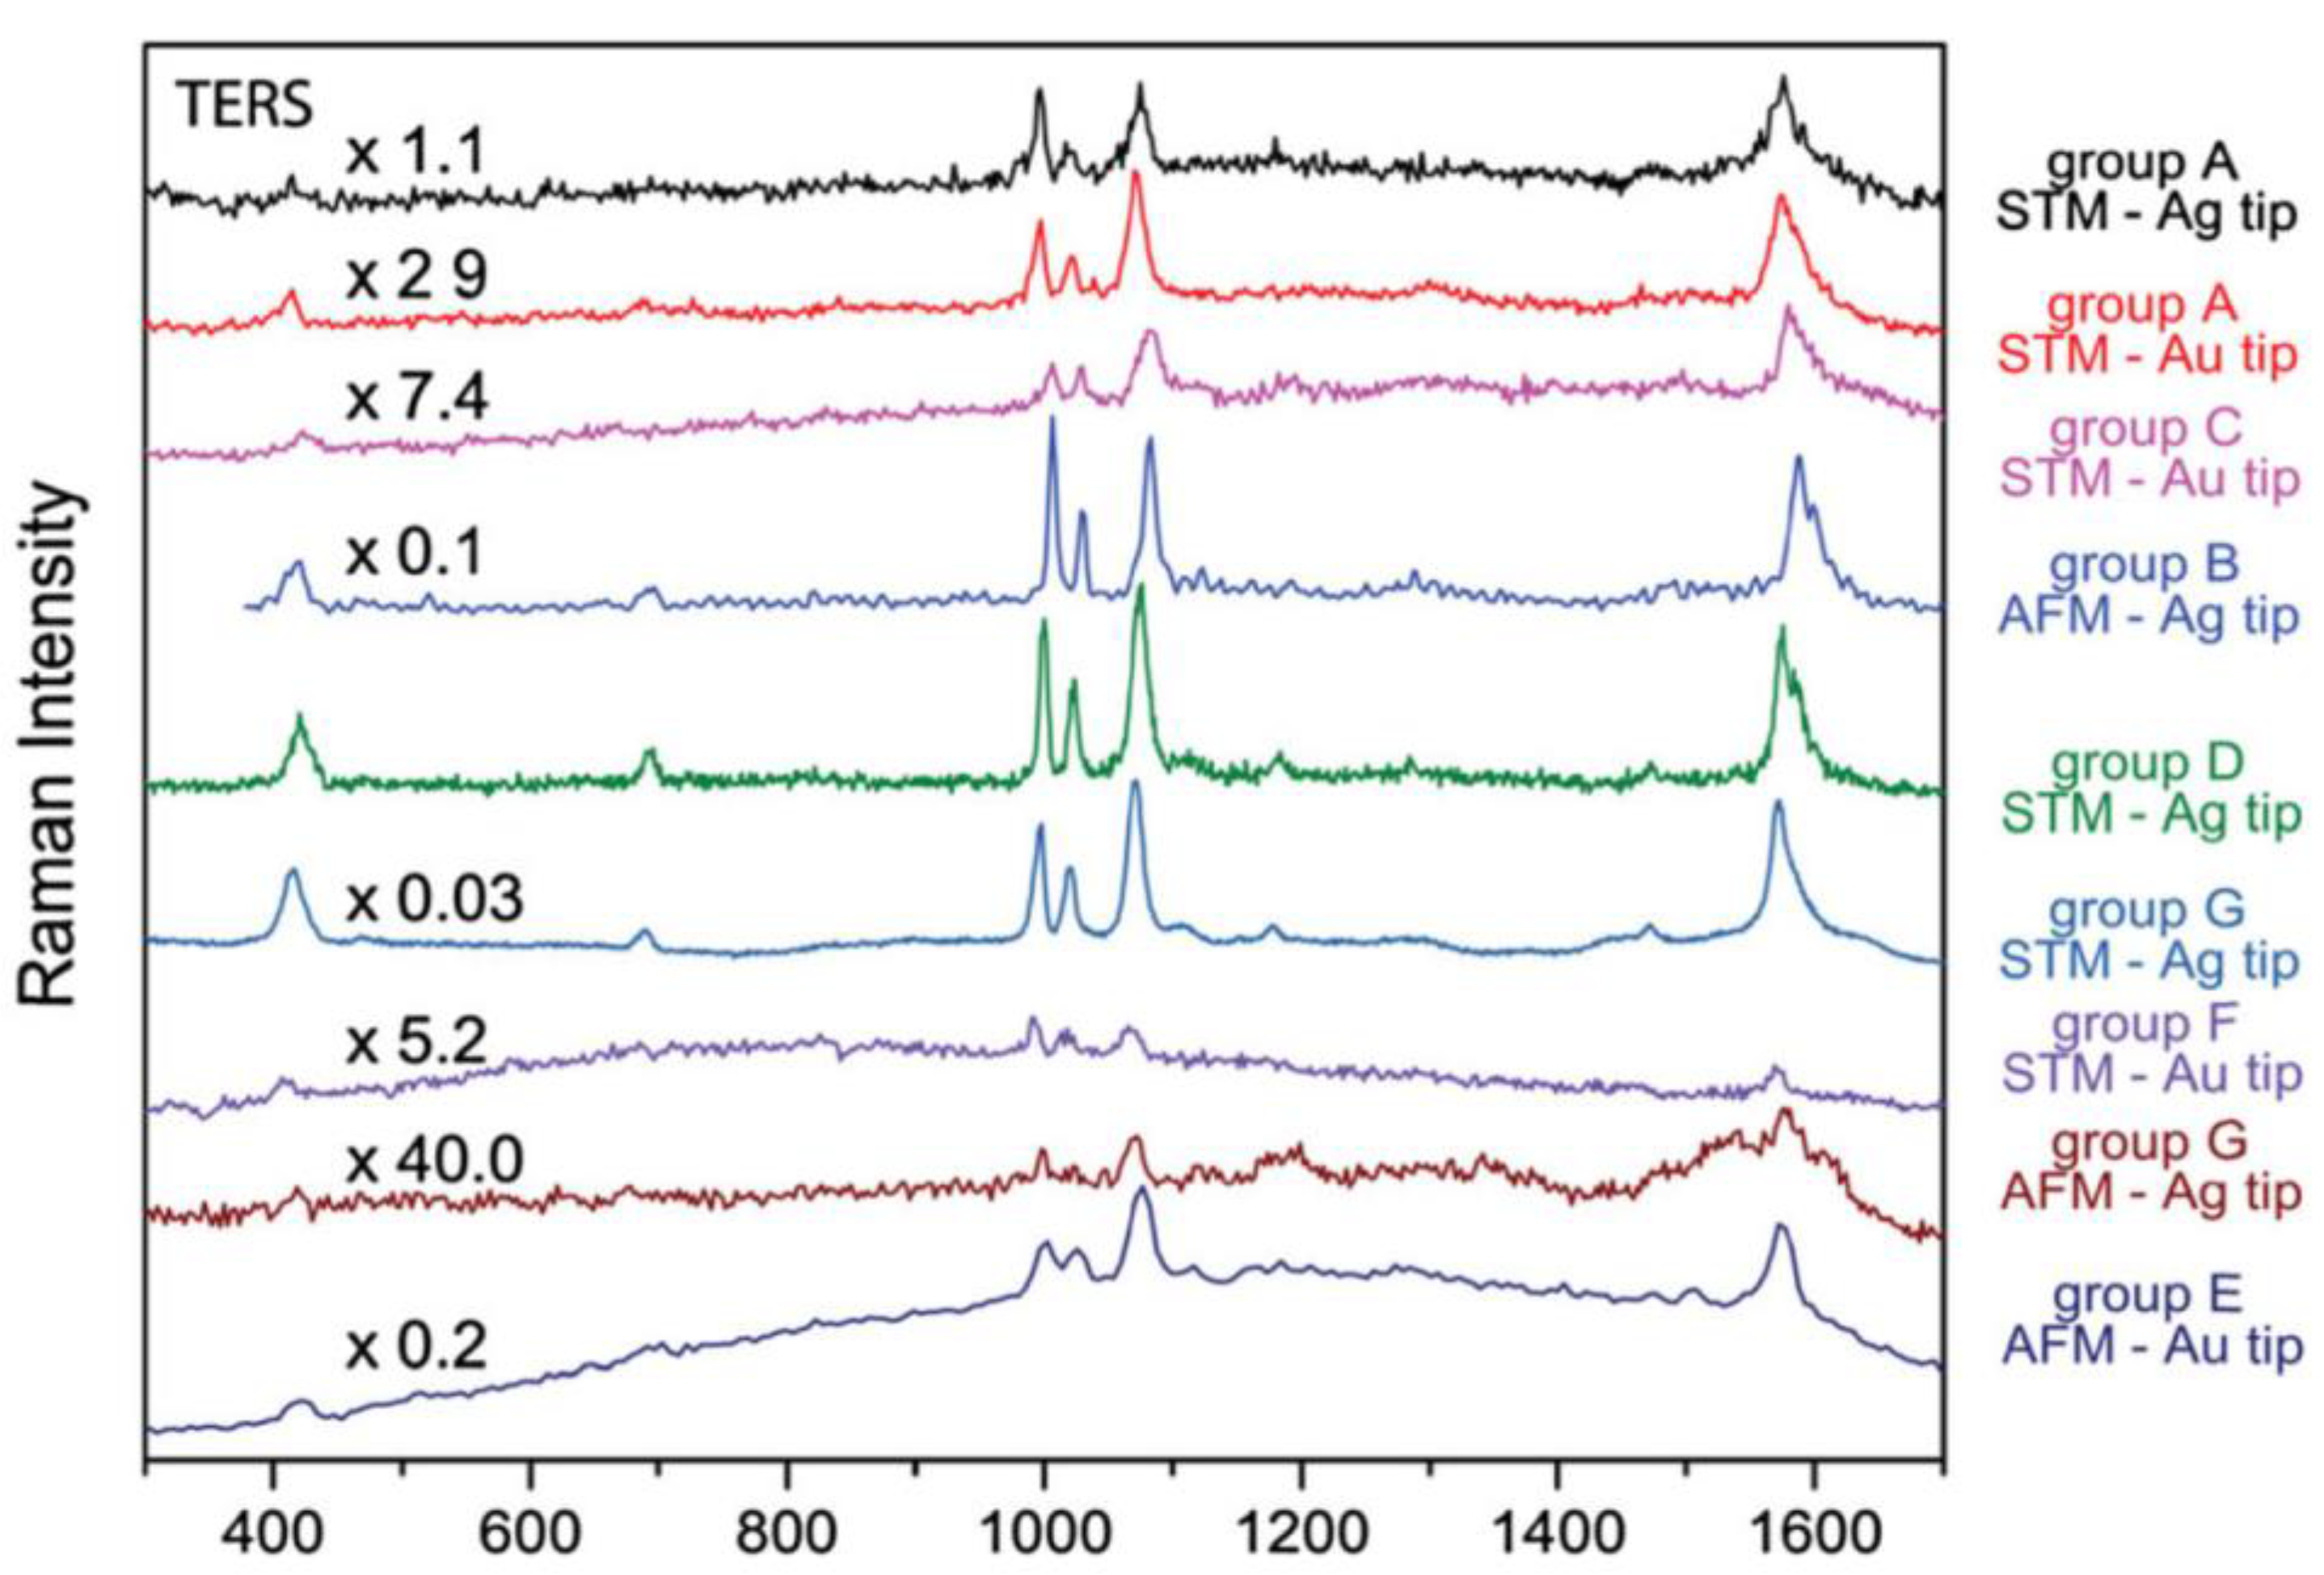
Another interlaboratory study, this time dealing with tip-enhanced Raman spectroscopy (TERS) as the main subject, was carried out by C. Blum et al. [
37]. The authors studied the comparability and repeatability of TERS data. Based on the TERS spectra recorded from self-assembled monolayers of thiophenol on two types of gold substrates, the number of bands, peak positions, and intensity ratios were studied by comparison with the reference Raman and SERS spectra. Among others, the authors sought to determine if TERS might be a trustworthy analytical method for identifying unknown samples (the tripeptide, CysPhePhe). This study demonstrated that despite employing various setups and tips, all groups involved in the interlaboratory study saw a fairly similar spectral pattern (see
Figure 3).
However, different spectrometer calibrations lead, as in the previous studies [
19,
32,
35], to spread peak positions, emphasizing the significance of calibrating lab instruments while performing quantitative analyses. The authors emphasized that in order to distinguish between an induced peak shift and a shifted signal position caused by various instrument calibrations, precise spectrometer calibration is essential. A problem that occurred was that reproducible spectra were produced by certain groups but not by others. A possible explanation for this is that the performance of the instrument cannot be assessed using a conventional methodology. Frequently, as in Raman and SERS experiments, a TERS experiment’s success or failure may be linked to the user’s experience. Standardization of samples, measurement procedures, and calibration methods were recommended to improve comparability and reproducibility in TERS experiments [
37]. However, the research showed that TERS is a useful analytical tool. This interlaboratory study was nevertheless a significant step towards making TERS a standard procedure.
5. Summary and Perspectives
In this review, we described the conducted interlaboratory studies dealing with Raman spectroscopy that can be regarded as a required step when passing from lab investigations towards analytical applications. We intended to emphasize the value of Raman spectroscopy and the necessity of transitioning to quantitative analysis in regulated environments. It was shown that its characteristics led to the widespread usage of Raman spectroscopy as a tool in research technology, clinical studies, etc.
Throughout the review, two types of interlaboratory studies were presented, some that compared the results obtained by different laboratories using different techniques, including Raman spectroscopy, in order to establish the composition and/or concentration of a complex sample and other studies that, based on a SOP, explored various approaches to enhance and standardize the results obtained via Raman spectroscopy.
The research from the first category of experiments demonstrated the value of Raman spectroscopy and showed that, among all the tests, Raman spectroscopy performed the best. All the research data from the second category of studies that were evaluated share the view that a number of improvements are needed to push Raman spectroscopy toward analytical applications. Precise procedures must be performed, starting with equipment operation and continuing by creating a strict SOP. According to de Frond et al. [
10], the decrease in variability among laboratories is most likely due to the implementation of a SOP. It is necessary to do more research for the equipment’s development, keeping in mind an improvement in the sensitivity, precision, and accuracy of the detecting devices. It was also suggested [
35] that sensor development should focus on concentration ranges that fit the specific quantification issue in question. One must first assess the recovery rate and the root-mean-square error of prediction in order to ascertain if the sensor is accurately predicting the true analyte concentration [
36].
The Raman spectrum’s dependency on the experimental setting requires special consideration. The calibration of the spectrometer, which involves altering the intensity and wavenumber, is the easiest way to get rid of the setup influence. The effect of a setup on the Raman signals can be offset via spectrometer calibration by collecting the appropriate values from measurements of well-known reference materials. It is also essential to calibrate the wavenumber to shrink peak shifts. Unfortunately, it is challenging to verify that different manufacturers or systems apply exactly the same calibration methodologies since the full technical details of automatic calibrations are sometimes inaccessible. Therefore, to get rid of setup-induced spectrum fluctuations, computational techniques must be developed. As a result, manufacturers should make spectrometer calibration a standard feature in the future and make the full technical characteristics of the correction clear and accessible to the general public [
32,
37]. In their study, Bell et al. [
35] recommended performing a validation step in addition to using the calibration procedure. Additionally, they advised that instrument performance be documented for inter-laboratory comparisons. Additionally, researchers and scientists ought to contribute to developing larger databases and making their data easily available [
32]. Working toward a common objective is also the recommendation made by the authors involved in several studies [
13,
14,
19,
34], as it is now difficult to compare laboratory results due to a worrying lack of consistency among various laboratories.
Interlaboratory investigations are an effective way to remove the limitations that Raman spectroscopy still has before it can be used in analytical applications. All round-robin studies demonstrated the benefits of using Raman spectroscopy, including its high molecular specificity, quick spectrum acquisition time, and excellent component identification capabilities. Many of them recommended using additional techniques in parallel to Raman spectroscopy to get more accurate results. According to several studies, SERS should be used whenever possible to obtain stronger signals from the samples. However, many studies highlighted how necessary it is to calibrate the equipment employed when doing quantitative analyses, developing sensors, and building a user-accessible database. Additionally, it was recommended that computational methods be created to get rid of setup-induced spectrum variations.
All conducted experiments have concluded that further interlaboratory investigations are needed. They have experienced the significant benefits that may be reached when a rigorous SOP is followed and instrument performance is recorded. Finding a way to precisely anticipate concentrations in the relevant range of concentrations, establishing and validating the methodology, and creating homogeneous samples for those studies, the Raman spectroscopy lab is approaching with small but decisive steps toward analytical applications.


