Abstract
Radio Frequency (RF) power sensor calibration is one of the essential measurements in RF and microwave metrology. For a reliable and accurate power sensor calibration, there are various methods, such as the substitution method, the direct comparison transfer method (DCTM), and the vector network analyzer (VNA)-based calibration method (VBCM). The VBCM is a method that is derived from the DCTM. It is a preferred method since the VNA has a better measurement capability and has fewer connection requirements for measurement devices. In this study, the milestones and potential application errors of the VBCM are given by considering the connection mistakes, measurement faults, calculation errors, and control software coding problems. At the end of the power sensor calibration measurements with the VBCM, the model function components and the uncertainty calculation examples according to the GUM Bayesian method are also presented in this study. In addition, the advantages and disadvantages of the VBCM compared to the former methods are discussed in this study.
1. Introduction
RF power sensor calibration is one of the essential measurements in RF and microwave metrology [1]. There are many methods, such as the substitution method (SM), the direct comparison transfer method (DCTM), and the VNA-based calibration method (VBCM), that can be used for reliable and accurate power sensor calibration.
According to the SM, measurements are performed by connecting a power sensor with a known calibration factor (CF) (standard power sensor—SPS) value and a power sensor with an unknown CF (device under test power sensor—DPS) value to the RF signal source. This method assumes that the RF signal source output has the same power level when the SPS and DPS are connected to the RF signal source. The DPS and SPS are connected directly to the RF signal source for the measurements, unless a characterized adapter or an attenuator is used at the output of the RF signal source. Suppose the reflection coefficient values of the RF signal sources are not measured vectorially. In that case, an impedance mismatch cannot be fully taken into account in the DPS’s CF calculation in this method [2,3].
The SM assumes that the RF signal source output has almost the same value when measuring the DPS and the SPS. This situation is impossible because the RF signal source output can change over time. The DCTM was developed to eliminate the error due to this assumption. In this method, a new different power sensor called a monitor power sensor (MPS) monitors the output of the RF signal source while measuring both the SPS and DPS power. When the operator connects the SPS to the measurement system, the monitor power measurement (PmS) is performed together with the measured SPS power (PSTD). When the operator connects the DPS to the measurement system, the DPS power (PDUT) is measured simultaneously with the monitor power (PmD) measurement. A well-characterized power splitter is used at the output of the RF signal source. The DPS’s CF value is calculated by using the reflection coefficient of the DPS, the reflection coefficient of the SPS, the reflection coefficient of the power splitter, the four measured power values (PDUT, PSTD, PmS, PmD), and the CF value of the SPS. Thus, it is possible to take into account the impedance mismatches in the DCTM, which cannot be fully calculated in the SM [4,5,6,7].
To calculate the DPS’s CF value in the SM, the operator should measure the reflection coefficient of the output port of the RF signal source and the reflection coefficient of the DPS. To calculate the DPS’s CF value in the DCTM, the operator should measure the DPS’s reflection coefficient and power splitter’s reflection coefficient. The reflection coefficient of the SPS is taken from the certificate of the SPS in both methods. The operator should use the VNA for reflection coefficient measurements of the DPS in both methods.
The VNA includes an RF signal source, a power splitter or directional coupler, and at least two power sensors used for the reflected and transmitted power measurements. These devices in the VNA show that the VNA contains most of the devices needed by the DCTM, which is the method used to determine the CF value of the DPS. The VNA-based CF determination method (VBCM) was developed based on the idea of simultaneously measuring the reflection coefficients and performing the necessary measurements for the DCTM, which is necessary to calculate the DPS’s CF using the VNA [8,9,10].
The SM and DCTM are both well-known power sensor calibration methods used in the metrological domain. On the other hand, the VBCM is a newer method and has recently been utilized in some new R&D projects (EMPIR 20IND03 Futurecom) [11], as well as in some national metrology institutes, such as KRISS, South Korea, and TUBITAK UME, Türkiye [8,9]. The VBCM is a preferred method since the VNA has a better measurement capability and has fewer connection requirements for measurement devices [9].
All of these methods need an SPS and a DPS to be calibrated. These power sensors are compared during the calibration processes. At the end of the power sensor calibration process for each calibration method, the operator should carry out a parameter known as the calibration factor (CF). The CF is the ratio of the output DC power of the power sensor (Pind) over the incident RF power of the sensor (Pin). This ratio is given in Equation (1):
where M is the impedance mismatch of the RF connectors.
In this study, the milestones of the VBCM, the potential application errors of the VBCM, the rules that should be considered while connecting to the device while measuring with the VNA, the factors to consider while developing the control software for the VNA, and the power meter control are explained. After the power sensor calibration measurements using the VBCM are shown, the model function components to be used in the uncertainty calculations and the uncertainty calculation examples according to the GUM Bayesian method are also shared in this study. Finally, the pros and cons of the VBCM compared to the former methods are discussed.
2. Requirements of VNA-Based Power Sensor Calibration Method (VBCM)
The use of the VNA provides convenience in implementing the VBCM, but it needs more attention since the VNA is such a complicated device. The requirements of the VBCM can be given in three subsections, such as the measurement setup, the software, and the measurement process.
2.1. Requirements of Measurement Setup
Basic power sensor calibration setups of DCTM and VBCM are given in Figure 1 and Figure 2, respectively [4,5,6,7]. In Figure 1, there are three power sensors and proper power meters. The STD power sensor is reference, the DUT power sensor is the sensor to be calibrated, and the MON power sensor is the monitoring sensor in the setup. A power splitter separates the output of the RF signal source power into two lines. In Figure 2, the A1 power sensor monitors the transmitted power according to the DCTM. When measuring with the DPS, the A1 and R1 power sensors are used to calculate the reflection coefficient when measuring with the DPS.
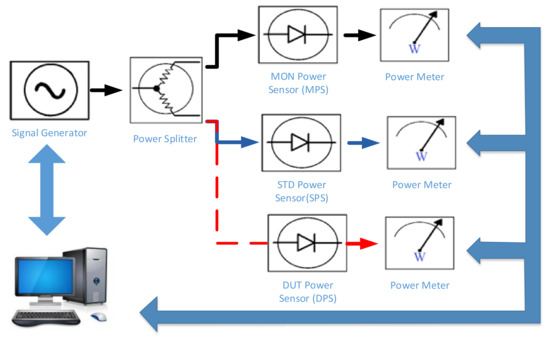
Figure 1.
Power sensor calibration setup with DCTM.
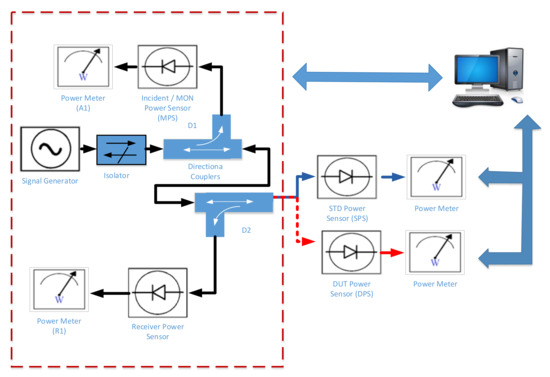
Figure 2.
Power sensor calibration setup with VBCM.
In the VBCM, there is no need for the external MPS for monitoring the signal generator’s output. There is an internal power sensor (A1 in Figure 2) in the superheterodyne receiver system of the VNA, which is used as the MPS in the VBCM. The D1 directional coupler in Figure 2 is used in the VBCM instead of the power splitter in the DCTM. So, there are fewer RF connection requirements in the VBCM when compared with the DCTM. The SPS and DPS are connected to the VNA port in the VBCM while also connected to the power splitter in the DCTM. The CF of the DPS (CFDUT) is calculated in the VBCM using Equation (2) [5,8]:
where CFSTD is the CF of SPS; PDUT and PSTD are the power measured with the DPS and the SPS, respectively; PmS is the power measured by A1 in Figure 2 when the SPS is connected; PmD is the power measured by A1 in Figure 2 when the DPS is connected; ΓDUT is the reflection coefficient of the DPS; ΓSTD is the reflection coefficient of the SPS; and ΓPV is the reflection coefficient of the VNA port, which is used to connect the SPS and DPS.
2.2. Requirements of Software
The CF value of the power sensor is dependent on the frequency (). To obtain the CF values, the operator should perform the measurements at all frequency ranges. And to obtain the proper DPS CF values, power measurements should be repeated at least ten times at each frequency. A software is required for these multi-measurements. Software can perform repeated measurements to reduce operator error and measurement time. Software controls the RF signal generator and power meters in the DCTM and the SM while performing the measurements at the same time. The software controls the VNA and the power meters in the VBCM as well. Also, the algorithm given in the Equation (2) has been utilized in the software to determine the CF of the DPS.
In this study, the software that controls the VNA and the power meters was developed using the C# programming language with the collaboration of TUBITAK, SPARK, and METU [8]. A GPIB/USB adapter was used to communicate between the PC and the measurement devices. The VNA and power meter were controlled using the SCPI codes in the software.
2.3. Requirements of Measurement Process
The following procedures should be applied while applying the VBCM:
- The operator should set the frequency and power levels for the ranges that the VNA would measure. The operator should select the calibration kit to determine the error terms according to the frequency range and connector type to be used.
- The VNA must be learn the error terms at the correct frequencies and at the correct power level by using the calibration kit.
- The power meters to which the SPS and DPS will be connected must be reset and pre-calibrated (zeroing and calibrating at 1 mW) before the measurement.
- A suitable physical interface connection, such as GPIB, that can control all devices is selected between the VNA, the power meter, and the PC. The operator should check the communication between the PC and measurement devices using the physical interface and the interface’s software.
- A VBCM software that can control the VNA and the power meter should be used to perform measurements. The operator should enter the frequencies selected in the step of learning the error terms of the VNA into the VBCM software. The operator should ensure that the frequency steps in the VNA and VBCM software are the same.
- The VBCM software should have a user interface that can enter the waiting time intervals between frequencies, the repetition number for power readings at each selected frequency, and the time after the turning on of the RF signal source power.
- It is necessary to note that the applied power from the VNA’s port should be within the DPS’s and SPS’s measurement limits.
- The SPS should be connected to the VNA’s port, and the VBCM software should measure the SPS’s power. At the same time, the software should measure the MPS’s power too.
- The SPS should be removed from the VNA’s port, and then the DPS should be reconnected to the VNA’s port. The VBCM software should measure the DPS’s power and the MPS’s power. The software should simultaneously measure the DPS’s reflection coefficient with the DPS’s power measurement.
- The CF of the DPS can be calculated using some parameters. In order to calculate the DPS’s CF value, the following parameters should be used, except for the reflection coefficient and power values measured in the previous steps:
- ◦
- The calibration factor of the SPS from the SPS certificate;
- ◦
- The reflection coefficients of the SPS taken from the SPS certificate;
- ◦
- The source mismatch error parameter of the connected port of the VNA. This value should be taken from the saved calibration of the VNA (from error terms as source mismatch error).
3. Potential Errors of VBCM and Suggested Solutions
Regarding their frequencies and dynamic measuring range, VNAs are the most complex and expensive instruments used in microwave measurements. A VNA contains two RF signal sources and at least two or four RF power sensors according to the number of ports, directional couplers, and RF switches internally. Since a PC mainly controls the VNA, a PC has been added inside the new-generation VNA instead of the computing unit included by the manufacturers. If an external computer controls the VNA, the external computers should communicate with the VNA’s computer and the VNA’s sub-devices inside, such as signal generators and power sensors [12,13].
RF power sensors are essential devices used in basic power measurement. RF power sensors should be used according to the operating frequency and power range [14,15]. RF power meters are indicators that show the value measured by the RF power sensor. RF power meters can show incorrect values when controlled by the wrong coding software or timing [14,15].
It is possible to have many errors if the software is not well-configured in the VBCM. The VBCM software controls the VNA and the two power meters by the PC. In addition, avoiding mistakes when working with such sensitive measuring devices (VNA) is impossible.
Errors may occur if the abovementioned requirements are not covered in the VBCM process. Errors were categorized into two categories, such as “Measurement Errors” and “Calculation Errors”, in this study.
3.1. The Measurement Errors
Due to the incorrect reflection coefficient reading of DPS: The VNA frequency steps and the frequency steps given in the PC software must be the same. If the frequencies are out of sync, false reflection coefficients will be read at the wrong frequencies using the error terms determined by the VNA calibration. When calibrating the VNA, if the operator enters only the frequency number for the start–end frequencies and the frequencies between, the same steps must be defined in the PC control software. Or, if the operator determines the frequency segment sweep during VNA calibration, the operator should select the same frequency steps in the PC software. The problem of reading the wrong reflection coefficient caused by this situation can be solved by reading the frequency steps of the VNA by software.
Due to the incorrect power reading by SPS or DPS: In case the frequencies need to be in sync between the PC software and the VNA, the PC software reads the power at the wrong power meter frequencies. The PC software sends the wrong frequency to the VNA, and the software sets the VNA’s RF source to the wrong frequency. For this reason, the power value readings will be wrong. The software can solve this problem by reading the frequency steps from the VNA and sending the correct frequency command to the VNA before power reading.
Due to the incorrect power reading by the SPS power meter or DPS power meter: When the power meters are not set to the 100% CF values at the beginning of the measurement, the DPS and SPS will read incorrect values. In the VBCM, the software calculates the CF of the DPS by using the CF of the STD power sensor. In order to correct the CF of the DPS calculation, the power meter correction factor should be 100%. Such issues can be identified and resolved by the experience and qualification of the operators.
Due to the incorrect power read timing (1): After the software sets the RF signal source of the VNA to the desired power, it can give the desired power for a particular time. When reading from the power meter connected to the DPS or SPS is performed after the power-on period of the VNA RF signal has elapsed, the software will read the incorrect power values. In order to eliminate this problem, the operator should know the VNA operation as well, and the developer should develop the PC control software according to the VNA’s operation specs.
Due to the incorrect power read timing (2): After the software turns on the power at the VNA signal source, it is necessary to take a measurement with the power meter after the power level has stabilized. The operator should determine the VNA’s signal source stabilization time before the measurement and enter it into the developed software. The operator can also solve this problem by knowing the VNA’s specs.
Due to the incorrect reflection coefficient reading of the SPS: Although it is possible to measure the reflection coefficient of the SPS with the VNA during the SPS power measurement, it is not necessary. Software developers can add the reflection coefficient of the SPS reading into the software. The operator can use only this to check the connector of the SPS. If the software uses the new reading reflection coefficient of the SPS to calculate the CF of the DPS, incorrect metrological traceability transfer will occur. In order to correct the transfer to traceability, the software uses the reflection coefficients from the last certificate of the SPS.
3.2. The Calculation Errors
Using the wrong reflection coefficient of the SPS: The reflection coefficient is not constant and changes because of the wear out of the connectors over time. When the software uses the wrong reflection coefficient of the SPS, the software calculates incorrect CF values of the DPS. The software developer should be careful to enter the right reflection coefficient using the CF of the DPS.
Using the wrong uncertainty of the reflection coefficient of the DPS: when calculating the CF uncertainty of the DPS, the operator or the software should use the correct uncertainty of the reflection coefficients of the DPS and SPS. Otherwise, the operator or the software will miscalculate the CF uncertainty of the DPS. When the operator or the software perform the reflection coefficient measurement and the power reading of the DPS separately, the uncertainty calculation problem will not happen. If the developed software calculates the uncertainty of the reflection coefficient at the same time as the measurement, there will be no problem.
Unknown uncertainty of VNA’s source mismatch error: while it is sufficient to know the source mismatch error parameter of the connected port of the VNA to calculate the impedance mismatch, the operator cannot calculate the uncertainty value of the source mismatch error. It is suggested that the operator can use the generic uncertainty values of the reflection coefficient of the VNA and the calibration kit pairs as assumptions.
4. Experimental Results and Analysis of VBCM
Two experimental measurements in which possible errors are detected and solution proposals are determined are presented as examples in this study.
Measurements were performed by the two different measurement setups given in Figure 2. The technical specifications of the VNA, power meter, power sensors, and mechanical calibration kits for the measurement setups are given in Table 1.

Table 1.
The equipment used in the measurement setups.
In the first measurement setup, the operator selected the frequencies according to the DPS specs, which were between 10 MHz and 26.5 GHz and a 0 dBm power level. The selected frequencies were 10, 50, 100, 500, 1000, 3000, 5000, 7000, 9000, 10,000, 12,000, 14,000, 15,000, 16,000, 18,000, 20,000, 22,000, 24,000, and 26,500 in MHz. The operator selected an SPS similar to the DPS, and it has a metrological traceability chain. The software performed each power measurement in one second at each frequency step. Before starting the measurements, the operator kept the power sensors in ambient conditions of 23 ± 3 °C and 45 ± 15 %rh (relative humidity). These conditions make the power sensors reach thermal equilibrium. The operator used an 8 lb.-in torque for the tightening of the RF connectors. The timing parameters of the measurements were determined as follows:
- Waiting time between frequencies: one second;
- Waiting time for each power measurement: one second;
- Number of measurements at each frequency: ten.
In the second measurement setup, the operator selected the frequencies according to the DPS specs, which were between 10 MHz and 4.2 GHz and a 0 dBm power level. The selected frequencies were 10, 20, 30, 40, 50, 60, 70, 80, 90, 100, 200, 300, 400, 500, 600, 700, 800, 900, 1000, 2000, 3000, and 4000 in MHz. The operator selected an SPS similar to the DPS, and it has a metrological traceability chain. The software performed each power measurement in one second at each frequency step. Before starting the measurements, the operator kept the power sensors in ambient conditions of 23 ± 1 °C and 45 ± 15 %rh (relative humidity). The operator used a 12 lb.-in torque for the tightening of the RF connectors. The operator used the same timing parameters for the measurements as in the first measurement setup.
Measurements and calculations were performed using the developed VBCM software.
While taking the measurements using the developed software at the frequencies and power levels, the operator recorded the results manually for software validation.
The CF values of the DPS calculated by the VBCM for each measurement setup and the CF values of the DPS from previous certificates were compared in this study. Previous certificate CF values and VBCM CF values of the DPS are shown in Figure 3 and Figure 4 for the first and second measurement setups, respectively. It can be seen that the CF of the DPS from the previous certificate are in harmony with the CF of the DPS obtained using the VBCM.
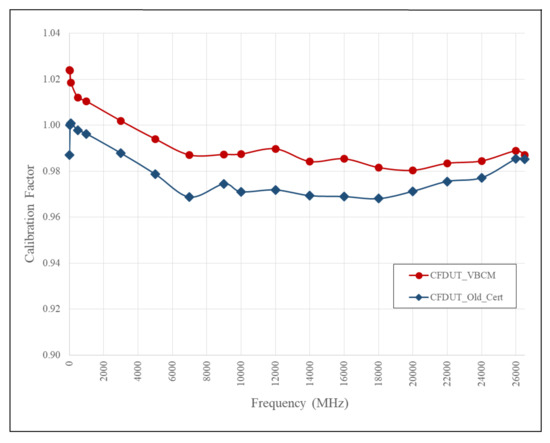
Figure 3.
Comparison of DUT PS (N8485A) CF values for first measurement setup.
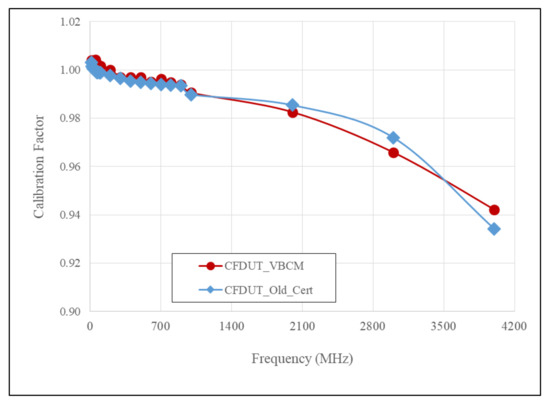
Figure 4.
Comparison of DUT PS (8482A) CF values for second measurement setup.
The VBCM software calculated the uncertainty of the DPS according to the GUM Bayesian method [16,17]. The uncertainty calculated by the VBCM and the uncertainty of the previous certificate of the DPS were compared, and the uncertainties are given in Figure 5 and Figure 6 according to the measurements setups. Figure 6 shows a big difference in the uncertainty values between the VBCM and the previous certificate values. Since the last calibration of the 8482A DPS was performed using the primary power sensor standard, the previous certificate’s uncertainty values were relatively lower.
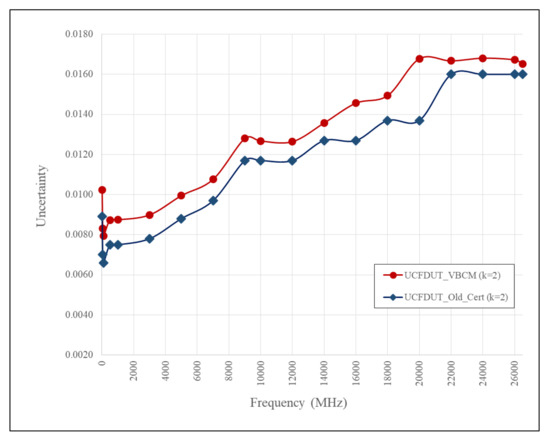
Figure 5.
Comparison of uncertainties of DUT PS (N8485A) CF values for first measurement setup.
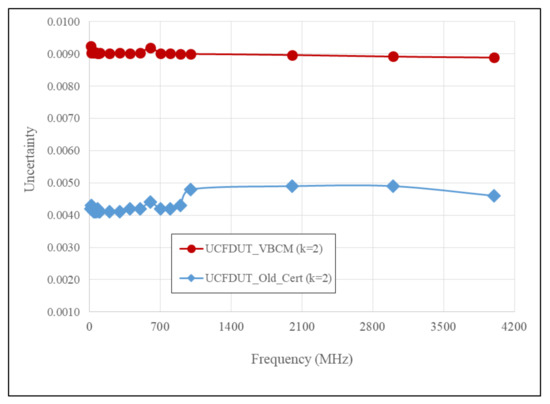
Figure 6.
Comparison of uncertainties of DUT PS (8482A) CF values for second measurement setup.
5. Discussion
The applicability of the VBCM has been demonstrated experimentally, and the results obtained from the application are given in this study.
In this study, the VBCM was tested with the developed software for different devices and different measurement conditions. It was observed that successful results were obtained when measurements were made by taking into account possible errors.
A lot of experience has been gained during software development and experimental work. From this experience, we summarized the possible errors that could happen while applying the VBCM, as follows:
- Errors due to the incorrect reflection coefficient reading of the DPS;
- Errors due to the incorrect power reading by the SPS or DPS;
- Errors due to the incorrect power reading by the SPS power meter or the DPS power meter;
- Errors due to the incorrect power read timing;
- Errors due to the incorrect reflection coefficient of the SPS being used in the calculation;
- Errors due to the incorrect uncertainty of the reflection coefficient of the DPS being used in the calculation;
- Errors due to the assumption of the uncertainty of the VNA’s port in the calculation.
Some advantages of the VBCM have been determined in this study. The advantages of the VBCM are given as follows:
- To calculate the CF of DPS, both reflection coefficient measurements and power measurements should be performed with the power sensor to be calibrated (DPS). The VNA can perform these measurements at the same time.
- The power sensor calibration’s duration can be decreased by using the VNA. It is possible to calibrate the power sensor as fast as the measurement speed of the VNA.
- There will be no need to use an external power splitter. Thus, the potential impedance mismatch components will be reduced by using the VNA.
- An operator who can use a VNA will also have the ability to calibrate the power sensor.
Although it seems like a disadvantage, the following conditions must be applied in the VBCM’s application:
- The VNA and the power meter have to be controlled with software. To perform an automatic measurement, a developed software should be used, or a software should be developed.
- The frequency steps determined before, the measurement of the VNA, and the frequency steps of control software must be synchronous.
- Before power sensor calibration, it is necessary to determine the error terms of the VNA and the pre-measurement settings (zero + cal) of the power sensor and power meter.
6. Conclusions
In this study, the VNA-based power sensor calibration method (VBCM) was introduced, and the requirements of the VBCM were specified. Potential sources of error and their suggested solutions in the VBCM were also given in this study to guide those who want to conduct similar studies. The advantages and disadvantages of the VBCM were also given in this study.
A software that controls the VNA and power meters was developed on the C# platform with the collaboration of TUBITAK, SPARK, and METU. In this study, the software validation was performed using manual measurement as well.
The developed software was used for experimental measurements with two different device setups. The CF values of the DPS obtained with the VBCM software and the previous certificate values of the DPS were compared in this study. Measurement uncertainties were also calculated using software according to the GUM Bayesian method. The uncertainties calculated by the software and the uncertainties of the previous certificates were compared in this study as well. It was shown that the previous certificate CF data and the uncertainty of the CF are in harmony with the CF data and the uncertainty obtained using the VBCM.
It is possible to obtain faster results in future studies, considering the solution suggestions of the possible errors determined in this study.
Author Contributions
Conceptualization, project administration, E.D.; software developer, Y.B.; software developer, A.C.; investigation, M.A.; formal analysis, investigation, H.S.; formal analysis, investigation, A.K.D.; conceptualization, funding acquisition, G.T. All authors have read and agreed to the published version of the manuscript.
Funding
This work is supported by The Scientific and Technological Research Council of Turkey (TÜBİTAK) under Grant No. 5200040, entitled “A New Method and Software Development for Automatic RF Power Measurement and RF Power Meter Calibration”.
Data Availability Statement
The data presented in this study are available on request from the corresponding author.
Conflicts of Interest
There are no conflicts of interest with other publications.
References
- Pozar, D.M. Microwave Engineering, 4th ed.; John Wiley & Sons: Hoboken, NJ, USA, 2011; ISBN 1118213637, 9781118213636. [Google Scholar]
- Orford, G.R. RF power-review of current techniques for power sensor calibration. In Proceedings of the IEE Colloquium on Accreditation of RF Measurement, London, UK, 2 February 1993; pp. 5–10. [Google Scholar]
- Wong, K. Power sensor calibration and uncertainties. In Proceedings of the 60th ARFTG Conference Digest, Fall 2002, Washington, DC, USA, 5–6 December 2002; pp. 167–178. [Google Scholar] [CrossRef]
- Weidman, M.P. Direct Comparison Transfer of Microwave Power Sensor Calibration; NIST Technical Note 1379; National Institute of Standards and Technology: Gaithersburg, MD, USA, 1996.
- Juroshek, J.R. NIST 0.05-50 GHz direct-comparison power calibration system. In Proceedings of the CPEM Conference, Sydney, NSW, Australia, 14–19 May 2000; pp. 166–167. [Google Scholar]
- Shan, Y.; Chua, S.W.; Yan, Y.K. Development of a 50 GHz coaxial direct comparison transfer microwave power sensor calibration system at NMC. In Proceedings of the IEEE Conference on Precision Electromagnetic Measurements, Washington, DC, USA, 13–18 June 2010; pp. 738–739. [Google Scholar]
- Danaci, E.; Celep, M.; Sakarya, H.; Tuncel, O.; Aldawood, K.S.; Alboraih, I.M.; Aljawan, A.H. Calibration factor comparison between TÜBİTAK UME and SASO NMCC. In Proceedings of the 18th International Congress of Metrology (CIM2017), Paris, France, 18 September 2017. [Google Scholar] [CrossRef]
- Kizilbey, O.; Cetinkaya, A.; Arslan, M.; Yugruk, A.; Danaci, E. A Novel Software for Automatic Calibration Factor Measurement of RF Power Sensors. In Proceedings of the 7th International Conference on Computer Science and Engineering UBMK 2022, Diyarbakir, Turkiye, 14–16 September 2022. [Google Scholar]
- Angin, W.K.P.; Kwon, J.; Kang, T.; Kang, N. Comparison of RF power sensor calibration using a vector network analyzer and a direct transfer system. In Proceedings of the URSI Asia Pacific Radio Science Conference, Seoul, Republic of Korea, 21–25 August 2016; pp. 1754–1756. [Google Scholar]
- Wong, K. Complete power sensor calibration using a VNA. In Proceedings of the 80th ARFTG Microwave Measurement Conference, San Diego, CA, USA, 29–30 November 2012. [Google Scholar]
- Singh, D. Publishable Summary for 20IND03—FutureCom RF Measurements for Future Communications Applications. 2022. Available online: https://www.euramet.org/research-innovation/search-research-projects/details/project/rf-measurements-for-future-communications-applications (accessed on 15 December 2022).
- Keysight Technologies. Measurement Fundamentals, Network Analysis, Master the Fundamentals of Network Analysis and Find the Expertise you Need for Advanced Applications; Keysight Technologies: Santa Rosa, CA, USA. Available online: https://www.keysight.com/us/en/solutions/measurement-fundamentals/network-analysis.html (accessed on 3 March 2021).
- Rohde & Schwarz. Vector Network Analyzer Service Manual for ZVA Series; Rohde & Schwarz Test And Measurement, 1145.1155.82-05 Germany. Available online: https://manualzz.com/doc/6339274/rands-zva-service-manual (accessed on 31 January 2019).
- Keysight Technologies. Products And Services, Power Meters & Power Sensors, High Performance Solutions for Peak and Average Power Measurements; Keysight Technologies: Santa Rosa, CA, USA; Available online: https://www.keysight.com/us/en/assets/7018-01739/technical-overviews/5989-7837.pdf (accessed on 5 May 2021).
- Rohde & Schwarz. RF & Microwave Power Meters and Power Sensors; Rohde & Schwarz: Munich, Germany; Available online: https://www.rohde-schwarz.com/us/products/test-and-measurement/rf-and-microwave-power-meters_63672.html (accessed on 15 May 2022).
- JCGM 100:2008; Evaluation of Measurement Data—Guide to the Expression of the Uncertainty in Measurement. 1st ed. Bureau International Des Poids et Mesures: Saint-Cloud, France, 2008. Available online: http://www.bipm.org/utils/common/documents/jcgm/JCGM_100_2008_E.pdf (accessed on 2 January 2020).
- JCGM 101:2008; Evaluation of Measurement Data—Supplement 1 to the Guide to the Expression of Uncertainty in Measurement—Propagation of Distributions Using a Monte Carlo Method. 1st ed. Bureau International Des Poids et Mesures: Saint-Cloud, France, 2008. Available online: https://www.bipm.org/documents/20126/2071204/JCGM_101_2008_E.pdf/325dcaad-c15a-407c-1105-8b7f322d651c (accessed on 2 January 2020).
Disclaimer/Publisher’s Note: The statements, opinions and data contained in all publications are solely those of the individual author(s) and contributor(s) and not of MDPI and/or the editor(s). MDPI and/or the editor(s) disclaim responsibility for any injury to people or property resulting from any ideas, methods, instructions or products referred to in the content. |
© 2023 by the authors. Licensee MDPI, Basel, Switzerland. This article is an open access article distributed under the terms and conditions of the Creative Commons Attribution (CC BY) license (https://creativecommons.org/licenses/by/4.0/).