Article

Polarimetry for 3He Ion Beams from Laser–Plasma Interactions

1
Peter Grünberg Institute (PGI-6), Forschungszentrum Jülich GmbH, D-52425 Jülich, Germany
2
ExtreMe Matter Institute EMMI, GSI Helmholtzzentrum für Schwerionenforschung, D-64291 Darmstadt, Germany
3
Nuclear Physics Institute (IKP-2), Forschungszentrum Jülich GmbH, D-52425 Jülich, Germany
4
Nuclear Physics Institute (IKP-4), Forschungszentrum Jülich GmbH, D-52425 Jülich, Germany
5
Sicherheit und Strahlenschutz (S-A), Forschungszentrum Jülich GmbH, D-52425 Jülich, Germany
6
Institute of Energy and Climate Research, Materials Synthesis and Processing (IEK-1), Forschungszentrum Jülich GmbH, D-52425 Jülich, Germany
7
Peter Grünberg Institute (PGI-JCNS-TA), Forschungszentrum Jülich GmbH, D-52425 Jülich, Germany
8
Central Institute for Engineering, Electronics and Analytics (ZEA-1), Forschungszentrum Jülich GmbH, D-52425 Jülich, Germany
9
Institute of Biological Information Processing (IBI-TA), Forschungszentrum Jülich GmbH, D-52425 Jülich, Germany
10
Laser and Plasma Physics Institute, Heinrich Heine University, D-40225 Düsseldorf, Germany
*
Author to whom correspondence should be addressed.
Instruments 2022, 6(4), 61; https://doi.org/10.3390/instruments6040061
Submission received: 11 August 2022 / Revised: 28 September 2022 / Accepted: 7 October 2022 / Published: 10 October 2022

Abstract

:
We present a compact polarimeter for 3 He ions with special emphasis on the analysis of short-pulsed beams accelerated during laser–plasma interactions. We discuss the specific boundary conditions for the polarimeter, such as the properties of laser-driven ion beams, the selection of the polarization-sensitive reaction in the polarimeter, the representation of the analyzing-power contour map, the choice of the detector material used for particle identification, as well as the production procedure of the required deuterated foil-targets. The assembled polarimeter has been tested using a tandem accelerator delivering unpolarized 3 He ion beams, demonstrating good performance in the few-MeV range. The statistical accuracy and the deduced figure-of-merit of the polarimetry are discussed, including the count-rate requirement and the lower limit of accuracy for beam-polarization measurements at a laser-based ion source.

1. Introduction

Laser-driven particle acceleration in relativistic plasmas is a thriving area of research and on the verge of becoming an established technology. First accelerator facilities are now being realized, for example EuPRAXIA on the European scale [1]. The worldwide strategy processes aiming at the realization of next generation’s particle accelerators [2,3,4] point at the importance of polarized beams for fundamental research and various applications. Furthermore, the conservation of nuclear polarization in plasmas is of utmost importance for the so-called polarized fusion [5], which promises to increase the efficiency of energy production in fusion reactors, and it promises to be beneficial for fusion rockets [6]. Various theoretical works have developed strategies to realize plasma-based acceleration of polarized electron, proton and ion beams, most of them making use of pre-polarized gaseous targets, see, e.g., refs. [7,8,9]. However, we are still awaiting experimental proofs and only first steps in this direction have been taken, employing unpolarized targets where no beam polarization is expected [10,11]. Clearly, meaningful experiments require polarimetry (i.e., direct measurement of the degree of polarization) of the ultra-short accelerated particle bunches, which so far has been realized only in a single null-experiment for few-MeV protons [10]. Spin-polarized 3 He gas is a promising target material for laser–plasma acceleration since robust methods for its production have been developed since the early 1970s [12]. Nuclear polarization levels above 80% can be achieved at gas pressures of a few bar [13] and a further increase of the particle density to values required for plasma-based acceleration is feasible [14]. Our group is currently pursuing an experimental campaign at the PHELIX Petawatt Laser Facility at GSI Darmstadt [15], where bunches of polarized 3 He 2 + ions are generated perpendicular to the laser propagation axis with particle intensities, depending on kinetic energies, above 1 × 10 12 MeV 1 sr 1 per shot at an ion energy of a few MeV [11]. Our 3 He polarimeter is based on the measurement of “left-right” or “up-down” asymmetries in the scattering plane of a beam-target interaction, depending on the orientation of the transverse polarization of the accelerated particle bunches. The sensitivity of such a polarization measurement is basically given by the so-called analyzing power, an energy- and angular-dependent quantity, which has to be known for the particular secondary-scattering reaction in the polarimeter. A similar polarimeter design based on p- 3 He scattering, i.e., 1 H( 3 He , 3 He) 1 H, was used for the 33 MeV polarized 3 He beam facility at the University of Birmingham in the 1970s [16,17]. However, this polarimeter was not suitable for the required 3 He beam energies around 20 MeV, and thus was replaced by a recoil deuteron polarimeter based on d- 3 He scattering, i.e., 2 H( 3 He , 3 He) 2 H, using a deuterated polyethylene foil-target [18]. The 4 He- 3 He elastic scattering was used very early in a low-energy 3 He polarimeter [19], and the contour map of the analyzing power vs. the equivalent 3 He laboratory energy and the center-of-mass (CM) scattering angle is available [20,21] at 3 He beam energies of 5–6 MeV, where the analyzing power is expected to be close to 100% at certain scattering angles [22]. To extend the 3 He polarimetry to even lower beam energies of 1–2 MeV, as required for our measurements of laser-driven 3 He ions, the d- 3 He fusion reaction, i.e., 2 H( 3 He, 4 He) 1 H, has been selected since it releases a large amount of energy (Q value of 18.35 MeV), which enables the reaction products, i.e., proton and α particle, to readily leave the target for further detection. Ultra-intense laser pulses generally pose harsh conditions for particle detectors due to the presence of strong electromagnetic pulses (EMP) and the production of many background particles (like electrons) and radiation. Thus, most of the common electronic radiation detectors comprising a real-time event-by-event data acquisition are not applicable, and alternative beam-diagnostic techniques have been established for laser-accelerated proton or ion beams [23]. The detector material in our polarimeter is introduced in Section 2.3.

2. Polarimeter Design

Polarimetry based on hadronic interactions, such as nucleus-nucleus scattering in a secondary target, requires the use of previously measured analyzing powers, deduced from differential cross-section data, since generally these cannot be predicted from first principles [24]. Thus, a calibration of the polarimeter would be necessary, but nowadays polarized 3 He beams are no longer available. An alternative method is to employ data obtained in inverse kinematics, i.e., from experiments with deuteron beams and polarized 3 He gas targets [25]. The values of the analyzing powers from such measurements first need to be transformed kinematically from the CM to the laboratory frame with equivalent 3 He beam energy and the deuteron target at rest. These transformed data can then be applied to the analysis of scattering data obtained with the laser-accelerated 3 He ion bunches.

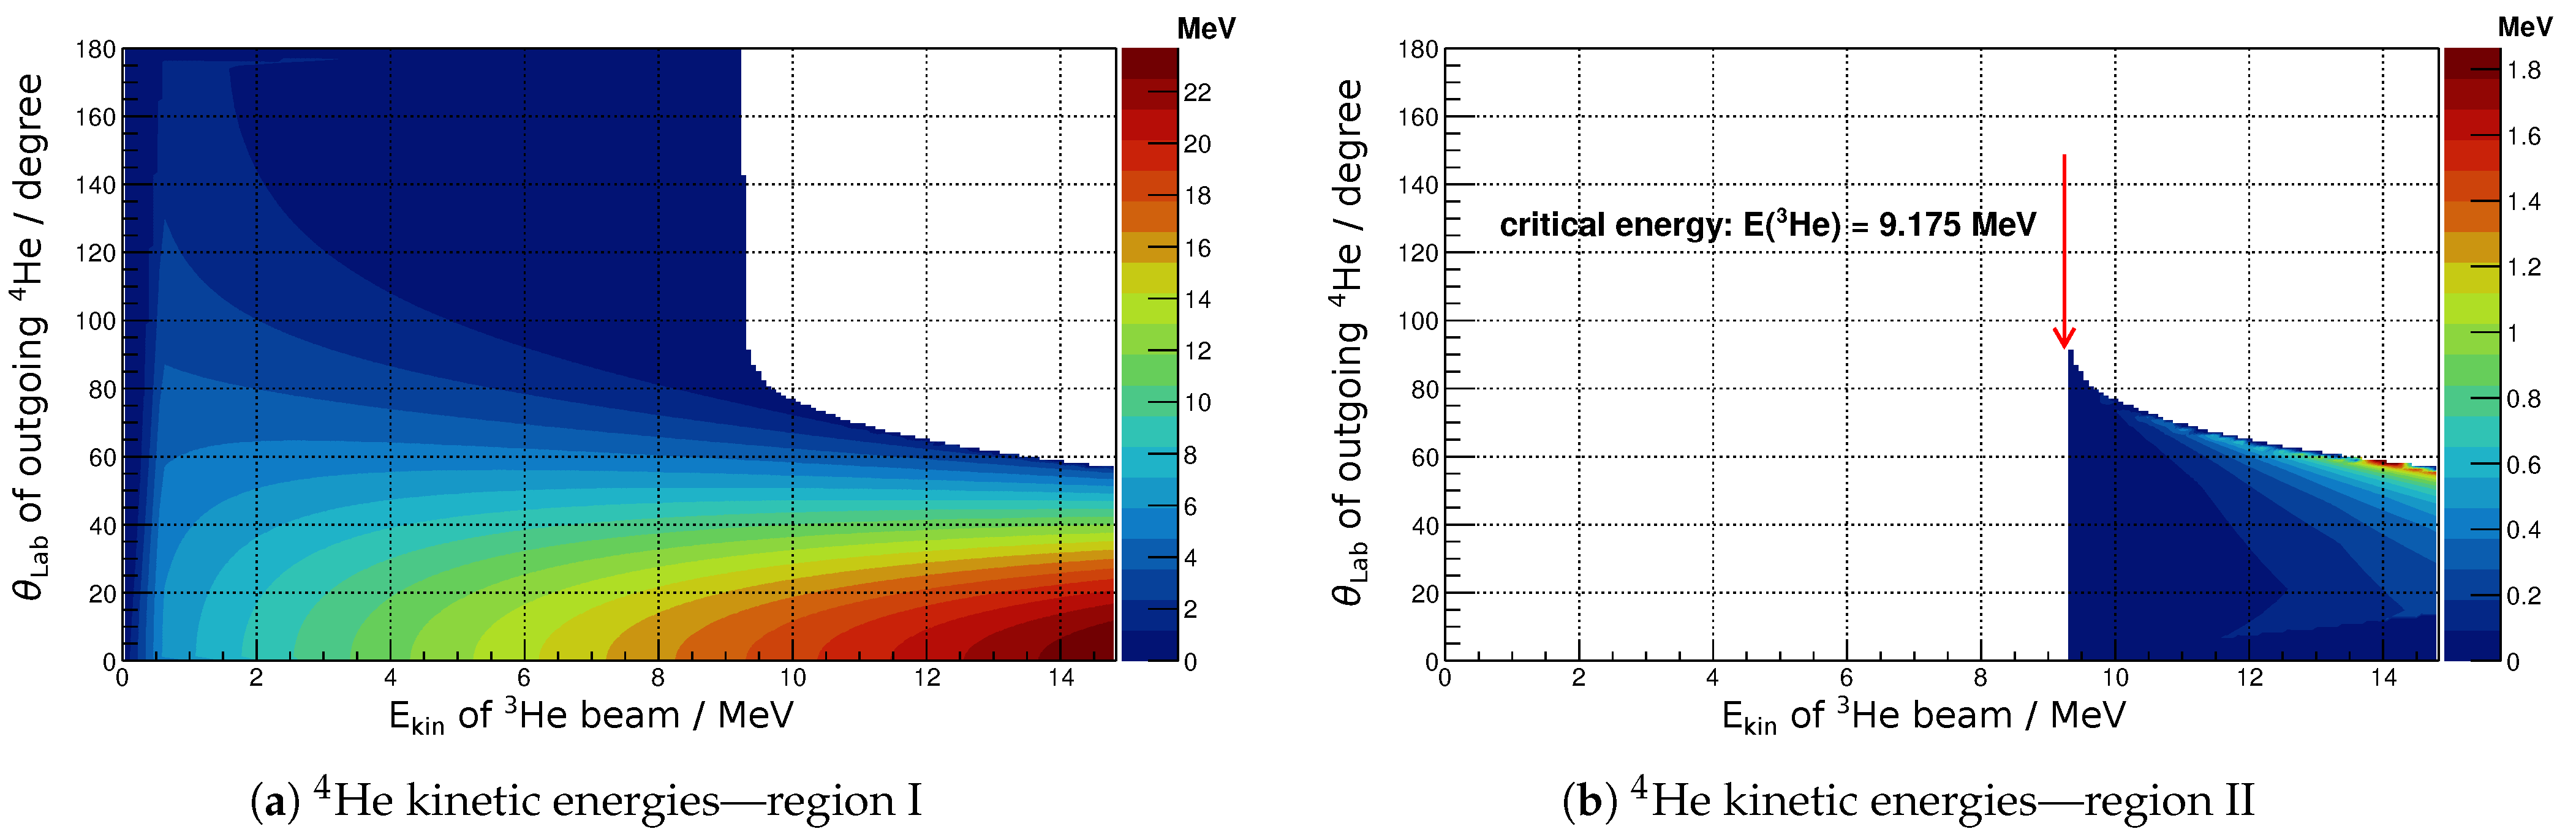
2.1. Properties of Laser-Driven He Beams
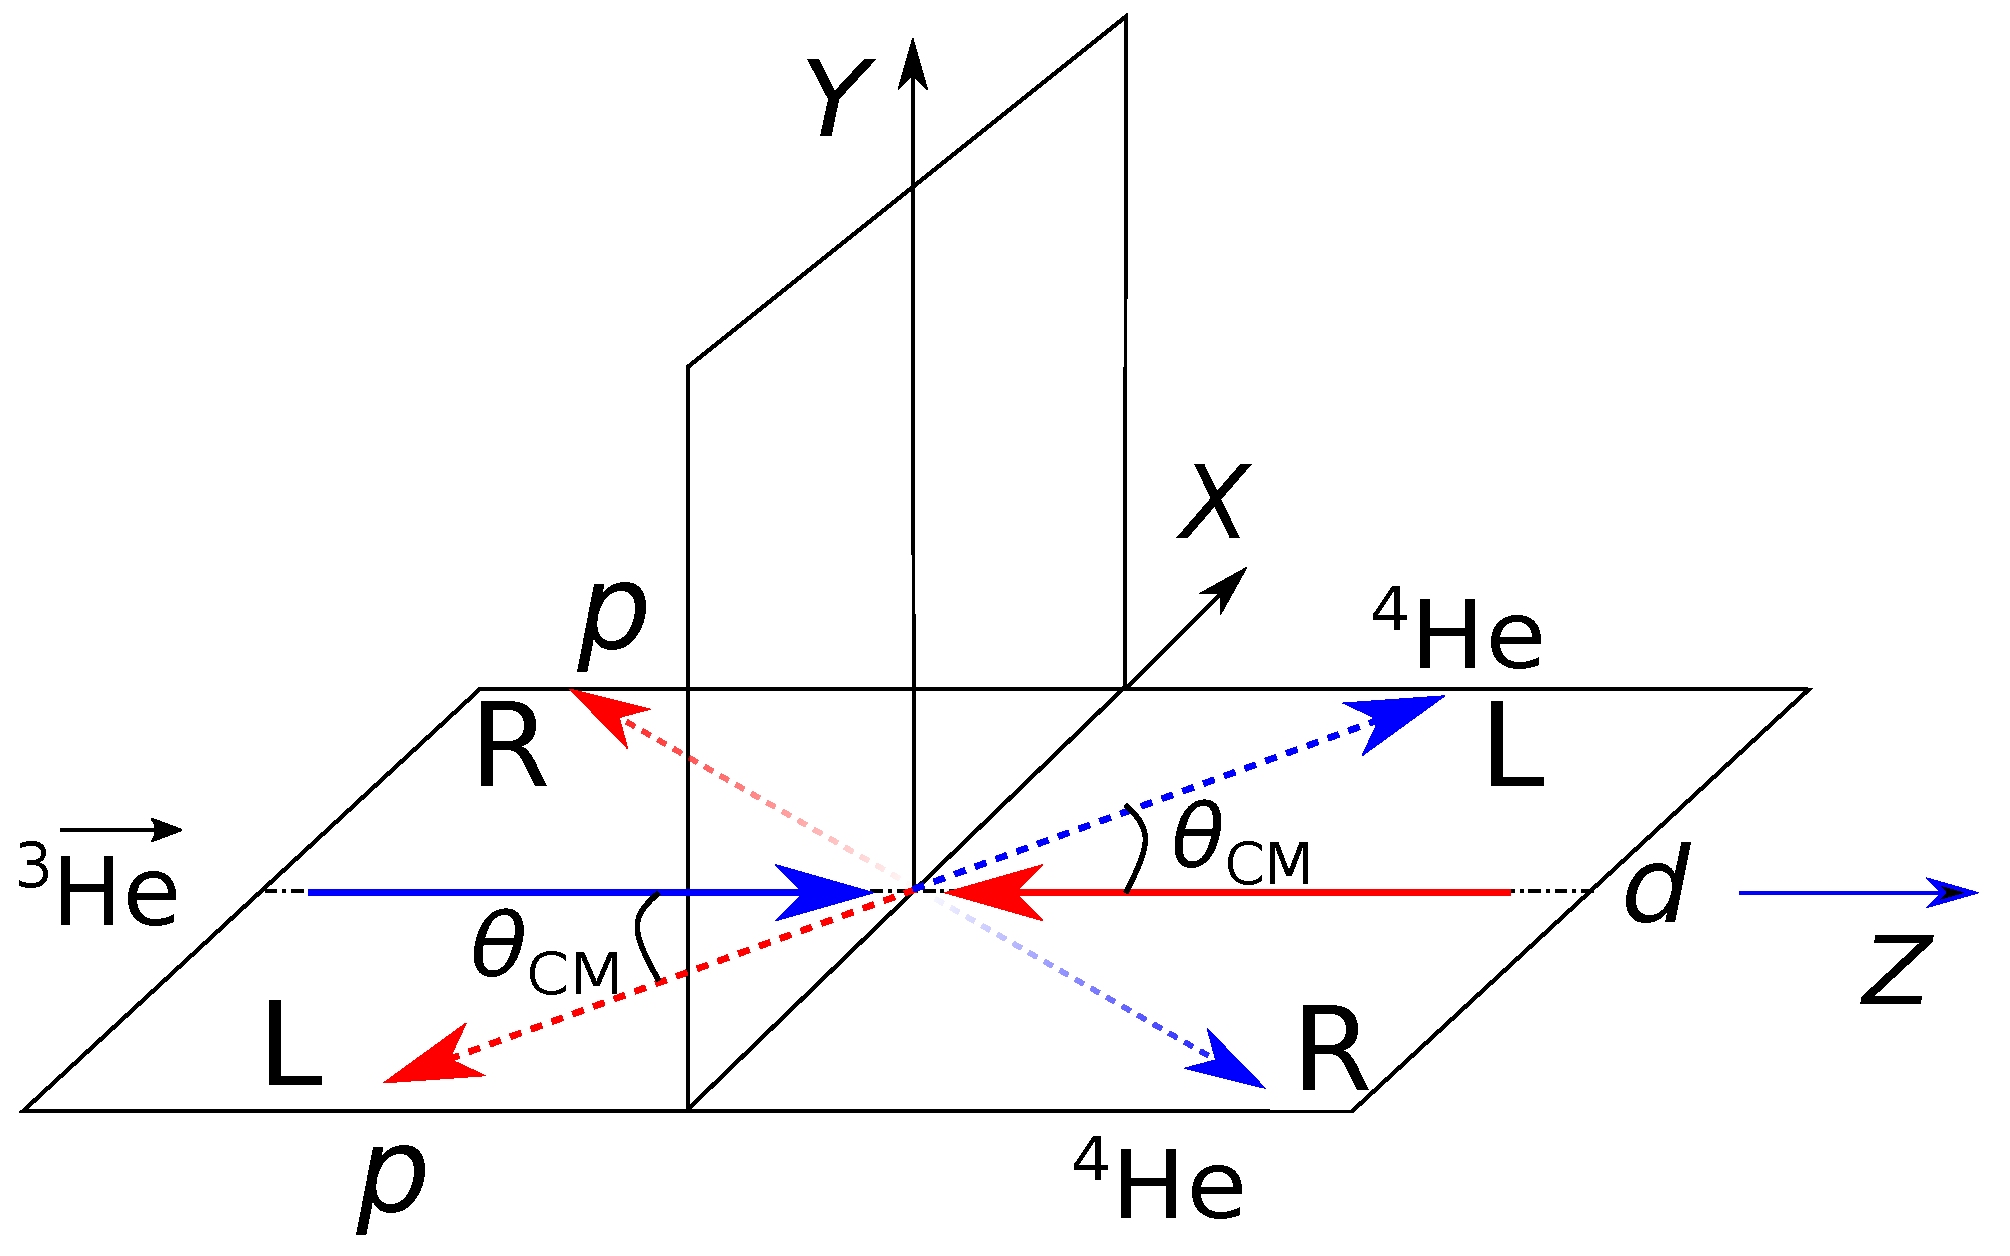
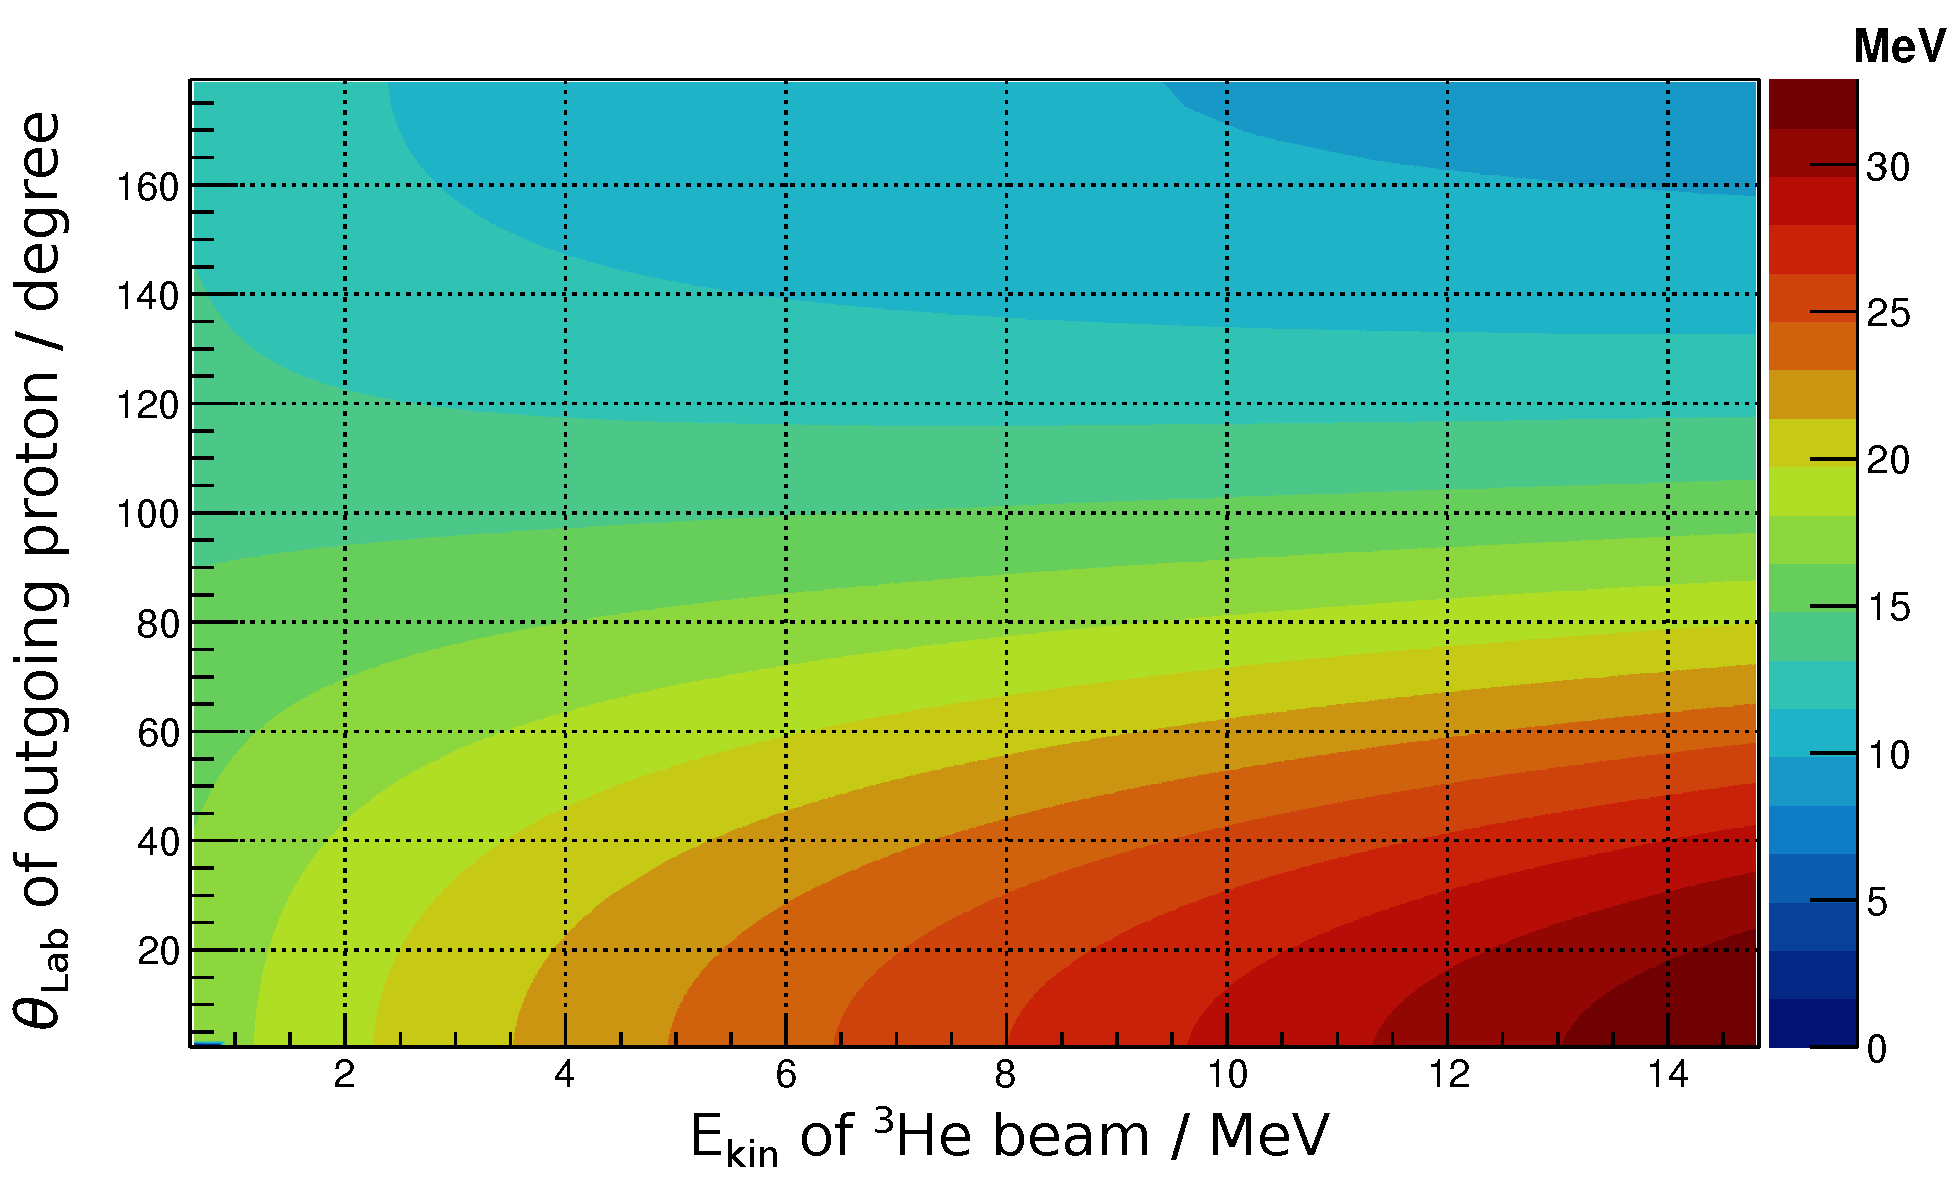
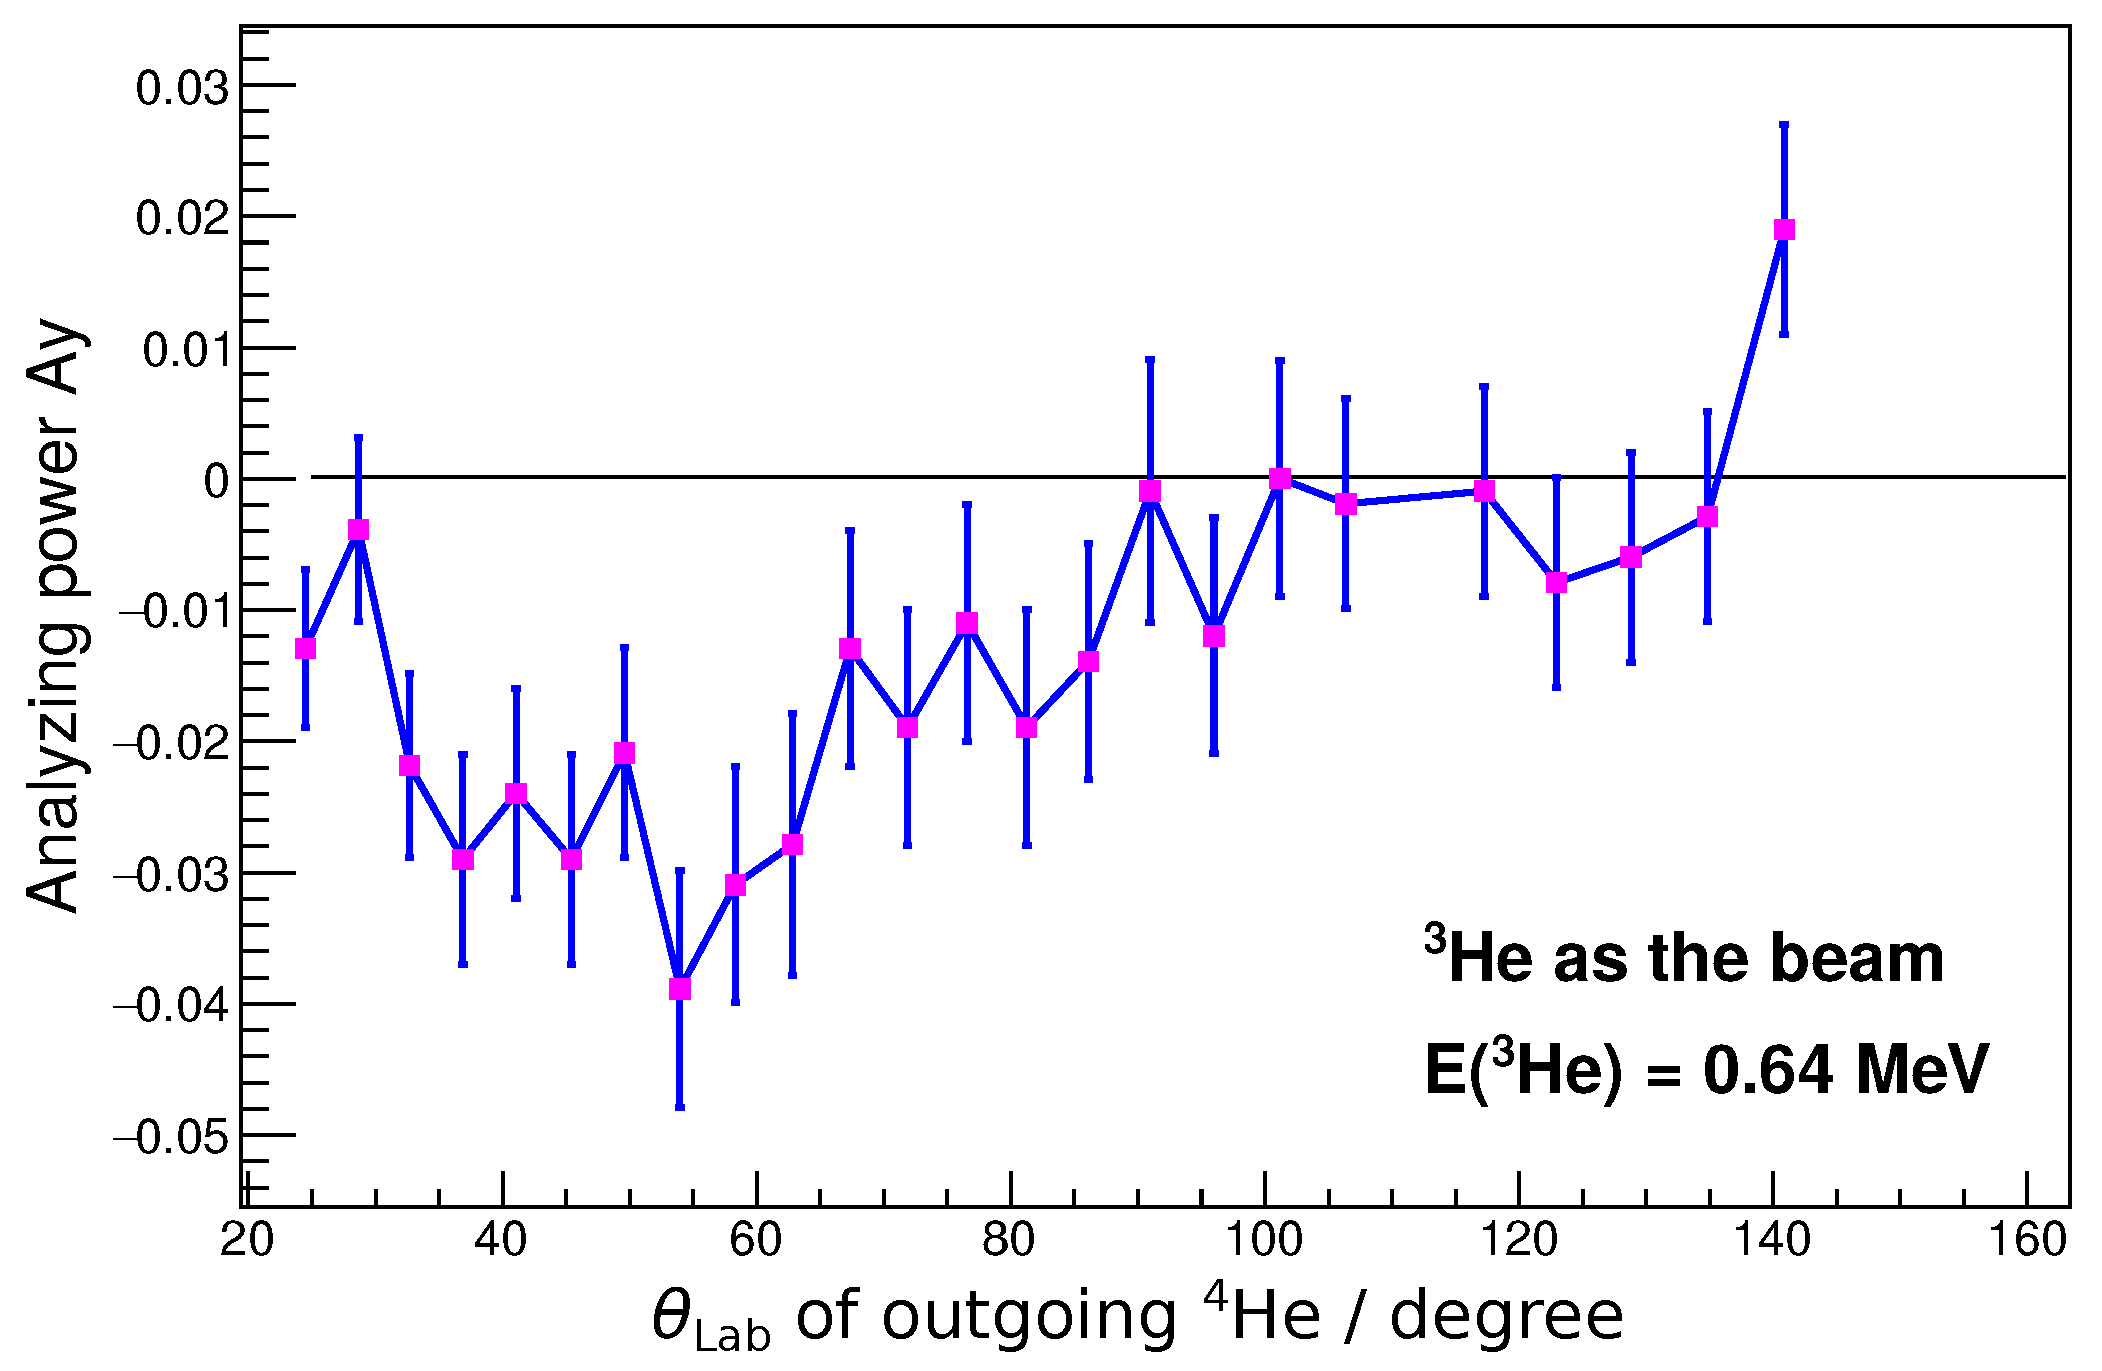
The laser-induced acceleration of 4 He and 3 He ions at the PHELIX laser facility has been investigated in a pilot study [11] with the goal to measure the particle flux in dependence on their emission angles and kinetic energies. These data were complemented and interpreted by particle-in-cell simulations of the laser–plasma interaction. As a result, the optimal laser energy in the range 40–60 J, and the optimal pulse duration of 1.6–3.2 ps have been found for polarized 3 He ion beam generation. The gas-backing pressure required for the build-up of the helium gas jet is as high as 30 bar, which yields a maximum jet density of 6 × 10 19 cm 3 0.06 n cr ( n cr being the critical density) at the position of the accelerating laser focus. Employing these optimal parameters, such as a laser energy of 44 J, a pulse duration of 3.2 ps, a minimal spot size of about ( π /4) 11 × 15   μ m 2 (FWHM), a peak intensity of 1.0 × 10 19 W cm 2 , and a gas particle density of 0.06 n cr , the kinetic energy spectra of both He 2 + and He 1 + ions were measured at an angle of 90 relative to the direction of laser propagation [11]. The He 2 + ions have a peak in the range of 0.9–1.0 MeV with an average flux of 1.2 × 10 12 MeV 1 sr 1 . The He 2 + energy distribution also reveals a plateau next to the peak with an average height of 0.5 × 10 12 MeV 1 sr 1 between 1.0 and 3.2 MeV. The cut-off of the He 2 + energy spectrum is at around 4 MeV. The He 1 + ions have a peak in the range of 0.5–0.6 MeV with an average height of 1.1 × 10 12 MeV 1 sr 1 , their flux decreases sharply above 1.6 MeV and the cut-off is at about 2.5 MeV. Roughly speaking, the He 2 + ions are accelerated twice as strong as the He 1 + ions as expected from the charge-to-mass ratio [11].

2.2. Analyzing Power of the d- 3 He Fusion Reaction

In the CM frame, the analyzing power for a proton asymmetry measurement at a polar angle θ CM , relative to the deuteron beam direction, is equal to the 4 He analyzing power at the same polar angle θ CM relative to the 3 He beam direction, which is depicted in Figure 1.
The contour map of the analyzing power in the CM frame, shown in Figure 2a, is obtained by fitting each set of experimental data points for the same deuteron beam energy and subsequent interpolation between the fitted curves of different energies with the Delaunay triangulation defined in the ROOT software (CERN) [26]. The data points used for fitting are all from proton-asymmetry measurements for the 3 He (d,p) 4 He reaction using a polarized 3 He gas target and deuteron beams having seven different energies from 0.3 to 2.5 MeV [27] and three different energies from 6 to 10 MeV [28].
The differential cross-section σ at polar and azimuth angles θ CM and ϕ , and for a 3 He polarization P (in Y direction) and the corresponding analyzing power A y , is given by
σ ( θ CM , ϕ ) = σ 0 ( θ CM ) · [ 1 + P A y ( θ CM ) cos ϕ ]
where σ 0 is the differential cross-section without any polarization. In the scattering (i.e., X Z ) plane, the left (L) side corresponds to ϕ = 0 and the right (R) side to ϕ = 180 . Therefore, the analyzing power
A y ( θ CM ) = 1 P · σ L ( θ CM ) σ R ( θ CM ) σ L ( θ CM ) + σ R ( θ CM )
can easily be transformed from the CM to the Lab frame. The analyzing powers in the Lab frame have the same values when θ Lab and the θ CM are related by kinematics, as indicated in Figure 2b. The contour map of the analyzing power vs. the various 3 He beam energies and the outgoing 4 He polar angles in the Lab frame is the starting point of our polarimeter design.

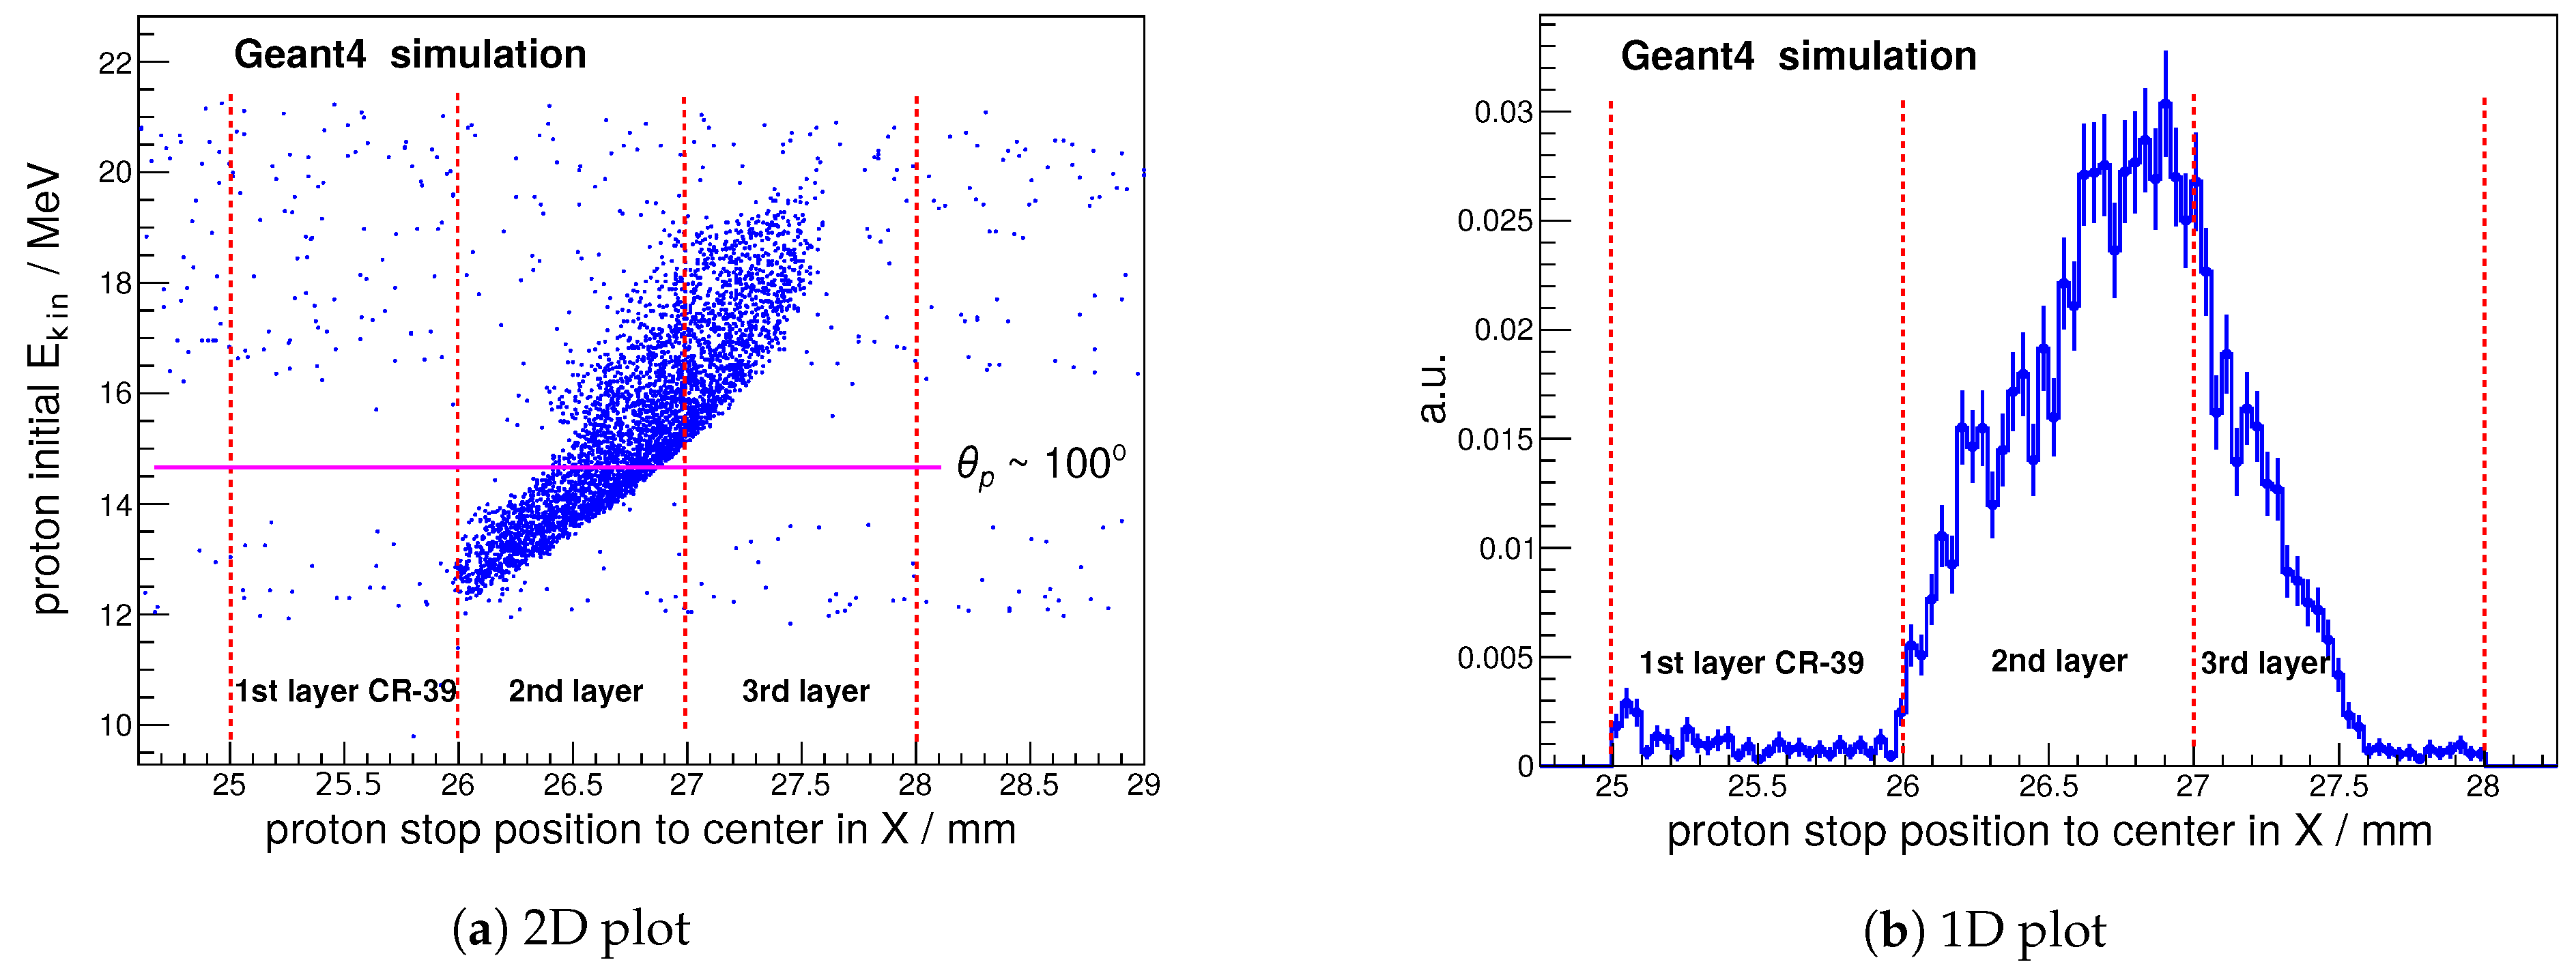
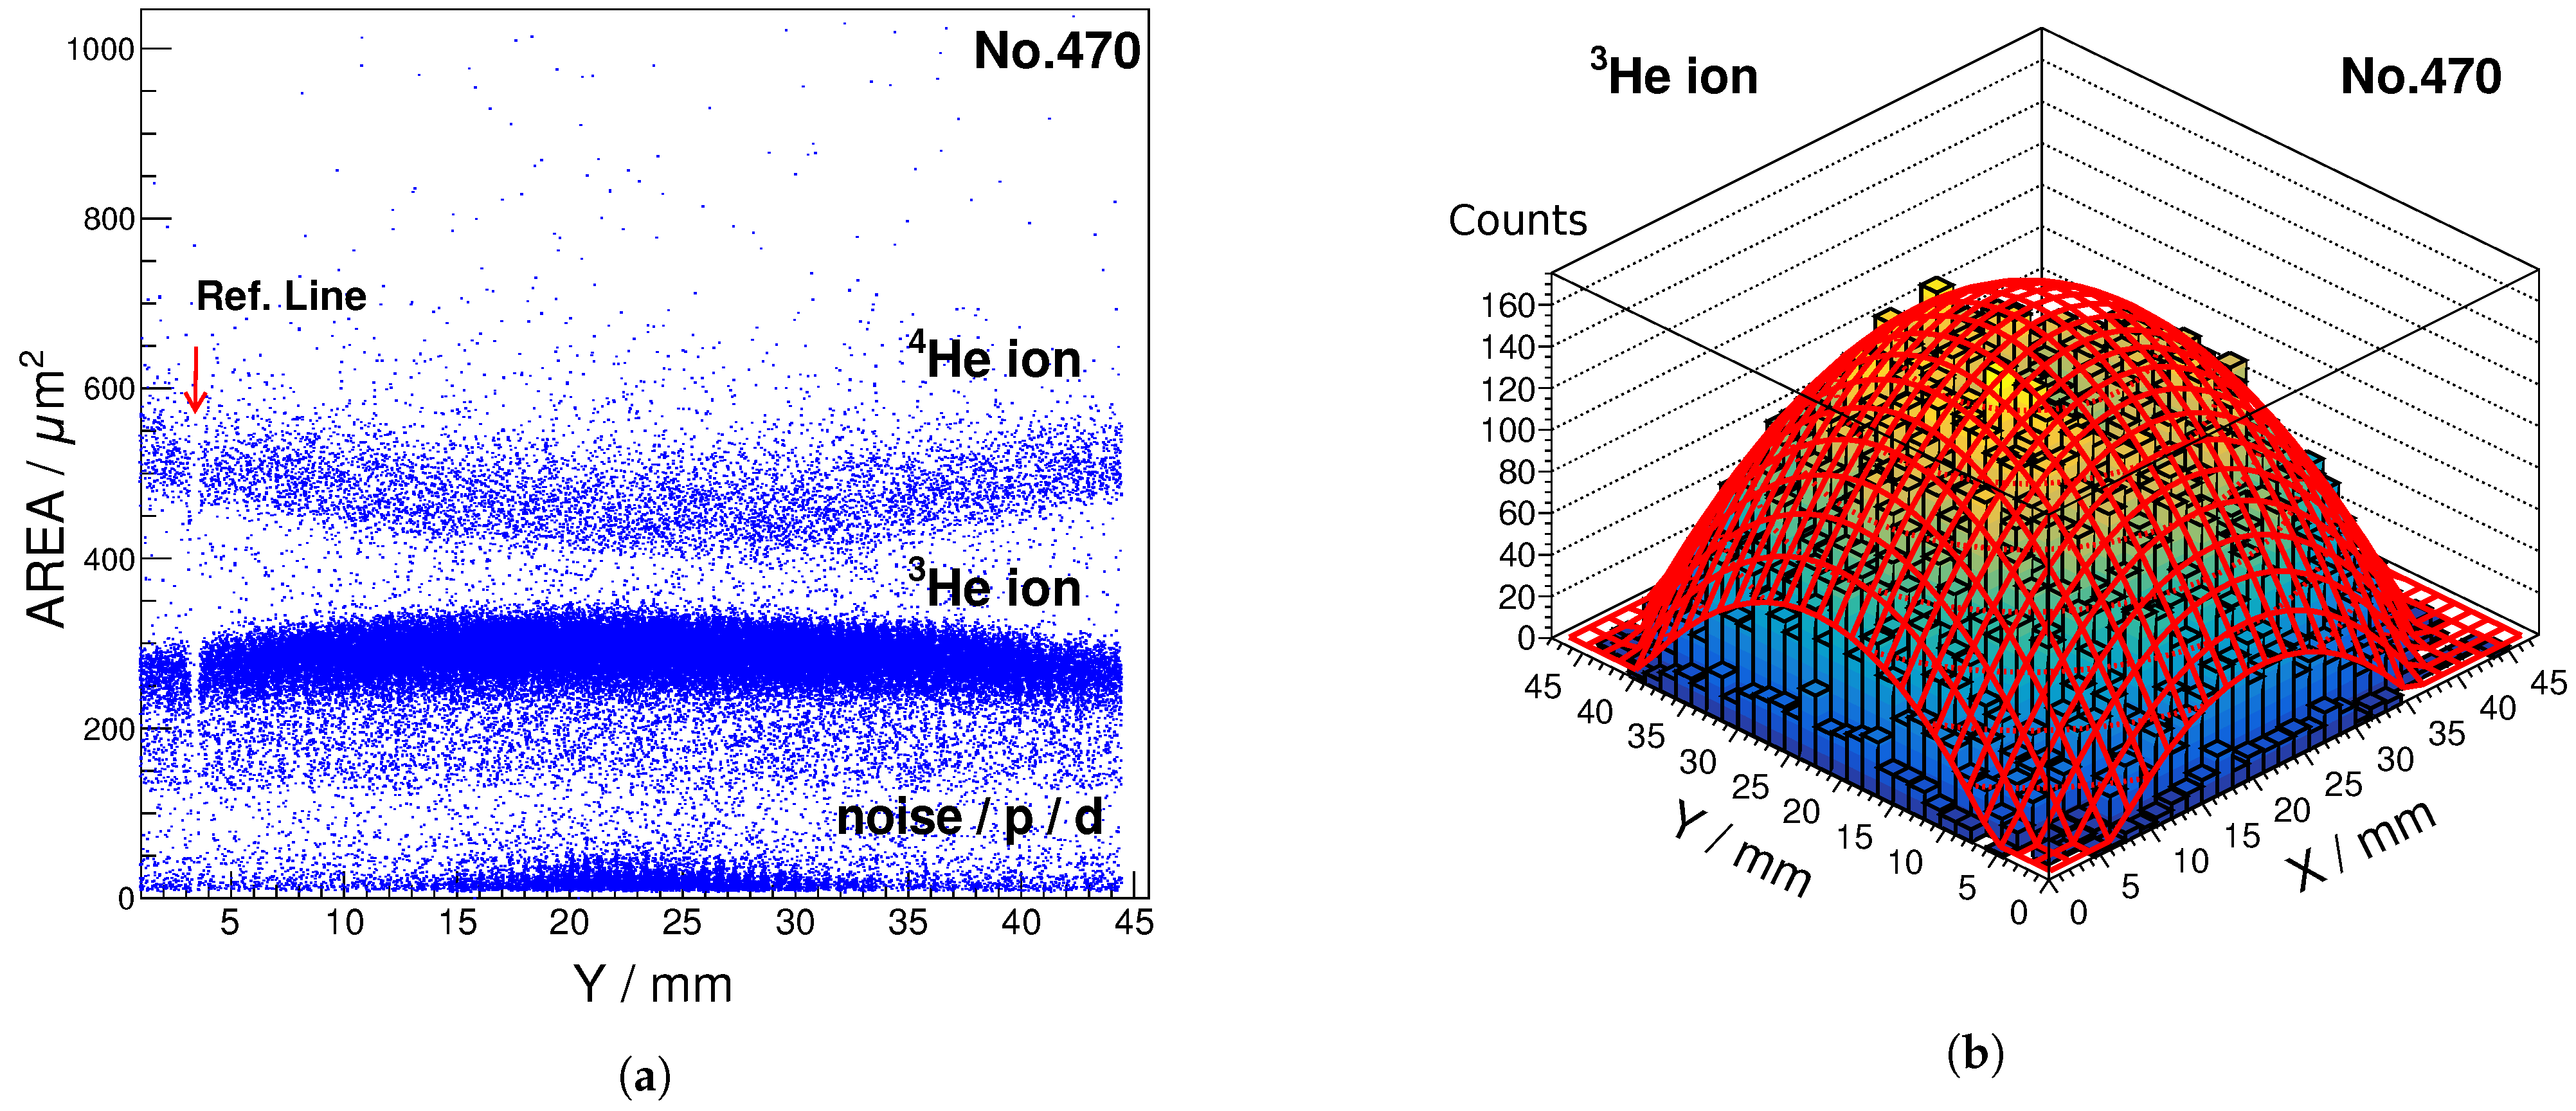
2.3. Particle Identification: Proton or α Particle

The polarimetry requires identification of the d- 3 He fusion reaction from its ejectiles, i.e., proton or α particle. Since the emitted protons with energies above 12 MeV can presumably be easily distinguished from the background and other nuclear reactions, we investigated the identification of proton tracks for the polarimeter as the first choice. After a first experimental test and simulation studies, the detector material selected for our polarimeter was found to have limits for the detection of protons, so we also considered the identification of α particles in a second step. The detector material in the polarimeter is one kind of Solid State Nuclear Track Detectors (SSNTDs) [29,30]. A SSNTD is well compatible with laser–plasma experiments, because it is insensitive to EMPs, X-rays and gamma rays, which are unavoidable during ultraintense laser–plasma interactions. A SSNTD is not suitable for beam diagnostics due to saturation effects [31], but it is favorable for the detection of secondary particles with an accumulated track intensity up to 10 5 10 6 / cm 2 , depending on the track dimension after etching. CR-39 (commercial name, a kind of polyallyldiglycol carbonate, PADC) [29] is the most sensitive SSNTD for protons and light ions, since it has the smallest threshold of track formation [32,33]. From the equivalent specific energy loss dE/dx∼5 keV μ m 1 in water [32] one can deduce the threshold kinetic energy for proton detection by CR-39 of roughly 10 MeV. In other words, protons with kinetic energies above 10 MeV, when passing through the surface of a CR-39 plate, have no observable tracks on the surface after a standard etching process with 6.25 M (i.e., mol/L) NaOH solution at a temperature of 75 C for 60 min.
The kinetic energies of the protons from the d- 3 He fusion reaction are above 12 MeV. As seen from Figure 3 the proton energy has the smallest dependence on the 3 He beam energy when its polar angle is around 100 .
Proton detection and identification was tested with an unpolarized 4.5 MeV 3 He beam from a Tandetron accelerator, using an experimental setup similar to the one described in Section 3, except for mounting the deuterated foil-target at the center of the polarimeter and rotating it by 45 such that the protons emitted at a polar angle of about 90 to the left and right sides were able to reach the CR-39 plates without shadowing. Since a single CR-39 plate with 1 mm thickness is not sufficient for the proton detection (as explained above), CR-39 stacks each comprising three layers were installed in three directions (left, right and forward) to form the polarimeter. We expected to observe proton track formation on the back side of the first layer (with respect to the scattering foil), both sides of the second layer and the front side of the third layer. After etching there were no identified proton tracks observed on the back side of the first layer and on the front side of the second layer—these proton tracks were only observed on the back side of the second layer and the front side of the third layer. The density of the proton tracks on the back side of the second layer was much higher than on the front side of the third layer, as shown in Figure 4.
A tracking simulation based on the Geant4 software [34] has been carried out in order to understand the data from the test run. The simulated range distributions of protons stopped in the CR-39 stack are depicted in Figure 5a. The proton tracks on the front side of the third layer are formed by the protons getting into the third layer, however, on the back side of the second layer both the penetrating protons and the stopped protons near the surface are included, shown in Figure 5b. The recorded number of stopped protons varies with the etching depth on the back side of the second layer, thus revealing more proton tracks when etching more deeply. On the other hand, some proton tracks are removed when the range of protons ends in the etching depth on the front side of the third layer. This can explain that the observed proton tracks were much more intense on the back side of the second layer than on the front side of the third layer. So, it turned out that a stack of CR-39 plates can only reveal a small portion of the emitted protons in the acceptance of the polarimeter. Furthermore, the left-right asymmetry measurement is distorted by the inevitable thickness variation of each CR-39 plate which can be due to the manufacturing process by the company or the pre-etching process by the user.
Due to the observed limitations of the proton-track analysis, we focused our particle identification on α particles emitted from the d- 3 He fusion reaction. In contrast to protons the α -particle distribution exhibits a maximum polar angle in the Lab frame, when the 3 He beam energy exceeds a critical value. This angle can be derived from the kinematics and the Q value of a nuclear reaction A(B, C)D, where B is the beam particle with kinetic energy E B and A is the target at rest. The critical beam energy is related to the velocity of the center-of-mass system v 0 by Equation (4), when v 0 reaches the velocity of the heavier particle D in the CM frame. Since it is at rest in the Lab frame, particle A always moves with the speed v 0 but in the opposite direction in the CM frame. The conservation of mass–energy in the CM frame gives
1 2 ( m D 2 m C m A 2 m B + m D m A ) v 0 2 = Q
         v 0 2 = 2 m B E B ( m A + m B ) 2
When the proper masses of A (m = 2u), B (m = 3u), C (m = 1u) and D (m = 4u) are inserted into Equations (3) and (4), the critical beam energy is obtained as E B = Q / 2 . The kinematics of the emitted α particles is plotted in Figure 6.
There is no threshold energy for track formation in the CR-39 plates for the α particles if their dip angle, defined as the angle between the incidence vector and the surface plane, is larger than 30 . When the 3 He beam energy has values between 1 and 3 MeV the emitted α particles have a kinetic energy between 2 and 8 MeV with polar angles larger than 30 , roughly making the incident range between 10 μ m and 60 μ m in the CR-39 plate. So the α particles impinging on the left and right sides of the polarimeter are recorded on the front sides of the first layer of the CR-39 stacks. A challenge for the α detection is that the thickness of the deuterated foil-target should be below 10 μ m. Only then they are emitted from the target and keep as much kinetic energy as possible to be released on the surface of CR-39 plate for proper track formation.

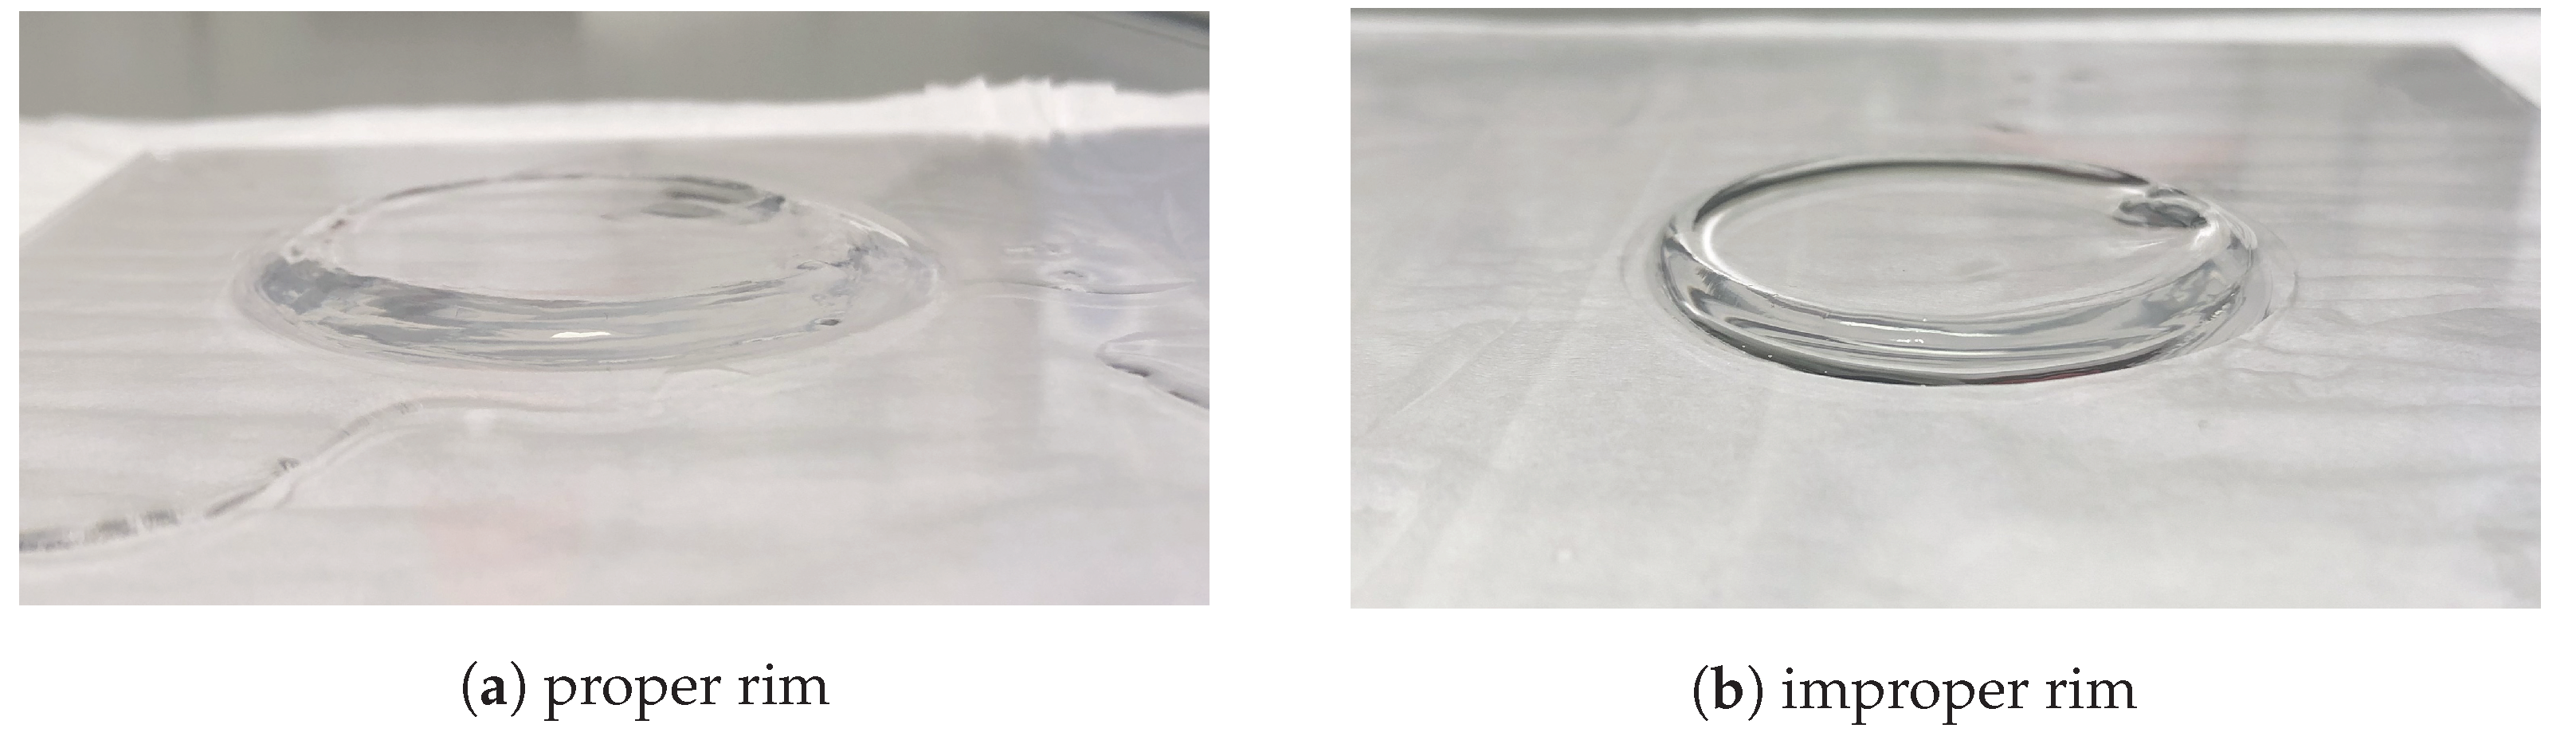
2.4. Deuterated Foil-Target Production

Since suitable deuterated foil-targets are not commercially available, we decided to produce them ourselves from deuterated-polyethylene powder [36] according to instructions that can be found in the literature [37,38,39]. This involves three steps, first to solve 10 mg deuterated-polyethylene powder in 3–4 mL xylene. Second, to pour the solution onto a glass slide pre-coated with sufficient soap solution as a median layer. Third, to separate the foil from the glass slide in a water bath until the foil is floating free on the water surface. It is advisable to start with cheaper standard polyethylene powder for practicing. There is some experience obtained during the production process. A silicon oil bath for the xylene solution is very helpful to keep the temperature at 135 C, while according to the producer the melting point of the deuterated polyethylene (C 2 D 4 ) is above 110 C. A piece of an aluminum tube with a diameter around 4 cm is used to control the size of the foil. The xylene solution is poured into the tube and the polymer gel is confined within. When the tube is removed, the polymer gel still keeps its shape. A problem may occur when the polymer foil is produced. The polymer gel can shrink to a much smaller size when the solvent xylene is drying out during several hours. It is helpful to observe the edge of the polymer gel when it is separated from the tube, shown in Figure 7. If the edge has a slope to the glass surface it is more probable to attach firmly on the slide and the polymer foil is more likely to keep its original size [40].
The thicknesses of the produced deuterated foil-targets are between 5.5 μ m and 7.7 μ m (0.60 mg cm 2 and 0.83 mg cm 2 ). We have not succeeded in producing films with a thickness of less than 4 μ m with this method, since these polymer foils have voids after drying out. We found that the thin deuterated foils easily break close to the aluminum frame of the target holder during the evacuation in the vacuum chamber at the Tandetron. This problem is solved by a double-layer (CD 2 + CH 2 ) foil with a second layer of 4 μ m polypropylene (C 3 H 6 ) as a holder, which has industrial-standard strength and is available commercially.

3. Beam Test at a Tandetron

The polarimeter has been tested with unpolarized 3 He ion beams in the Tandetron Laboratory of Forschungszentrum Jülich [41,42]. The Tandetron provides a maximum terminal high voltage of 1.7 MV with negative ion sources at the input and changes the charge states of the ions from negative to positive at the center as depicted in Figure 8a. Therefore, the Tandetron can accelerate H/D ion beams up to 3.4 MeV, and 3 He/ 4 He beams up to 5.1 MeV. Our beam test was carried out at one of the three end stations, named μ -NRA, i.e., Nuclear Reaction Analysis with micro-beams [43].

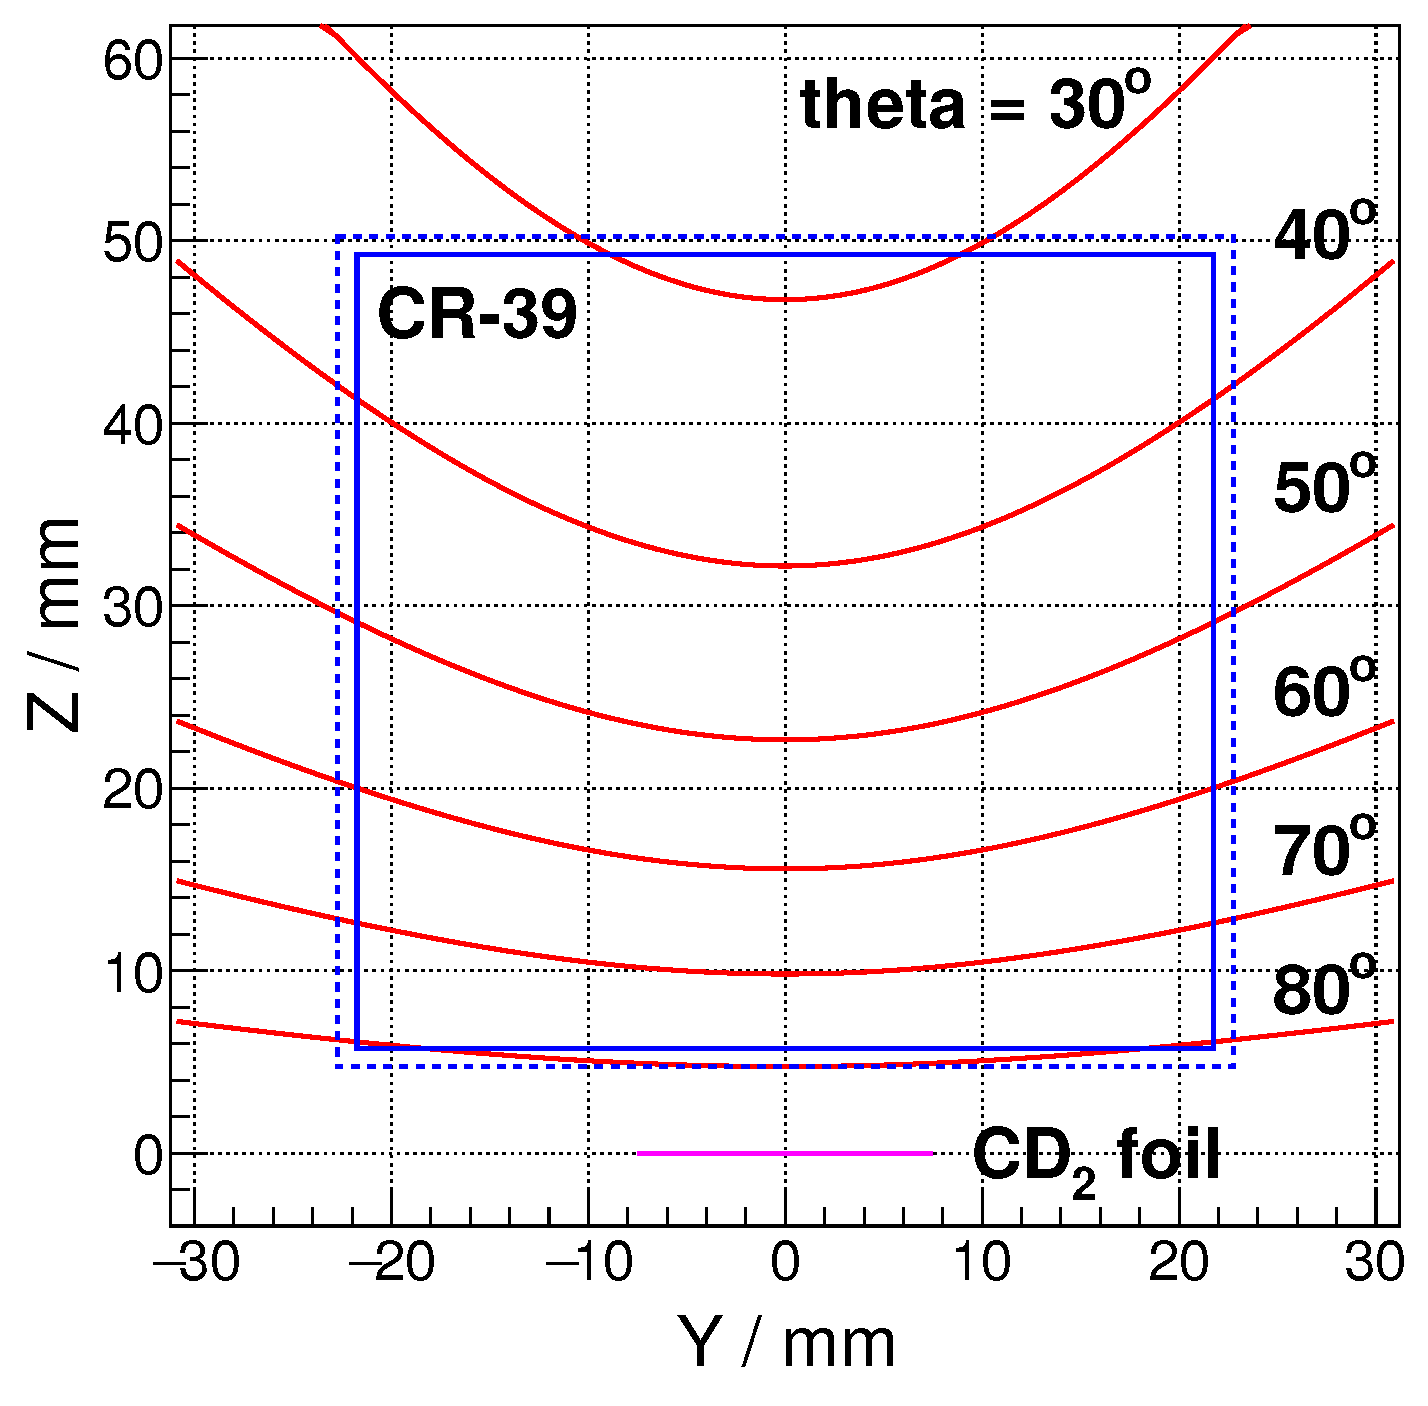
3.1. Experimental Setup

A prototype of the 3 He polarimeter was mounted on the rotational 3D-movable table in the vacuum chamber of the μ -NRA end station as shown in Figure 8b. The polarimeter was loaded at three sides, denoted Left, Right and Forward with respect to the beam direction, with stacks of custom-made CR-39 plates, each having dimensions 49.5 mm × 49.5 mm × 1 mm and imprinted indexing numbers. A double-layered (4 μ m CH 2 + 7.5 μ m CD 2 ) foil-target held by an aluminum frame was installed at the entrance side of the polarimeter. The accelerated 3 He 2 + ions with a fixed beam energy of 1.45 MeV were slowed down in the CH 2 layer of the foil-target to around 0.64 MeV, where the cross section of the d- 3 He fusion reaction in the second layer has a resonance. In the CM frame, the differential cross-section is nearly isotropic at the resonance with a maximum value between 60 and 64 mb sr 1 [44]. One silicon detector was used as an online monitor for the detection of backward protons, emitted from the d- 3 He fusion reaction, with a sensitive area of 1.3 cm 2 and at a distance of 3.5 cm to the foil-target. Since the outgoing protons and α particles are emitted almost isotropically, the proton rate on the silicon detector can be used to estimate the track density of α particles on the CR-39 plates. The backward protons were identified in the online spectrum from a high-energy peak above 10 MeV. The integral of the proton peak was finally around 600 counts, which was controlled by the beam current of a few pA and the irradiation time of a few minutes, giving an estimated α intensity of 460 counts/cm 2 on the CR-39 plates.

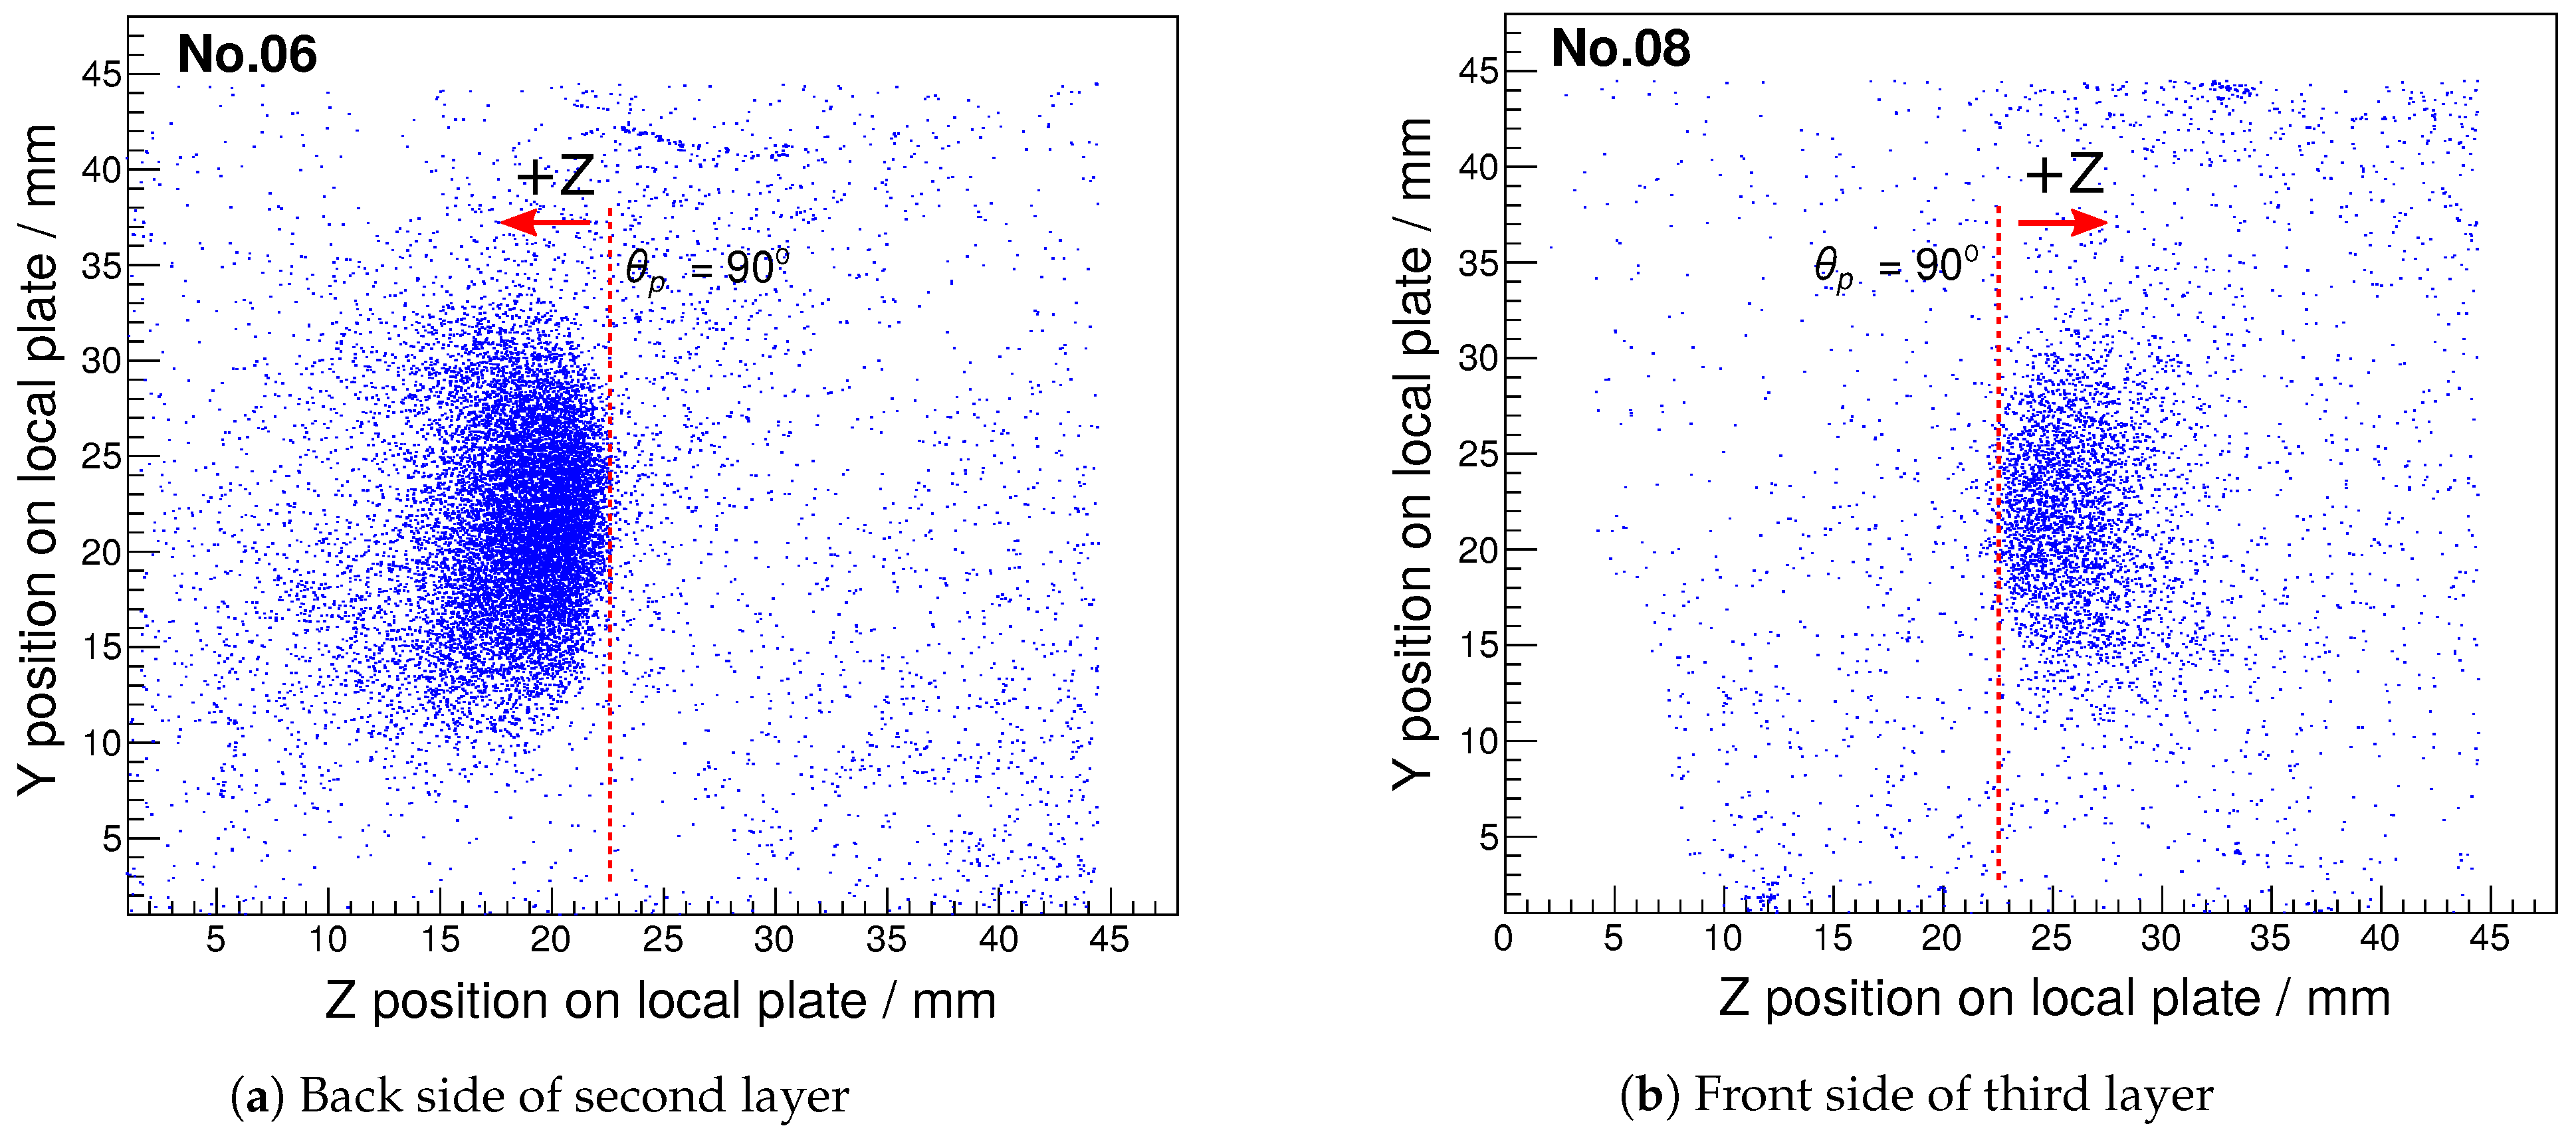
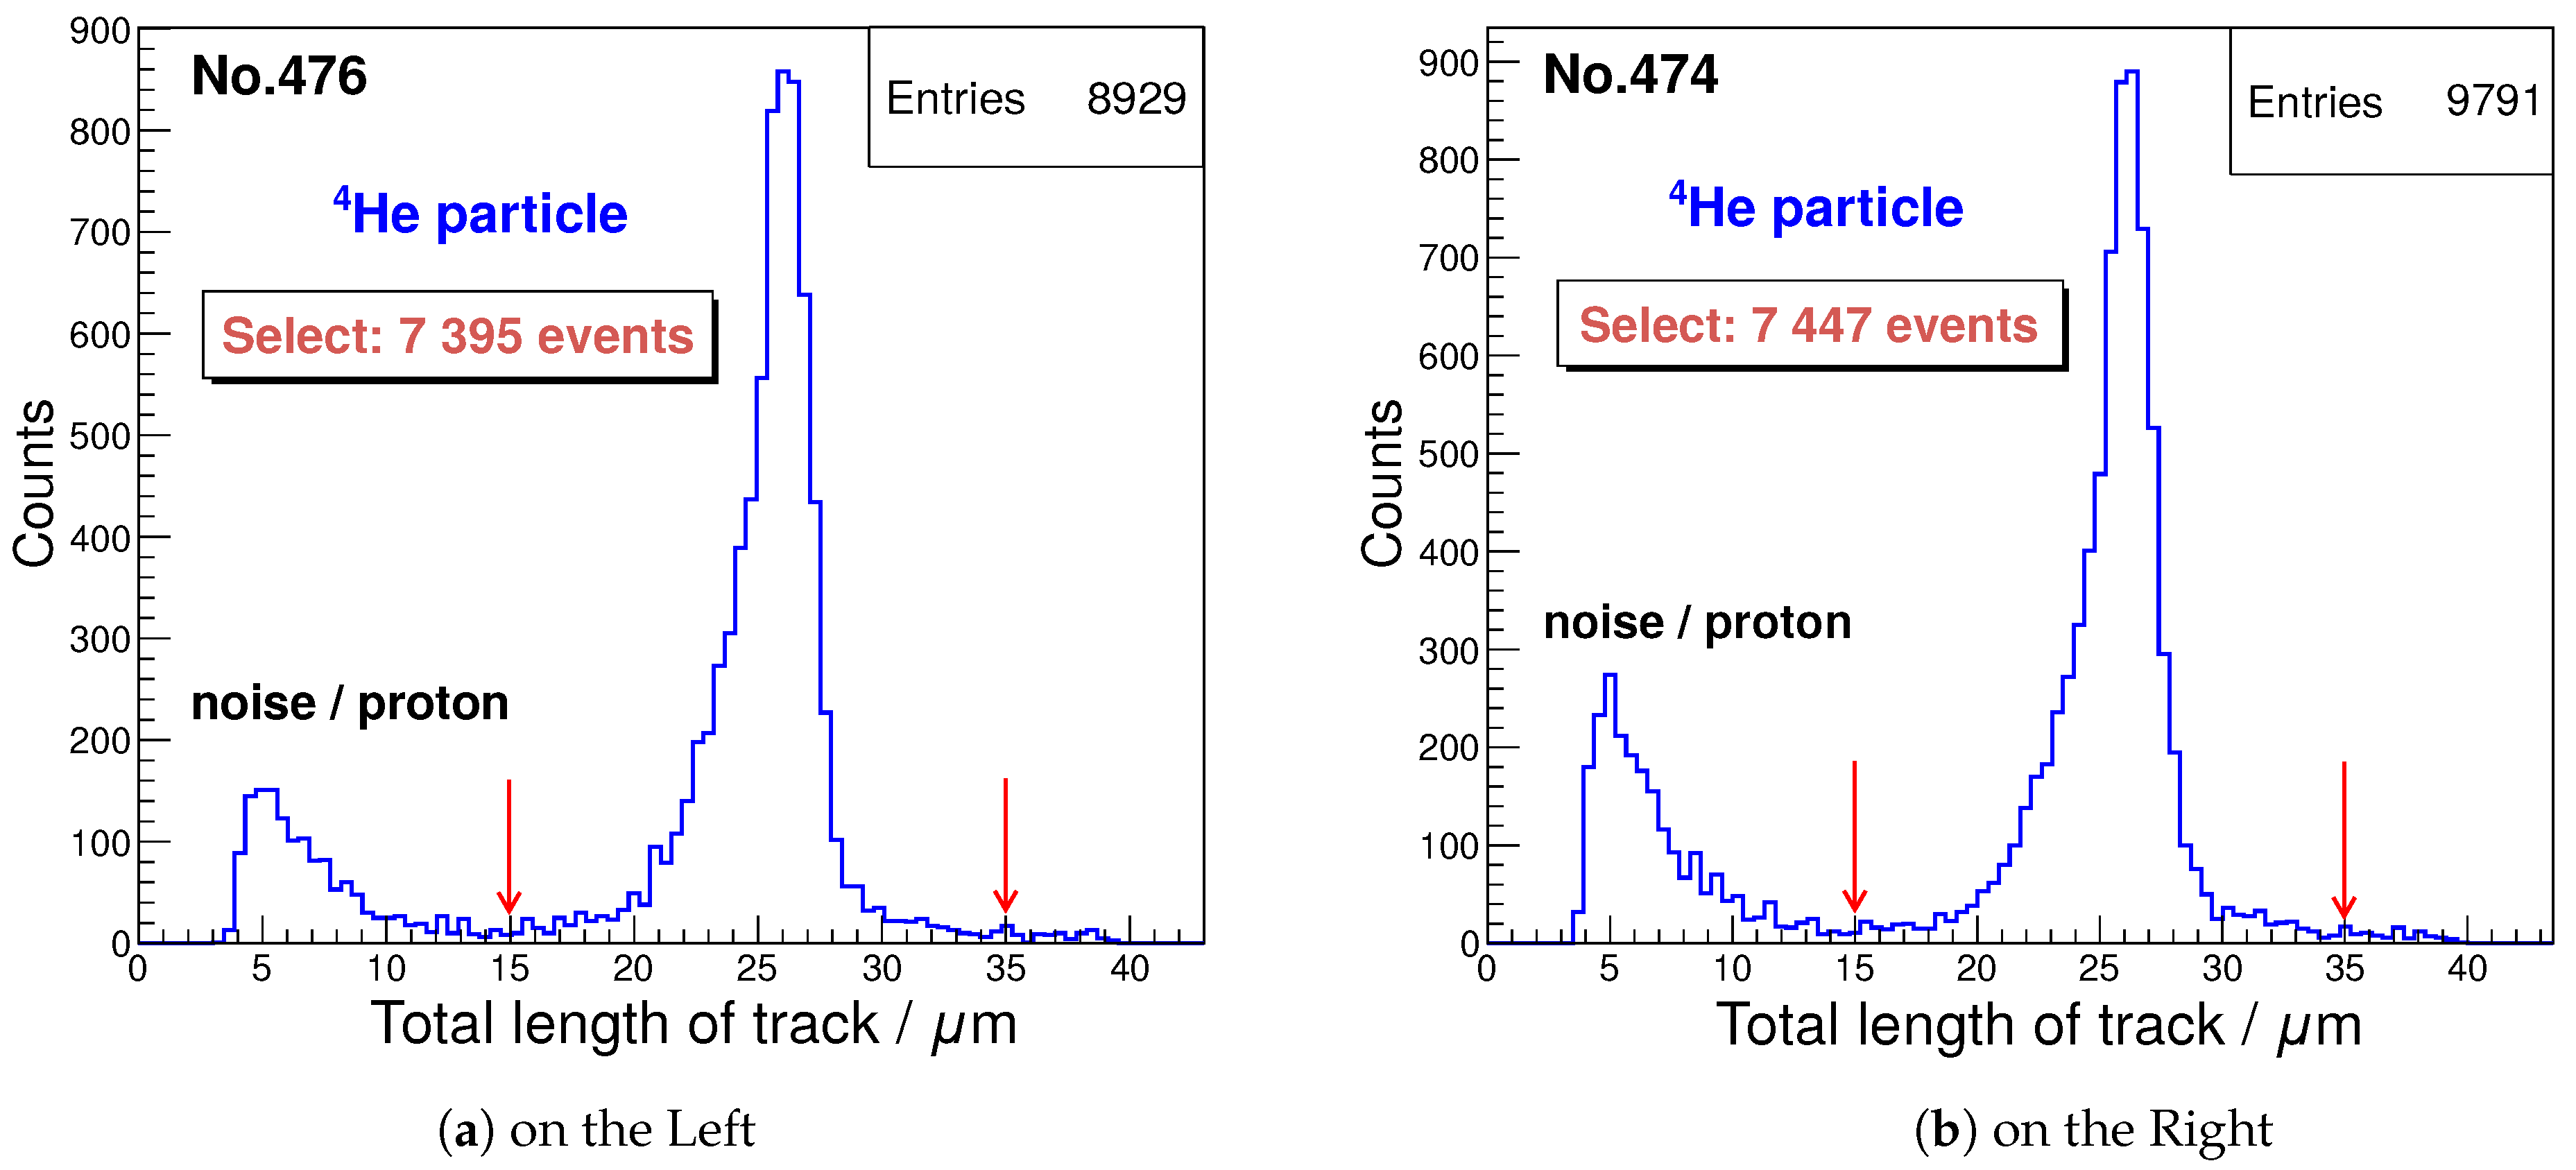
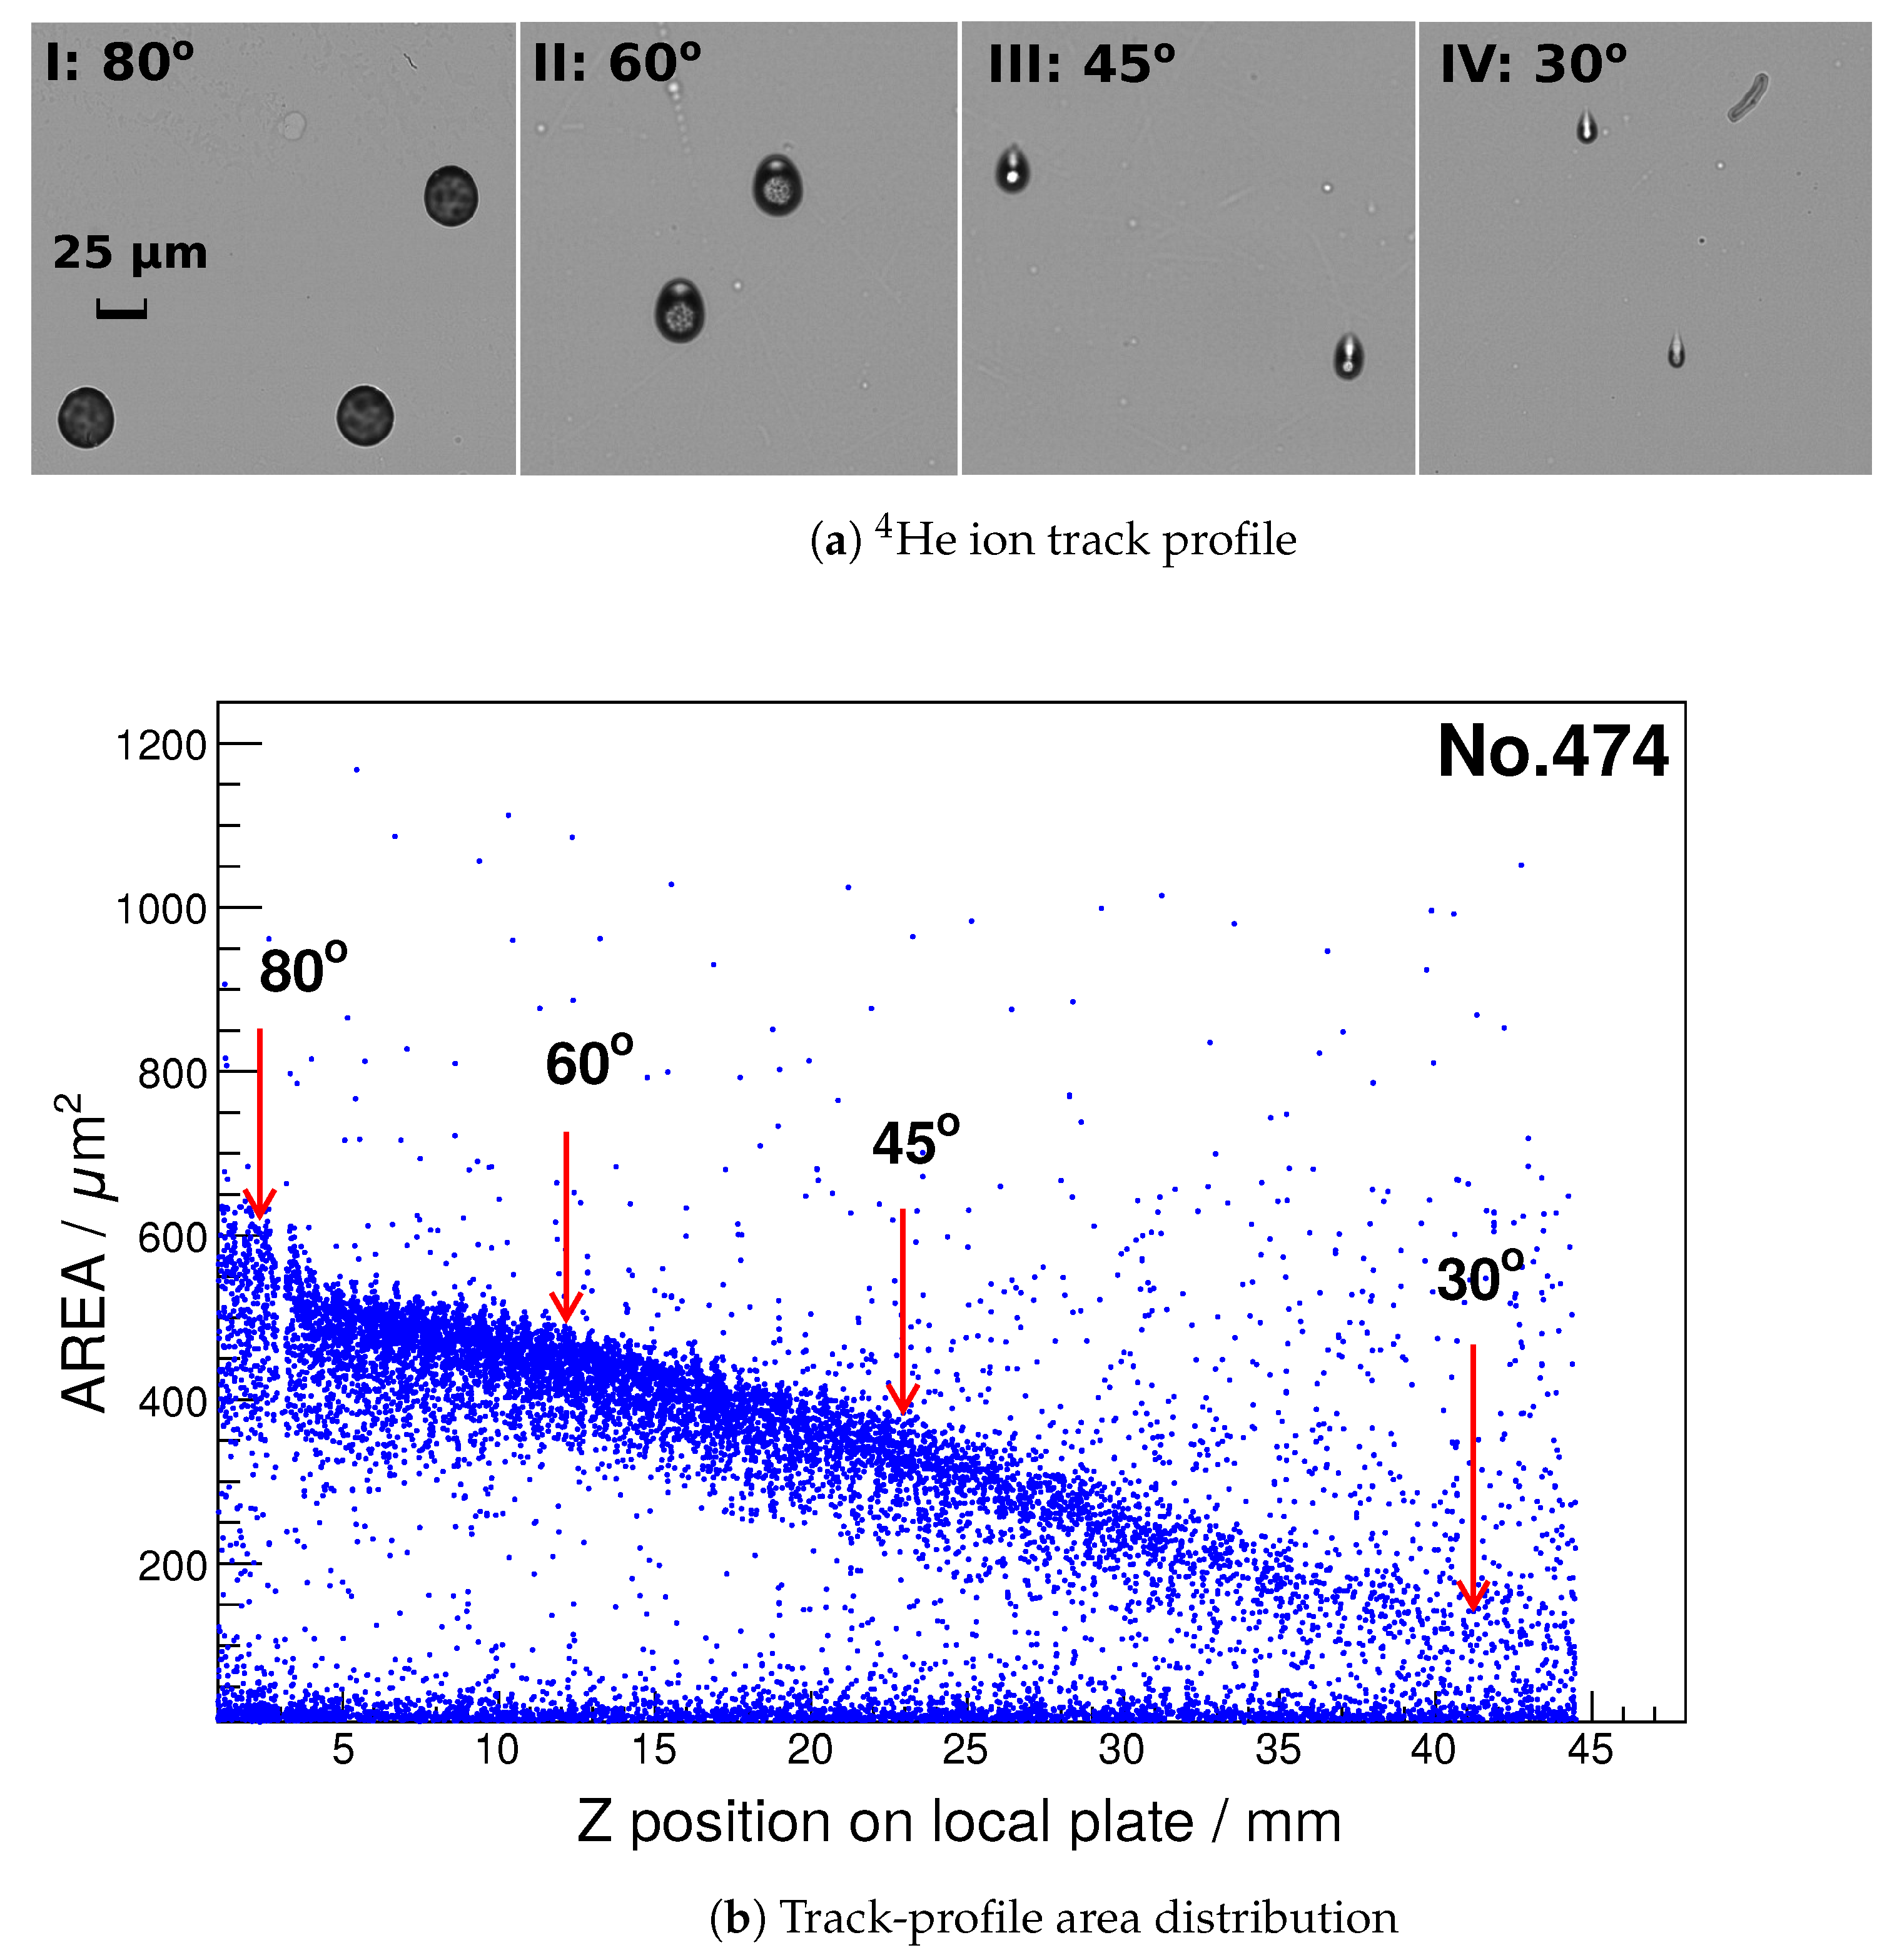
3.2. Track Profiles and Background Suppression

The identification of α particles and the subsequent extraction of left-right asymmetries are based on a track-profile recognition. The shape of a track after etching is described by five parameters: (1) major axis of the opening mouth of the track ( M j ); (2) minor axis of the opening mouth ( M i ); (3) radius of the etched end of the track ( M 2 ); (4) total length of the track including the track end ( X t ); (5) area of the track profile (AREA) [45,46,47]. All five parameters are measured directly by the commercial scanning software TASLIMAGE [48]. During the image processing the concept of s o l i d i t y is used for background suppression [49]. The s o l i d i t y of a shape is generally defined as its area divided by the convex area, which is the convex outline of the shape, commonly represented by a circle or an ellipse. Here we define the s o l i d i t y of a track as the AREA divided by the area of an ellipse with major and minor axes from the track profile X t and M i
s o l i d i t y = AREA convex area = AREA π X t M i / 4
The total track length X t is usually larger than the major axis M j , but sometimes it is equal to M j when there is no track end found. So the AREA is less than or equal to the convex area, giving the s o l i d i t y of a track of less than or equal to 1. In practice, the selection of the tracks with s o l i d i t y larger than 0.77 is appropriate for most of our cases. Tracks with s o l i d i t y smaller than 0.77 are checked with their track profiles, they originate from tracks with very small sizes or with large irregular shapes. The former are mainly induced by energetic protons while “tracks” with large irregular shapes are mostly due to dust or scratches on the surface. Therefore, tracks with s o l i d i t y less than 0.77 are rejected to suppress the background. Further background suppression, denoted as m a r g i n cut, is achieved by restricting the useful area of the CR-39 plate in the data analysis. The scanning window for each plate, defined by the integrated scanning frame, has the size 45.5 mm × 45.5 mm, which is consistent with the exposure area in the polarimeter. The scanned image reveals a border due to the scanning frame, which induces many pseudo tracks in the scanning software. The final dimension of the scanned image for data analysis is 43.5 mm × 43.5 mm, which is shown in Figure 9 by the solid square, together with the acceptance range of α particles emitted from the CD 2 foil-target.

3.3. Left-Right Comparison and Asymmetry Criterion

To extract the left-right (a-)symmetry, the straightforward way is to count α particles in the same acceptance range on each CR-39 plate on the left and right sides of the polarimeter. The background has been much suppressed by the m a r g i n cut and the s o l i d i t y criterion. Since it is found to have little dependence on the polar angle in a large acceptance range, the total length X t is used to identify a peak of α particles in a 1D histogram, see Figure 10. The peak of α particles is clearly separated from noise or proton tracks, i.e., the tracks with very small sizes. A loose cut with the range of X t between 15 μ m and 35 μ m is applied to obtain the counts of α particles.
However, the minor axis M i and the AREA have a common dependence on the polar angle, more precisely the dip angle of the α particles on the plate. Figure 11 shows the dependence of the 4 He ion track profile (a) and the track AREA (b) on the polar angle. The tracks at large polar angles, having large AREAs, are easily separated from the background, but tracks at small polar angles are close to the background region, which makes the identification of α particles more difficult. A range of polar angle between 40 and 75 in the polarimeter is chosen to guarantee high and stable statistics for α particles detection.
The left-right asymmetry criterion is based on the comparison of the counts of α particles on the Left and Right of the polarimeter ( N L and N R ) vs. polar angle in an interval of, e.g., 5 for each data point in the approved range. The directly measured left-right asymmetry, i.e., experimental asymmetry ϵ is defined as [24]
ϵ = N L N R N L + N R
It is assumed that the unpolarized differential cross-section σ 0 ( θ ) and the analyzing power A y ( θ ) in the Lab frame have little variation in each small polar-angle interval. When the polarimeter is properly aligned along the symmetry axis defined by the beam direction, the acceptance solid angle for α particles on the Left ( Δ Ω L ) is equal to the one on the Right ( Δ Ω R ). The detection efficiency of the CR-39 plates for α particles is assumed to be constant (approx. 100%) in the approved polar-angle range, which results in
N L = L · σ 0 ( θ ) · Δ Ω L [ 1 + P · A y ( θ ) ]
N R = L · σ 0 ( θ ) · Δ Ω R [ 1 P · A y ( θ ) ]
L denotes the luminosity, which is the product of the number of beam particles per unit time or per laser shot on the polarimeter and the number of specific target atoms per unit area. A measurement with an unpolarized beam, for which the beam polarization P is zero, delivers a geometric symmetry check of the polarimeter, which is indeed the case within the statistical error for the comparison of Left and Right given in Figure 10. The beam polarization P is the final quantity to be extracted from such a polarization measurement. When the beam polarization P is non-zero, the experimental asymmetry ϵ has the same distribution as the analyzing power vs. polar angle, giving a simple equation
ϵ = P · A y ( θ )
A “spin-flip” technique can be used to confirm that the experimental asymmetry is induced by the beam polarization. In a separate measurement, the beam polarization can be inverted ( P = P ) by reversing the direction of the magnetic field in the polarized 3 He gas-jet target [14].

3.4. Beam Monitor in Forward Direction

The Forward side of the polarimeter can serve as a beam monitor since the CR-39 plates are also sensitive to the 3 He beam particles. Figure 12a shows the result of the particle-identification procedure for the Forward CR-39 plate, revealing the 4 He ions from the d- 3 He fusion reaction, the much more abundant 3 He beam particles and the background. The latter includes recoiling H and D atoms from the foil-target. The α particles are recognized by their larger AREA values, since they attain extra kinetic energy from the nuclear fusion reaction. The integrated forward α flux of about 7000 particles is consistent with the amount of α particles on the Left or Right of the polarimeter.
The 3 He beam particles with a kinetic energy of 1.45 MeV are expected to be stopped in the double-layered foil target. Their calculated range is approximately in the middle of the second layer. However, our CD 2 foils of the second layer probably have small gaps between polymer chains, which enables a tiny fraction of the beam particles to pass through the foil-target at a much smaller energy loss. The total number of 3 He beam particles on the target was estimated from the beam current recorded at the Tandetron, which yields an accumulated charge of 2.71 nC of the 3 He 2 + ions, i.e., 8.5 × 10 9 particles on target. Since 6.75 × 10 4 3 He ions are detected with the Forward counter, the fraction of the beam particles passing through the foil-target is about 8 × 10 6 . Figure 12b presents the 2D distribution of 3 He ions, which can be used to find the center position of the beam profile projected to the Forward side of the polarimeter.

4. Discussion

4.1. Precision of Polarimetry and Statistics Requirement

The precision of the polarimetry is related to the statistical error of the polarization measurement, which is represented by the variance of beam polarization σ 2 ( P ) , deduced by error propagation for Equation (9)
σ 2 ( P ) P 2 σ 2 ( ϵ ) ϵ 2 + σ 2 ( A y ) A y 2
The variance of experimental asymmetry σ 2 ( ϵ ) is determined by the number of α particles on the Left and Right sides of the polarimeter. σ 2 ( A y ) can be deduced from data on the analyzing power found in the literature [27]. Therefore, the two observables ϵ and A y are statistically independent and uncorrelated, which justifies to simply add the two error contributions. As mentioned above, the d- 3 He fusion reaction in the CD 2 foil-target exhibits a resonance when the kinetic energies of 3 He ions are around 0.64 MeV. The polar-angle dependence of the analyzing power A y at this resonance is depicted in Figure 13. The largest absolute value of A y is 3.9% at a polar angle of about 55 with a statistical error σ ( A y ) of 0.9%. The uncertainty of the A y data determines a lower limit for the uncertainty of our beam polarization measurements. The error of the asymmetry measurement should be controlled on the same level as the uncertainty of the analyzing power data. In a measurement of laser-accelerated 3 He ions, the beam polarization P is expected to be above 35%, so the experimental asymmetry is anticipated to be 1.4% ( ϵ = P · A y ). The variance of experimental asymmetry can be deduced from Equation (6) as
σ 2 ( ϵ ) 1 N L + N R
when the number of α particles on the Left and Right sides are about equal. This allows an estimation of the minimum required number of α particles on the Left and Right of the polarimeter, namely
N L + N R A y 2 ϵ 2 · σ 2 ( A y )
The values above yield 5 × 10 4 counts or more on each side. This is 7 times larger than the recorded counts on each side obtained during the Tandetron test. The CR-39 plates still have the capacity for a clear track separation even when the density of α particles is increased ten times, as already proved by the Forward beam monitor.

4.2. Figure of Merit (FOM): Evaluation of Polarimetry

The figure of merit (FOM) is a quantity used to compare the performance of different types of polarimetry, operating in different energy ranges, or even for different beam particles. Here, it is assumed that the uncertainty of the analyzing-power data from literature is very small and can be neglected compared to the uncertainty of the asymmetry measurement. So, the uncertainty of a beam polarization measurement depends largely on the statistics of the experimental asymmetry measurement. The variance of beam polarization can be expressed as
σ 2 ( P ) 1 A y 2 · ( N L + N R )
= 1 2 L · Δ Ω · A y 2 · σ 0 ( θ )
In a relative polarization measurement, the luminosity L and the acceptance angle Δ Ω cancel out, such that the figure of merit is defined as
FOM = A y 2 · σ 0 ( θ )
Table 1 compares the FOM of our 3 He polarimetry based on the d- 3 He fusion reaction with the other type based on 4 He- 3 He elastic scattering [22], which are operated at different beam energies.
Although in our case the FOM is rather low, it is the only polarimetry that can be used for polarized 3 He beams with a beam energy below roughly 1 MeV. It is due to the large Q value of the fusion reaction, giving emitted particles sufficient kinetic energies for their detection and identification. If a higher 3 He beam energy of around 6 MeV can be achieved with a sufficient beam flux by laser–plasma acceleration, the polarimetry based on 4 He- 3 He elastic scattering can also be considered.

4.3. Accuracy Estimates

The accuracy of a beam polarization measurement based on the d- 3 He fusion reaction can be predicted from Equation (13), under the assumption that the analyzing power A y takes the maximum value of 3.9%. The number of counts ( N L + N R ) can be estimated from the flux of He 2 + ions generated in a typical laser–plasma experiment, which is about 1.22 × 10 12 sr 1 per laser shot in the transverse direction relative to the laser-propagation axis (cf. Section 2.1). The polarimeter is assumed to have a distance of 10 cm to the 3 He gas-jet target and and to have a collimator with a diameter of 3 mm in front to define a clean beam spot, which results in an acceptance solid angle of about 10 3 sr. Then, the estimated number of 3 He beam particles on the CD 2 foil-target is about 1.22 × 10 9 per laser shot. At the PHELIX laser facility one can have up to 6 laser shots per day, which corresponds to an accumulated number of 3 He beam particles on the secondary target of about 7.3 × 10 9 , which is comparable with the total number of 3 He particles during the Tandetron test. Therefore, ( N L + N R ) can be estimated from the Tandetron test and is about 1.5 × 10 4 counts. This yields a statistical error of beam polarization measurement σ ( P ) of roughly 21%, and also defines the minimum required 3 He beam polarization P leading to a non-vanishing polarization signal.

5. Conclusions & Outlook

We have developed a compact polarimeter for short-pulsed 3 He ion beams accelerated during laser–plasma interactions. The polarimeter is especially useful for the analysis of 3 He ion beams in the few-MeV range, but also at lower energies down to 0.6 MeV. The accuracy of a beam polarization measurement, i.e., the minimal detectable 3 He beam polarization, is estimated to be 21% for a typical laser–plasma experiment where roughly 10 9 3 He ions enter the polarimeter.
In the framework of polarized fusion research [5] we carry out proof-of-principle studies with laser-accelerated polarized 3 He ion beams. The first steps in this direction have already been made by our group at the PHELIX laser facility, where a polarimeter of the type presented in this paper has been used for beam polarization measurements. Despite the more demanding background conditions, the polarimeter performed as well as in the clean Tandetron environment. Here we refer to an upcoming publication for the experimental results.

Author Contributions

Conceptualization, R.E. and I.E.; methodology, R.S., H.F., H.G., M.L., H.P., J.P., N.S. and H.S.; investigation, C.Z., P.F. and C.K.; resources, S.M.; supervision, C.M.S. and M.B. All authors have read and agreed to the published version of the manuscript.

Funding

This research received no external funding.

Data Availability Statement

Not applicable.

Acknowledgments

This work has been carried out in the framework of the JuSPARC (Jülich Short-Pulse Particle and Radiation Center) project [50] and has been supported by the ATHENA consortium (Accelerator Technology HElmholtz iNfrAstructure) in the ARD programme (Accelerator Research and Development) of the Helmholtz Association of German Research Centres. Special thanks go to Vincent Bagnoud, Bernhard Zielbauer (PHELIX group) for valuable discussions. C.Z. acknowledges support by Natalya Izarova and Sergio Calvo in the chemical laboratory.

Conflicts of Interest

The authors declare no conflict of interest.

References

  1. Assmann, R.W.; Weikum, M.K.; Akhter, T.; Alesini, D.; Alexandrova, A.S.; Anania, M.P.; Andreev, N.E.; Andriyash, I.; Artioli, M.; Aschikhin, A.; et al. EuPRAXIA conceptual design report. Eur. Phys. J. ST 2020, 229, 3675. [Google Scholar] [CrossRef]
  2. Mounet, N. (Ed.) European Strategy for Particle Physics—Accelerator R&D Roadmap; CERN Yellow Reports: Monographs, CERN-2022-001; CERN: Geneva, Switzerland, 2022. [Google Scholar]
  3. Fuchs, M.; Shadwick, B.A.; Vafaei-Najafabadi, N.; Thomas, A.G.R.; Andonian, G.; Büscher, M.; Lehrach, A.; Apsimon, O.; Xia, G.; Filippetto, D.; et al. Snowmass Whitepaper AF6: Plasma-Based Particle Sources. arXiv 2022, arXiv:2203.08379. [Google Scholar]
  4. Anderle, D.P.; Bertone, V.; Cao, X.; Chang, L.; Chang, N.; Chen, G.; Chen, X.; Chen, Z.; Cui, Z.; Dai, L.; et al. Electron-Ion Collider in China. Front. Phys. 2021, 16, 64701. [Google Scholar] [CrossRef]
  5. Ciullo, G.; Engels, R.; Büscher, M.; Vasilyev, A. (Eds.) Nuclear Fusion with Polarized Fuel; Springer Proceedings in Physics; Springer International Publishing: Berlin/Heidelberg, Germany, 2016; Volume 187. [Google Scholar]
  6. Bruhaug, G.; Kish, A. The Benefits of Spin Polarization for Fusion Propulsion. arXiv 2021, arXiv:2108.01211. [Google Scholar]
  7. Büscher, M.; Hützen, A.; Ji, L.; Lehrach, A. Generation of polarized particle beams at relativistic laser intensities. High Power Laser Sci. Eng. 2020, 8, e36. [Google Scholar] [CrossRef]
  8. Jin, L.; Wen, M.; Zhang, X.; Hützen, A.; Thomas, J.; Büscher, M.; Shen, B. Spin-polarized proton beam generation from gas-jet targets by intense laser pulses. Phys. Rev. E 2020, 102, 011201. [Google Scholar] [CrossRef]
  9. Yan, X.; Wu, Y.; Geng, X.; Zhang, H.; Shen, B.; Ji, L. Generation of polarized proton beams with gaseous targets from CO2-laser-driven collisionless shock acceleration. Phys. Plasmas 2022, 29, 053101. [Google Scholar] [CrossRef]
  10. Raab, N.; Büscher, M.; Cerchez, M.; Engels, R.; Engin, L.; Gibbon, P.; Greven, P.; Holler, A.; Karmakar, A.; Lehrach, A.; et al. Polarization measurement of laser-accelerated protons. Phys. Plasmas 2014, 21, 023104. [Google Scholar] [CrossRef] [Green Version]
  11. Engin, I.; Chitgar, Z.M.; Deppert, O.; Di Lucchio, L.; Engels, R.; Fedorets, P.; Frydrych, S.; Gibbon, P.; Kleinschmidt, A.; Lehrach, A.; et al. Laser-induced acceleration of Helium ions from unpolarized gas jets. Plasma Phys. Control. Fusion 2019, 61, 115012. [Google Scholar] [CrossRef]
  12. Gentile, T.R.; Nacher, P.J.; Saam, B.; Walker, T.G. Optically polarized 3He. Rev. Mod. Phys. 2017, 89, 045004. [Google Scholar] [CrossRef] [Green Version]
  13. Batz, M.; Baeßler, S.; Heil, W.; Otten, E.W.; Rudersdorf, D.; Schmiedeskamp, J.; Sobolev, Y.; Wolf, M. 3He Spin Filter for Neutrons. J. Res. Natl. Inst. Stand. Technol. 2005, 110, 293–298. [Google Scholar] [CrossRef] [PubMed]
  14. Fedorets, P.; Zheng, C.; Engels, R.; Engin, I.; Feilbach, H.; Giesen, U.; Glückler, H.; Kannis, C.; Klehr, F.; Lennartz, M.; et al. A High-Density Polarized 3He Gas–Jet Target for Laser–Plasma Applications. Instruments 2022, 6, 18. [Google Scholar] [CrossRef]
  15. Bagnoud, V.; Aurand, B.; Blazevic, A.; Borneis, S.; Bruske, C.; Ecker, B.; Eisenbarth, U.; Fils, J.; Frank, A.; Gaul, E.; et al. Commissioning and early experiments of the PHELIX facility. Appl. Phys. B 2010, 100, 137–150. [Google Scholar] [CrossRef]
  16. Blyth, C.O.; Karban, O.; Powell, W.B.; Roman, S. Scattering of 31.5 MeV polarized 3He by protons. Nucl. Phys. A 1975, 247, 1–6. [Google Scholar] [CrossRef]
  17. Okumus̨oǧlu, N.T.; Blyth, C.O. A study of the 2H(3He, 4He)1H reaction with a polarized 3He beam at 27 and 33 MeV. Nucl. Phys. A 1979, 325, 45–62. [Google Scholar] [CrossRef]
  18. Karban, O.; Blyth, C.O.; Lui, Y.W.; Roman, S. Recoil deuteron polarimeter for a polarized 3He beam. Nucl. Instr. Meth. 1977, 141, 387–389. [Google Scholar] [CrossRef]
  19. McEver, W.S.; Clegg, T.B.; Joyce, J.M.; Ludwig, E.J.; Walter, R.L. An analyzer for the polarization of 3He particles. Phys. Lett. B 1970, 31, 560–562. [Google Scholar] [CrossRef]
  20. Hardy, D.M.; Spiger, R.J.; Baker, S.D.; Chen, Y.S.; Tombrello, T.A. Polarization in 3He + 4He elastic scattering. Phys. Lett. B 1970, 31, 355–357. [Google Scholar] [CrossRef]
  21. Boykin, W.R.; Baker, S.D.; Hardy, D.M. Scattering of 3He and 4He from polarized 3He between 4 and 10 MeV. Nucl. Phys. A 1972, 195, 241–249. [Google Scholar] [CrossRef]
  22. Atoian, G.; Zelenski, A.; Poblaguev, A.A. Precision absolute polarimeter development for the 3He++ ion beam at 5.0-6.0 MeV energy. Proc. Sci. (PoS) 2020, PSTP2019, 45. [Google Scholar]
  23. Bolton, P.R.; Borghesi, M.; Brenner, C.; Carroll, D.C.; De Martinis, C.; Fiorini, F.; Flacco, A.; Floquet, V.; Fuchs, J.; Gallegos, P.; et al. Instrumentation for diagnostics and control of laser-accelerated proton (ion) beams. Phys. Med. 2014, 30, 255–270. [Google Scholar] [CrossRef] [Green Version]
  24. Nurushev, S.B.; Runtso, M.F.; Strikhanov, M.N. Introduction to Polarization Physics, Chapter 8 Beam Polarimetry; Lecture Notes in Physics; Moskovski Inzhenerno-Fisitscheski Institute: Moscow, Russia, 2013; Volume 859. [Google Scholar]
  25. Holler, A. Machbarkeitsstudie einer polarisierten 3He-Ionenquelle mit Hilfe laserinduzierter Teichenbeschleunigung. Ph.D. Thesis, Universität zu Köln, Köln, Germany, 2014. [Google Scholar]
  26. Brun, R.; Rademakers, F. ROOT—An object oriented data analysis framework. Nucl. Instrum. Methods Phys. Res. A 1997, 389, 81–86. [Google Scholar] [CrossRef]
  27. Rohrer, U.; Huber, P.; Leemann, C. Das Analysatorvermögen der 3 He (d,p)4He-Reaktion für Targetpolarisation im Energiegebiet von 300 keV bis 2,5 MeV. Helv. Phys. Acta 1971, 44, 846–865. [Google Scholar]
  28. Watt, B.E.; Leland, W.T. 3He(d, p)4He reaction proton asymmetry using a polarized 3He gas target. Phys. Rev. C 1971, 2, 1680–1681. [Google Scholar] [CrossRef]
  29. Guo, S.; Chen, B.; Durrani, S.A. Chapter 4 Solid-State Nuclear Track Detectors. In Handbook of Radioactivity Analysis; Elsevier Science: Amsterdam, The Netherlands, 2012. [Google Scholar]
  30. Fleischer, R.L.; Price, P.B.; Walker, R.M. Nuclear Tracks in Solids: Principles and Applications; University of California Press: Berkeley, CA, USA, 1975. [Google Scholar]
  31. Gaillard, S.; Fuchs, J.; Renard-Le Galloudec, N.; Cowan, T.E. Study of saturation of CR39 nuclear track detectors at high ion fluence and of associated artifact patterns. Rev. Sci. Instrum. 2007, 78, 013304. [Google Scholar] [CrossRef] [PubMed]
  32. Zhou, D. CR-39 Plastic Nuclear Track Detectors in Physics Research; Nova Science Publishers, Inc.: Hauppauge, NY, USA, 2012. [Google Scholar]
  33. Price, P.B.; Fleischer, R.L. Identification of energetic heavy nuclei with solid dielectric track detectors: Application to astrophysical and planetary studies. Annu. Rev. Nucl. Sci. 1971, 21, 295–334. [Google Scholar] [CrossRef]
  34. Allison, J.; Amako, K.; Apostolakis, J.; Arce, P.; Asai, M.; Aso, T.; Bagli, E.; Bagulya, A.; Banerjee, S.; Barrand, G.J.N.I.; et al. Recent developments in GEANT4. Nucl. Instrum. Methods Phys. Res. A 2016, 835, 186–225. [Google Scholar] [CrossRef]
  35. Mendenhall, M.H.; Weller, R.A. A probability-conserving cross-section biasing mechanism for variance reduction in Monte Carlo particle transport calculations. Nucl. Instrum. Methods Phys. Res. A 2012, 667, 38–43. [Google Scholar] [CrossRef] [Green Version]
  36. SIGMA-ALDRICH. Product Name: Poly(ethylene-d4)—98% Atom D, Product Number: 487007. 2021. Available online: www.sigmaaldrich.com (accessed on 10 August 2022).
  37. Bartle, C.M.; Meyer, H.O. Improved technique for the preparation of thin deuterated-polyethylene targets. Nucl. Instr. Meth. 1973, 112, 615. [Google Scholar] [CrossRef]
  38. Bartle, C.M. Improved technique for the preparation of deuterated-polyethylene targets. Nucl. Instr. Meth. 1977, 144, 599. [Google Scholar] [CrossRef]
  39. Braski, D.N. A study of various parting agents for producing self-supporting thin films. Nucl. Instr. Meth. 1972, 102, 553–566. [Google Scholar] [CrossRef]
  40. Yang, Y.Z.; (Department of Macromolecular Science, Fudan University, Shanghai, China). Private communication, 2020.
  41. Berger, S.; Dworschak, F. Status report of a 1.7 MV Tandem accelerator for solid state research. Nucl. Instrum. Methods Phys. Res. A 1986, 244, 48–49. [Google Scholar] [CrossRef]
  42. Mayer, M.; Möller, S.; Rubel, M.; Widdowson, A.; Charisopoulos, S.; Ahlgren, T.; Alves, E.; Apostolopoulos, G.; Barradas, N.P.; Donnelly, S.; et al. Ion beam analysis of fusion plasma-facing materials and components: Facilities and research challenges. Nucl. Fusion 2020, 60, 025001. [Google Scholar] [CrossRef] [Green Version]
  43. Aachen Ion Beam Technology. Available online: https://aachen-ion-beams.com/END-STATIONS/ (accessed on 10 August 2022).
  44. Brune, C.R.; Geist, W.H.; Karwowski, H.J.; Ludwig, E.J. Measurements of the 3He(d, p)4He reaction at low energies. Triangle Univ. Nuclear Lab. (TUNL) Annu. Rep. 1997, 36, 49. [Google Scholar]
  45. Fews, A.P. Flexible analysis of etched nuclear particle tracks. Nucl. Instrum. Methods Phys. Res. B 1992, 72, 91–103. [Google Scholar] [CrossRef]
  46. Fews, A.P. Fully automated image analysis of etched tracks in CR-39. Nucl. Instrum. Methods Phys. Res. B 1992, 71, 465–478. [Google Scholar] [CrossRef]
  47. Fews, A.P.; Norreys, P.A.; Beg, F.N.; Bell, A.R.; Dangor, A.E.; Danson, C.N.; Lee, P.; Rose, S.J. Plasma ion emission from high intensity picosecond laser pulse interactions with solid targets. Phys. Rev. Lett. 1994, 26, 1801–1804. [Google Scholar] [CrossRef]
  48. Track Analysis Systems Ltd (TASL). Available online: https://www.tasl.co.uk (accessed on 10 August 2022).
  49. Russ, J.C.; Neal, F.B. Chapter 10 Feature Measurements and Chapter 11 Characterizing Shape. In The Image Processing Handbook, 7th ed.; CRC Press: Boca Raton, FL, USA, 2016. [Google Scholar]
  50. Büscher, M.; Adam, R.; Tusche, C.; Hützen, A.; Wiemann, C.; Chen, Y.-J.; Schneider, C.M. JuSPARC—The Jülich Short-Pulsed Particle and Radiation Center. J. Large Scale Res. Fac. 2020, 6, A138. [Google Scholar] [CrossRef]
Figure 1. Coordinate system for the analyzing power in the CM frame. The direction of the 3 He polarization vector is along the Y axis. In the X Z scattering plane, the definition of the left and right sides for protons at a polar angle θ CM is with respect to the deuteron beam. The left and right sides for 4 He particles is from the view of the 3 He beam.
Instruments 06 00061 g001
Figure 2. Analyzing−power contour map. (a) Analyzing power vs. deuteron beam energies and outgoing proton polar angles in the CM frame. (b) Analyzing power vs. 3 He beam energies and outgoing 4 He polar angles in the Lab frame.
Instruments 06 00061 g002
Figure 3. Kinetic energy of the outgoing protons from the d- 3 He fusion reaction vs. 3 He beam energy and proton polar angle in the Lab frame.
Instruments 06 00061 g003
Figure 4. Proton tracks revealed from two neighbouring sides on the CR-39 stack. +Z is the 3 He beam direction. The red dashed lines indicate proton emission perpendicular to the beam direction.
Instruments 06 00061 g004
Figure 5. Geant4 simulation of protons emitted from the d- 3 He fusion reaction into a stack of CR-39 plates. (a) Range distribution of protons stopped in the stack vs. their initial kinetic energies. X = 0 is the center of the polarimeter with the foil-target. (b) Projection of the 2D distribution on the X axis. The vertical axis with an arbitrary unit (a.u.) of proton counts has been scaled from the weight of tracks in which a biasing technique is used to simulate relatively rare events [34,35].
Instruments 06 00061 g005
Figure 6. Kinetic energy of α particles emitted from the d- 3 He fusion reaction vs. 3 He beam energy and outgoing polar angle in the Lab frame. When the 3 He beam energy is above the critical energy, there is an upper limit of 4 He outgoing polar angle at each point of beam energy, giving two separate regions of kinetic energies marked with I and II. The α particles in region II with much lower energies can be stopped inside the foil target.
Instruments 06 00061 g006
Figure 7. CD 2 foil formation. (a) The polymer gel with proper rim keeps its dimension during a drying process. (b) The polymer gel with improper rim can shrink to a much smaller size after drying out.
Instruments 06 00061 g007
Figure 8. Experimental setup at the Tandetron. (a) Schematic diagram of the Tandetron and end stations. (b) The polarimeter is installed at the μ -NRA end station.
Instruments 06 00061 g008
Figure 9. Acceptance for α particles on the left or right side of the polarimeter. The Z axis represents the beam direction, and the CD 2 foil-target is located at Z = 0 . The m a r g i n cut is shown by the solid square while the dashed square indicates the location of the scanning frame (see text). The hit positions for various polar angles are also indicated.
Instruments 06 00061 g009
Figure 10. Comparison of spectra of track profile on the Left and Right of the polarimeter in a range of polar angle between 40 and 75 .
Instruments 06 00061 g010
Figure 11. 4 He ion track profile and track AREA vs. polar angle. (a) The track profile images as seen in the snapshots under the scanning microscope. The tracks marked with polar angle are located on the center line of CR-39 plate ( Y = 0 ) as in Figure 9. (b) The distribution of track area vs. track position along Z axis shows a correlation with polar angle.
Instruments 06 00061 g011
Figure 12. Beam monitor at the Forward position of the polarimeter. (a) Particle identification on the CR-39 plate, showing the separation of 4 He ions, 3 He ions and background. (b) 2D distribution of beam particles, fitted with a 2D quadratic function in vertex form to find the center position of beam-foil interaction.
Instruments 06 00061 g012
Figure 13. Analyzing power of the d- 3 He fusion reaction in the Lab frame at the 0.64-MeV resonance in dependence of the 4 He polar angle. The values of A y are transformed from the CM to the Lab frame using data obtained with a polarized 3 He gas target at a deuteron beam energy of 0.43 MeV [27].
Instruments 06 00061 g013
Table 1. Figures of merit (FOM) for 3 He polarimetry.
Reaction A y ( θ ) σ 0 ( θ ) FOM
(mb/sr)(mb/sr)
d- 3 He fusion reaction
E( 3 He) at 0.64 MeV3.9%600.1
θ Lab at 55
d- 3 He fusion reaction
E( 3 He) at 12 MeV50%51.3
θ Lab at 55
4 He- 3 He elastic scattering
E( 3 He) at 5.4 MeV97%8075
θ Lab at 50
Publisher’s Note: MDPI stays neutral with regard to jurisdictional claims in published maps and institutional affiliations.

