Article

Correction of Geometrical Effects of a Knife-Edge Slit Camera for Prompt Gamma-Based Range Verification in Proton Therapy

1
Ion Beam Applications SA, 1348 Louvain-la-Neuve, Belgium
2
OncoRay—National Center for Radiation Research in Oncology, Faculty of Medicine and University Hospital Carl Gustav Carus, Technische Universität Dresden, Helmholtz-Zentrum Dresden—Rossendorf, 01328 Dresden, Germany
3
Helmholtz-Zentrum Dresden—Rossendorf, Institute of Radiooncology—OncoRay, 01309 Dresden, Germany
4
Department of Radiotherapy and Radiation Oncology, Faculty of Medicine and University Hospital Carl Gustav Carus, Technische Universität Dresden, 01309 Dresden, Germany
5
German Cancer Consortium (DKTK), Partner Site Dresden, and German Cancer Research Center (DKFZ), 69120 Heidelberg, Germany
*
Author to whom correspondence should be addressed.
Current address: Paul Scherrer Institut (PSI), 5232 Villigen, Switzerland
Instruments 2018, 2(4), 25; https://doi.org/10.3390/instruments2040025
Submission received: 26 September 2018 / Revised: 2 November 2018 / Accepted: 6 November 2018 / Published: 10 November 2018
(This article belongs to the Special Issue Diagnostics for Beam and Patient Monitoring)

Abstract

:
Prompt gamma (PG) based range verification can potentially reduce the safety margins in proton therapy. A knife-edge slit camera has been developed in this context using analytical PG simulations as reference for absolute range verification during patient treatment. Geometrical deviations between measurement and simulation could be observed and have to be corrected for in order to improve the range retrieval of the system. A geometrical correction model is derived from Monte Carlo simulations in water. The influence of different parameters is tested and the model is validated in a dedicated benchmark experiment. We found that the geometrical correction improves the agreement between measured and simulated PG profiles resulting in an improved range retrieval and higher accuracy for absolute range verification. An intrinsic offset of 1.4 mm between measurement and simulation is observed in the experimental data and corrected in the PG simulation. In summary, the absolute range verification capabilities of a PG camera have been improved by applying a geometrical correction model.

1. Introduction

The finite range of protons as well as the maximum ionization density close to their stopping point makes proton beam therapy a superior treatment modality for specific tumour locations compared to conventional radiotherapy based on photons. A higher dose can be delivered to the tumour volume while sparing normal tissue and organs at risk. However, range uncertainties, coming from the planning phase (e.g., conversion of CT information to proton stopping power), patient movement and anatomical changes, have to be covered by safety margins of a few mm in clinical practice [1,2]. To reduce those margins and fully exploit the potential of protons, in-vivo range verification is highly desirable. Prompt gamma rays (PGs), which are emitted in nuclear reactions between primary proton beam and tissue, are the ideal probe for range verification as they exhibit a strong correlation with the proton dose and are emitted in real-time [3,4]. The presence of the Bragg peak and the dose fall-off are resembled by a similar fall-off in the production of the PGs, whose shape depends on the nuclear reaction cross sections [5]. The detection of PGs requires specific detection devices due to their high energies between 1–8 MeV [6] and the high background coming from neutron-induced events.
A knife-edge slit camera consisting of a tungsten collimator and a scintillator-based photodetector has been developed in this regard [7,8]. The PG camera measures the spatial emission of the PGs as a 1D distribution along the proton trajectory. This so-called PG profile can be obtained for each individual spot in pencil beam scanning (PBS) mode. The device has been used in several phantom experiments [9,10,11] as well as during patient treatment in double scattering (DS) [12] and PBS mode [13,14]. Alternative PG-based methods for range verification are close to being used for first patient acquisitions like PG spectroscopy (PGS) [5,15]. Other techniques like for example Positron Emission Tomography (PET) are also evaluated for treatment verification. Most notably, an in-beam PET system has been recently used for range and dose verification during patient treatment at CNAO (Pavia, Italy) [16].
For achieving absolute range verification with the slit camera, the measured profile is compared to a reference profile, which can be obtained from simulations. By shifting the profiles against each other and minimizing the deviation between both, for example, deriving the variation in the position of the falling edges that resemble the Bragg peak positions, a relative range shift can be obtained. With the planning information, this relative shift can be attributed to an absolute proton range.
In case of the knife-edge slit camera, the simulation is performed based on an analytical model that has been calibrated and validated using Monte Carlo (MC) simulations. The analytical approach allows for faster computation compared to a full MC simulation, which makes it more practical in clinical usage. The analytical model computes the spectral and spatial PG emission based on the traversed target composition using pre-calculated tables [17]. The detected signal in the camera is calculated by a convolution of the PG emission and a transfer function that takes the geometry and the setup of the camera relative to the beam into account. This transfer function is derived from a fit to a MC simulation and therefore an approximation. The analytical simulation slightly overestimates the PG signal at the edges of the profiles [17], which is mainly a result of the design of the scintillation crystal array. Compton scattered events tend to occur more frequently in the centre of the camera as there is more material in which incoherent scattering occurs compared the edges of the camera. The analytical simulation also does not consider the solid angle effect between each slab and the photon source but assumes a fixed sensitivity despite the geometrical deviations. Furthermore, only photons are considered while also neutrons and neutron-induced photons are measured. The camera has therefore no uniform response to incoming photons. As a result, slight deviations can be observed between measured and simulated PG profiles with implications on the range retrieval and therefore on the extracted range. In order to improve the range retrieval, a correction function is presented in this paper to ensure a better agreement between simulation and experiment. In order to obtain such a correction for geometrical effects, we first have to identify the parameters that have an influence on the geometry and the shape of the profiles. Furthermore, we have to design a method to calculate the correction functions within the required parameter space. In a last step, the so-called geometrical correction has to be validated in a benchmark experiment.

2. Materials and Methods

2.1. PG Camera

The PG camera (see Figure 1) consists of a knife-edge aperture made of tungsten and a photo detection unit comprising lutetium-yttrium oxyorthosilicate (LYSO) scintillation crystals, which are read out by silicon photomultipliers (SiPMs). The LYSO crystals (dimensions 4 × 31.5 × 100 mm3) are aligned in two symmetric rows each consisting of 20 slabs. For later considerations, we will number the symmetric slab pairs (i.e., opposing slabs from both rows) ascending from 1 to 20 in beam direction. Further details on the camera can be found in Reference [7,8].

2.2. Analytical PG Simulation

The analytical simulation model was developed specifically for the knife-edge slit camera [17]. For practical usage, it was implemented in the open-source software Reggui [18] allowing for PG simulation and data analysis. The simulation requires a CT image (of a phantom or a patient) and the treatment plan as input. Furthermore, the position of the camera is defined, as well as other physical properties like beam model and CT to SPR conversion. The data analysis interface in Reggui allows furthermore to compare simulated and measured PG profiles and to retrieve the range shift between the two data sets by shifting both profiles against each other. Further details on the simulation can be found in Reference [15] and on the range retrieval in Reference [9].

2.3. Geometrical Correction

2.3.1. Parameters Influencing the Geometrical Correction

The geometrical correction results from the setup of the camera, for example, the array of LYSO slabs, as well as simplifications in the analytical simulation compared to reality. The slabs can have a different response to direct and indirect photon sources, that is, from gamma rays directly impinging on the crystal or being Compton scattered in another slab or part of the camera prior an interaction inside the crystal. For example, a crystal at the edge of the camera has only one neighbouring slab, which reduces the number of sources of Compton scattered photons. This reduces the number of photons which can potentially be registered in the crystal compared to the case where the crystal has a neighbouring slab on both sides. The possibility to register a prior scattered photon in the crystal depends also on the scattering angle and the incident direction of the primary photon. Furthermore, the analytical simulation does not take the varying solid angle of each slab into account but assumes a single one that is used for all slabs. Additionally, only photons are considered in the simulation while also neutrons and neutron-induced events contribute with about 30–40% to the overall signal of the PG camera [7]. As a result, the response of the camera is a function of:
  • the spatial distribution of the photon and neutron emission
  • the geometry between the photon source and the camera
We can therefore conclude that the geometrical correction should depend on at least four parameters: (1) the beam range, (2) the distance between collimator and beam axis (called B), (3) the distance between camera and collimator (called C) and (4) the offset in beam direction between Bragg peak position and centre of the field-of-view (FoV) of the camera.
The four parameters can vary in a real scenario only within specific limits. The beam range is a function of the energy, where the clinical scenario is mostly covered by an energy window between 100 and 190 MeV. The distance between camera and collimator can be 12, 16 or 20 cm, which is determined by the mechanical structure to move the camera to the patient, that is, the PG trolley. The distance between collimator and beam is as small as possible, usually between 20 to 30 cm. In addition, the offset along the beam axis is usually adjusted by up to 2–3 cm in both directions.

2.3.2. Monte Carlo Simulation to Determine the Geometrical Correction Function

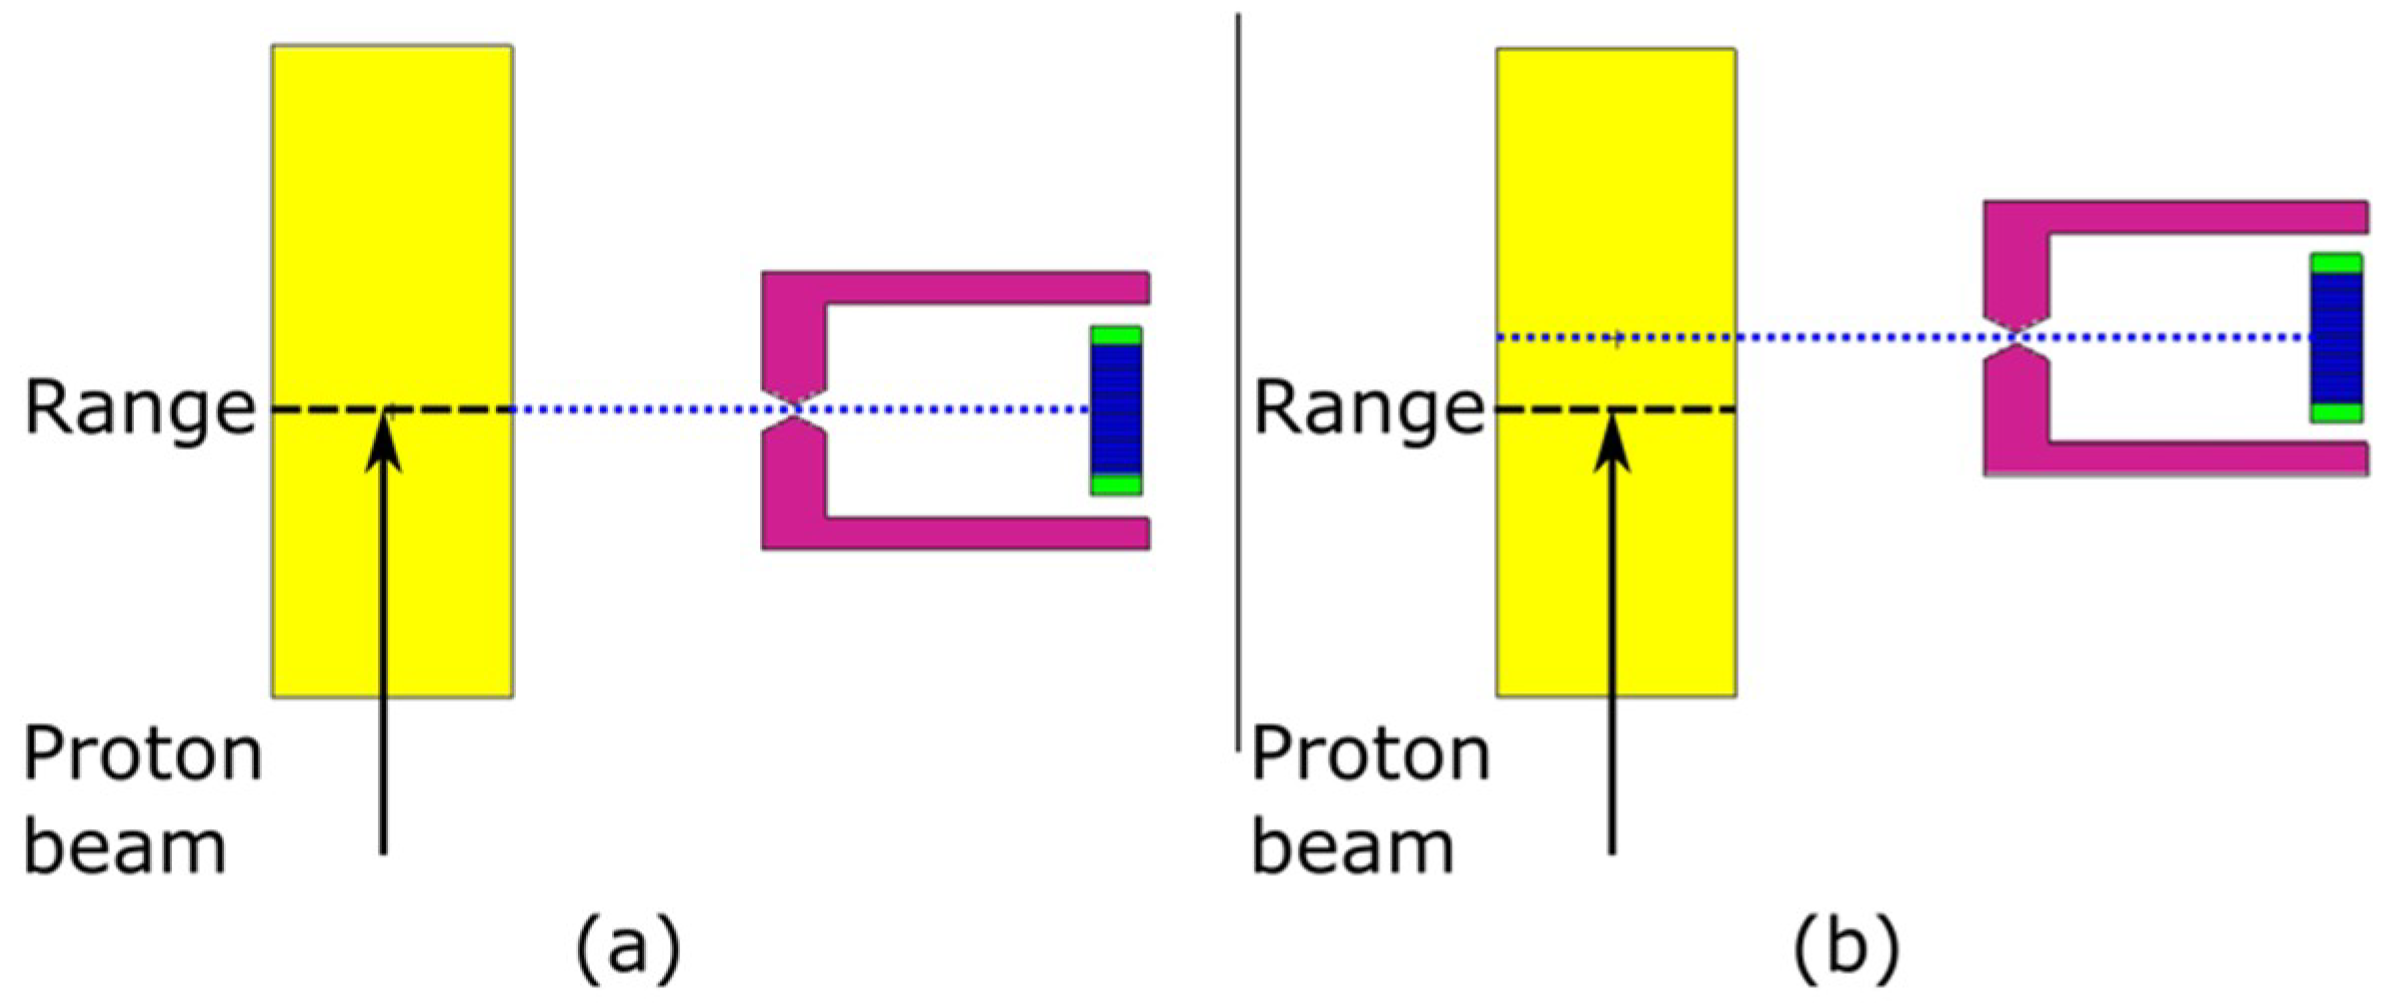
The geometrical correction is calculated for a given setup (i.e., as function of all four parameters) using the Monte Carlo N-Particle transport code eXtended (MCNPX) [19]. Pre-calculated phase space files of mono-energetic proton pencil beams interacting with a cylindrical water phantom (diameter 15 cm, length 40 cm) are used in the simulation study for the neutron and photon emission. The geometry of the PG camera has been modelled in MCNPX (Figure 2) by Smeets et al. [7] with a cylindrical symmetry to speed up the simulations.

2.3.3. Simulation Procedure

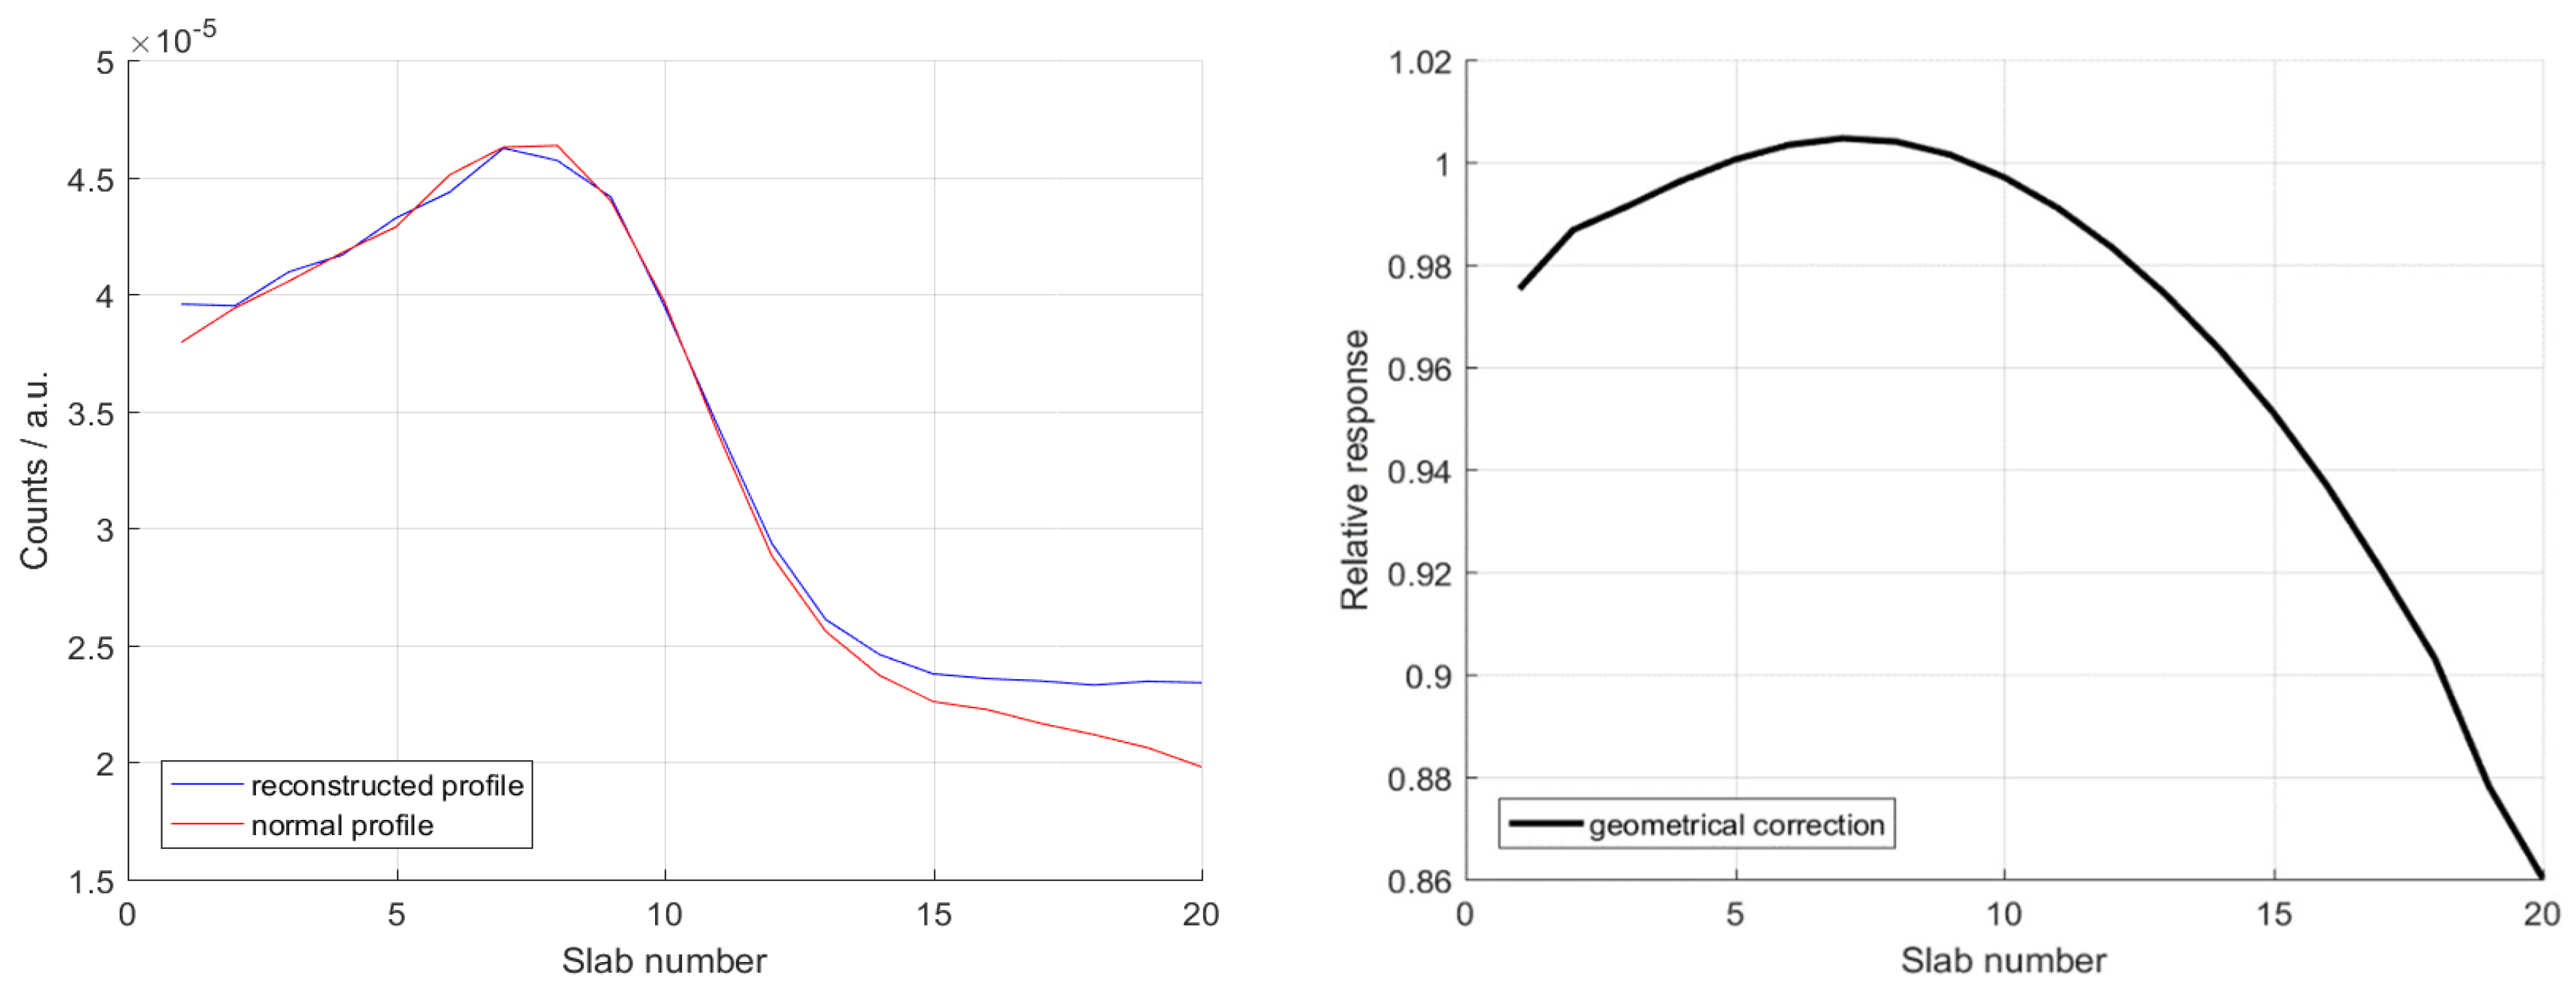
The geometrical correction should improve the agreement between measured PG profile and simulated one by correcting for differences due to simplifications in the analytical transfer functions. Here, the correction is used to adapt the measurement as it allows for an easier range retrieval when shifting both profiles against each other to determine the shift. To obtain the geometrical correction, the actual response of the camera including edge effects has to be compared to the idealized and more homogeneous response that is considered in the transfer function of the analytical model. The two cases are simulated as follows: first, the central imaging plane (slab pair 10/11) is aligned with the Bragg peak (Figure 2-left) creating the normal PG profile (red curve in Figure 3-left for an exemplary case). In the second case the central imaging plane (pair 10/11) is shifted along the beam axis to be in the position of 10 slab pairs (1/2, 3/4, …, 19/20) of the first case, which is exemplarily shown in Figure 2-right for pair 19/20. With this procedure, an artificial prompt gamma profile (blue curve in Figure 3-left) can be reconstructed, which shows for each slab pair the same response as the central pair. We can clearly identify the deviations between both profiles especially for slab numbers 15 to 20. By determining the relative function between normal and reconstructed profile, one obtains the relative response of each slab with respect to the homogeneous response, that is, by definition the geometrical correction (see Figure 3 right).
The four parameters (three for the geometry plus the incident proton energy) are varied for each simulation to obtain a set of geometrical corrections covering all relevant cases. The beam energy is varied from 100 to 190 MeV in 30 MeV steps. The distance between camera and collimator is modelled for three cases: 12, 16 and 20 cm, while the distance between collimator and beam is simulated in five steps: 20, 22, 25, 28 and 30 cm. The situation for the offset along beam axis is more complicated as not all values can be utilized for our described method. Only shifts along beam axis that are equivalent to the width of two slab pairs (8 mm) multiplied by the magnification factor F = B/C (B and C being the distance collimator to beam and detector to collimator, respectively) can be utilized. Five offset cases are simulated: 0, ± 0.8 cm × F, ± 1.6 cm × F. In case of the configuration distance collimator to beam of 25 cm and detector to collimator of 20 cm (25:20 geometry, F = 1.25), this results in the values 0, ± 1 cm, ± 2 cm. In total, we simulate 300 different cases for the geometrical correction by varying the four parameters. Intermediate values are obtained by linear interpolation between the simulated cases. The simulations are performed on a cluster comprising two Intel Xeon E5-2650 CPUs each with 8 cores and 16 threads. The total simulation time on this machine is about 10 weeks.

2.3.4. Validation of Model Using Benchmark Data

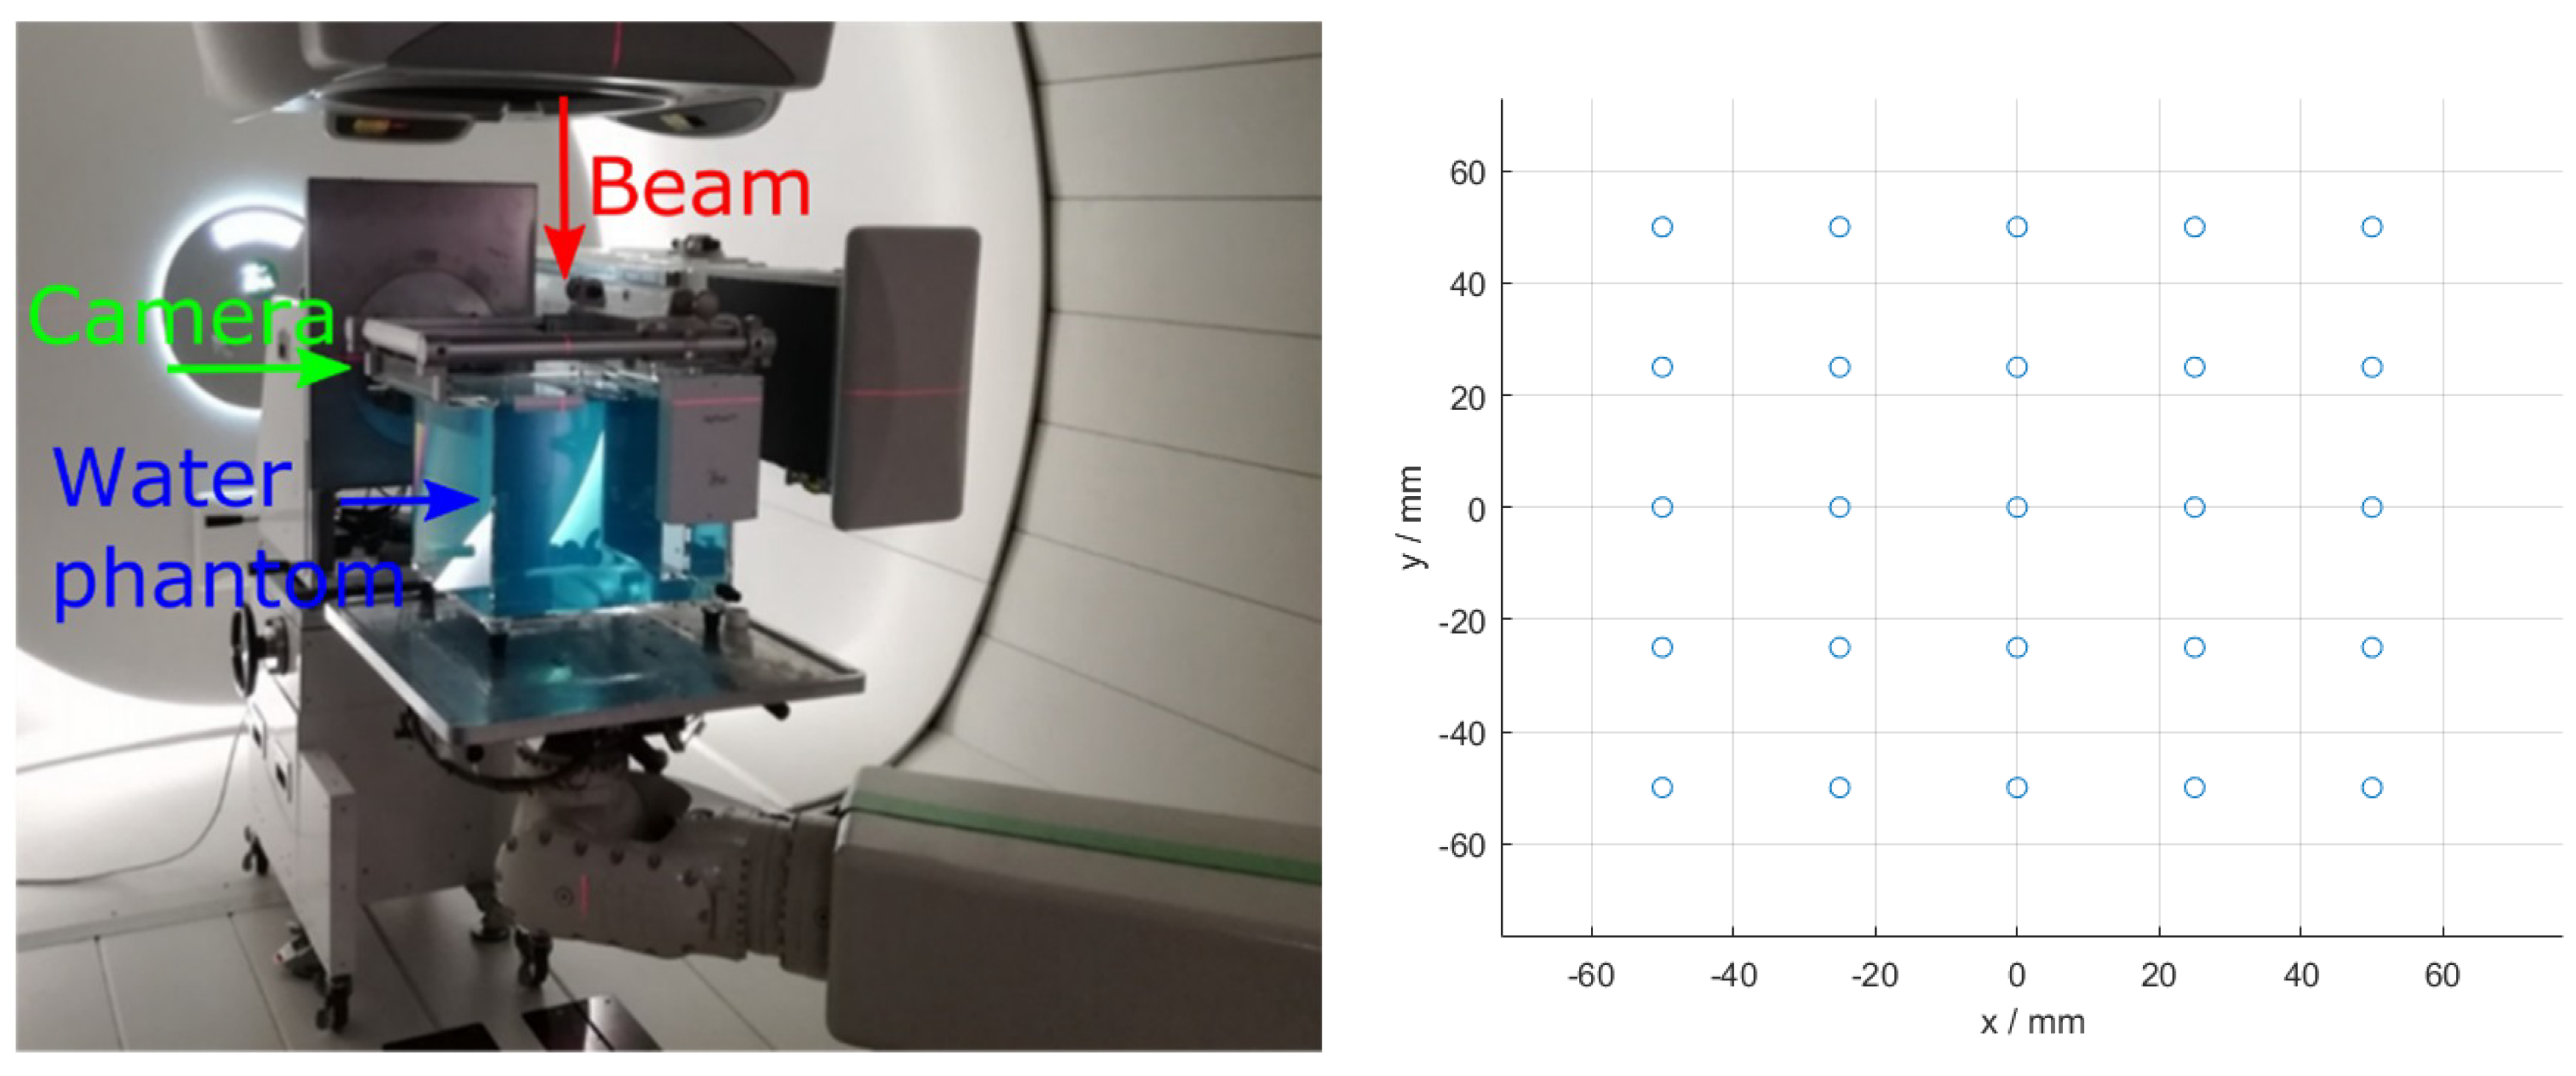
The geometrical correction model has to be validated on measured data. For the validation, the measurement and setup uncertainties have to be as small as possible. Therefore, a dedicated benchmark experiment is designed and conducted at University Proton Therapy Centre in Dresden (Germany). The proton therapy centre comprises a Cyclone C230 cyclotron from Ion Beam Applications (IBA) and is equipped with PBS. The proton beam is delivered on a water phantom (Digiphant from IBA dosimetry, see Figure 4 left) from the top to not cross any other material than water. The camera and the water phantom are positioned using the laser system of the treatment room. The position of the water phantom is verified using fiducial markers and the X-ray system resulting in a positioning uncertainty of about 0.2 mm.
Beam energies from 100 to 190 MeV are delivered in the experiment. The PG camera is positioned from measurement to measurement along another depth (in 10 MeV steps for the 25:20 geometry and 30 MeV steps for 25:12). For each camera position aligned to a specific proton energy and range, the plans are adapted so that also beams with other primary energy within a 25 MeV window could be monitored. For example, when positioning the camera at a range corresponding to 140 MeV, the PBS plan consisted of energies from 115–165 MeV in 5 MeV steps (in case of a 25:20 geometry to the central beam axis). Each layer consists of 13 spots which are arranged in a square shape (see Figure 4-right). Spots are placed in a distance of 2.5 and 5 cm in x and y direction around the central spot in the isocentre (0,0). To reduce the statistical uncertainties, each spot is delivered with 120 monitor units, comprising about 100 times more protons than in a clinical spot. The spot map and the delivery of different layers (with different Bragg peak positions) allows to test different simulation parameters like offset to the Bragg peak position as well as distance between collimator and beam. For the nominal geometry 25:20, the full range of beam energies is delivered. In case of 25:12, only the measurements for the positions at depths corresponding to 160 and 190 MeV are conducted. The geometries cover most of the simulated and practically used cases. An overview of measurement scenarios can be found in Table 1.
For the validation of the geometrical correction using the analytical PG simulation in Reggui, three parameters are important: (1) the shape of the measured profile in comparison to the simulated one, (2) a low deviation from the expected range shift (which should be zero in our case) and (3) a linear response to range shifts. As no range shifts were introduced in our measurement, the analytical PG simulation is utilized to simulate range errors of 1, 2, 3, 5, 7 and 10 mm. In the analysis, we can then determine how accurately those range shifts can be retrieved.
Furthermore, the benchmark experiment allows for the first time to observe and determine a potential intrinsic offset between simulation and measurement. This is mainly given by the positioning accuracy of 0.2 mm and the exact knowledge of the proton stopping power of water.

3. Results

3.1. Parameters Influencing the Geometrical Correction

Four parameters have been identified with potential influence on the geometrical correction function. Different test cases have been simulated in order to determine their impact on the PG profiles and to develop the correction model.

3.1.1. Beam Energy

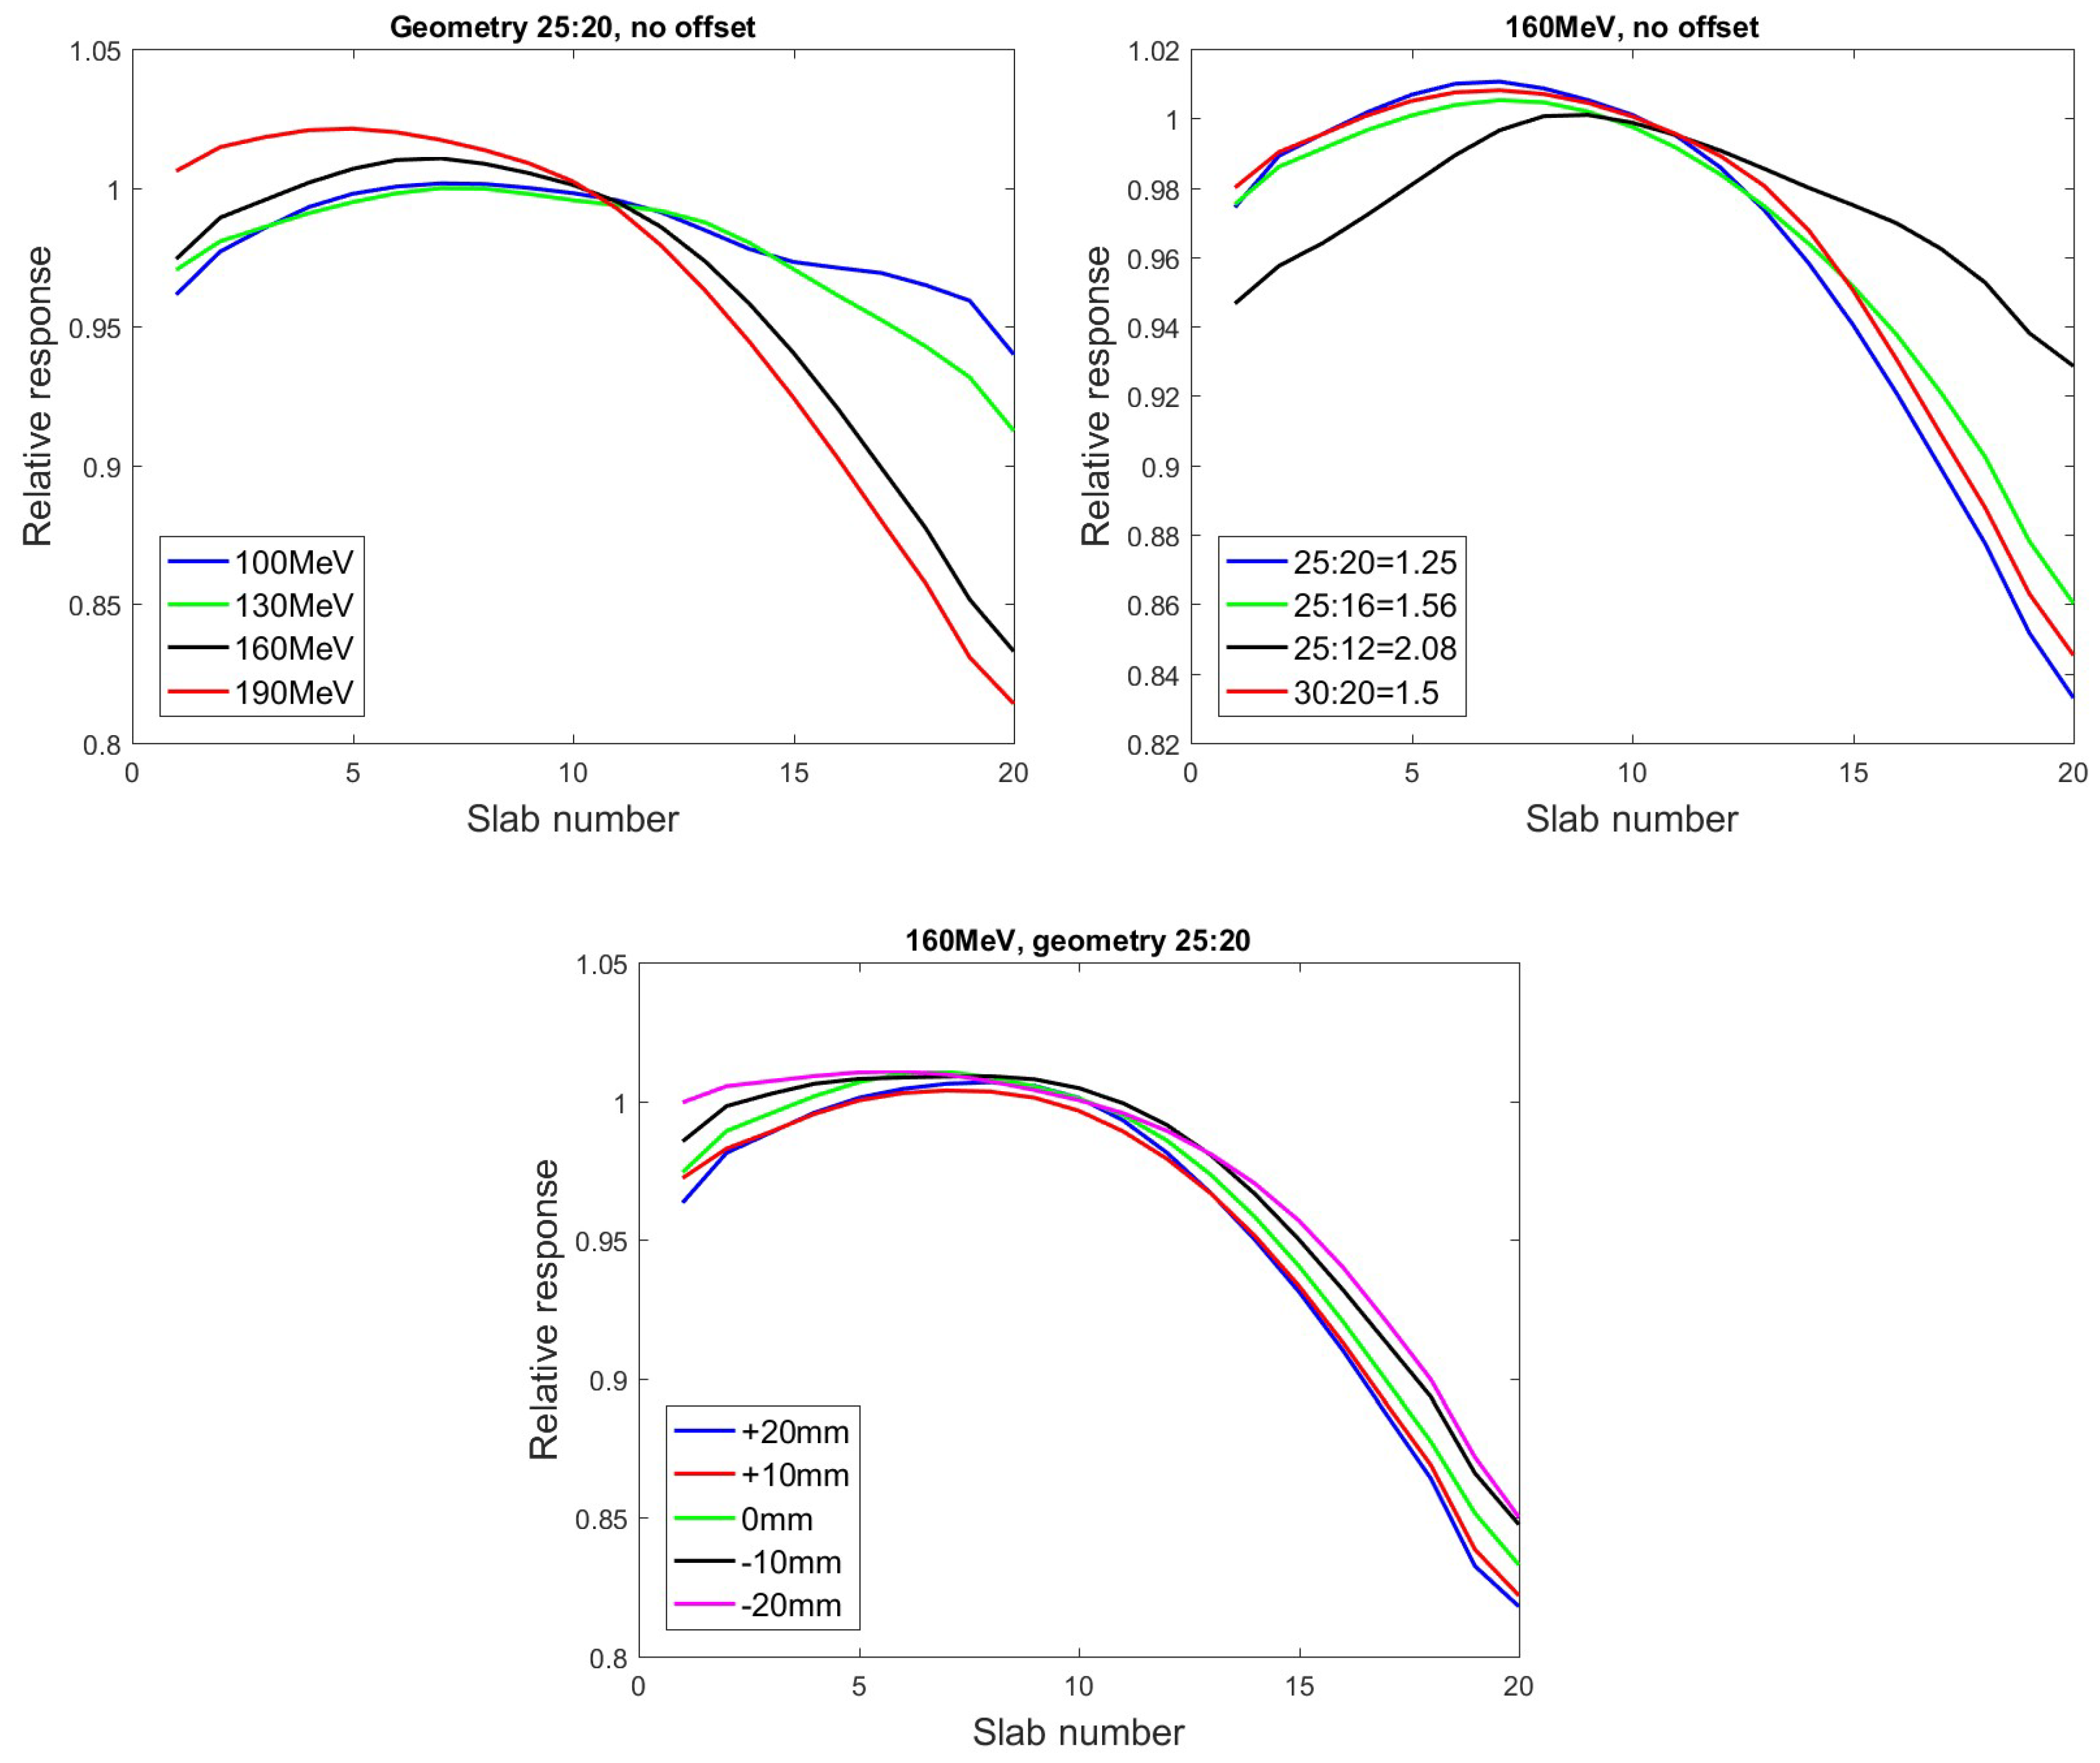
The geometrical correction is shown in Figure 5 top-left for different beam energies for a fixed geometry of 25:20 and no offset. A clear dependency of the correction function can be seen when varying the beam energy. The geometrical correction function is flatter and relatively symmetric for 100 and 130 MeV while we see a strong asymmetric behaviour for 160 and 190 MeV. We can therefore conclude that the beam energy is an important parameter in the simulation study.

3.1.2. Camera Setup

The two parameters distance between collimator to beam axis B and distance between camera to collimator C can be investigated together as camera setup. The geometrical correction is shown in Figure 5 top-right for different camera setups and magnification factors F for a beam energy of 160 MeV and no offset along the beam axis. It is evident that the correction function depends on B and C and that it is even more a function of the magnification factor F. A flattening towards higher F is visible from 25:20 (F = 1.25, blue curve) towards the 25:12 (F = 2.08, black curve) case.

3.1.3. Offset from Isocentre

Figure 5 bottom shows the correction as function of the offset from the isocentre for a beam energy of 160 MeV and a camera setup of 25:20. A variation of about 5% is visible between both extreme cases −20 and +20 mm.

3.2. Benchmark Experiment

Three different parameters are investigated for the validation of the model: the profile shape compared to the simulation, the range deviation compared to the nominal case, and the response to introduced range errors.

3.2.1. Profile Shape

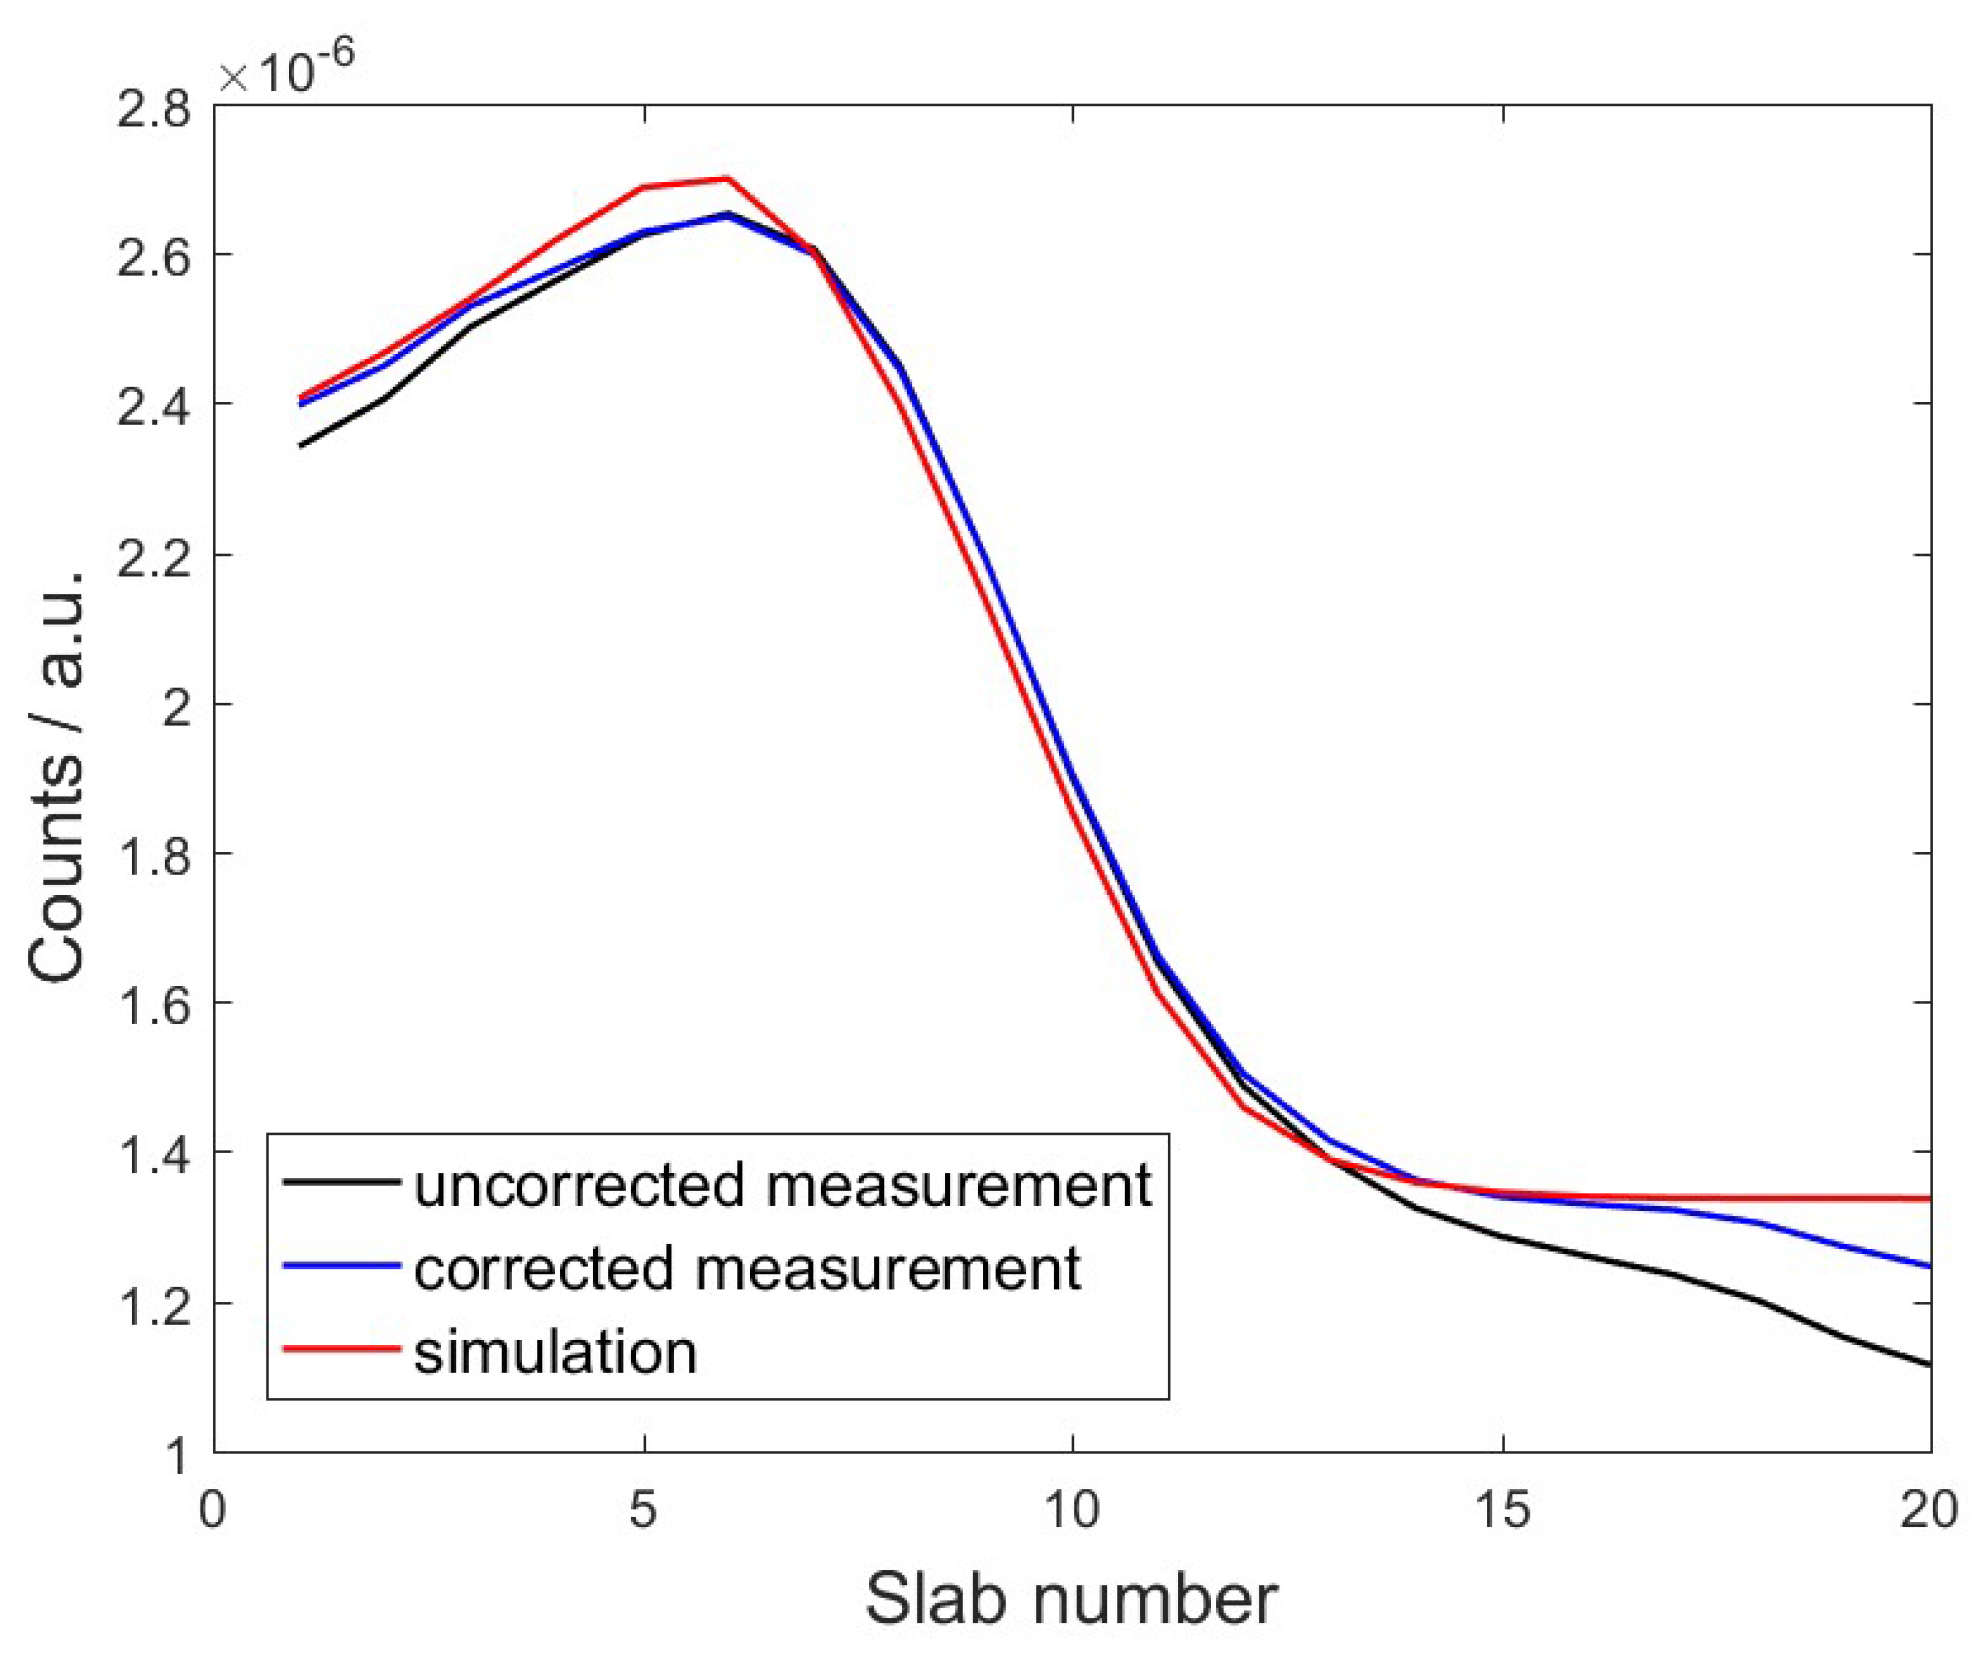
Figure 6 shows the PG profiles with and without geometrical correction for a camera setup of 25:20, 140 MeV beam energy and no offset. As expected, the variation between both profiles is especially visible at the edges. Even though the correction is not perfect (i.e., no flat tale of the profile), a strong improvement towards the ideal case (i.e., the analytical simulation) is visible. One should also note that the position of the fall-off is not changed between the measured profiles but that there is a small shift compared to the simulation. Additionally, the used correction function is a linear interpolation between the simulated cases with 130 and 160 MeV exemplarily showing that the interpolation seems sufficient.

3.2.2. Range Retrieval

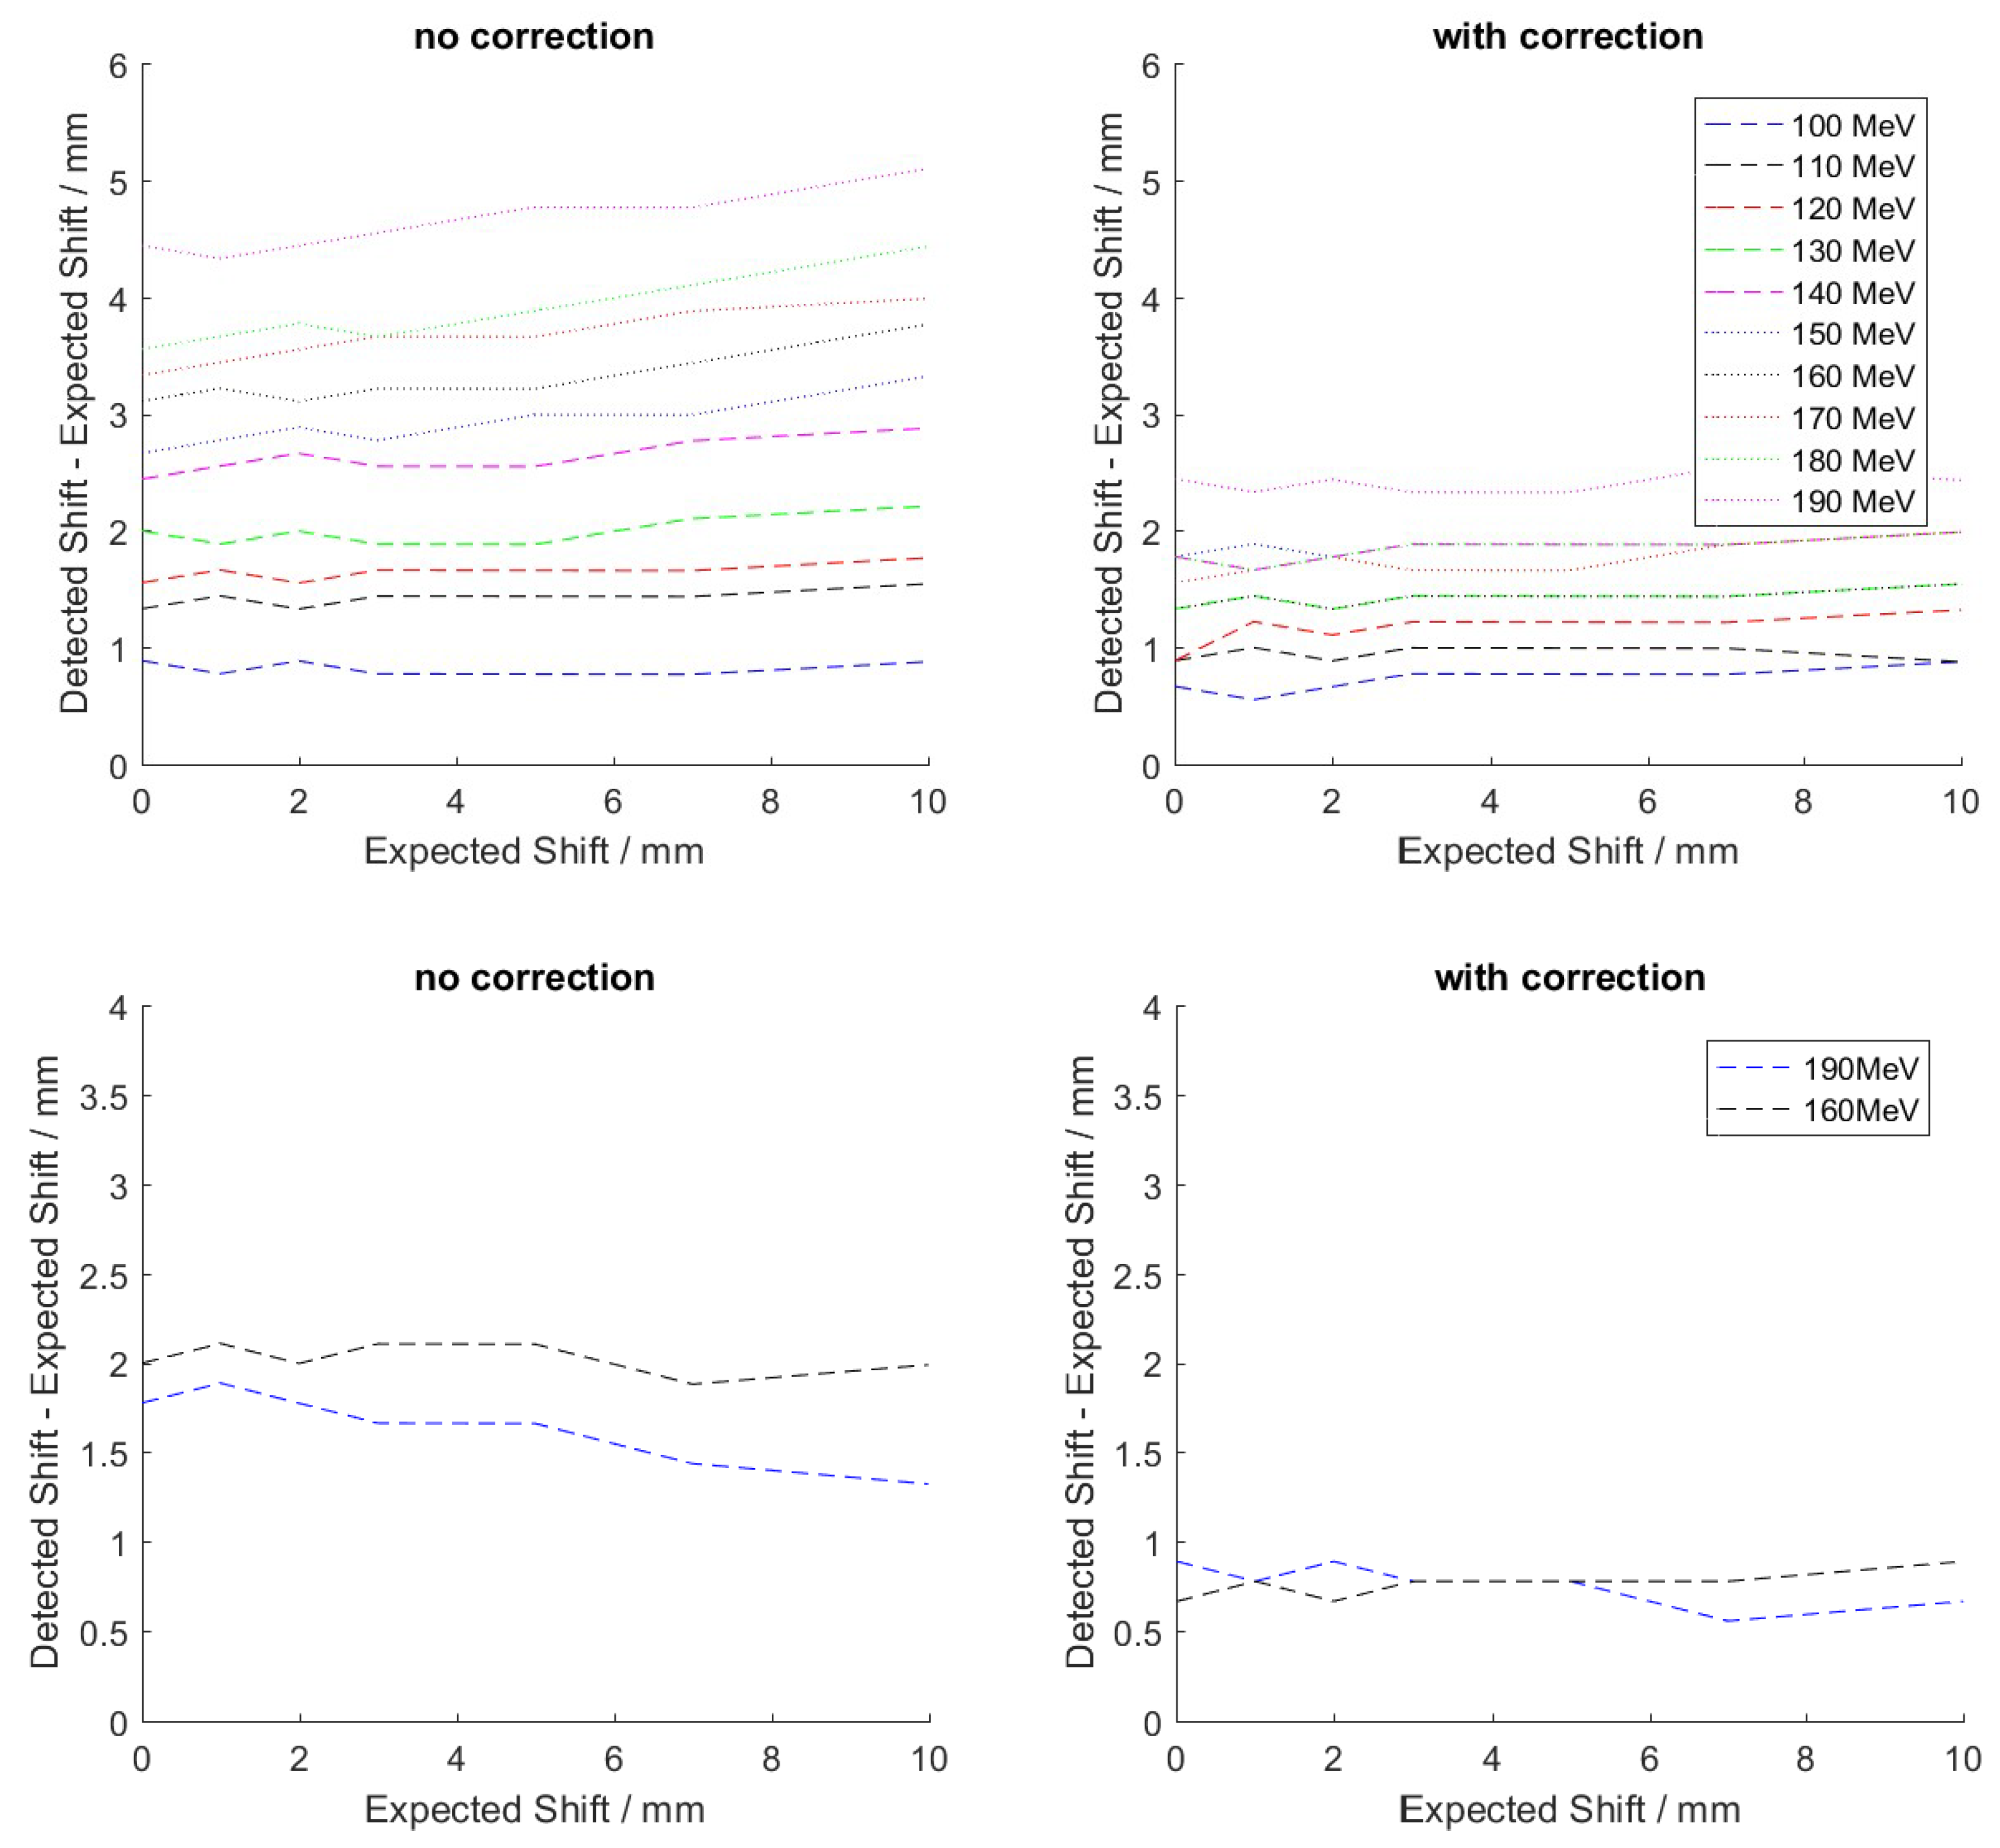
The shift between measured and simulated profiles is determined using Reggui. To analyse if the range retrieval improves when applying the geometrical correction, both cases (with and without correction) are compared. The results for the analysis of the central spots of the aligned layer (i.e., the camera is looking at a specific iso-energy layer) are shown in Figure 7 for different beam energies and camera setups. This resembles the simplest case which helps to better understand potential deviations. The data point with an expected shift of zero resembles the actual measurement, while the other points with higher expected shift are artificially changed in the simulation. In case of perfect agreement, the parameter “detected shift minus expected shift” should be a straight line with a value of zero. For the data analysed without geometrical correction (see Figure 7 left), it is obvious though that the values are different from zero and that a high spread occurs especially for the 25:20 geometry as function of the beam energies. While 100 MeV has about 1 mm shift offset, it is around 4.5–5 mm for 190 MeV. Also, we can see that the response is not flat but increases slightly with the introduced range shift. This is in contrast to the expected flat response. The deviations become smaller for the larger FoV with 25:12. When applying the geometrical correction (see Figure 7 right), the curves are closer to each other as the absolute spread reduces from around 4 to 2 mm. Furthermore, the intrinsic offset is a bit lower and the response for introduced range shifts is flat as expected. For 25:12, we cannot even identify a significant difference between the curves for 160 and 190 MeV meaning an improved robustness compared to the analysis without geometrical correction.
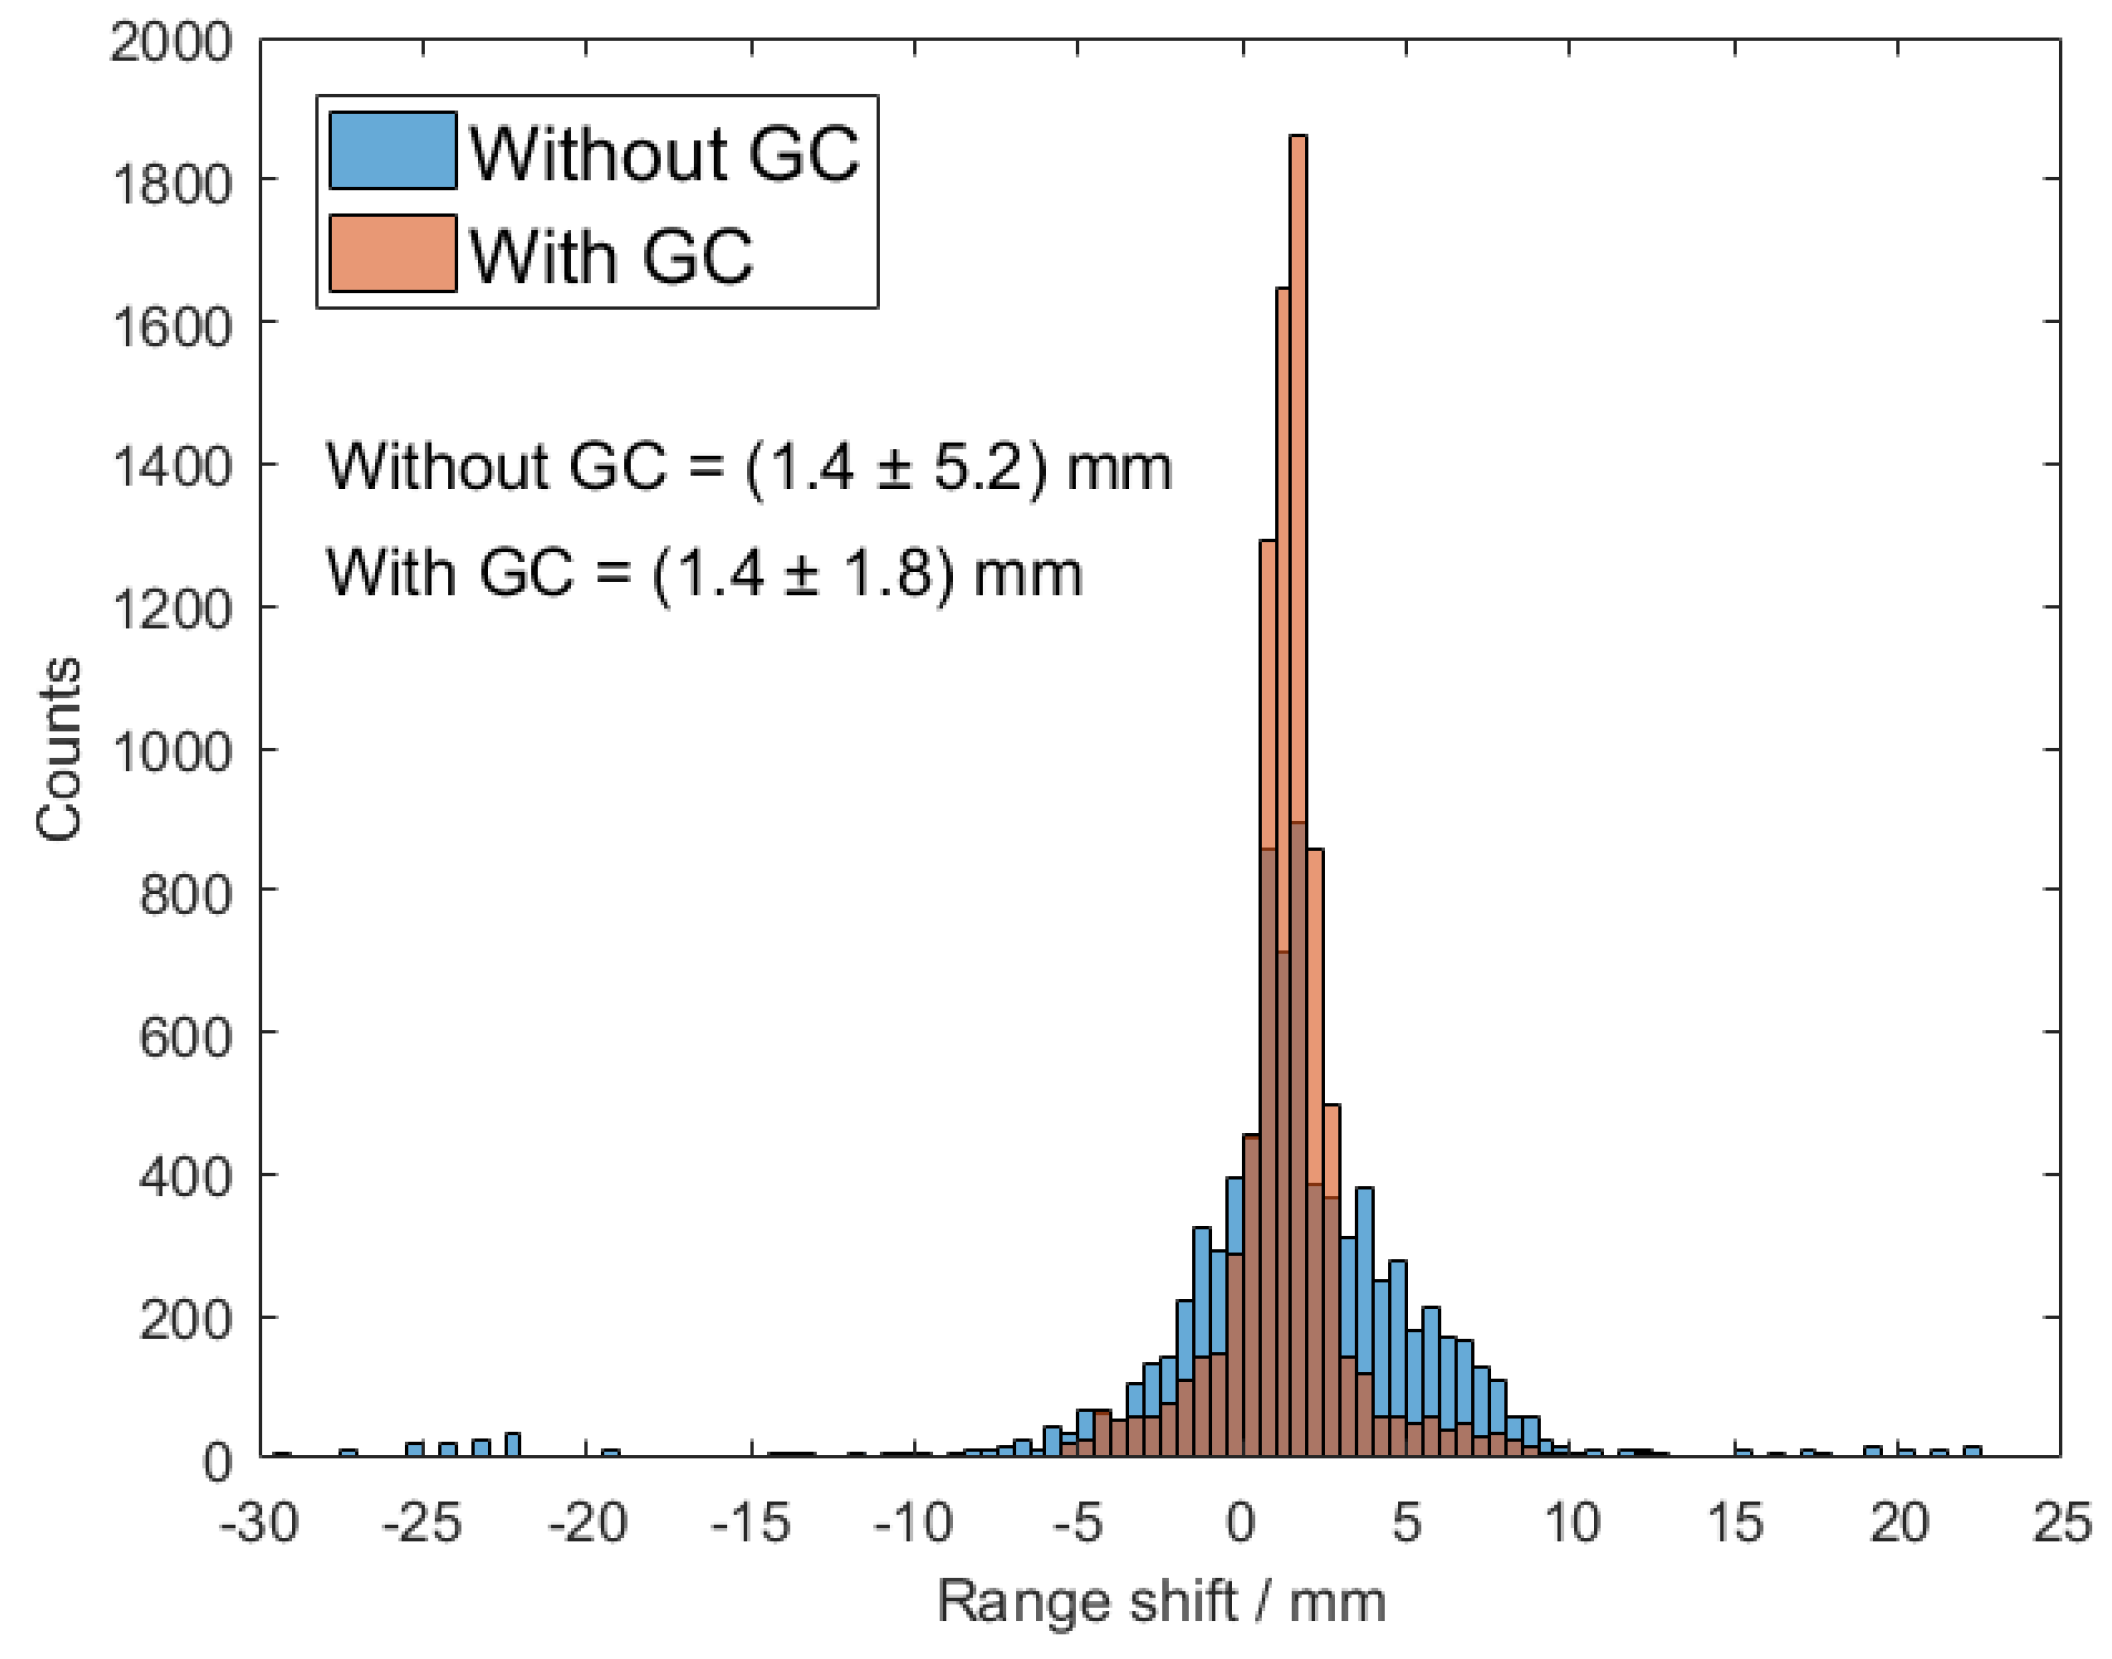
The same analysis method for the shift retrieval has been used more quantitatively for all spots (see Figure 8), including all layers and spots within a measurement. Hereby, we can better investigate the two parameters offset from isocentre and the distance between collimator and beam. The data analysed without the geometrical correction (blue histogram in Figure 8) shows a broader distribution with a sigma of 5.2 mm around its mean value of 1.4 mm. Furthermore, outliers with absolute deviations of more than 20 mm can be identified. In the contrary, the results improve when applying the geometrical correction (orange histogram in Figure 8) visible in the sharper peak and the smaller width of the distribution (1.8 mm for 1 sigma) and outliers with maximum deviation of 10 mm. The mean value of the corrected distribution is still 1.4 mm. After validation and testing, the geometrical model is implemented in Reggui so that it can be applied to measured data.

4. Discussion

4.1. Parameters Influencing the Geometrical Correction

The results of the geometrical correction show a clear indication that all four parameters are relevant and influence the geometrical response of the camera. The beam energy has hereby a strong impact with deviations of nearly 20% at the right edge of the camera for 190 MeV. The variation becomes smaller and the correction function more symmetric for lower energies. This is most probably a result of the neutron interactions, as higher neutron production is expected for higher beam energies. Furthermore, the neutron emission is not isotropic but more in direction of the primary proton beam and therefore affecting mostly the response of the slabs that are further downstream.
The camera setup, namely the distances between camera and collimator and collimator to beam axis, has similar impact as the beam energy. Again, variations of 20% are visible in the correction functions, especially for small magnification factors of 1.25–1.56. In case of a factor above 2, the response is again rather symmetric indicating that the edge effects, like reduced probability of Compton scattering, are mostly dominant in this case.
The shift along the beam axis, that is, the offset of the PG camera with respect to the Bragg peak, has the smallest impact on the profile shape with a maximum of 5% for the investigated region. The offset from the isocentre is visible as shift of the geometrical correction function with respect to the central position, which would agree with the overall shift in geometry. Even though the impact is smaller than the ones introduced by the other three parameters, the offset from isocentre will still be considered in the full model.

4.2. Range Retrieval Analysis Using Benchmark Experiment Data

The analysis of the range shift between analytical PG simulation and the benchmark measurements reveals the improvements due to the geometrical correction. In a qualitative analysis, the shape of the profiles is improved which is especially visible at the edges of the measurements. The right edge becomes flatter and is more similar to the simulation results. This means that the effects introduced by the analytical transfer function for the camera response can be mostly corrected for.
In a more quantitative analysis, the improvement of the profile shape can also be seen in an improvement of the range retrieval between simulation and measurement. When comparing the results without and with applied geometrical correction, a clear improvement in the robustness of the analysis can be identified. For all measurements, a range offset compared to the simulation can be observed as function of beam energy. The value changes from around 1 mm (for 100 MeV) to nearly 5 mm at the highest investigated beam energy (190 MeV). However, this range offset is reduced by a factor of two when applying the geometrical correction to the measured profiles.
When including all spots, that is, not only the central ones within the aligned layer, we have a more realistic result in regard of a patient treatment, which also exhibits extended and multiple layers. When applying the geometrical correction, we can clearly identify an improvement in the range shift distribution in Figure 8. The precision of the range shift determination (sigma of the distribution) reduces from 5.2 to 1.8 mm. This means a more robust range retrieval when using the geometrical correction model on the measured PG data. Also, no influence on the mean of the distribution can be seen as it is 1.4 mm in both cases. With the anticipated positioning uncertainty of 0.2 mm and the knowledge of the stopping power in water, we can conclude that this must be an intrinsic effect within the analytical simulation model. When applying the correction, the total number of outliers (i.e., spots with high range variations) could be reduced significantly as well as their absolute magnitude from more than 20 to about 10 mm. Those spots are usually filtered out in the PG data analysis as they are at the edge of the field of view of the camera resulting in stronger distortions of the profiles. Nevertheless, they were considered in this study to analyse the effect of the geometrical correction also on distorted profiles. Summarizing, using the benchmark data, the analytical simulation can be fine-tuned in Reggui to improve the agreement with the experiment.

5. Conclusions

A model has been proposed and developed to correct for geometrical deviations between an analytical prompt gamma (PG) simulation and experimental data obtained with a knife-edge slit PG camera. By optimizing the agreement between measurement and simulation, the shape of the PG profiles will be improved which results in a more robust range retrieval of the camera.
A four-parameter model for this geometrical correction has been proposed and developed using MCNPX simulations. The model was validated based on measurements in a water phantom obtained in a benchmark experiment revealing an improvement of the profile shape and range retrieval. Therefore, the developed method for correcting the geometrical deviations between fast simulation and measurement improves the overall accuracy of the PG camera. The model has been implemented within Reggui and the method has been already applied on patient data improving the accuracy of the obtained results [14].

Author Contributions

The authors contributed in the following topics: “conceptualization, J.P., J.S.; methodology, J.P., J.S.; software, J.P., G.J., J.S.; validation, J.P., G.J., L.N., C.R., J.S.; formal analysis, J.P.; investigation, J.P., G.J., L.N., C.R., J.S.; resources, C.R., J.S.; data curation, J.P.; writing—original draft preparation, J.P.; writing—review and editing, J.P., L.N., J.S.; visualization, J.P.; supervision, J.S.; project administration, C.R., J.S.; funding acquisition, J.S.”.

Funding

Johannes Petzoldt received funding from the European Union’s Horizon 2020 research and innovation program under the Marie Sklodowska-Curie grant agreement No 675265, OMA—Optimization of Medical Accelerators.

Acknowledgments

The authors would like to thank the IBA team in Dresden for their support and beam operations.

Conflicts of Interest

Johannes Petzoldt, Guillaume Janssens and Julien Smeets are working for Ion Beam Applications. Julien Smeets has a patent on apparatus for particle therapy verification issued. The other authors have no conflict of interest. The funders had no role in the design of the study; in the collection, analyses, or interpretation of data; in the writing of the manuscript, or in the decision to publish the results.

References

  1. Paganetti, H. Range uncertainties in proton therapy and the role of Monte Carlo simulations. Phys. Med. Biol. 2012, 57, R99. [Google Scholar] [CrossRef] [PubMed]
  2. Knopf, A.C.; Lomax, A. In vivo proton range verification: A review. Phys. Med. Biol. 2013, 58, R131. [Google Scholar] [CrossRef] [PubMed]
  3. Jongen, Y.; Stichelbaut, F. Verification of the proton beam position in the patient by the detection of prompt gamma-rays emission. In Proceedings of the 39th PTCOG conference, San Francisco, CA, USA, 26–29 October 2013. [Google Scholar]
  4. Min, C.H.; Kim, C.H.; Youn, M.; Kim, J.-W. Prompt gamma measurements for locating the dose falloff region in the proton therapy. Appl. Phys. Lett. 2006, 89, 3517. [Google Scholar] [CrossRef]
  5. Verburg, J.; Seco, J. Proton range verification through prompt gamma-ray spectroscopy. Phys. Med. Biol. 2014, 59, 7089. [Google Scholar] [CrossRef] [PubMed]
  6. Kelleter, L.; Wrońska, A.; Besuglow, J.; Konefał, A.; Laihem, K.; Leidner, J.; Magiera, A.; Parodi, K.; Rusiecka, K.; Stahl, A.; et al. Spectroscopic study of prompt-gamma emission for range verification in proton therapy. Phys. Med. 2017, 34, 7–17. [Google Scholar] [CrossRef] [PubMed]
  7. Smeets, J.; Roellinghoff, F.; Prieels, D.; Stichelbaut, F.; Benilov, A.; Busca, P.; Fiorini, C.; Peloso, R.; Basilavecchia, M.; Frizzi, T.; et al. Prompt gamma imaging with a slit camera for real-time range control in proton therapy. Phys. Med. Biol. 2012, 57, 3371–3401. [Google Scholar] [CrossRef] [PubMed]
  8. Perali, I.; Celani, A.; Bombelli, L.; Fiorini, C.; Camera, F.; Clementel, E.; Henrotin, S.; Janssens, G.; Prieels, D.; Roellinghoff, F.; et al. Prompt gamma imaging of proton pencil beams at clinical dose rate. Phys. Med. Biol. 2014, 59, 5849–5871. [Google Scholar] [CrossRef] [PubMed]
  9. Priegnitz, M.; Helmbrecht, S.; Janssens, G.; Perali, I.; Smeets, J.; Vander Stappen, F.; Sterpin, E.; Fiedler, F. Measurement of prompt gamma profiles in inhomogeneous targets with a knife-edge slit camera during proton irradiation. Phys. Med. Biol. 2015, 60, 4849–4871. [Google Scholar] [CrossRef] [PubMed]
  10. Nenoff, L.; Priegnitz, M.; Janssens, G.; Petzoldt, J.; Wohlfahrt, P.; Trezza, A.; Smeets, J.; Pausch, G.; Richter, C. Sensitivity of a prompt-gamma slit-camera to detect range shifts for proton treatment verification. Radiother. Oncol. 2017, 125, 534–540. [Google Scholar] [CrossRef] [PubMed]
  11. Priegnitz, M.; Helmbrecht, S.; Janssens, G.; Perali, I.; Smeets, J.; Vander Stappen, F.; Sterpin, E.; Fiedler, F. Detection of mixed-range proton pencil beams with a prompt gamma slit camera. Phys. Med. Biol. 2016, 61, 855–871. [Google Scholar] [CrossRef] [PubMed]
  12. Richter, C.; Pausch, G.; Barczyk, S.; Priegnitz, M.; Keitz, I.; Thiele, J.; Smeets, J.; Stappen, F.V.; Bombelli, L.; Fiorini, C.; et al. First clinical application of a prompt gamma based in vivo proton range verification system. Radiother. Oncol. 2016, 118, 232–237. [Google Scholar] [CrossRef] [PubMed]
  13. Xie, Y.; Bentefour, E.H.; Janssens, G.; Smeets, J.; Vander Stappen, F.; Hotoiu, L.; Yin, L.; Dolney, D.; Avery, S.; O’Grady, F.; et al. Prompt Gamma Imaging for In Vivo Range Verification of Pencil Beam Scanning Proton Therapy. Int. J. Radiat. Oncol. Biol. Phys. 2017, 99, 210–218. [Google Scholar] [CrossRef] [PubMed]
  14. Xie, Y.; Petzoldt, J.; Janssens, G.; O’Grady, F.; Yin, L.; Bentefour, E.H.; Smeets, J.; Prieels, D.; Lustig, R.A.; Lin, A.; et al. Prompt Gamma Imaging Signature of Anatomic Change during Base of Skull Proton Therapy. Radiother. Oncol. Submitted.
  15. Hueso-González, F.; Rabe, M.; Ruggieri, T.A.; Bortfeld, T.; Verburg, J.M. A full-scale clinical prototype for proton range verification using prompt gamma-ray spectroscopy. Phys. Med. Biol. 2018, 63, 5019. [Google Scholar] [CrossRef] [PubMed]
  16. Ferrero, V.; Fiorina, E.; Morrocchi, M.; Pennazio, F.; Baroni, G.; Battistoni, G.; Belcari, N.; Camarlinghi, N.; Ciocca, M.; del Guerra, A.; et al. Online proton therapy monitoring: Clinical test of a Silicon-photodetector-based in-beam PET. Nat. Sci. Rep. 2018, 8, 4100. [Google Scholar] [CrossRef] [PubMed]
  17. Sterpin, E.; Janssens, G.; Smeets, J.; Vander Stappen, F.; Prieels, D.; Priegnitz, M.; Perali, I.; Vynckier, S. Analytical computation of prompt gamma ray emission and detection for proton range verification. Phys. Med. Biol. 2015, 60, 4915–4946. [Google Scholar] [CrossRef] [PubMed]
  18. OpenREGGUI. Available online: www.openreggui.org (accessed on 26 September 2018).
  19. Pelowitz, D.B. (Ed.) MCNPX Users Manual Version 2.7.0; LA-CP-11-00438; Los Alamos National Laboratory: Los Alamos, NM, USA, 2011. [Google Scholar]
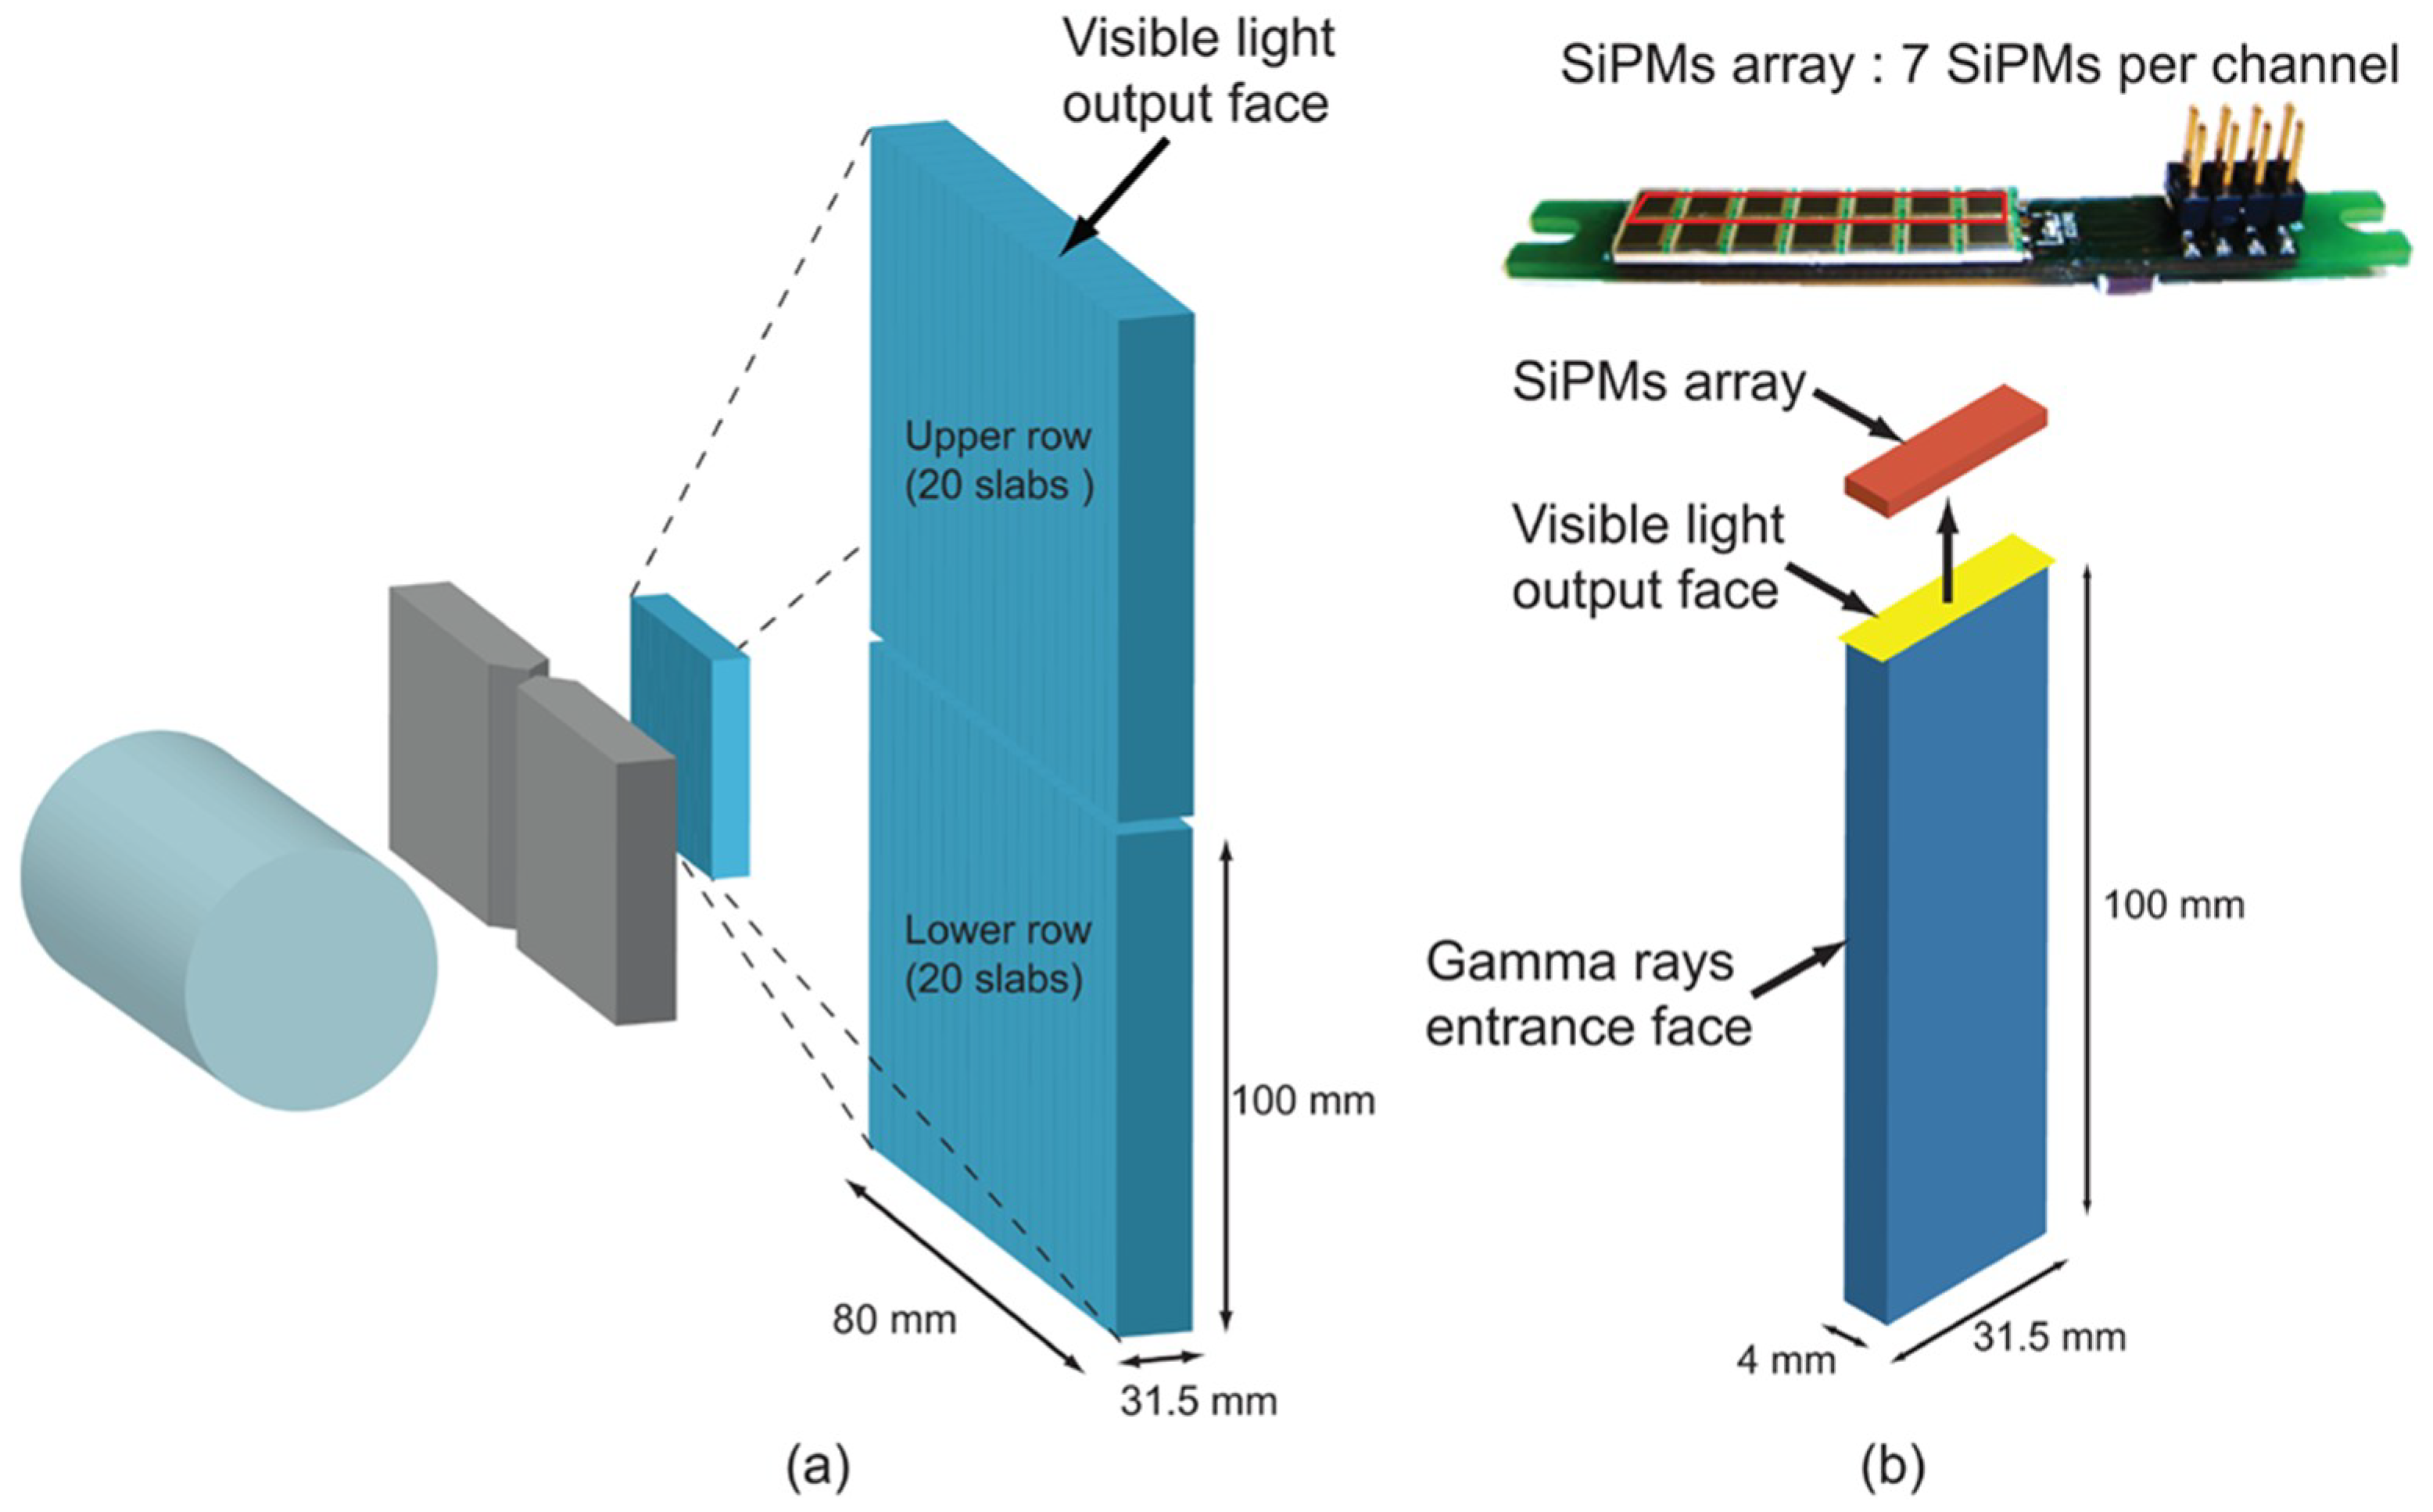
Figure 1. Design of the knife-edge slit camera. (a) The device consists of a tungsten collimator (grey) and a photon detector based on scintillation crystals and read out by silicon photomultipliers. 40 crystals are arranged in two rows, each with 20 slabs. (b) More detailed view on the readout of the scintillation crystal. With permission from [8].
Instruments 02 00025 g001
Figure 2. Setups for the MC simulations. The proton beam impinges on the water phantom (yellow) and the prompt gammas are detected through the tungsten collimator (pink) by the photodetector (blue). (a) The setup used for the simulation of the normal profile, that is, with the central imaging plane of the camera (i.e., pair 10/11, resembled by the blue dotted line) aligned with the proton range (black dashed line). (b) One of the individual steps of the simulation of the reconstructed profile. The central pair is placed in the position of pair 19/20 with respect to the nominal case shown in (a). The simulation was developed by Smeets et al. [7].
Instruments 02 00025 g002
Figure 3. Left: Comparison between normal and artificially reconstructed profile, both simulated with MCNPX for 160 MeV, a geometry with 25:20 and no offset. Right: The corresponding geometrical correction function.
Instruments 02 00025 g003
Figure 4. Left: Setup of the benchmark experiment. The proton beam impinges from the top on the water phantom. The PG camera is positioned in its trolley behind the water phantom measuring the PG emission. Right: Beam’s-eye-view of the spot structure of the iso-energy layers.
Instruments 02 00025 g004
Figure 5. Geometrical correction as function of beam energy (top left), camera setup (top right) and offset along beam axis (bottom).
Instruments 02 00025 g005
Figure 6. Experimental prompt gamma profile without (black curve) and with (blue curve) geometrical correction. The normalized simulated profile (red curve) is shown for comparison. Beam energy of 140 MeV, camera setup of 25:20 and no offset along beam axis.
Instruments 02 00025 g006
Figure 7. Detected shift minus expected shift as function of the expected shift for different camera setups (top: 25:20, bottom 25:12) using data without (left) and with (right) geometrical correction.
Instruments 02 00025 g007
Figure 8. Histogram displaying the range shift between simulation and measurement for all delivered spots for the 25:20 geometry. Blue shows the results without applied geometrical correction while the orange bars include the geometrical correction.
Instruments 02 00025 g008
Table 1. Overview of the delivered beams. The camera was aligned to a range R of a specific energy. A window of energies was delivered for each measurement.
Meas. IDGeometryEnergy (MeV)Energy Window Delivered (MeV)
125:20100100:125
225:20110100:135
325:20120100:145
425:20130105:155
525:20140115:165
625:20150125:175
725:20160135:185
825:20170145:190
925:20180155:190
1025:20190165:190
1125:12190100:190
1225:12160100:190