Abstract
Photo-induced carrier dynamics were measured in the organic Dirac electron candidate -(BETS)I to investigate why resistivity increases below = 50 K. We found a change in carrier dynamics due to an insulating gap formation below = 50 K. On the other hand, the relaxation time and polarization anisotropy of the observed dynamics differ from those in the charge-ordering (CO) state of the isostructural salt -(ET)I. Based on the difference, it can be concluded that the insulating phase has a different origin than the CO state.
1. Introduction
Organic molecular conductors have been widely studied due to their rich variety of electronic phases due to strong electron correlations [1,2]. Among them, -(BETS)I (hereafter -BETS), where BETS denotes bis(ethylenedithio)tetraselenafulvalene [3,4], has attracted attention as a candidate of the Dirac electron system [5,6,7,8], which has a linear energy dispersion in the band structure at ambient pressure, expecting unique electronic properties such as temperature-independent resistivity [9,10]. On the other hand, resistivity gradually increases with a decreasing temperature below = 50 K and a step-like change at around 40 K, and these origins are still controversial [11]. To date, theoretical studies [12,13], as well as various transport and magnetic measurements [14,15,16,17,18,19], have been conducted to elucidate the rise in resistivity. However, time-resolved spectroscopic measurements are still lacking.
Pump–probe time-resolved spectroscopy using femtosecond optical pulses has often been used to study the electronic properties of strongly correlated electron systems. In time-resolved spectroscopy, even if an electron system is perturbed by light on a large energy scale, the carrier relaxation process allows us to indirectly observe the electronic state as if it were unperturbed (not excited), and to capture small energy gaps and anisotropy. In fact, in organic conductors, this method has been utilized to study correlation-induced insulating states [20,21], and has contributed to elucidating their electronic properties. Thus, by measuring the carrier dynamics in -BETS, we can gain new insights into the origin of the increase in resistivity at low temperatures.
In this paper, photo-induced carrier relaxation dynamics in -BETS are reported. The signal amplitude of the dynamics begins to increase at = 50 K, which agrees with , indicating the formation of an energy gap. Moreover, the gap amplitude estimated from the fitting analysis almost agrees with that estimated from the resistivity measurements. On the other hand, the observed dynamics are different from that in a charge-ordering (CO) state of the isostructural salt -(ET)I (hereafter -ET), where ET denotes bis(ethylenedithio)-thiotetrathiafulvalene, with respect to relaxation time and polarization anisotropy. Therefore, the origin of the resistivity increase is likely to be an insulating phase different from the CO states.
2. Materials and Methods
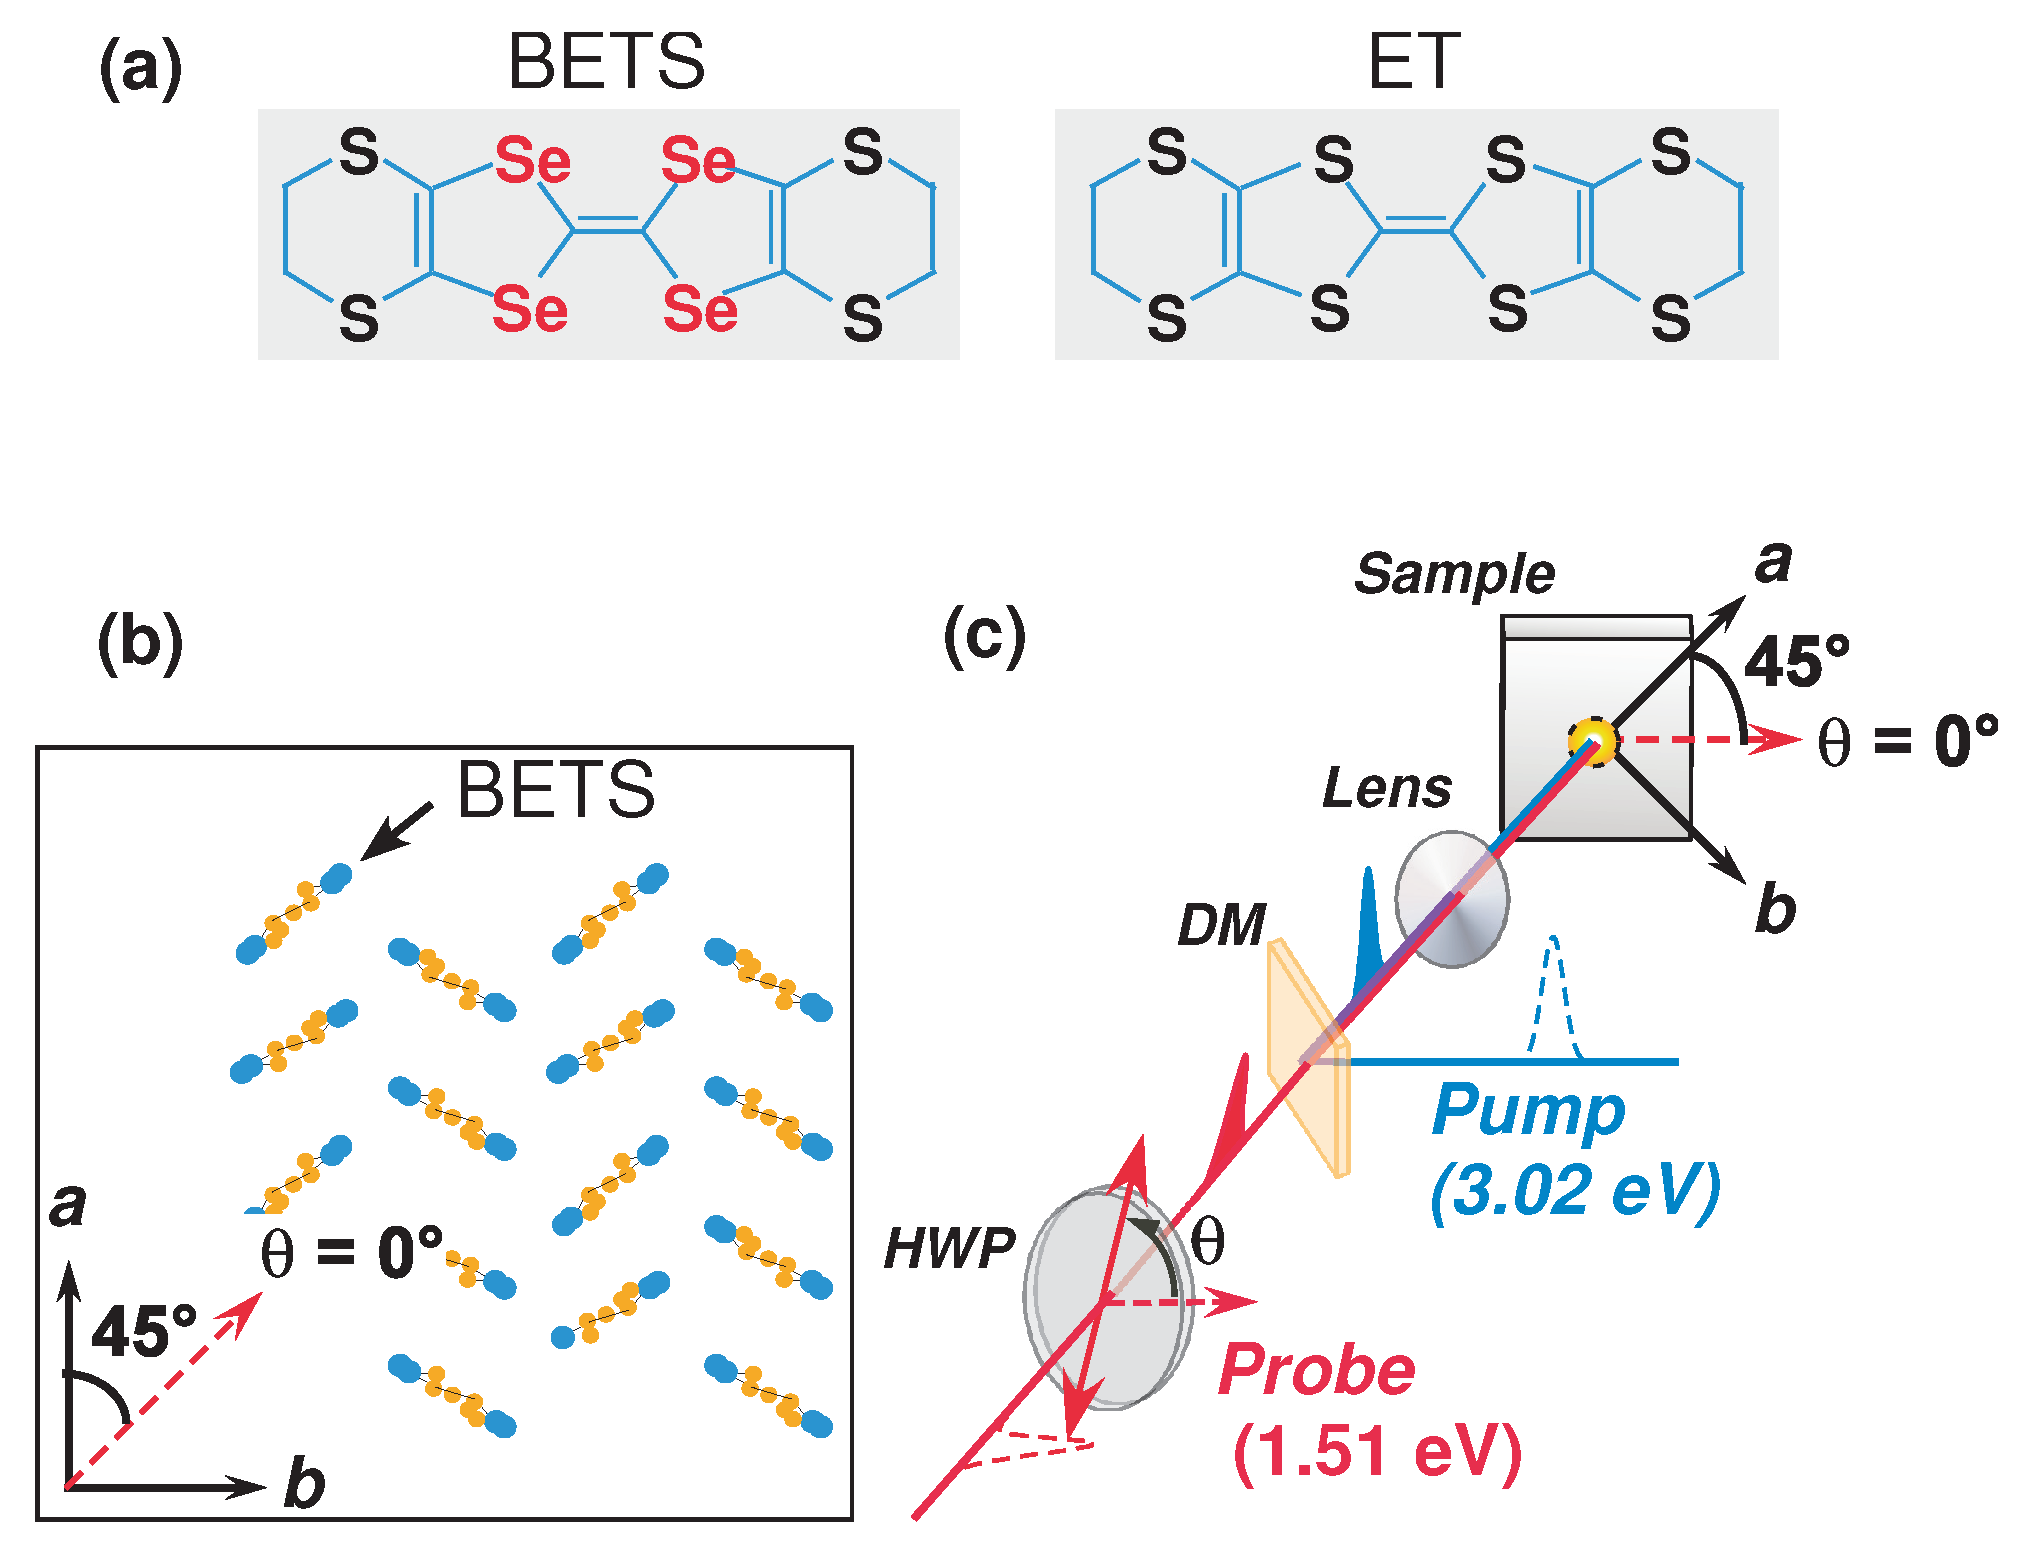
Single crystals of -BETS were synthesized electrochemically [3]. Figure 1a shows schematic illustrations of BETS and ET molecules. The crystal consists of an alternating structure of conducting layer of BETS molecules and an insulating layer of I. As shown in Figure 1b, BETS molecules are arranged and form a conducting layer.
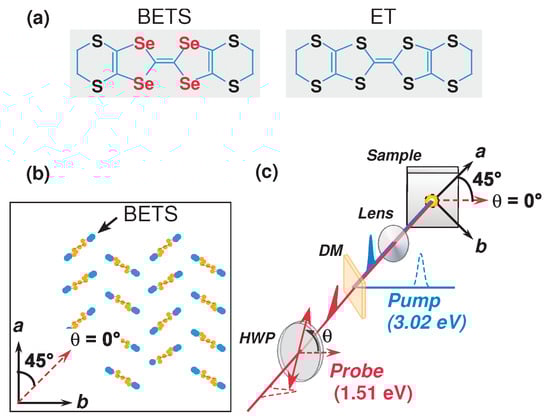
Figure 1.
(a) Schematic illustrations of BETS and ET molecules. S and Se stand for sulfur and selenium atoms. (b) A schematic illustration of an arrangement of BETS molecules in -BETS. The blue and orange balls denote sulfur and carbon atoms. (c) A schematic view of the measurement setup for pump–probe spectroscopy. DM and HWP represent a dichroic mirror and a half-wave plate, respectively. Some figures are reused from those used in the recent paper [22].
Figure 1c shows the schematic view of the setup for a pump–probe measurement. The measurements were made with 120 fs laser pulses centered at 1.51 eV obtained from a cavity-dumped mode-lock Ti:sapphire oscillator. A repetition rate was set as 54 kHz to avoid the heating effect. Pulses were separated into two paths; one was used for a probe, while the other was changed to pulses centered at 3.02 eV by a standard frequency doubling for a pump. The pump and probe beams were superimposed on the same axis and incident perpendicular to the conduction (ab) plane of the sample. The polarization of the probe was changed by rotating the half-wave plate, and the polarization angle was measured from a direction tilted 45 degrees from the a axis. The spot sizes of the pump and probe beams were ∼20 m and ∼12 m in diameter, respectively.
In pump–probe measurement, after excitation by the pump pulse, the carriers relax immediately and accumulate in electronic states near the Fermi energy, forming the non-equilibrium occupation of carriers as well as phonons [23]. In the subsequent probing process, the non-equilibrium carrier distribution is measured as a transient change in reflectivity (). When a gap for a low-energy electronic excitation such as an insulating gap is formed at low temperatures, a relaxation bottleneck occurs [24,25], leading to significant changes in , such as an increase or decrease in the signal amplitude and long relaxation. Therefore, the gap formation can be probed by measuring the temperature dependence. Moreover, by measuring probe polarization dependence, we can obtain information on the anisotropic ordering of electrons, such as the CO state [21,22]. The data were taken with increasing temperature with the pump fluence of F = 59 J/cm.
3. Results
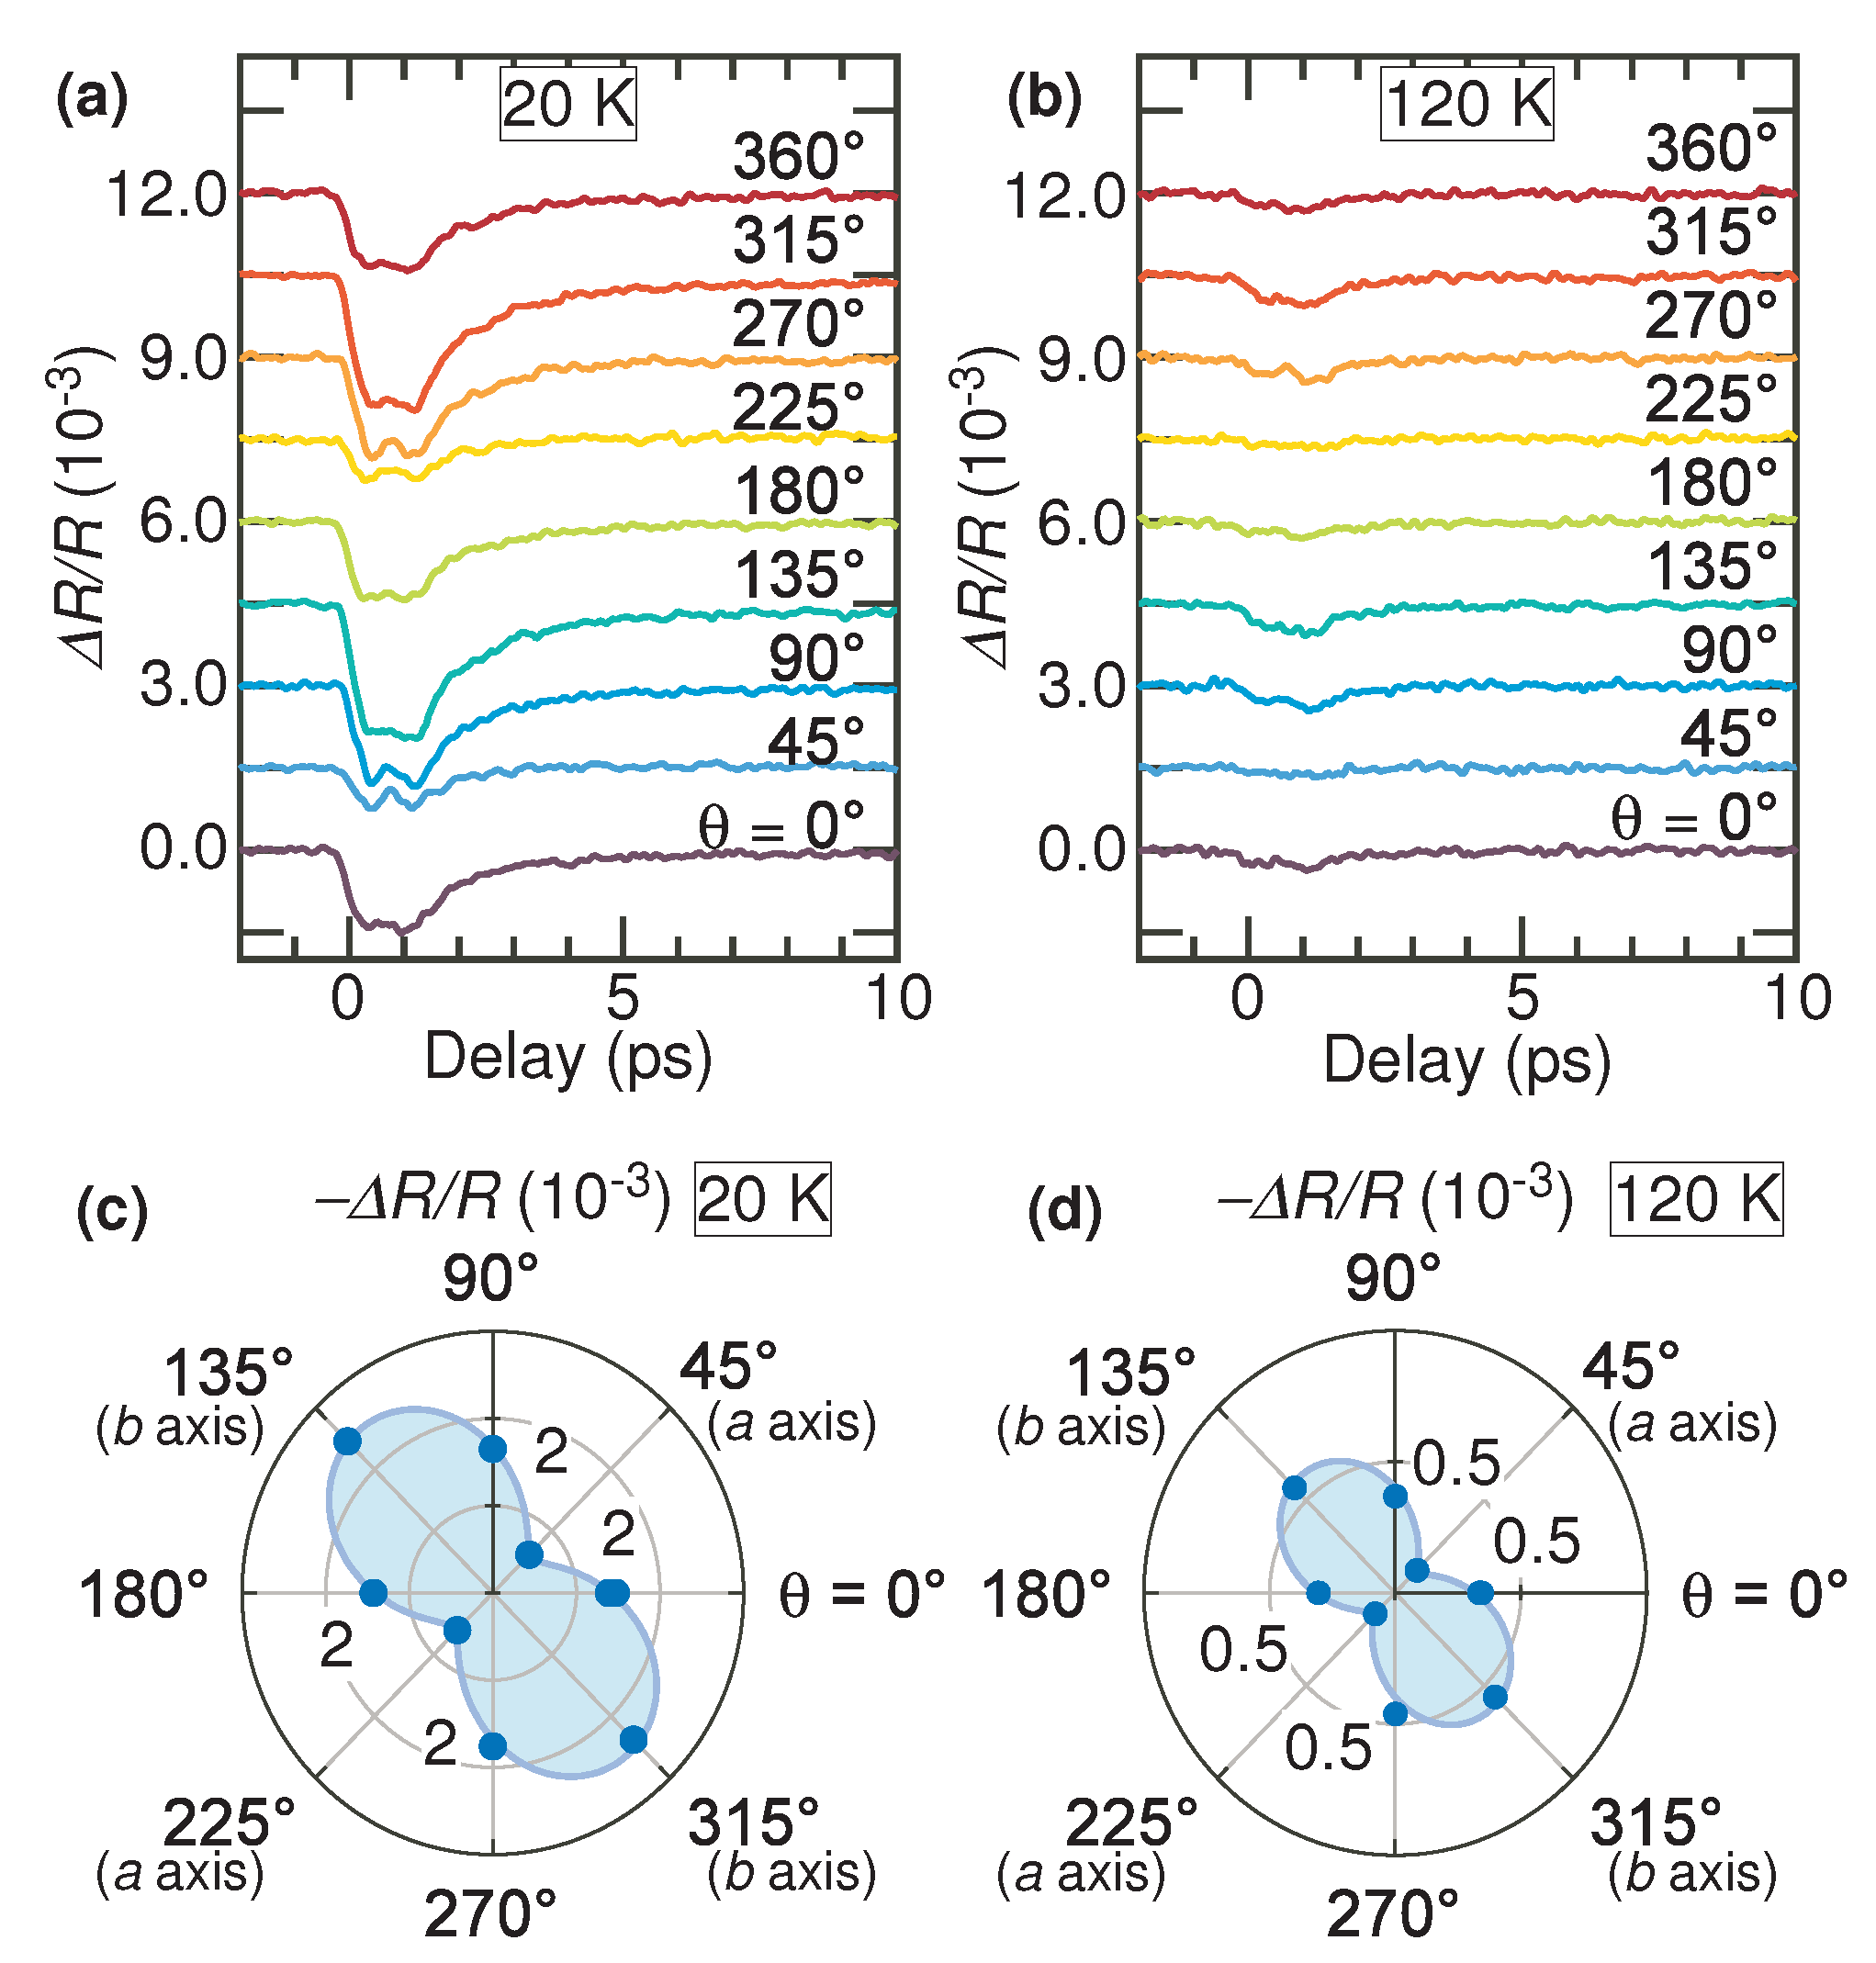
Figure 2a,b show the transient change of reflectivity () from = 0, 45 (a axis), 90, 135 (b axis), 180, 225 (a axis), 270, 315 (b axis), and 360 at T = 20 K and 120 K, respectively. At T = 120 K, changes depend on . When the temperature changes from 120 K to 20 K, the signal amplitude increases for all values of . Figure 2c,d show the polar plots of the signal amplitude at T = 20 K and 120 K, respectively. At T = 120 K, the signal is enhanced in the b axis direction, the trend of which does not change at T = 20 K.
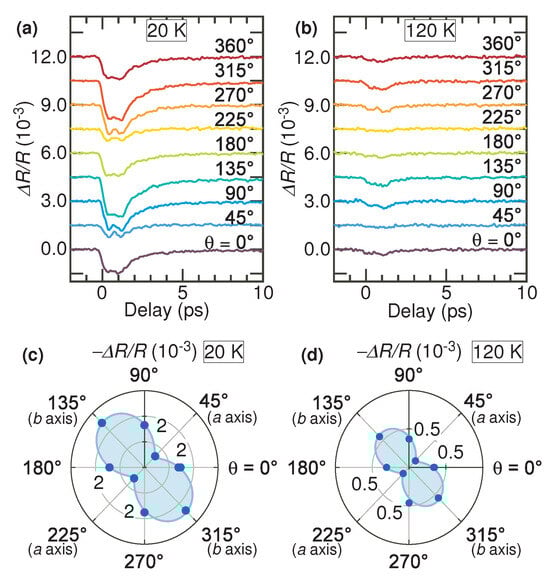
Figure 2.
(a,b) Transient change in reflectivity () from = 0 to 360 by 45 steps at T = 20 K and 120 K, respectively. The data are shifted for clarity. (c,d) Polar plots of the amplitude of as a function of at T = 20 K and 120 K, respectively. The signal amplitude is the value at 1 ps. The solid lines denote the results fitted using Equation (1).
To decompose the transient data into polarization-dependent (anisotropic) and -independent (isotropic) dynamics, we tried the following analyses. Since the probe beam is linearly polarized, is a function of with a period of 180. The data are fitted using the following equation:
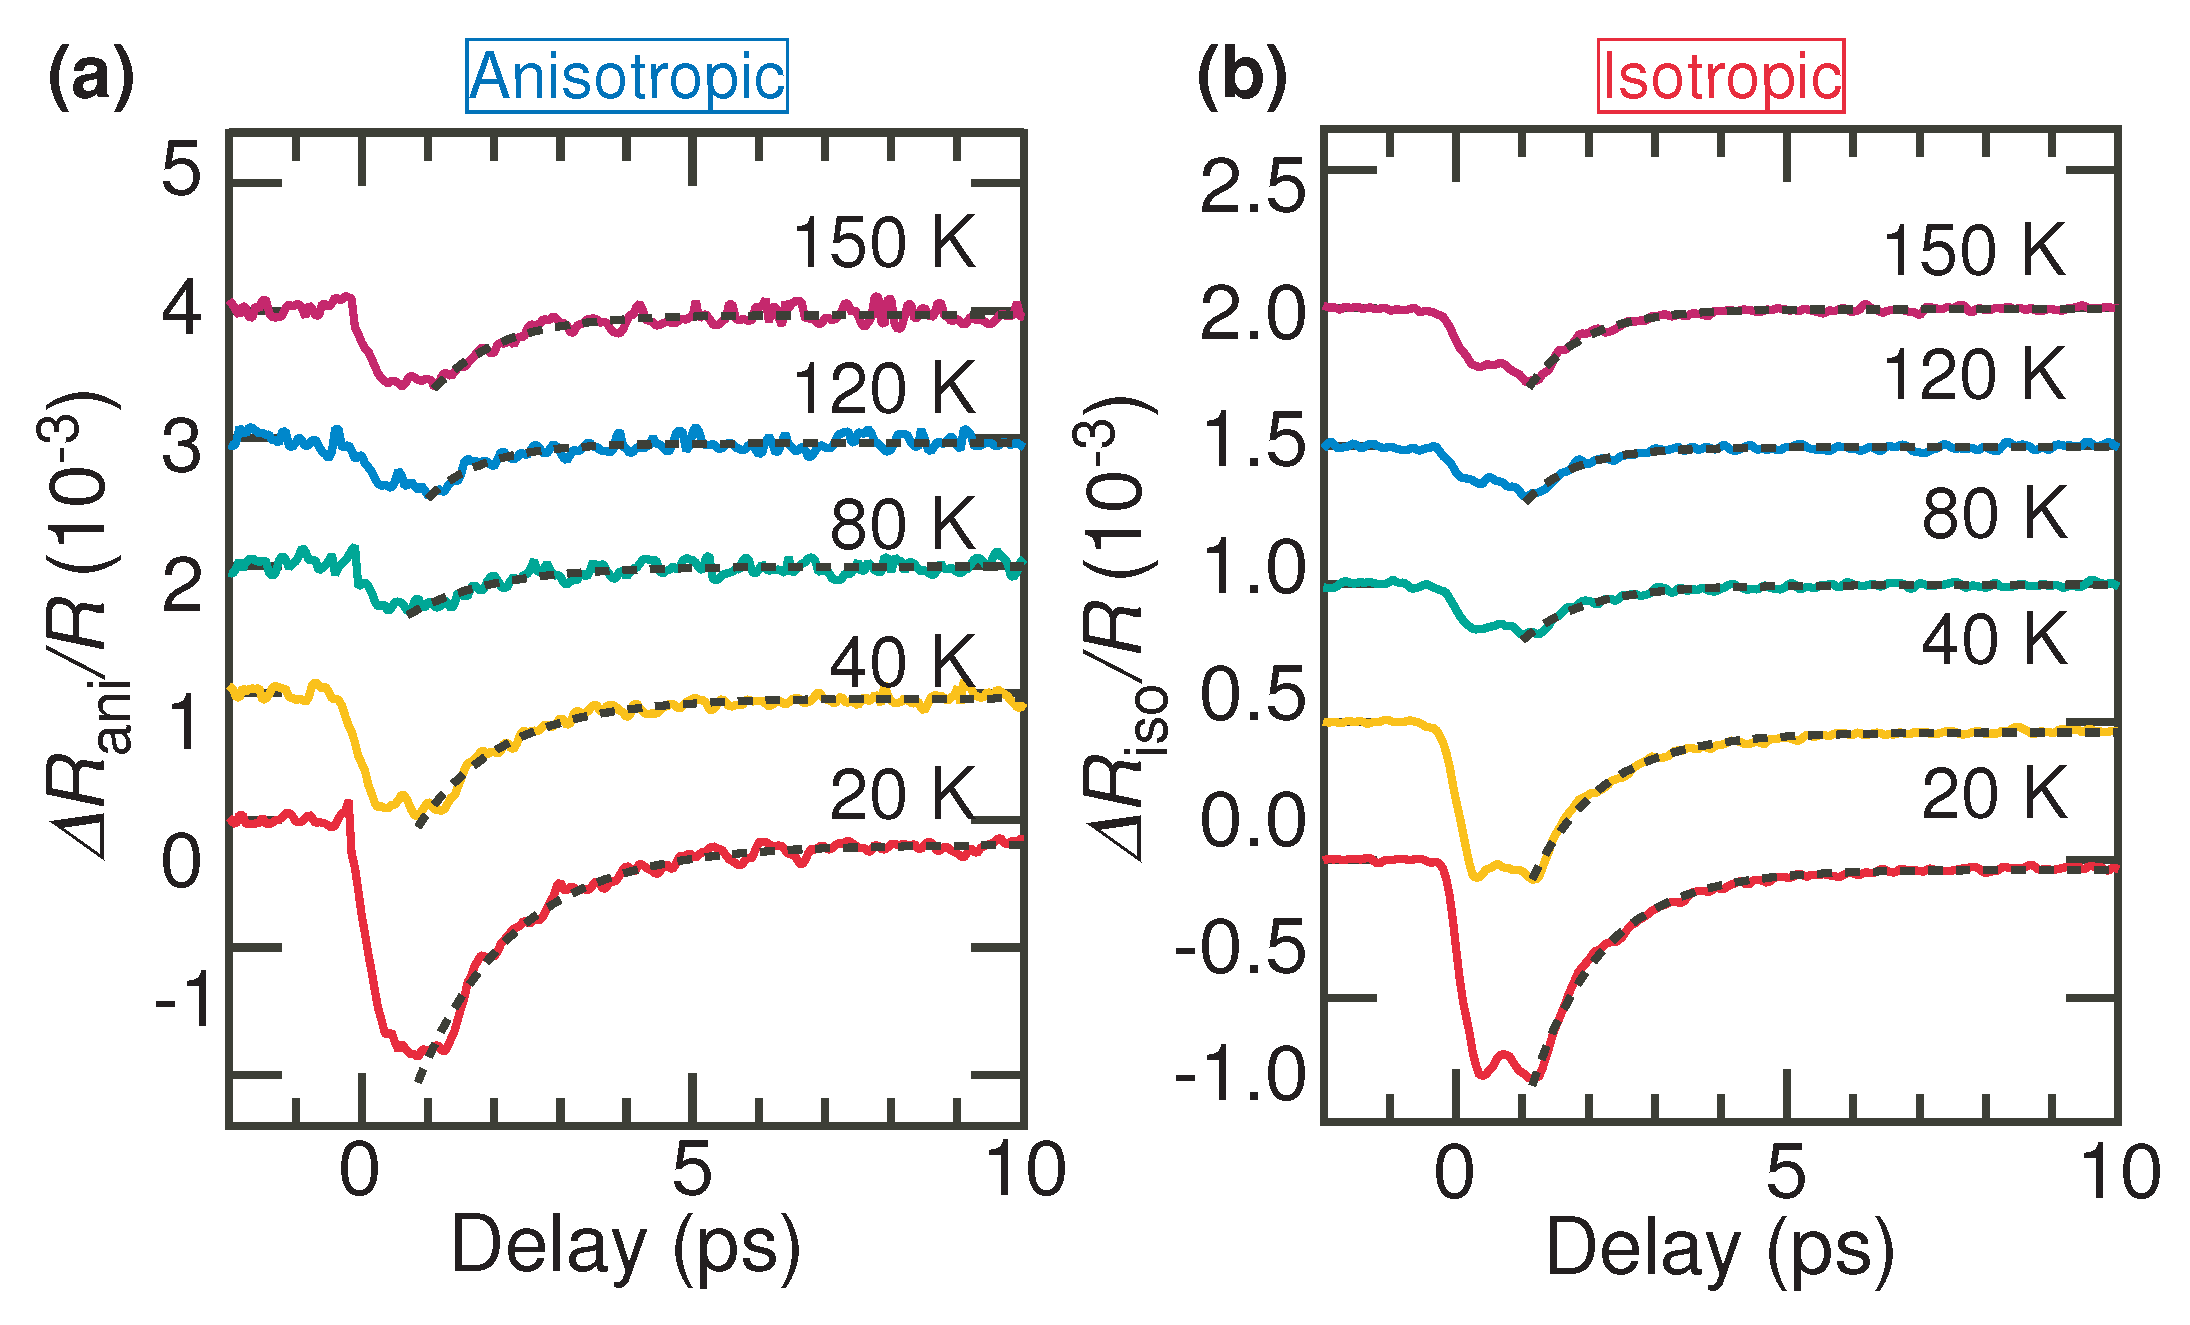
where and are anisotropic and isotropic transients, respectively, and is a phase corresponding to a direction wherein the transient signal is most enhanced. If the CO state appears, polarization dependence will change across the transition temperature. Even in that case, this analysis can characterize the anisotropy of the CO state as a change in [22]. Figure 3a,b show and , respectively, for T = 20, 40, 80, 120, and 150 K. When the temperature decreases, the negative signal seems to increase in both components. We note that the double peak structure observed before ∼1.5 ps of the isotropic component is attributed to the oscillatory component. However, its origin is beyond the scope of this paper and is not discussed further.
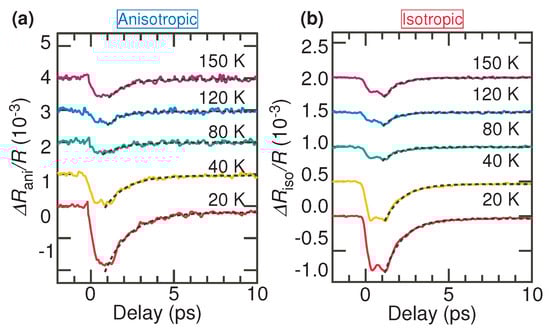
Figure 3.
(a,b) and , respectively, for T = 20, 40, 80, 120, and 150 K. The dashed lines are the results obtained by fitting with the single exponential function. The data are vertically offset for clarity.
To discuss the temperature dependencies in more detail, the data are fitted with a single exponential function
for the anisotropic component or
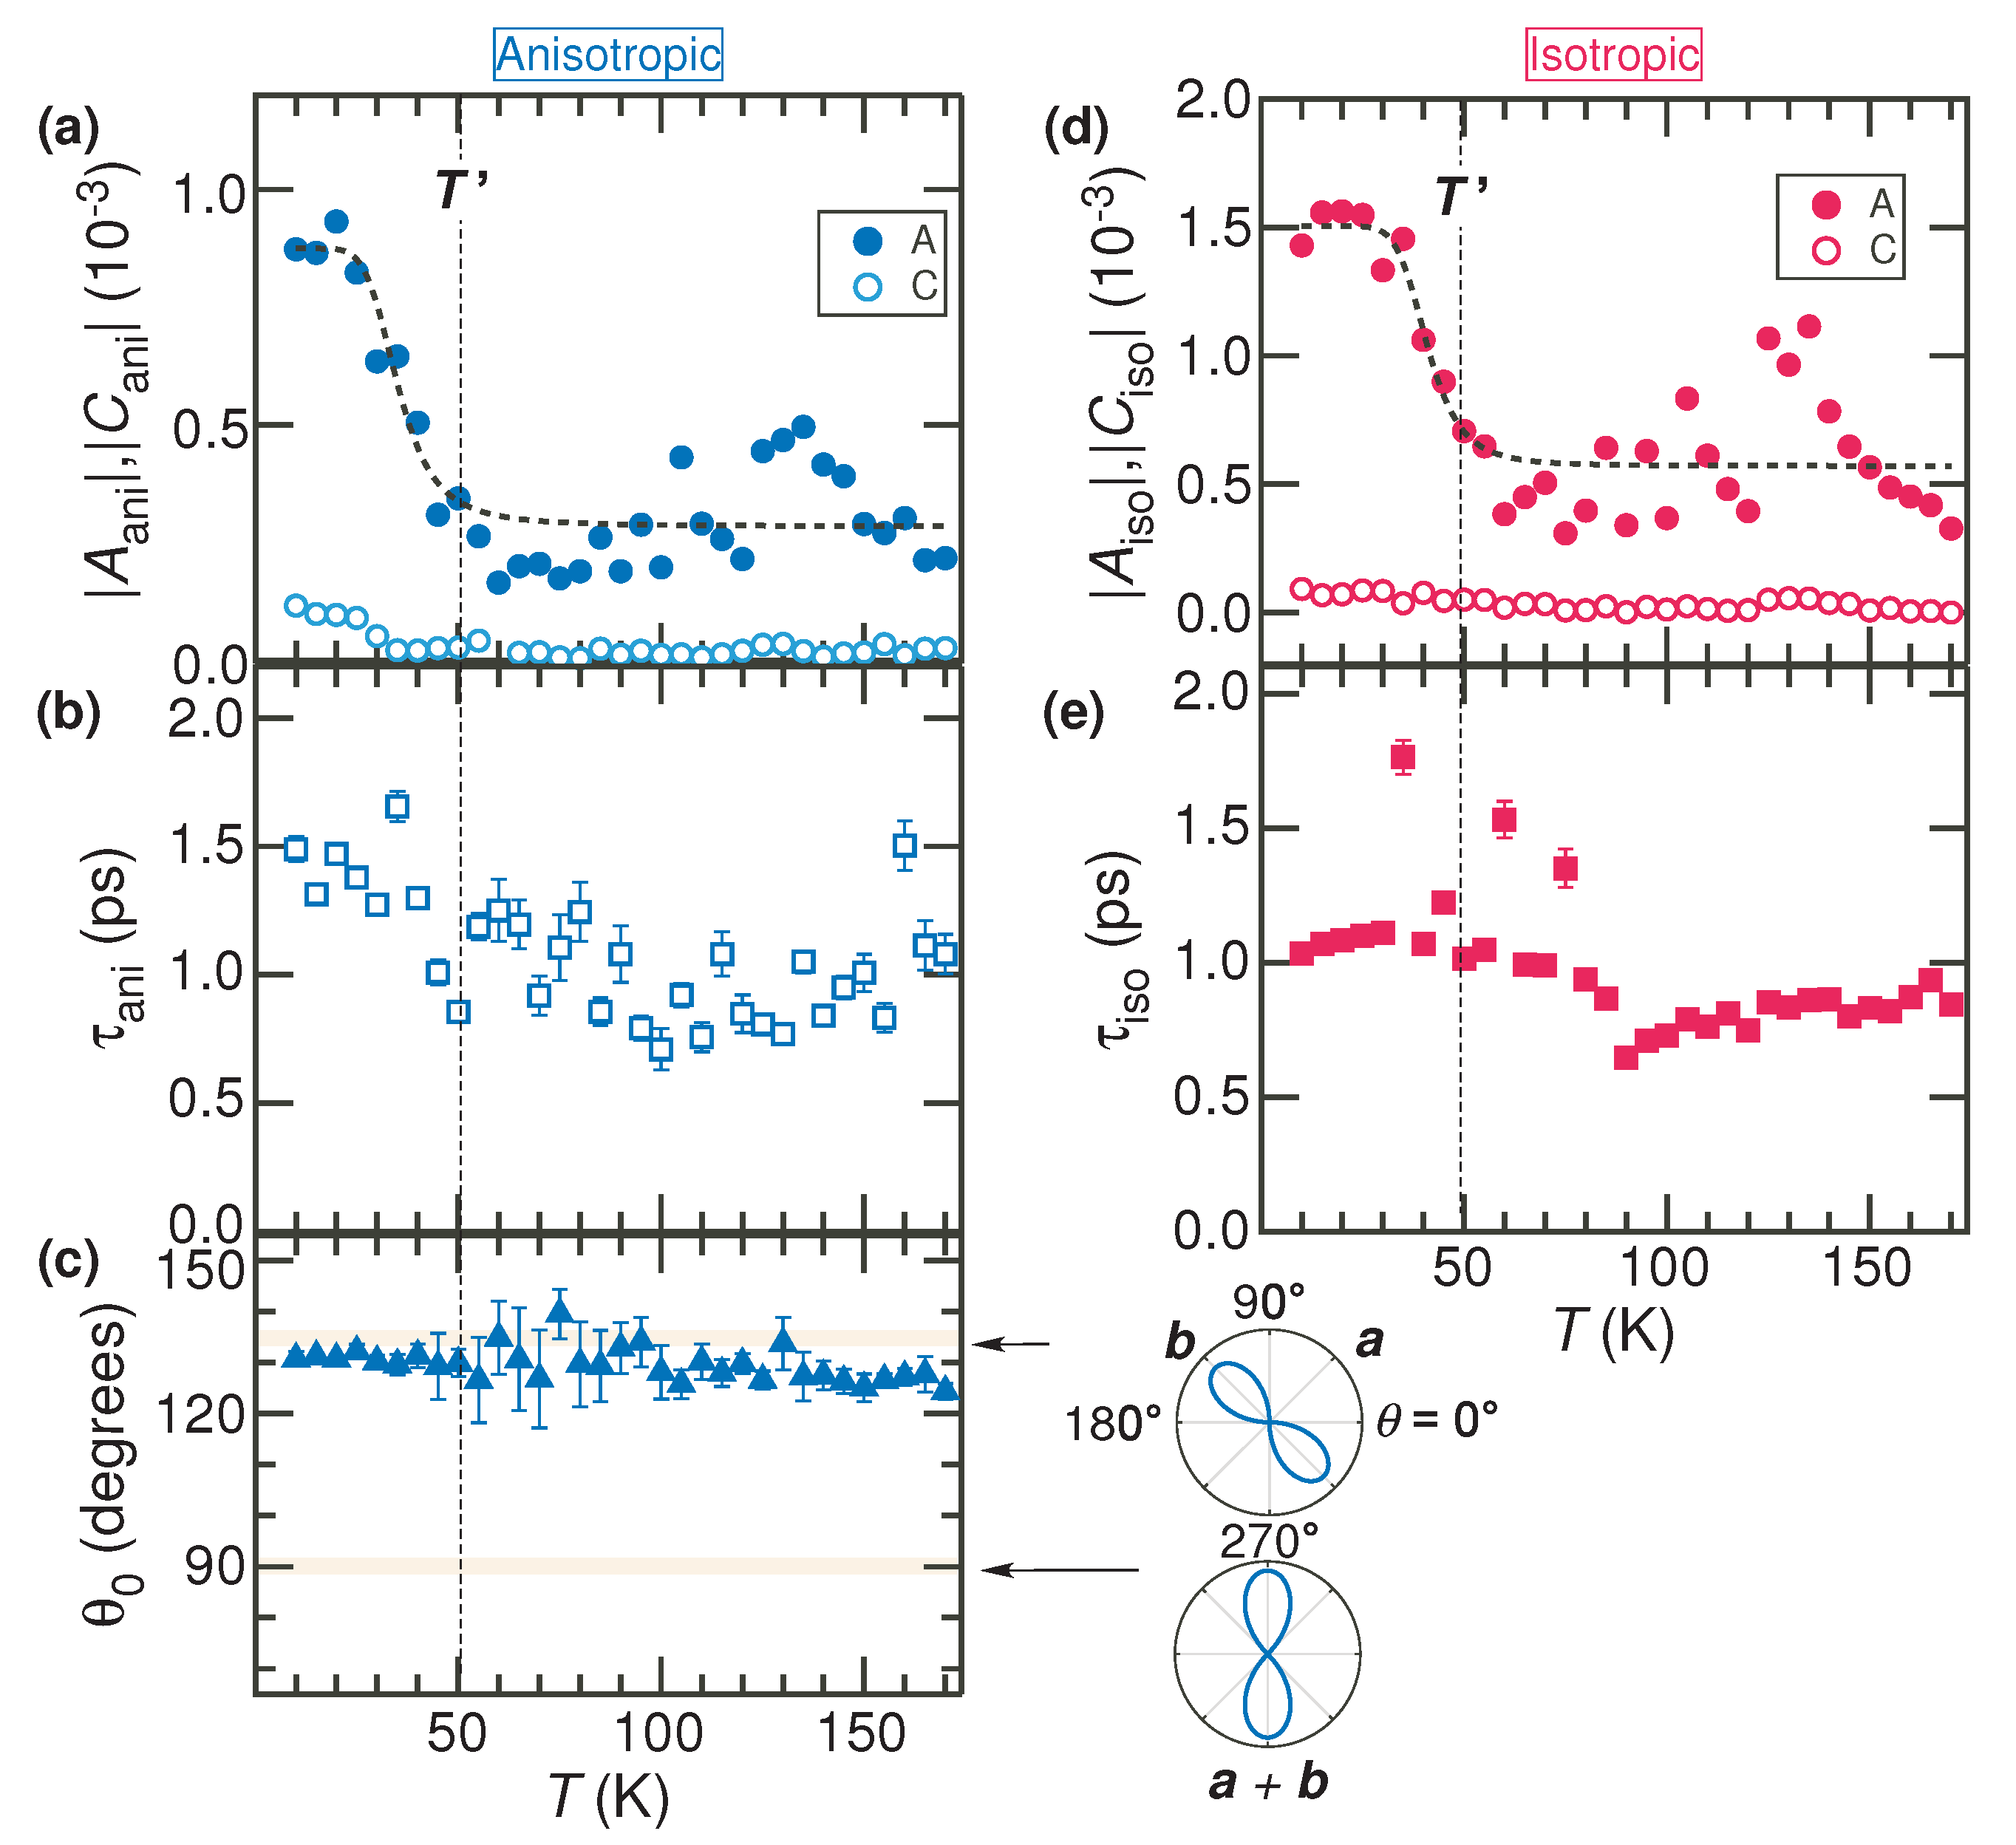
for the isotropic component, where , and , are the amplitude and relaxation time of a short-lived component. and are the amplitude of long-lived component when its relaxation time is assumed to be infinite. Figure 4a shows the temperature dependencies of the absolute values of and . As temperature decreases, increases below = 50 K, which agrees with . On the other hand, the temperature dependence of shows little change. Moreover, the values gradually reach ∼1.5 ps at low temperatures and show no significant change around , as shown in Figure 4b. Figure 4c shows the temperature dependence of at a delay of 1 ps. The values are ∼135 in the whole temperature range, indicating no anisotropic electronic ordering below .
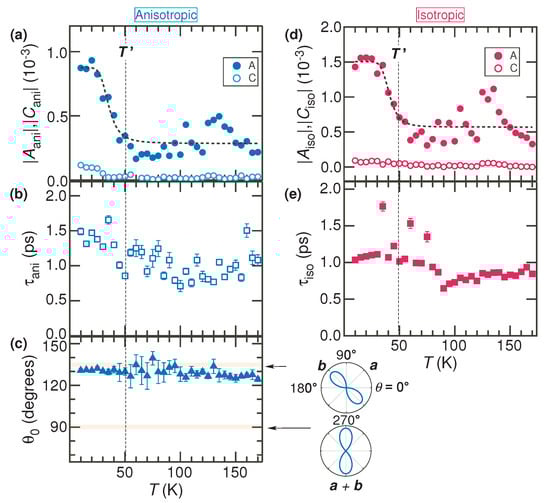
Figure 4.
(a) Temperature dependencies of and . The dashed line is the fitting results using Equation (4). (b) Temperature dependence of the relaxation time . (c) Temperature dependence of . Temperature dependencies of and (d) and (e). is the temperature at which changes suddenly and drastically with decreasing temperature.
In the isotropic component, the temperature dependencies of and are similar to those in the anisotropic component. The similarity between the anisotropic and isotropic dynamics suggests that they have the same origin. We note a broad peak structure in the temperature dependencies of and at high temperatures, as shown in Figure 4a,d. This is due to a change in beam irradiation position with temperature variation and is not intrinsic.
Since the observed changes in and reflect the changes in non-equilibrium carrier distribution, information on the gap magnitude can be extracted from the temperature dependencies of and . The gap () can be estimated by fitting with a temperature-independent gap model, which is often used in the gradual temperature dependence in the amplitude (A) such as pseudogap response in cuprate superconductors [25]. In the model, the amplitude is written as
where b, and are variable parameters for the fit and the Boltzmann constant, respectively. As shown by the dashed lines in Figure 4a,d, the data are fitted well, and the gap is estimated as ≈ 24 meV and 35 meV for the anisotropic and the isotropic components, respectively, which agree with that estimated from the analysis of the Arrhenius plot in the resistivity measurements. Therefore, the results indicate that a band gap opens at = 50 K in the -BETS.
4. Discussion
Here, possible origins of the observed dynamics below are discussed through comparison with the isostructural salt -ET, which undergoes a CO transition at = 135 K [26,27,28,29,30]. The CO state is characterized by three features of photoinduced carrier dynamics [22]. The first one is the signal amplitude, which begins to change at around , and the change is explained by the insulating gap formation due to the CO. Secondly, a divergent behavior of the relaxation time is observed just below . This behavior is attributed to a phonon-bottleneck effect [25] due to critical fluctuation related to long-range electronic ordering just below . Thirdly, changes to 90 where the transient signal is most enhanced along the (a + b) axis, below . This polarization anisotropy indicates an anisotropic ordering of electrons [31,32,33], consistent with the CO state.
In -BETS, the signal amplitude increases below = 50 K, which is similar to -ET. Considering the consistency between the pump–probe and resistivity measurements, this behavior can be attributed to the formation of an insulating gap. However, in contrast to -ET, there are no significant changes in , and at . The difference between -BETS and -ET suggests that the origin of the resistivity increase below differs from the CO state.
One of the possible origins of this is topological insulators (TIs), which generally have an insulator-type band gap in the bulk but have a gapless conducting phase on their surface. As shown in Figure 1a, the BETS molecule is obtained by replacing four inner sulfur atoms of the ET molecule with selenium atoms. Due to the fact that a spin-orbit coupling (SOC) increases with the selenium substitution, the SOC in -BETS can be more significant than in -ET. Indeed, a recent theoretical study has suggested that SOC induces a gap, leading to a weak topological insulator [7]. Moreover, electron correlation is also crucial for the emergence of the topological phase [12,13], and anomalous transport properties originating from correlation-induced topological insulators have been observed experimentally [19]. We comment on the difficulty to refer to the relation between the electron correlation anisotropy and the polarization anisotropy in . The previous study indicated that the charge gap formation is due to the development of one-dimensional anisotropy of spin correlations [13]. However, it is difficult to refer to the relation because the polarization anisotropy in is a consequence of the anisotropy regarding the optical transitions after the pump irradiation and is not directly related to the low-energy electronic gap structure [21].
In TI states, there is no anisotropy due to charge disproportionation. This means that the dynamics of the state are expected to stay constant with the relaxation time and , and only the amplitude is likely to vary due to the bulk gap. These predictions are consistent with the present results, suggesting that the dynamics observed below = 50 K could be due to the insulator gap as a bulk property of TI. It is also worth noting that the present results do not show any anomaly in dynamics at around 40 K, where the resistivity shows a step-like change [11]. The recent study has suggested a crossover from two-dimensional to three-dimensional TI at ∼35 K [19], resulting in a change in the conducting surface states. Therefore, during the crossover, the bulk band gap is not affected, which is consistent with the lack of change in dynamics. In general, it is difficult to distinguish between the carrier dynamics arising from the bulk state and those from the surface state. Thus, other measurements, such as a spectrally resolved pump–probe measurements, may be needed to clarify the contribution from the surface.
5. Conclusions
Through pump–probe time-resolved spectroscopy, the photo-induced carrier dynamics were found to change below = 50 K. This finding corresponds to the increase in resistivity. Compared with -ET, the observed dynamics below differ from those in the CO state regarding relaxation time and polarization anisotropy, but they are compatible with those predicted in the TI.
Author Contributions
S.T., M.K. and Y.T. performed the optical pump–probe measurements. R.O. and T.N. prepared organic crystals. S.T. prepared manuscripts based on the discussions with all co-authors. All authors have read and agreed to the published version of the manuscript.
Funding
This research was funded by JSPS KAKENHI Grants No. JP22H01162.
Data Availability Statement
All the data suggested in this study are available from the corresponding author (S.T.) upon reasonable request.
Acknowledgments
The authors acknowledge N. Kanai for experimental support and helpful discussions.
Conflicts of Interest
The authors declare no conflict of interest.
References
- Ardavan, A.; Brown, S.; Kagoshima, S.; Kanoda, K.; Kuroki, K.; Mori, H.; Ogata, M.; Uji, S.; Wosnitza, J. Recent Topics of Organic Superconductors. J. Phys. Soc. Jpn. 2012, 81, 011004. [Google Scholar] [CrossRef]
- Naito, T. Modern History of Organic Conductors: An Overview. Crystals 2021, 11, 838. [Google Scholar] [CrossRef]
- Kato, R.; Kobayashi, H.; Kobayashi, A. Synthesis and properties of bis(ethylenedithio)tetraselenafulvalene (BEDT-TSeF) compounds. Synth. Met. 1991, 42, 2093–2096. [Google Scholar] [CrossRef]
- Kondo, R.; Kagoshima, S.; Tajima, N.; Kato, R. Crystal and Electronic Structures of the Quasi-Two-Dimensional Organic Conductor α-(BEDT-TTF)2I3 and Its Selenium Analogue α-(BEDT-TSeF)2I3 under Hydrostatic Pressure at Room Temperature. J. Phys. Soc. Jpn. 2009, 78, 114714. [Google Scholar] [CrossRef]
- Morinari, T.; Suzumura, Y. On the Possible Zero-Gap State in Organic Conductor α-(BEDT-TSF)2I3 under Pressure. J. Phys. Soc. Jpn. 2014, 83, 094701. [Google Scholar] [CrossRef]
- Tsumuraya, T.; Suzumura, Y. First-principles study of the effective Hamiltonian for Dirac fermions with spin-orbit coupling in two-dimensional molecular conductor α-(BETS)2I3. Eur. Phys. J. B 2021, 94, 17. [Google Scholar] [CrossRef]
- Kitou, S.; Tsumuraya, T.; Sawahata, H.; Ishii, F.; Hiraki, K.i.; Nakamura, T.; Katayama, N.; Sawa, H. Ambient-pressure Dirac electron system in the quasi-two-dimensional molecular conductor α-(BETS)2I3. Phys. Rev. B 2021, 103, 035135. [Google Scholar] [CrossRef]
- Oka, R.; Ohara, K.; Konishi, K.; Yamane, I.; Shimada, T.; Naito, T. Band Structure Evolution during Reversible Interconversion between Dirac and Standard Fermions in Organic Charge-Transfer Salts. Magnetochemistry 2023, 9, 153. [Google Scholar] [CrossRef]
- Shon, N.H.; Ando, T. Quantum Transport in Two-Dimensional Graphite System. J. Phys. Soc. Jpn. 1998, 67, 2421–2429. [Google Scholar] [CrossRef]
- Tajima, N.; Sugawara, S.; Tamura, M.; Nishio, Y.; Kajita, K. Electronic Phases in an Organic Conductor α-(BEDT-TTF)2I3: Ultra Narrow Gap Semiconductor, Superconductor, Metal, and Charge-Ordered Insulator. J. Phys. Soc. Jpn. 2006, 75, 051010. [Google Scholar] [CrossRef]
- Inokuchi, M.; Tajima, H.; Kobayashi, A.; Ohta, T.; Kuroda, H.; Kato, R.; Naito, T.; Kobayashi, H. Electrical and Optical Properties of α-(BETS)2I3 and α-(BEDT-STF)2I3. Bull. Chem. Soc. Jpn. 1995, 68, 547–553. [Google Scholar] [CrossRef]
- Ohki, D.; Yoshimi, K.; Kobayashi, A. Interaction-induced quantum spin Hall insulator in the organic Dirac electron system α-(BEDT-TSeF)2I3. Phys. Rev. B 2022, 105, 205123. [Google Scholar] [CrossRef]
- Ohki, D.; Yoshimi, K.; Kobayashi, A.; Misawa, T. Gap opening mechanism for correlated Dirac electrons in organic compounds α-(BEDT-TTF)2I3 and α-(BEDT-TSeF)2I3. Phys. Rev. B 2023, 107, L041108. [Google Scholar] [CrossRef]
- Hiraki, K.i.; Harada, S.; Arai, K.; Takano, Y.; Takahashi, T.; Tajima, N.; Kato, R.; Naito, T. Local Spin Susceptibility of α-D2I3 (D = bis(ethylendithio)tetraselenafulvalene (BETS) and bis(ethylendithio)dithiadiselenafulvalene (BEDT-STF)) Studied by 77Se NMR. J. Phys. Soc. Jpn. 2011, 80, 014715. [Google Scholar] [CrossRef]
- Kodama, K.; Nakamura, T.; Takahashi, T.; Ojima, E.; Kobayashi, H. Metal-insulator transition in α-(BEDT-TSeF)2I3 and α-(BEDT-TTF)2I3. Synth. Met. 1999, 103, 1963–1964. [Google Scholar] [CrossRef]
- Kawasugi, Y.; Masuda, H.; Uebe, M.; Yamamoto, H.M.; Kato, R.; Nishio, Y.; Tajima, N. Pressure-induced phase switching of Shubnikov–de Haas oscillations in the molecular Dirac fermion system α-(BETS)2I3. Phys. Rev. B 2021, 103, 205140. [Google Scholar] [CrossRef]
- Fujiyama, S.; Maebashi, H.; Tajima, N.; Tsumuraya, T.; Cui, H.B.; Ogata, M.; Kato, R. Large Diamagnetism and Electromagnetic Duality in Two-Dimensional Dirac Electron System. Phys. Rev. Lett. 2022, 128, 027201. [Google Scholar] [CrossRef]
- Konoike, T.; Terashima, T.; Uji, S.; Hattori, Y.; Kato, R. Magnetic Order in Organic Dirac Electron System α-(BETS)2I3. J. Phys. Soc. Jpn. 2022, 91, 043703. [Google Scholar] [CrossRef]
- Nomoto, T.; Imajo, S.; Akutsu, H.; Nakazawa, Y.; Kohama, Y. Correlation-driven organic 3D topological insulator with relativistic fermions. Nat. Commun. 2023, 14, 2130. [Google Scholar] [CrossRef]
- Tsuchiya, S.; Nakagawa, K.; Taniguchi, H.; Toda, Y. Polarization-resolved Ultrafast Spectroscopy in an Organic Mott Insulator κ-(BEDT-TTF)2Cu[N(CN)2]Cl. J. Phys. Soc. Jpn. 2019, 88, 074706. [Google Scholar] [CrossRef]
- Nakagawa, K.; Tsuchiya, S.; Taniguchi, H.; Toda, Y. Probing uniform and nonuniform charge ordering with polarized femtosecond optical pulses in geometrically frustrated θ-(BEDT-TTF)2MZn(SCN)4 (M= Rb, Cs). Phys. Rev. Res. 2023, 5, 013024. [Google Scholar] [CrossRef]
- Tsuchiya, S.; Kanai, N.; Oka, R.; Naito, T.; Toda, Y. Effects of Molecular Substitution in Organic Conductors α-(ET)2I3 and α-(STF)2I3 Studied by Polarized Femtosecond Spectroscopy. J. Phys. Soc. Jpn. 2023, 92, 094703. [Google Scholar] [CrossRef]
- Allen, P.B. Theory of thermal relaxation of electrons in metals. Phys. Rev. Lett. 1987, 59, 1460–1463. [Google Scholar] [CrossRef] [PubMed]
- Rothwarf, A.; Taylor, B.N. Measurement of Recombination Lifetimes in Superconductors. Phys. Rev. Lett. 1967, 19, 27–30. [Google Scholar] [CrossRef]
- Kabanov, V.V.; Demsar, J.; Podobnik, B.; Mihailovic, D. Quasiparticle relaxation dynamics in superconductors with different gap structures: Theory and experiments on YBa2Cu3O7-ffi. Phys. Rev. B 1999, 59, 1497–1506. [Google Scholar] [CrossRef]
- Bender, K.; Hennig, I.; Schweitzer, D.; Dietz, K.; Endres, H.; Keller, H.J. Synthesis, Structure and Physical Properties of a Two-Dimensional Organic Metal, Di[bis(ethylenedithiolo)tetrathiofulvalene] triiodide, (BEDT-TTF)+2I3. Mol. Cryst. Liq. Cryst. 1984, 108, 359–371. [Google Scholar] [CrossRef]
- Takano, Y.; Hiraki, K.; Yamamoto, H.; Nakamura, T.; Takahashi, T. Charge disproportionation in the organic conductor, α-(BEDT-TTF)2I3. J. Phys. Chem. Solids 2001, 62, 393–395. [Google Scholar] [CrossRef]
- Moroto, S.; Hiraki, K.-I.; Takano, Y.; Kubo, Y.; Takahashi, T.; Yamamoto, H.M.; Nakamura, T. Charge disproportionation in the metallic state of α-(BEDT-TTF)2I3. J. Phys. IV Fr. 2004, 114, 399. [Google Scholar] [CrossRef]
- Takahashi, T.; Nogami, Y.; Yakushi, K. Charge Ordering in Organic Conductors. J. Phys. Soc. Jpn. 2006, 75, 051008. [Google Scholar] [CrossRef]
- Yamamoto, K.; Iwai, S.; Boyko, S.; Kashiwazaki, A.; Hiramatsu, F.; Okabe, C.; Nishi, N.; Yakushi, K. Strong Optical Nonlinearity and its Ultrafast Response Associated with Electron Ferroelectricity in an Organic Conductor. J. Phys. Soc. Jpn. 2008, 77, 074709. [Google Scholar] [CrossRef]
- Dvorsek, D.; Kabanov, V.V.; Demsar, J.; Kazakov, S.M.; Karpinski, J.; Mihailovic, D. Femtosecond quasiparticle relaxation dynamics and probe polarization anisotropy in YSrxBa2−xCu4O8 (x = 0, 0.4). Phys. Rev. B 2002, 66, 020510. [Google Scholar] [CrossRef]
- Toda, Y.; Kawanokami, F.; Kurosawa, T.; Oda, M.; Madan, I.; Mertelj, T.; Kabanov, V.V.; Mihailovic, D. Rotational symmetry breaking in Bi2Sr2CaCu2O8+δ probed by polarized femtosecond spectroscopy. Phys. Rev. B 2014, 90, 094513. [Google Scholar] [CrossRef]
- Tsuchiya, S.; Sugawara, Y.; Tanda, S.; Toda, Y. Symmetry-dependent carrier relaxation dynamics and charge–density–wave transition in DyTe3 probed by polarized femtosecond spectroscopy. J. Opt. 2015, 17, 085501. [Google Scholar] [CrossRef]
Disclaimer/Publisher’s Note: The statements, opinions and data contained in all publications are solely those of the individual author(s) and contributor(s) and not of MDPI and/or the editor(s). MDPI and/or the editor(s) disclaim responsibility for any injury to people or property resulting from any ideas, methods, instructions or products referred to in the content. |
© 2023 by the authors. Licensee MDPI, Basel, Switzerland. This article is an open access article distributed under the terms and conditions of the Creative Commons Attribution (CC BY) license (https://creativecommons.org/licenses/by/4.0/).