Abstract
Athena (advanced telescope for high-energy astrophysics) is an ESA large-class mission, at present under a re-definition “design-to-cost” phase, planned for a prospective launch at L1 orbit in the second half of the 2030s. It will be an observatory alternatively focusing on two complementary instruments: the X-IFU (X-ray Integral Field Unit), a TES (TransitionEdge Sensor)-based kilo-pixel array which is able to perform simultaneous high-grade energy spectroscopy (~3 eV@7 keV) and imaging over 4′ FoV (field of view), and the WFI (Wide Field Imager), which has good energy spectral resolution (~170 eV@7 keV) and imaging on wide 40′ × 40′ FoV. Athena will be a truly transformational observatory, operating in conjunction with other large observatories across the electromagnetic spectrum available in the 2030s like ALMA, ELT, JWST, SKA, CTA, etc., and in multi-messenger synergies with facilities like LIGO A+, Advanced Virgo+, LISA, IceCube and KM3NeT. The Italian team is involved in both instruments. It has the co-PIship of the cryogenic instrument for which it has to deliver the TES-based Cryogenic AntiCoincidence detector (CryoAC) necessary to guarantee the X-IFU sensitivity, degraded by a primary particle background of both solar and galactic cosmic ray (GCR) origins, and by secondary electrons produced by primaries interacting with the materials surrounding the main detector. The outcome of Geant4 studies shows the necessity for adopting both active and passive techniques to guarantee the residual particle background at 5 × 10⁻³ cts cm−2 s−1 keV−1 level in 2–10 keV scientific bandwidth. The CryoAC is a four-pixel detector made of Si-suspended absorbers sensed by Ir/Au TESes placed at <1 mm below the main detector. After a brief overview of the Athena mission, we will report on the particle background reduction techniques highlighting the impact of the Geant4 simulation on the X-IFU focal plane assembly design, then hold a broader discussion on the CryoAC program in terms of detection chain system requirements, test, design concept against trade-off studies and programmatic.
Keywords:
Athena; X-IFU; CryoAC; TES; cryogenic detectors; particle background; Geant4; space instrumentation 1. Introduction
The particle background, due to the low fluxes of the typical sources targeted, often limits observations in the X-ray energy band: such a background degrades the instrument sensitivity thus affecting its scientific performance. The background can easily be higher than the signal itself; therefore, any mission with the scientific objective of observing weak and/or extended sources in the X-ray band must address this problem by putting in place reduction techniques. Such solutions are the results of a deep study about the interaction of particle environment in the orbit of the satellite with the structure surrounding the detector assembly and the detector itself. In the present case of the Athena X-IFU instrument, which is the main topic of the present paper, they are related to passive and active solutions, as reported in the next section.
Athena [1] is an ESA large-class mission expected to be flown in L1 orbit in the mid 2030s. It will address key questions in Astrophysics, such as
- How and why does ordinary matter assemble into the structures (galaxies, galaxy groups and galaxy clusters) that we see today?
- How do black holes grow and shape their environment, as well as the cosmological evolution of the galaxies hosting them?
The observatory will house two complementary instruments: the X-IFU [2], a TES-based cryogenic array spectrometer for simultaneous high-energy resolution spectroscopy (~3 eV@7 keV) and imaging over 4′ FoV, and the WFI [3], with good energy spectral resolution (~170 eV@7 keV) and imaging over a wide 40′ × 40′ FoV. Italy is involved in both instruments, being both the co-PI of the X-IFU cryogenic instrument and responsible for supplying its cryogenic anticoincidence detector (CryoAC), thus increasing its sensitivity. The CryoAC is a 4-pixel detector made of 4 silicon-suspended absorbers sensed by Ir/Au TESes and operating at 50 mK, fully designed and developed in Italy.
The mission is currently undergoing a successful ‘design-to-cost’ redesign phase in which the payload has been revised to a more compact configuration that guarantees the scientific flagship quality of the mission.
In this paper, the following arguments will be discussed: present particle background effect assessment; the CryoAC design concept aimed at reducing such a background; CryoAC characterization: from the demonstration model (DM) to a new prototype concept; production facility status and some information about the schedule for the next activities.
2. Geant4 Simulations for X-IFU
The characterization of the instrumental particle background for such a mission is a challenging task. The standard approach is the use of Monte Carlo radiative transport simulation tools, among which Geant4 has achieved the status of reference software for this type of study. The incoming primary particles (galactic cosmic rays having energies >~100 MeV) interact with the instrument mass model (see Figure 1), which is a simplified but representative virtual model of the instrument and its environment, while the physics of the interactions is handled by a list of physical models from which the user must choose (the so-called physics list). To this aim, a dedicated physics list called “Space Physics List” [4,5] has been developed, which was created and validated against experimental results (AREMBES, ESA CTP [6]) and validated with new experimental data (EXACRAD ESA CTP [7], AHEAD2020 EU-H2020 [8]), as well as a dedicated analysis framework. Further, an extensive study to determine with high confidence the best estimates of input flux spectra, which aimed also at understanding how they affect the so-called “Non X-ray Background” (NXB), has been conducted both for high energy (GCR) and low energy (solar wind, Magnetosheat local environment, etc.) particles in L1 and L2 lagrangian points (See Ref. [9]).
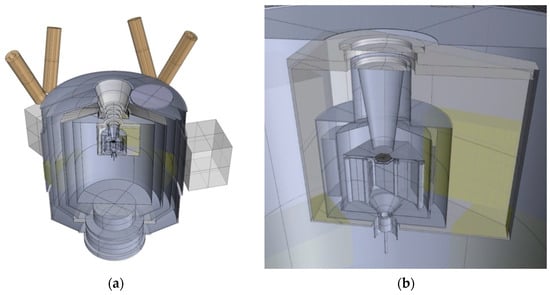
Figure 1.
The latest available X-IFU mass model (2017). (a) The cryostat. (b) The Focal Plane Assembly. Note at the center the small hexagonal detection plane made of the main sensor and the CryoAC.
The required level of the NXB is 5 × 10⁻³ cts cm−1 s−2 keV−1 (2–10 keV energy bandwidth). Without any reduction technique, the NXB is a factor ~30 above the requirement. The main residual contribution is electron secondaries emerging from the closest surface seen by the detector. By adopting a passive bi-layer made of Kapton/Gold surrounding such a surface and an active anticoincidence detection system, i.e., the CryoAC, the expected background level is (5.70 ± 0.05) × 10−3 cts cm−2 s−1 keV−1, which is ~15%, above the requirement (see Figure 2). An extensive study of the results obtained with the 2017 X-IFU configuration can be found in [9]. In this study conducted by Lotti et al. [9], we performed simulations utilizing a Kapton/Bismuth passive shielding in conjunction with the Geant4 software version 10.2. However, in the updated results presented herein (Figure 2), we have adopted the latest Kapton/Gold mass model design and upgraded to Geant4 software version 10.4 (see [10]).
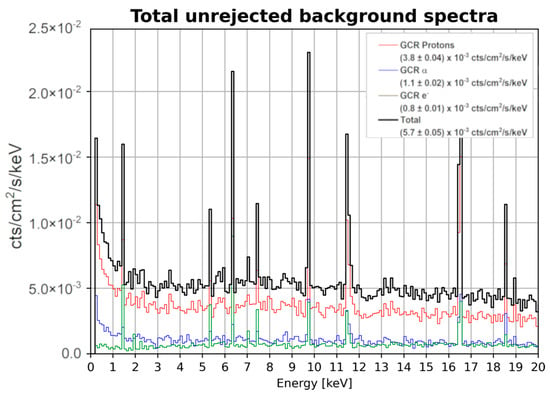
Figure 2.
The X-IFU total unrejected background spectra (i.e., the NXB) obtained with the 2017 mass model.
As an example, Figure 3 shows how the CryoAC enables scientific observation by effectively reducing the residual particle background. We have simulated the observation of a mock galaxy cluster at redshift z = 0.1 by adopting the NXB assessed by Geant4 simulations (see [9] for details). The presented case is related to a cluster pointing at 0.4 R200 (R200 is defined as the radius within which the mean density is 200 times the critical density of the Universe). Thanks to the presence of the CryoAC, it is possible to determine the continuum up to ~7–8 keV, which is essential for measuring cluster temperature.
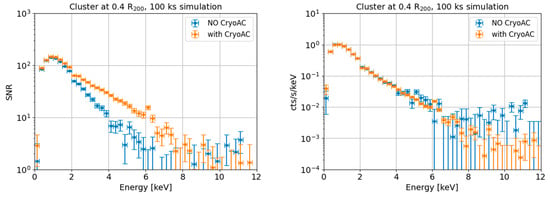
Figure 3.
Effectiveness of the CryoAC. Simulated cluster spectra referred to the 100 ks equivalent time simulation pointing at 0.4·R200. Blue data are for “no CryoAC” case, while orange data are for “with CryoAC” one. Left—signal-to-noise ratio. Right—cluster spectra. It is evident that the CryoAC extends the scientific band from ~4 to ~7–8 keV, which is essential for measuring cluster temperature. See Ref. [9] for more details.
The newAthena re-definition study is changing the payload configuration (see Ref. [11] for outdated configuration). Specifically for X-IFU, this means that passive cooling down to 50 K could be envisaged, eliminating both the old associated active cooling and the associated cryogenic radiation shields. Further, new main detector TES array absorbers layout and materials have also been implemented [10]. An assessment of the new configuration has been carried out, showing no degradation of the NXB. In this respect, a simulation based on GCR proton was performed (they generate ~80% of the unrejected content in the NXB, so protons are a sort of litmus test) and, as shown in Figure 4, a slight decrease was recorded (at ~3 sigma statistics; by removing external cryostat layers, there is less matter to produce secondaries).
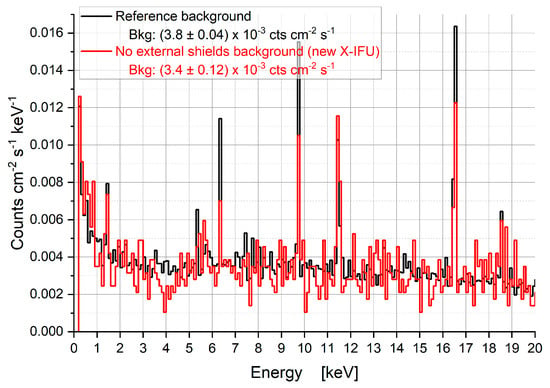
Figure 4.
GCR protons unrejected spectra: comparison of the updated shielding configuration for newAthena (red) with the reference 2017 X-IFU configuration (black).
As geometry is updated, Geant4 simulations will be updated accordingly, thus providing new assessment of the X-IFU NXB.
3. CryoAC Design Concept: A Detector Aimed at Reducing the Particle Background
In parallel with the background evaluation at the main detector TES array level, Geant4 simulations are also mandatory for the design of the CryoAC detector to meet the scientific requirements. We remind the reader that, since the NXB requirement is reached by adopting an active anticoincidence detection system, the CryoAC mass model (i.e., size, geometry, material, distance from the main detector, etc.) is a fundamental part of the Geant4 X-IFU mass model. Progress on the design concept and associated trade-off study are shown in this manuscript. A more comprehensive discussion of the CryoAC instrument requirements, detector specifications and fabrication process are detailed elsewhere [11,12].
Since the main detector is not able to distinguish between target X-ray photons and background particles, the Focal Pane Assembly (FPA) hosts a Cryogenic AntiCoincidence detector placed at less than 1 mm below the TES array absorbers, as schematically shown in Figure 5.
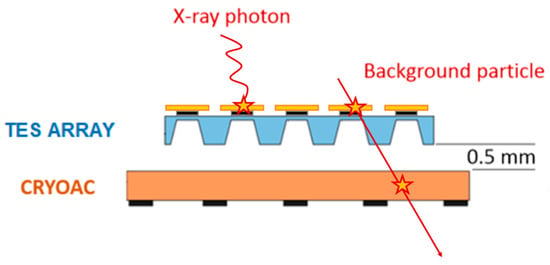
Figure 5.
Scheme showing the layout of the CryoAC to TES array: the small rectangles are the TES, while the elements in cyan and orange are the Si wafers on which the TES are deposited. As X-ray photons are absorbed with high efficiency in the main detector, a background particle crosses both and deposits energy in the CryoAC. Having acquired the event time tagging of such a particle from both the main sensor and the CryoAC detection system, a flag can be raised to veto on-ground such a particle, eliminating it from the scientific data. The thickness of the TES array wafer is less than 0.5 mm.
The proximity of the CryoAC to the TES array forces the CryoAC to be cryogenic.
The outcome of Geant4 simulation merged with X-IFU system constraints generate the requirements shown in Table 1.

Table 1.
CryoAC requirement and system constraint.
Such requirements motivated a concept design based on the following guidelines and specifications shown in Table 2:

Table 2.
CryoAC detector specifications. Some parameters are still TBC due to both the newAthena design and the CryoAC ongoing study.
- Four bridged-suspended Si absorbers to have a well-controlled “G” thermal conductance;
- Ir/Au TESes on each absorber surface;
- Distance from TES array <1 mm;
- Pt Heaters deposited onto the absorber to increase its temperature.
- ○
- to decrease bias currents, thus limiting both power dissipation and magnetic coupling effects to the main detector TES array (to be traded-off with Rshunt bias circuit shunt resistance);
- ○
- Detector diagnostics, energy calibration.
Note that a spectroscopic detector is not required. What is required is a low energy threshold (at 5 sigma baseline noise) of ~5 keV to guarantee the detection efficiency thus enabling the compliance of the NXB requirement.
When a particle interacts with a detector, the detector absorbs part of its energy, and this absorption creates athermal excitations within it. Subsequently, inelastic scattering thermalizes these excitations and the detector cools to equilibrium (so called “thermal equilibrium”) [13,14,15]. Thus, the thermal signal rises once the athermal one decays. If the mean-free path of the athermal is higher than the distance between the hitting point and the TES, then the athermal can release energy into the TES, quickly heating its electron gas and thus generating the electric pulse (see Figure 6).
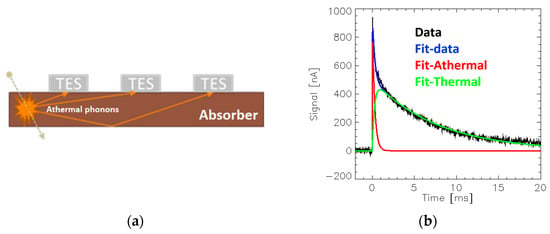
Figure 6.
(a) The athermal phonons, having mean free path higher than the distance between the hitting point and the TESes, can reach them, thus depositing energy and generating the electric pulse (athermals directly deposit energy inside the TES electron gas by means of the electron-phonon conductance): in this reported “academic” example, no athermal is lost having hit all the TES. (b) Example of athermal (red line) and thermal pulse (green line): the athermal one is the first and quickest pulse produced. Blue line is the fit to the data, while in black there are the experimental data.
The cryogenic detectors used for Cold Dark Matter search typically use athermal to perform energy spectroscopy because their high thermal capacity (i.e., the absorber mass) used to increase detection efficiency of WIMPs etc. greatly slows down their thermal time constant [16,17,18].
Our idea has been so far to use athermal phonons while producing a fast signal as a trigger to veto the particles hitting the TES array [19,20,21,22,23]. The challenge up to now has been to wallpaper one absorber surface with TESes, following a scheme as provided by simulation and the literature, to efficiently collect such athermal bunches, thus shaping the produced pulse well, sometimes also using Al fingers to improve the collection efficiency. As shown in Figure 6, from the athermal point of view, it works as a “surface” detector and, in this case, it is important to collect the athermal bunches generated by each energy deposition. Indeed, the possibility of capturing the signal of athermal phonons well is limited to a region close to the point of interaction due to scattering processes etc. Usually, a TES network helps to increase such a collecting efficiency. In case of a wide absorber surface, in order to not increase the detector thermal capacity too much due to the sum of all the TES capacities, which thereby increases its time constant then the detector deadtime, Al fingers are used (usually called phonon collectors or quasi-particle traps). The demonstration model (DM) developed to verify the detector concept and its critical technologies in combination with the DM-TES array in working condition represented for a long time the compendium of all our knowledge (see Figure 7 and [12,24,25]).
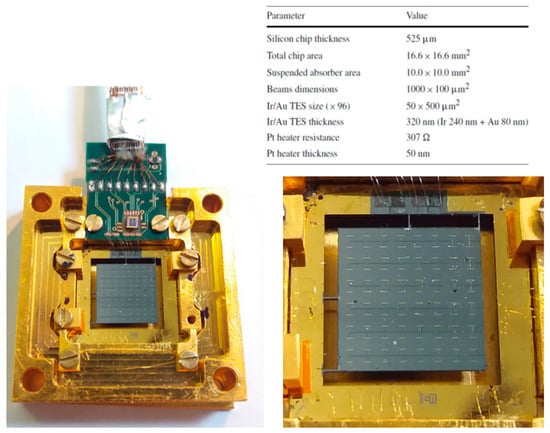
Figure 7.
CryoAC demonstration model. The TES pitch is ~1 mm.
To properly measure the thermal parameter of the detector, without being affected by its athermal response, months ago we produced a prototype (DM#127, see Figure 8) featured by a single wide TES, whose area is the sum of all the TESs in the DM. The absorber, made of silicon 500 μm thick and 1 cm2 wide, has been hit by photons very far and very close to the TES, thus probing the response of the detector under rather opposite working conditions.
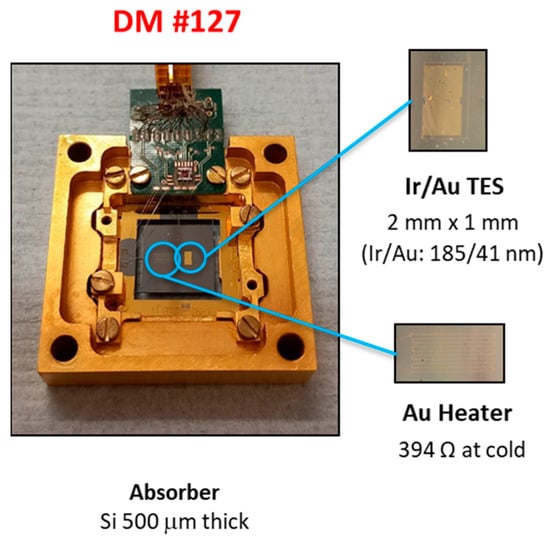
Figure 8.
DM-like detector #127.
The test results reported in the next section have been very promising and helped a lot in understanding the athermal/thermal dynamics, given also the presence of the on-chip heater creating pure thermal pulses.
3.1. Illumination by 6 keV Photons (55Fe)
The first test carried out has been to illuminate the detectors by 6 keV (55Fe) photons at “Center front” and “Corner rear” position to probe its response from hitting point very close and very far from the TES (see Figure 9).

Figure 9.
Lighting configuration. The stars indicate the points of photon impact.
Since 6 keV photons are absorbed in Si in less than 100 μm and the absorber thickness is 500 μm, by the “Center front” configuration, being very close to the TES, we maximize the interaction of athermals with the TES. Instead, in the “Corner rear” with one being quite distant, photons have very low probability to reach the TES, thus cannot create athermals very close to it. In this configuration, we then expect that the detector behaves like a thermal one. Here, we report some highlights justifying the change of the detector design. More details can be found in [26].
The following Figure 10 and Figure 11 show the 55Fe spectrum produced by the detector and the rise time distribution of the acquired pulses in the two different illumination conditions. The on-chip heater has been used to inject a pure thermal calibration pulse: the overlap of the line in the two different configurations guarantees to have the same TES working point during the different data acquisitions.
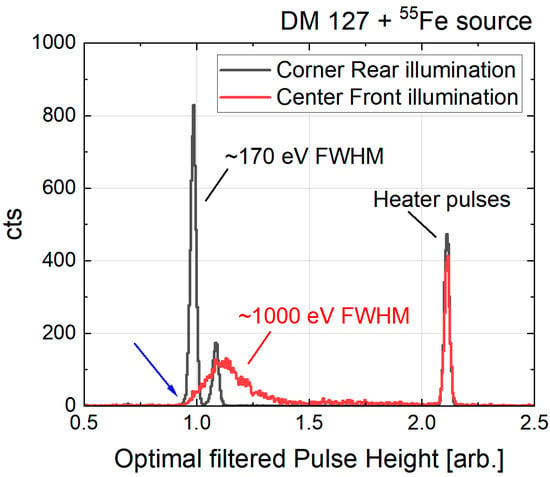
Figure 10.
55Fe spectrum (1 is ~6 keV) produced by the detector in the two different illumination conditions. The heater pulse is recorded for diagnostic. The blue arrow highlights that both the spectra rise at the same point.
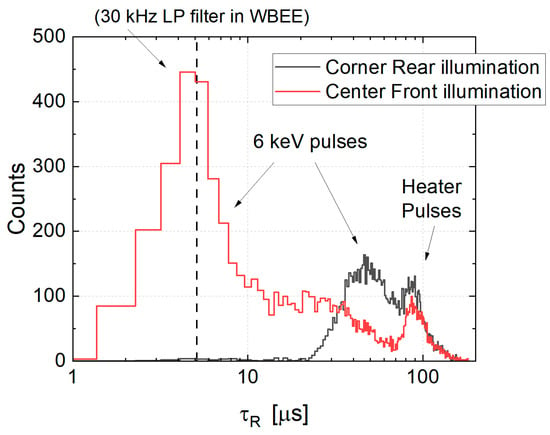
Figure 11.
Rise time constant distribution of the acquired pulses in the two different illumination points. In the “Center Front illumination”, the electronics LP filter limits the value at ~5 μs.
As far as the 55Fe spectrum is concerned, we detect well-shaped Kα and Kβ lines in the “Corner rear” illumination; on the contrary, in the “Center front”, such a spectroscopic capability is lost. From the thermal point of view, the detector works very well, from the athermal point of view, it is instead not able to collect all such athermal bunches well, and thus not able to obtain well-shaped lines. This result is expected because the surface is not well covered by a TES network, which would guarantee high efficiency for athermal collection [21]. Further, both the spectra rise at the same point, as shown by the arrow. On the other hand, with the “Center Front” illumination, the pulses are on average higher than the ones with the “Corner Rear”. This is evidence of the additional athermal component in the signal. This is quite an important result because being the low energy threshold, which is an important parameter for retrieving the NXB requirement (the lower such a threshold, less particles are missed), we can use a “thermal model” to design the CryoAC detector, which is much less complicated then the athermal one.
As far as the rise time distribution is concerned, the presence of the athermals that is well identified by the shift of the 6 keV pulses (i.e., due to the 55Fe source) from ~50 μs to ~5 μs is evident. Since the heater pulses line is at the same position for both the tested configurations, the quickest response from the detector is the signature of the athermals. Given the acquired value of the thermal rise time constant (τR~50 μs) and the expected in-orbit count rate (primaries and secondaries, see [9]), by applying the pulse extraction technique implemented in the Warm Back End Electronics (WBEE) trigger logic algorithm [27], we have verified the compliance with both the deadtime and time-tagging accuracy requirement.
All in all, we record the worst energy resolution but higher pulse height and faster pulses rise using athermal phonon. Instead, by considering thermal phonon, we can develop a conservative CryoAC detector design for both energy threshold and deadtime.
For completeness, it is worth of noticing that we also have more details in [26]:
- We stimulated the detector by 241Am (shielded source to illuminate the chip by only ~60 keV photons) and recorded both a nice energy resolution (<1 keV@60 keV) and the Compton continuum down to less than 10 keV (compliant with results from Geant4 simulation);
- We validated the detector energy calibration by an on-chip heater (0.5 keV accuracy up to 60 keV) against 6 keV photons (55Fe) and ~60 keV photons (241Am).
Given the interesting results of the DM#127 prototype, we have compared them against our demonstration model and CryoAC requirements, as shown in the following Table 3.

Table 3.
Comparison of test results from DM#127 and DM against the CryoAC requirement. The main difference between the detectors is that the DM is featured by a TES network made of 96 sensors in parallel connected while the DM#127 has just 1 TES whose area is the sum of the 96 DM TES.
The main outcome from Table 3 is that, by the DM#127 prototype, we are obtaining good results by working with a pure thermal configuration. In term of detector design, this implies a simplified TES network (efficient athermal collection not necessary, see Section 3.2), lower bias current and thermal dissipation.
3.2. Phonon Physics Investigation: Simulation of Athermal Phonons
An extensive investigation on athermal phonons physics has also been performed by our team in the last years, as they are peculiar for our kind of detector (more details in [28,29]). Beyond the potential use of such a prompt as a trigger for particle veto, athermals are produced; therefore, it is important to understand how they evolve in terms of both a space and energy point of view against their characteristics time. Phonons at a Debye frequency of 15 THz have been injected in the middle of a Si slab, having area 1 cm2 and 500 µm thickness. The processes entered into the simulation are anharmonic and isotopic decay.
The parameters entered for silicon in the simulation are anharmonic constant (1.2 × 10−55 s−1), longitudinal (9 × 10³ m/s) and transverse (5.42 × 10³ m/s) velocities. The simulation also generates decay, i.e., it produces “daughter” phonons that take other directions than the parent ones.
From Figure 12, it is possible to see that in the first tens of ns, high-frequency phonons are distributed in a small region around the injection point. After 10 μs, the phonon distribution is instead uniform with energy equivalent to a Planckian at 10 K, which is still not in thermal equilibrium with the absorber (which is at the thermal bath temperature ~50 mK), but uniformly distributed in its volume. The two extreme cases show an interesting dynamic: quite narrow phonons diffusing at ~20 ns shows that it is mandatory to wallpaper the absorber detector to efficiently detect the high-frequency phonons on such timescales (look at the plume size ~0.1 mm on a side of 10 mm). A uniform phonon diffusion after 10 μs shows that, after such a timescale, it is not necessary to deposit a dense TES network to collect phonons (the detector absorber being 500 μm thick it is very thin with respect to the phonon mean free path at 1 THz which is ~1 cm).
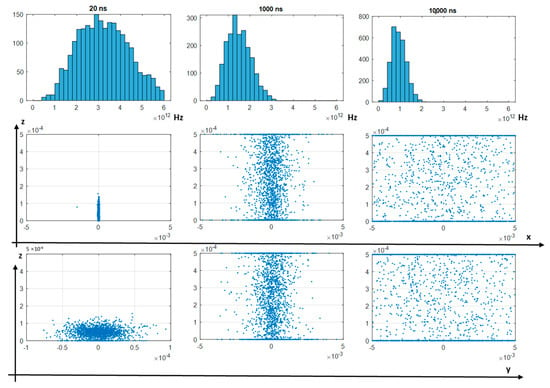
Figure 12.
Top—Phonon energy distribution at 20 ns, 1000 ns and 10,000 ns since the primary injection (x axis in frequency). Middle and bottom—Space distribution of phonons on x-z and y-z planes (x, y and z axes in meter). The scale in the bottom left plot is 10 times higher than the other ones: it has been adopted to show the initial spread since 20 ns the primary injection.
This evidences, merged with the detector performances summarized in Table 3, in particular the time-tagging accuracy requirement (see Table 1) complied thanks to a very efficient trigger algorithm [27] applied on time scales which were not as quick as the one produced by the thermal phonons (ms order), have shown us that it is not mandatory to pursue a complicated detector design to be compliant with the requirements.
This allows us to fine tune the thermal and athermal signal parts to design the CryoAC with fewer TES per cm2, without affecting the anticoincidence capability and gaining in spectroscopic capability (the last feature is just an added value as it not required). Few TESes simplify the detector production process: this design choice reduces wiring deposition criticalities, the detector bias current and its thermal dissipation. In brief, in the newAthena context, this detector simplification can provide a more robust design.
3.3. Present CryoAC Concept
Due to optimization between kilo-pixel array and instrument field of view, the main detector will have a hexagonal layout; thus, the CryoAC will adopt the same geometry.
The present CryoAC 50 mK assembly concept is reported in Figure 13. It consists of a copper structure on which the detector chip is glued on flexures to follow the thermal contractions of the materials involved due to a different CTE (coefficent of thermal expansion) from warm to cryogenic temperatures, and the PCB (printed circuit board) with Cold Front End Electronics (CFEE) (SQUIDs Superconductive Quantum Interference Device, temperature sensor, rigid-flex for electrical connections) which are screwed on.
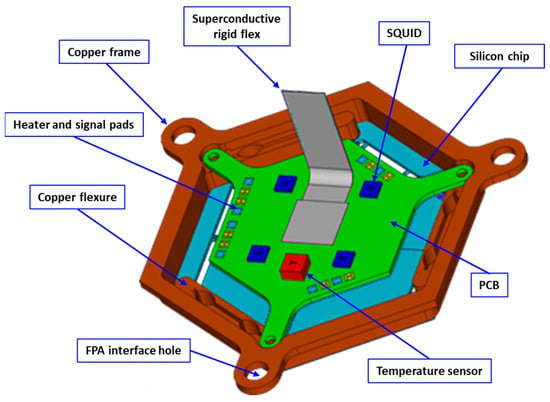
Figure 13.
CryoAC 50 mK assembly concept.
Given the requirements and specifications in Table 1 and Table 2, the present design assumes that the CryoAC detector chip is built as four identical trapezoidal pixels, with each one connected to the silicon rim by four bridges per pixel in order to realize the thermal conductance to the thermal bath. However, there is an ongoing study to trade off this baseline with respect to a monolithic geometry to see pro and cons in terms of detector responsivity, rejection efficiency, deadtime, robustness, thermal capacity, absorber inhomogeneity (see Figure 14).

Figure 14.
Baseline: segmented absorber layout (Left) to be traded off with a monolithic one (Right). Note the silicon bridges realizing the thermal conductance and the suspended absorber(s).
Given the conclusion reported in the previous subsection, a reduction of the TES number to be deposited could change our previous design, as shown in Figure 15.

Figure 15.
The previous TES distribution (Left) vs. the new one (Right) to be studied (few per pixel).
The TES number and position have to be traded off against the bridge position (i.e., the peculiar point where the heat flows to the thermal bath), inhomogeneity in the bilayer IrAu deposition over the wide absorber(s) and the absorber(s) temperature gradient (the last two cases could affect the TES critical temperature).
With the monolithic vs. four pixel philosophy, the following steps have to be carried out towards the final CryoAC design:
- Thermal validation to verify the effect on the low energy threshold and deadtime (i.e., saturation energy) of the monolithic option not yet closed (such quantities are affected by the thermal capacity being four times of each single pixel related to the segmented layout). Given the results from DM#127 (see also [26]), starting from more than one order of magnitude, we are now at a factor of few as accuracy between data and model, but we need a new sample to confirm our model. The thermal validation model (remember that the CryoAC mainly works outside the small signal approximation) is necessary to assess
- ○
- Silicon beams aspect ratio to comply with the deadtime requirements (it affects the thermal conductance, thus the time constant);
- ○
- S/N ratio to comply with the low energy threshold, then the rejection efficiency and the NXB (the detector thermal capacity affects the energy resolution)
- ○
- Shunt resistors value and optimal bias current to comply with power dissipation requirements (the shunt resistor affects the TES voltage bias quality then the detector ElectroThermal Feedback)
- Experimental test on wide absorber area (>1 cm2) to verify effects on absorber thermal inhomogeneity:
- ○
- Absorber thermal capacity: an increase in the absorber thermal capacity can increase the thermal rise time constant and decrease its temperature variation after energy deposition. Deadtime vs. low-energy threshold needs to be investigated;
- ○
- TES aspects: it is necessary to guarantee deposition homogeneity of TES over several cm2 absorber area to avoid position dependence of the critical temperature and negligible thermal gradient over wide area. Activity not yet started.
- How many TESs are necessary to deposit per pixel? We have to produce chip to better understand the behavior, but from simulation on phonon physics we have a guide;
- Being that the CryoAC assembly is stressed by vibration during the rocket launch phase, structural models (SMs) have to be produced to assess, by experimental test, how the vibration load at assembly level affects its performance (break, etc.). This activity is divided in three phases:
- ○
- “SM0” which is only the silicon hexagonal chip, both monolithic and segmented, glued on an interface to retrieve starting information from the chip behavior under vibration (this is a “zero” level activity to understand the response of the chip alone);
- ○
- “SM1” has the same chip geometry but is glued on a hexagonal supporting structure (see Figure 13) and does not have a representative interface with the FPA (this assembly has been designed by taking into account an old allocated envelope provided by the FPA team, and it has been analyzed by FEM [30])
- ○
- “SM2” has the same chip geometry glued on a hexagonal supporting structure but has a representative mechanical, electrical and thermal interface with the FPA.
At present, by merging the SM0 test result [31] and the SM1 structural analysis, the monolithic layout seems slightly better as expected, though the segmented one has also passed the test. The SM1 testing activity, to be performed by the end of 2023, is mandatory to verify if the gain resonance of such a layout is still outside the critical frequency range when the chip is glued on a more representative mechanical structure (SM0 monolithic measured f = 3 kHz, while the edge of the vibration mask is 2 kHz).
It is worth noting that only the first main bullet is related to “critical technology validation” activity, while the other ones are related to the “design”. At present, our priority is the “critical technology validation” as requested by the prime (CNES) to achieve TRL5 [32].
For completeness, we conclude this subsection by summarizing the main stages of the CryoAC instrument shown in Figure 16. Such a scheme is the result of a deep study complying to the CryoAC cold- and warm-stage instrument requirements derived from the system in terms of redundancy philosophy, thermal dissipation, mechanical, electrical and thermal interfaces.
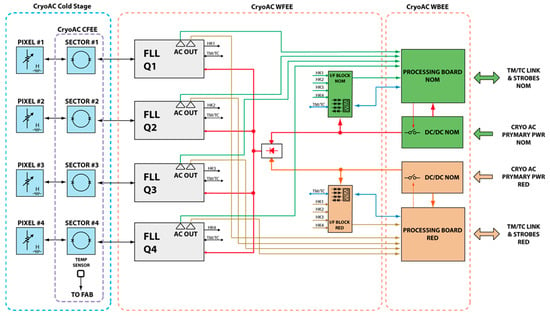
Figure 16.
CryoAC functional block diagram.
It is possible to distinguish three functional blocks:
- Cold stage: Four TESes pixels with CFEE composed by four SQUID to readout each TES and a thermometer to measure the PCB temperature. This is the cryogenic assembly cooled down to 50 mK;
- WFEE (warm front-end electronics) divided in four quadrants: each one provides bias to TES and SQUID of a single pixel and produces the analog scientific signal (AC OUT) and the housekeepings. SQUID are read out in a standard FLL (flux locked loop, see [33] and Ref. therein) readout (no multiplexing technique is necessary given the very low TES number to be read out);
- WBEE in nominal and redundant boards: each one processes and digitizes the signal from the WFEE into packets of data to be sent to the instrument control unit. Veto operation will be performed on ground, given the expected modest TeleMetry rate.
4. Critical Technologies: The Steps to Enable CryoAC Detector Production
Samples produced in last years and related studies compared with the CryoAC requirements have highlighted the necessity of major upgrades of the laboratory in terms of production instrumentation. We verified that many issues could not be overcome by temporary actions; moreover, we faced instability in the sample results linked to lack of or limitations of monitoring during production.
The main solution has been the upgrade of the production facilities by improving the instrumentation, technical services and installing one more clean room (ISO7) inside which operates some production machine (we have recorded that particulate contamination affected some prototypes from the functional point of view). Further, we enlarged the old one ISO6 yellow room (where critical processes take place) by adding an ISO6 white room.
The main actions planned are in the following areas, which in turn will affect the update of the production plant:
- Chip/film processes (Etching, Ir/Au TES, Nb/SiO2/Nb stripline)
- Film growth (Ir uniformity and on-site quality monitoring, Nb and Au cross interference, SiO2 isolation)
- Environmental particulate contamination (Clean Room over the film growth & test area, Connection to Lithography Clean Room)
In regard to chip/film processes, the reactive ion etcher with inductive coupled plasma (RIE-ICP) for film processing has been improved by adding an adjustable temperature reaction plate (−100 °C to +250 °C) to enable process optimization. Further, thanks to this RIE upgrade, the use of resist “soft” masks that improved excavation quality compared to our previous Al/SiO2 thinner “hard” masks has provided quite clean test structures. For an example on the excavation quality, see Figure 17: observe the differences in cleanliness on the etching faces, which result in more regular trench walls.
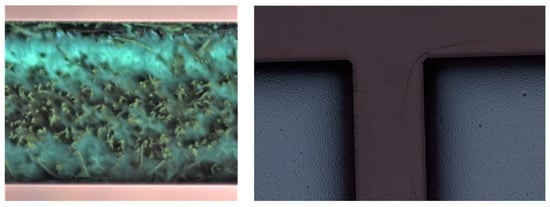
Figure 17.
Comparison between old (Left, magnification ×400) and new excavation process (Right, magnification ×1000). The clean quality is evident.
In the context of film growth, an UHV elliptic chamber has been used to interface, in a “star” configuration, the thin-film deposition system previously mounted in a linear configuration. In the previous configuration, the sample insertion chamber (vac-lock) did not directly reach the e-beam chamber but through the sputtering chamber of the Nb, thus forcing us to a repeated training of the Nb deposition chamber to achieve the required level of contamination. The system now has the classic configuration of a thin-film deposition cluster with a vac-lock chamber that allows sample insertion, and a vacuum manipulator that brings the sample into the deposition chambers all separated from each other. This lowers the levels of cross-contamination since none of the chambers are open when another one is (see Figure 18).
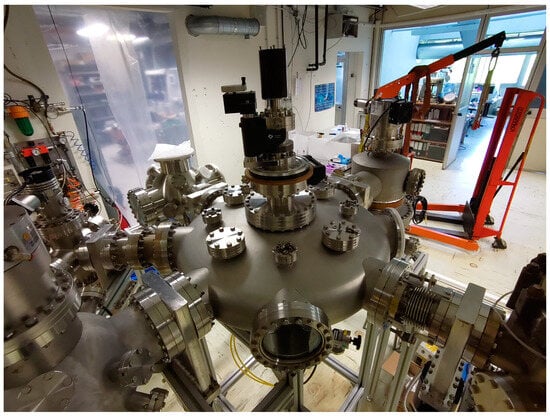
Figure 18.
The new cluster configuration of the deposition system during assembly before the mounting of the modular ISO7 clean room. The UHV elliptic chamber is in the photo center.
Lastly, regarding the clean room, the improvement in controlling the particulate contamination changed the production facility layout as shown in Figure 19. It is important to ensure that the films have very low levels of impurities, as their superconducting properties, such as the transition temperature, can be significantly affected. The critical superconducting temperature of iridium (Tc) is strongly dependent on contamination during deposition; for example, the presence of one part per million of ferromagnetic atoms suppresses superconductivity.
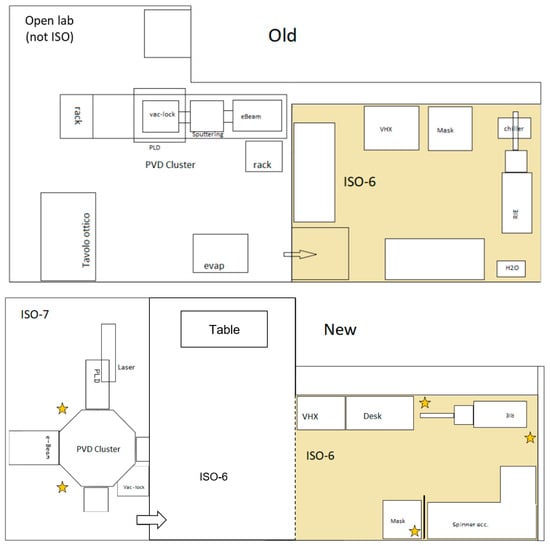
Figure 19.
Layout of the production facility. TOP—Old configuration. BOTTOM—New configuration.
At present, our goal is to restart the production process by having the full facility in working configuration by Q4 2023.
5. Conclusions
In this paper, a program overview of the Cryogenic Anticoincidence detector for the newAthena X-IFU instrument has been presented.
Emphasis has been put on how the CryoAC design could change after recent results from the DM#127 prototype, showing a more simple, then robust direction. This prototype, working in thermal regime, is nearly compliant with CryoAC requirements; only a scaling of the Si bridges aspect ratio to adjust the thermal conductance, then the decay time constant, seems necessary to be fully compliant.
At present, our CryoAC concept is still a segmented device on four pixels and four readout chains as the old baseline, but each pixel having on-board one or fewer TES. By the end of 2023, the SM1 vibration test activity on both the configurations will provide further information to be included in the trade-off study.
The upgrade of the fabrication facilities is close to the end. By Q4, 2023, the production process is expected to restart by having the full facility in working configuration.
The most important activity to be closed in 2023–early 2024 are
- Single process procedure consolidation (bi-layer deposition, TES RIE, Si Deep RIE);
- Closure of the thermal and athermal validation;
- CryoAC rejection efficiency measurement at a beam test facility (tentatively BTF@Frascati);
- SM1 activity.
Our effort by 2024 will be focused on the process procedure validation and sample test, as discussed in Section 3.3.
Author Contributions
Writing—original draft, C.M.; Writing—review & editing, C.M., M.D., S.L., L.F.B. and P.B.; Visualization, A.A., G.M., L.P., C.B., E.C. (Edvige Celasco), G.G., F.G., D.G., M.R., F.C., G.T., M.F., M.U., D.B., E.C. (Elisabetta Cavazzuti), S.P. and A.V. All authors have read and agreed to the published version of the manuscript.
Funding
This research is funded by ASI (Italian Space Agency) grant number 2015-046-R.0, 2018-11-HH.0, 2019-27-HH.0, 2021-23-I.0, and ESA (European Space Agency) Core Technology Program (CTP) grant number 4000116655/16/NL/BW, 4000114932/15/NL/BW.
Data Availability Statement
The data that support the findings of this study are available from the corresponding author upon reasonable request.
Acknowledgments
INAF HQ and INAF/IAPS Roma are acknowledged to support the CryoAC program since the Athena selection as Large Mission from ESA. The authors thank the Organizing Committee of the High Precision X-ray Measurement 2023 workshop for having provided the opportunity to present both Athena and the CryoAC program. An industrial contract between ASI and Thales Alenia Space Italia S.p.A. is at present in place to support the CryoAC activities in a “Space” context, in particular to design and produce an advanced model of the WFEE.
Conflicts of Interest
Author Paolo Bastia was employed by the company Thales. The remaining authors declare that the research was conducted in the absence of any commercial or financial relationships that could be construed as a potential conflict of interest.
References
- Nandra, K.; Barret, D.; Barcons, X.; Fabian, A.; Herder, J.W.D.; Piro, L.; Watson, M.; Adami, C.; Aird, J.; Afonso, J.M.; et al. The Hot and Energetic Universe: A White Paper presenting the science theme motivating the Athena+ mission. arXiv 2013, arXiv:1306.2307. [Google Scholar] [CrossRef]
- Barret, D.; Albouys, V.; Herder, J.W.D.; Piro, L.; Cappi, M.; Huovelin, J.; Kelley, R.; Mas-Hesse, J.M.; Paltani, S.; Rauw, G.; et al. The Athena X-ray Integral Field Unit: A consolidated design for the system requirement review of the preliminary definition phase. ExpA 2023, 55, 373–426. [Google Scholar] [CrossRef]
- Meidinger, N.; Albrecht, S.; Beitler, C.; Bonholzer, M.; Emberger, V.; Frank, J.; Lederhuber, A.; Müller-Seidlitz, J.; Nandra, K.; Oser, J.; et al. Development status of the wide field imager instrument for Athena. Proc. SPIE 2020, 11444, 114440T. [Google Scholar] [CrossRef]
- Advanced Example Xray_TESdetector. Available online: https://geant4.web.cern.ch/docs/advanced_examples_doc/example_xray_TESdetector (accessed on 1 September 2023).
- Advanced Example Xray_SiliconPoreOptics. Available online: https://geant4.web.cern.ch/docs/advanced_examples_doc/example_xray_SiliconPoreOptics (accessed on 1 September 2023).
- AREMBES Overview. Available online: https://indico.esa.int/event/304/contributions/5116/attachments/3697/5147/arembes_overview.pptx (accessed on 1 September 2023).
- The EXACRADProject in Context. Available online: https://indico.esa.int/event/324/contributions/5100/attachments/3806/5346/molendi_TEC-EPS_ESTEC_12_19.pdf (accessed on 1 September 2023).
- AHEAD. Available online: https://ahead.iaps.inaf.it/ (accessed on 1 September 2023).
- Lotti, S.; D’Andrea, M.; Molendi, S.; Macculi, C.; Minervini, G.; Fioretti, V.; Laurenza, M.; Jacquey, C.; Piro, L. Review of the Particle Background of the Athena X-IFU Instrument. Astrophys. J. 2021, 909, 111. [Google Scholar] [CrossRef]
- Lotti, S.; D’Andrea, M.; Macculi, C.; Piro, L.; Kilbourne, C.; McCammon, D.; Kraft, R. Benefits of the use of Monte Carlo simulations in cryogenic detectors design. J. Low Temp. Phys. 2023; in preparation. [Google Scholar]
- Macculi, C.; Argan, A.; Brienza, D.; D’Andrea, M.; Lotti, S.; Minervini, G.; Piro, L.; Biasotti, M.; Barusso, L.F.; Gatti, F.; et al. The Cryogenic AntiCoincidence detector for ATHENA X-IFU: Advancement in the project. Proc SPIE 2020, 11444, 114444A. [Google Scholar] [CrossRef]
- Biasotti, M.; Boragno, C.; Ferrari Barusso, L.; Gatti, F.; Grosso, D.; Rigano, M.; Siri, B.; Macculi, C.; D’Andrea, M.; Piro, L. The Phonon-Mediated TES Cosmic Ray Detector for Focal Plane of ATHENA X-Ray Telescope. J. Low Temp. Phys. 2020, 199, 225–230. [Google Scholar] [CrossRef]
- Martinez, M.; Cardani, L.; Casali, N.; Cruciani, A.; Pettinari, G.; Vignati, M. Measurements and Simulations of Athermal Phonon Transmission from Silicon Absorbers to Aluminum Sensors. Phys. Rev. Appl. 2019, 11, 064025. [Google Scholar] [CrossRef]
- Kozorezov, A.G.; Lambert, C.J.; Bandler, S.R.; Balvin, M.A.; Busch, S.E.; Nagler, P.N.; Porst, J.P.; Smith, S.J.; Stevenson, T.R.; Sadleir, J.E. Athermal energy loss from X-rays deposited in thin superconducting films on solid substrates. Phys. Rev. B 2013, 87, 104504. [Google Scholar] [CrossRef]
- Lindeman, M. Microcalorimetry and the Transition-Edge Sensor. Ph.D. Thesis, University of California, Davis, CA, USA, 2000. Available online: https://www.osti.gov/servlets/purl/15009469 (accessed on 1 September 2023).
- Agnese, R.; Anderson, A.J.; Aralis, T.; Aramaki, T.; Arnquist, I.J.; Baker, W.; Balakishiyeva, D.; Barker, D.; Thakur, R.B.; Bauer, D.A.; et al. Low-mass dark matter search with CDMSlite. Phys. Rev. D 2018, 97, 022002. [Google Scholar] [CrossRef]
- Petricca, F.; Angloher, G.; Bauer, P.; Bento, A.; Bucci, C.; Canonica, L.; Defay, X.; Erb, A.; Feilitzsch, F.; Iachellini, N.F.; et al. First results on low-mass dark matter from the CRESST-III experiment. arXiv 2017, arXiv:1711.07692. [Google Scholar] [CrossRef]
- Adams, D.Q.; Alduino, C.; Alfonso, K.; Avignone, F.T., III; Azzolini, O.; Bari, G.; Bellini, F.; Benato, G.; Beretta, M.; Biassoni, M.; et al. Search for neutrinoless + EC Decay of 120 Te with CUORE-0. Phys. Rev. C 2018, 97, 055502. [Google Scholar] [CrossRef]
- Macculi, C.; Piro, L.; Colasanti, L.; Lotti, S.; Natalucci, L.; Bagliani, D.; Biasotti, M.; Gatti, F.; Torrioli, G.; Barbera, M.; et al. The Cryogenic AntiCoincidence Detector Project for ATHENA+: An Overview Up to the Present Status. J. Low Temp. Phys. 2014, 176, 1022–1032. [Google Scholar] [CrossRef][Green Version]
- Macculi, C.; Argan, A.; D’Andrea, M.; Lotti, S.; Piro, L.; Biasotti, M.; Corsini, D.; Gatti, F.; Orlando, A.; Torrioli, G. The Cryogenic AntiCoincidence Detector for the ATHENA X-IFU: Design Aspects by Geant4 Simulation and Preliminary Characterization of the New Single Pixel. J. Low Temp. Phys. 2016, 184, 680–687. [Google Scholar] [CrossRef]
- D’Andrea, M.; Macculi, C.; Argan, A.; Lotti, S.; Minervini, G.; Piro, L.; Biasotti, M.; Corsini, D.; Gatti, F.; Torrioli, G. The Cryogenic AntiCoincidence Detector for ATHENA X-IFU: Assessing the Role of the Athermal Phonons Collectors in the AC-S8 Prototype. J. Low Temp. Phys. 2018, 193, 949–957. [Google Scholar] [CrossRef]
- D’Andrea, M.; Macculi, C.; Argan, A.; Lotti, S.; Minervini, G.; Piro, L.; Biasotti, M.; Ceriale, V.; Gallucci, G.; Gatti, F.; et al. The Cryogenic Anticoincidence Detector for ATHENA X-IFU: Preliminary test of AC-S9 towards the Demonstration Model. Proc. SPIE 2018, 10699, 106994T-1. [Google Scholar] [CrossRef]
- D’Andrea, M.; Argan, A.; Lotti, S.; Macculi, C.; Piro, L.; Biasotti, M.; Corsini, D.; Gatti, F.; Torrioli, G. The Cryogenic Anti-Coincidence detector for ATHENA X-IFU: Pulse analysis of the AC-s7 single pixel prototype. Proc. SPIE 2016, 9905, 99055X-1–99055X-11. [Google Scholar] [CrossRef]
- D’Andrea, M.; Macculi, C.; Torrioli, G.; Argan, A.; Brienza, D.; Lotti, S.; Minervini, G.; Piro, L.; Biasotti, M.; Ferrari Barusso, L.; et al. The Demonstration Model of the ATHENA X-IFU Cryogenic AntiCoincidence Detector. J. Low Temp. Phys. 2020, 199, 65–72. [Google Scholar] [CrossRef]
- D’Andrea, M.; Ravensberg, K.; Argan, A.; Brienza, D.; Lotti, S.; Macculi, C.; Minervini, G.; Piro, L.; Torrioli, G.; Chiarello, F.; et al. ATHENA X-IFU Demonstration Model: First Joint Operation of the Main TES Array and its Cryogenic AntiCoincidence Detector (CryoAC). J. Low Temp. Phys. 2022, 209, 433–440. [Google Scholar] [CrossRef]
- D’Andrea, M.; Macculi, C.; Lotti, S.; Piro, L.; Argan, A.; Minervini, G.; Torrioli, G.; Chiarello, F. The TES-based Cryogenic AntiCoincidence Detector (CryoAC) of ATHENA X-IFU: A large area silicon microcalorimeter for background particles detection. J. Low Temp. Phys. 2023; in preparation. [Google Scholar]
- Chiarello, F.; Torrioli, G.; Argan, A.; D’Andrea, M.; Macculi, C.; Piro, L. Study on the trigger logic for the X-IFU Athena anticoincidence system. Proc. SPIE 2022, 12181, 1218141-1–1218141-8. [Google Scholar] [CrossRef]
- Barusso, L.F.; Boragno, C.; Celasco, E.; Fedkevych, M.; Gallucci, G.; De Gerone, M.; Grosso, D.; Repetto, L.; Niazi, K.; Rigano, M.; et al. First Configurational Study of the CryoAC Detector Silicon Chip of the Athena X-Ray Observatory. IEEE Trans. Appl. Supercond. 2023, 33, 2100207. [Google Scholar] [CrossRef]
- Ferrari Barusso, L.; Boragno, C.; Celasco, E.; Gallucci, G.; Grosso, D.; Niazi, K.; D’Andrea, M.; Macculi, C.; Torrioli, G.; Gatti, F. The signal generation in the TES-based Cryogenic AntiCoincidence Detector (CryoAC) of ATHENA X-IFU: A-thermal and thermal signal model and detection. In Proceedings of the 36th International Symposium on Superconductivity (ISS2023), Wellington, New Zealand, 28–30 November 2023. [Google Scholar]
- OHB Italia. CryoAC SM Analysis Report. ATH-RP-CGS-002, Issue 1. 2019. Available online: http://www.ohb-italia.it (accessed on 1 September 2023).
- Barusso, L.F.; Tarassi, P.; Tugliani, S.; De Gerone, M.; Fedkevych, M.; Gallucci, G.; Rigano, M.; Argan, A.; Brienza, D.; D’Andrea, M.; et al. First structural tests of the CryoAC Detector silicon chip of the Athena X-ray observatory. Nucl. Instrum. Methods Phys. Res. Sect. A 2023, 1047, 167862. [Google Scholar] [CrossRef]
- The ESA Science Technology Development Route. Available online: https://sci.esa.int/web/sci-ft/-/50124-technology-readiness-level (accessed on 1 September 2023).
- Drung, D. High-performance DC SQUID read-out electronics. Phys. C Supercond. 2002, 368, 134–140. [Google Scholar] [CrossRef]
Disclaimer/Publisher’s Note: The statements, opinions and data contained in all publications are solely those of the individual author(s) and contributor(s) and not of MDPI and/or the editor(s). MDPI and/or the editor(s) disclaim responsibility for any injury to people or property resulting from any ideas, methods, instructions or products referred to in the content. |
© 2023 by the authors. Licensee MDPI, Basel, Switzerland. This article is an open access article distributed under the terms and conditions of the Creative Commons Attribution (CC BY) license (https://creativecommons.org/licenses/by/4.0/).