Figure 1.
(
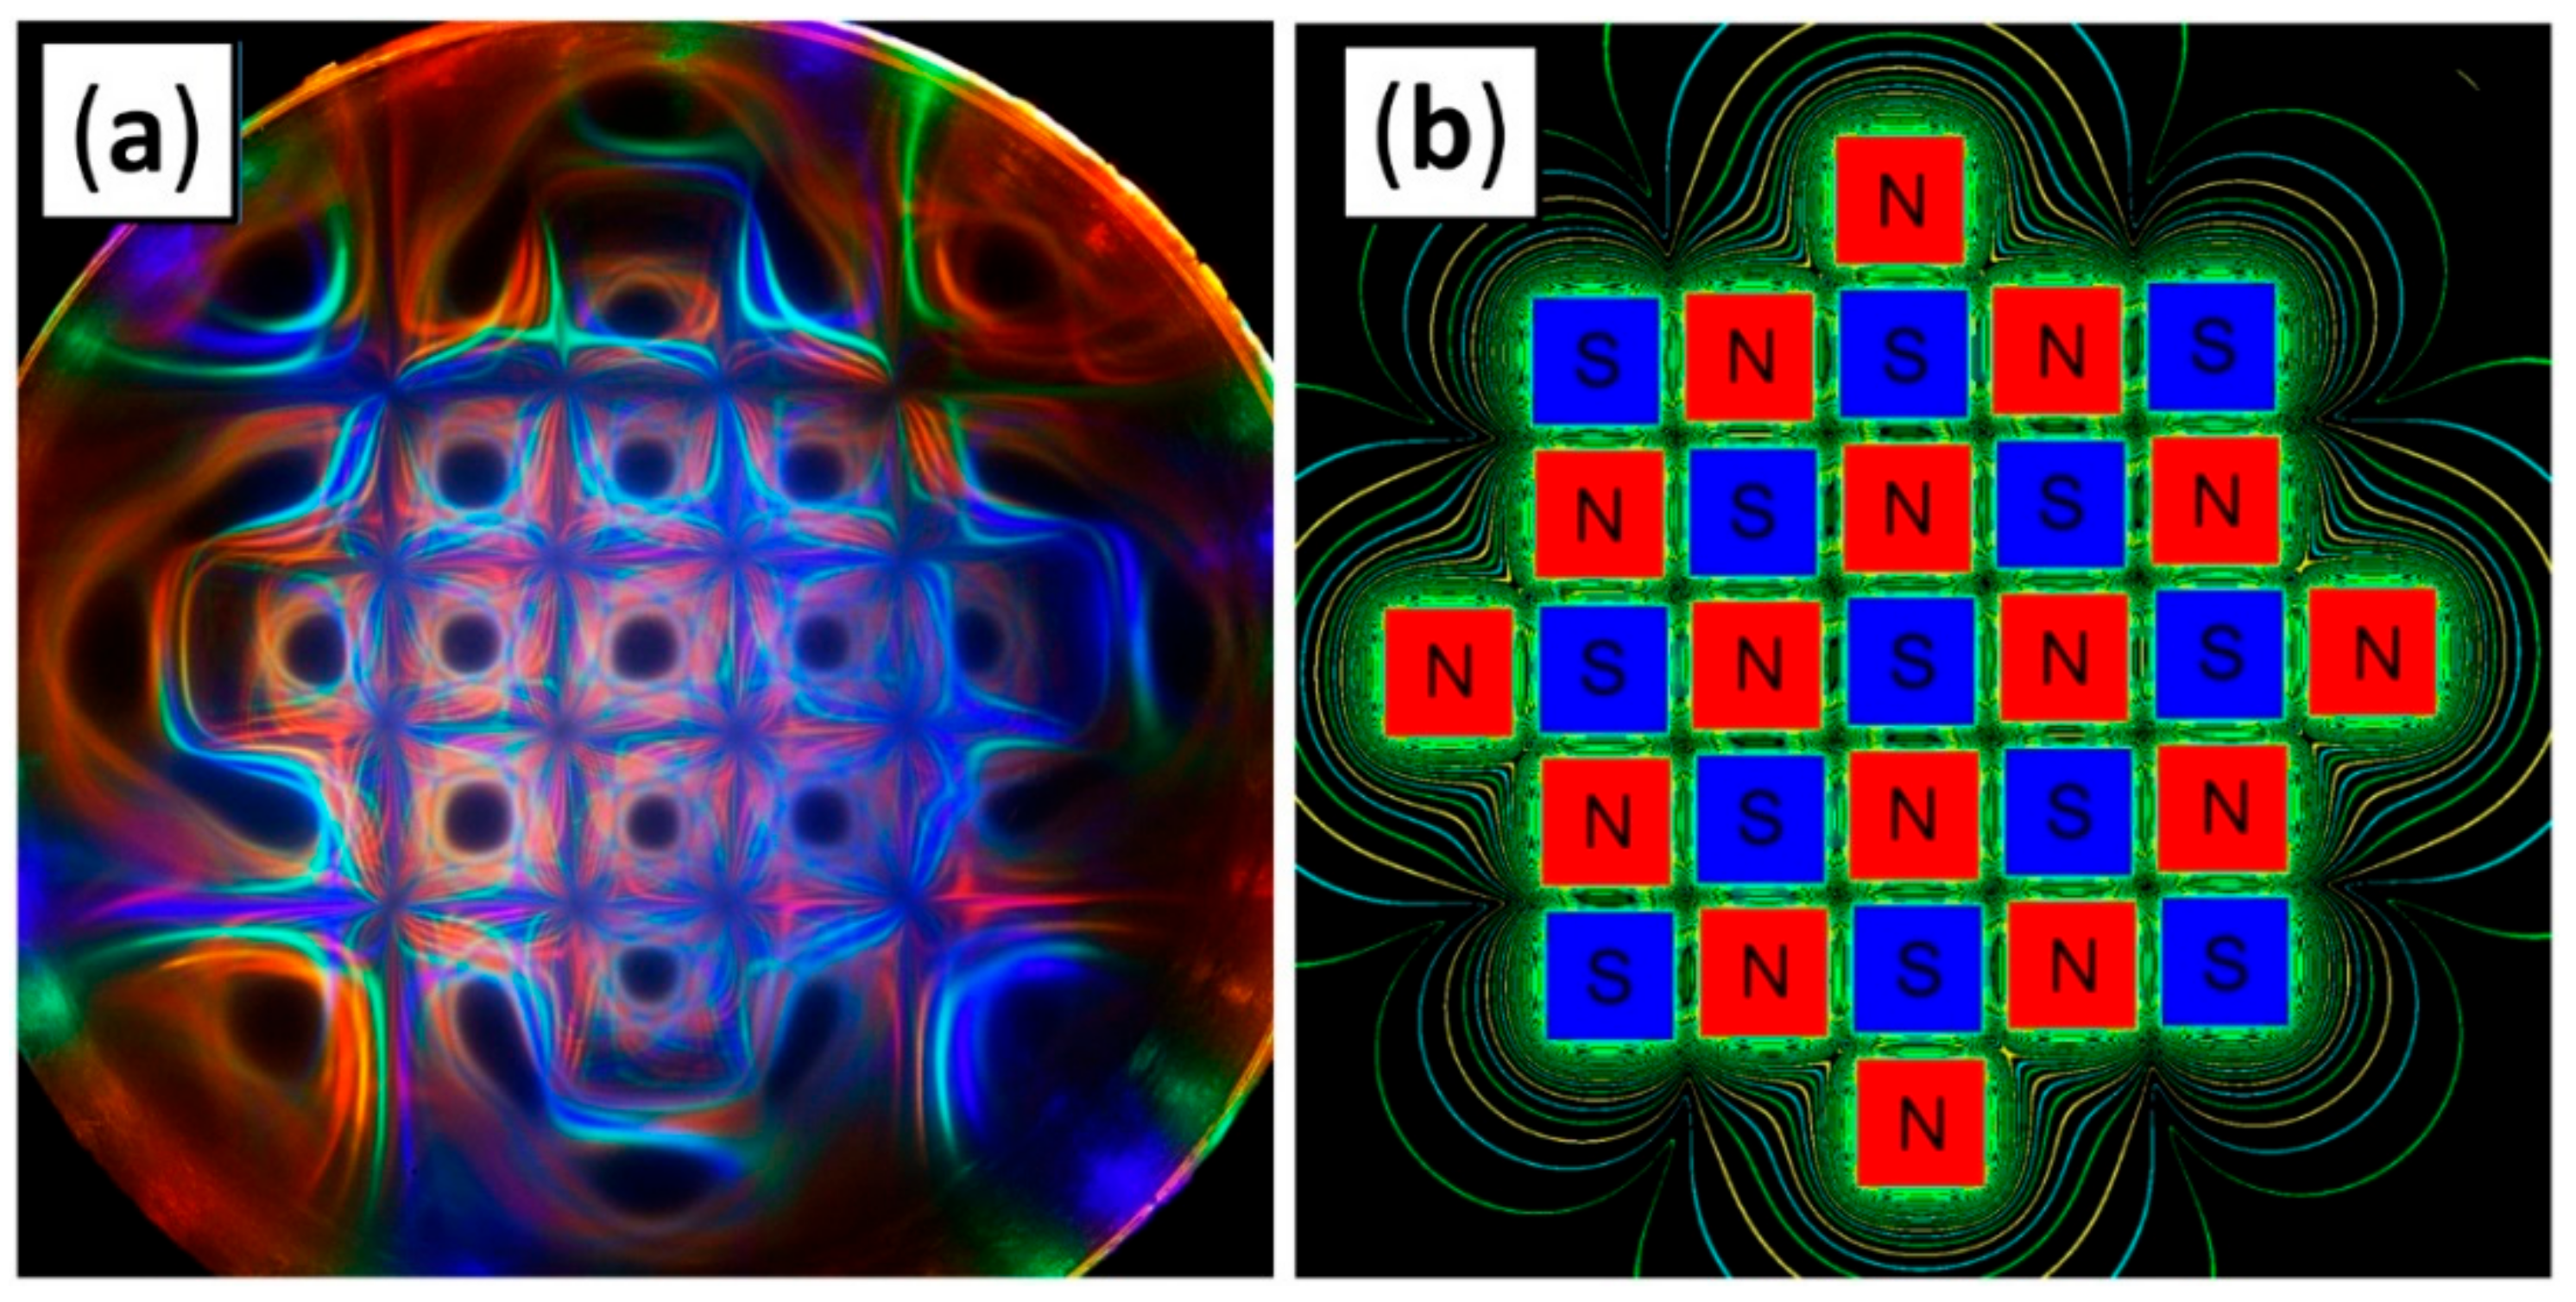
a) An example of light pattern in a Ferrocell. This apparatus has a thin film of ferrofluid surrounded by several color LEDs in a circular array around the film. In this case, the magnetic field is applied by an array with 29 cubic magnets. (
b) Simulation using Pic2Mag [
23] of the magnetic isopotentials produced the magnets.
Figure 2.
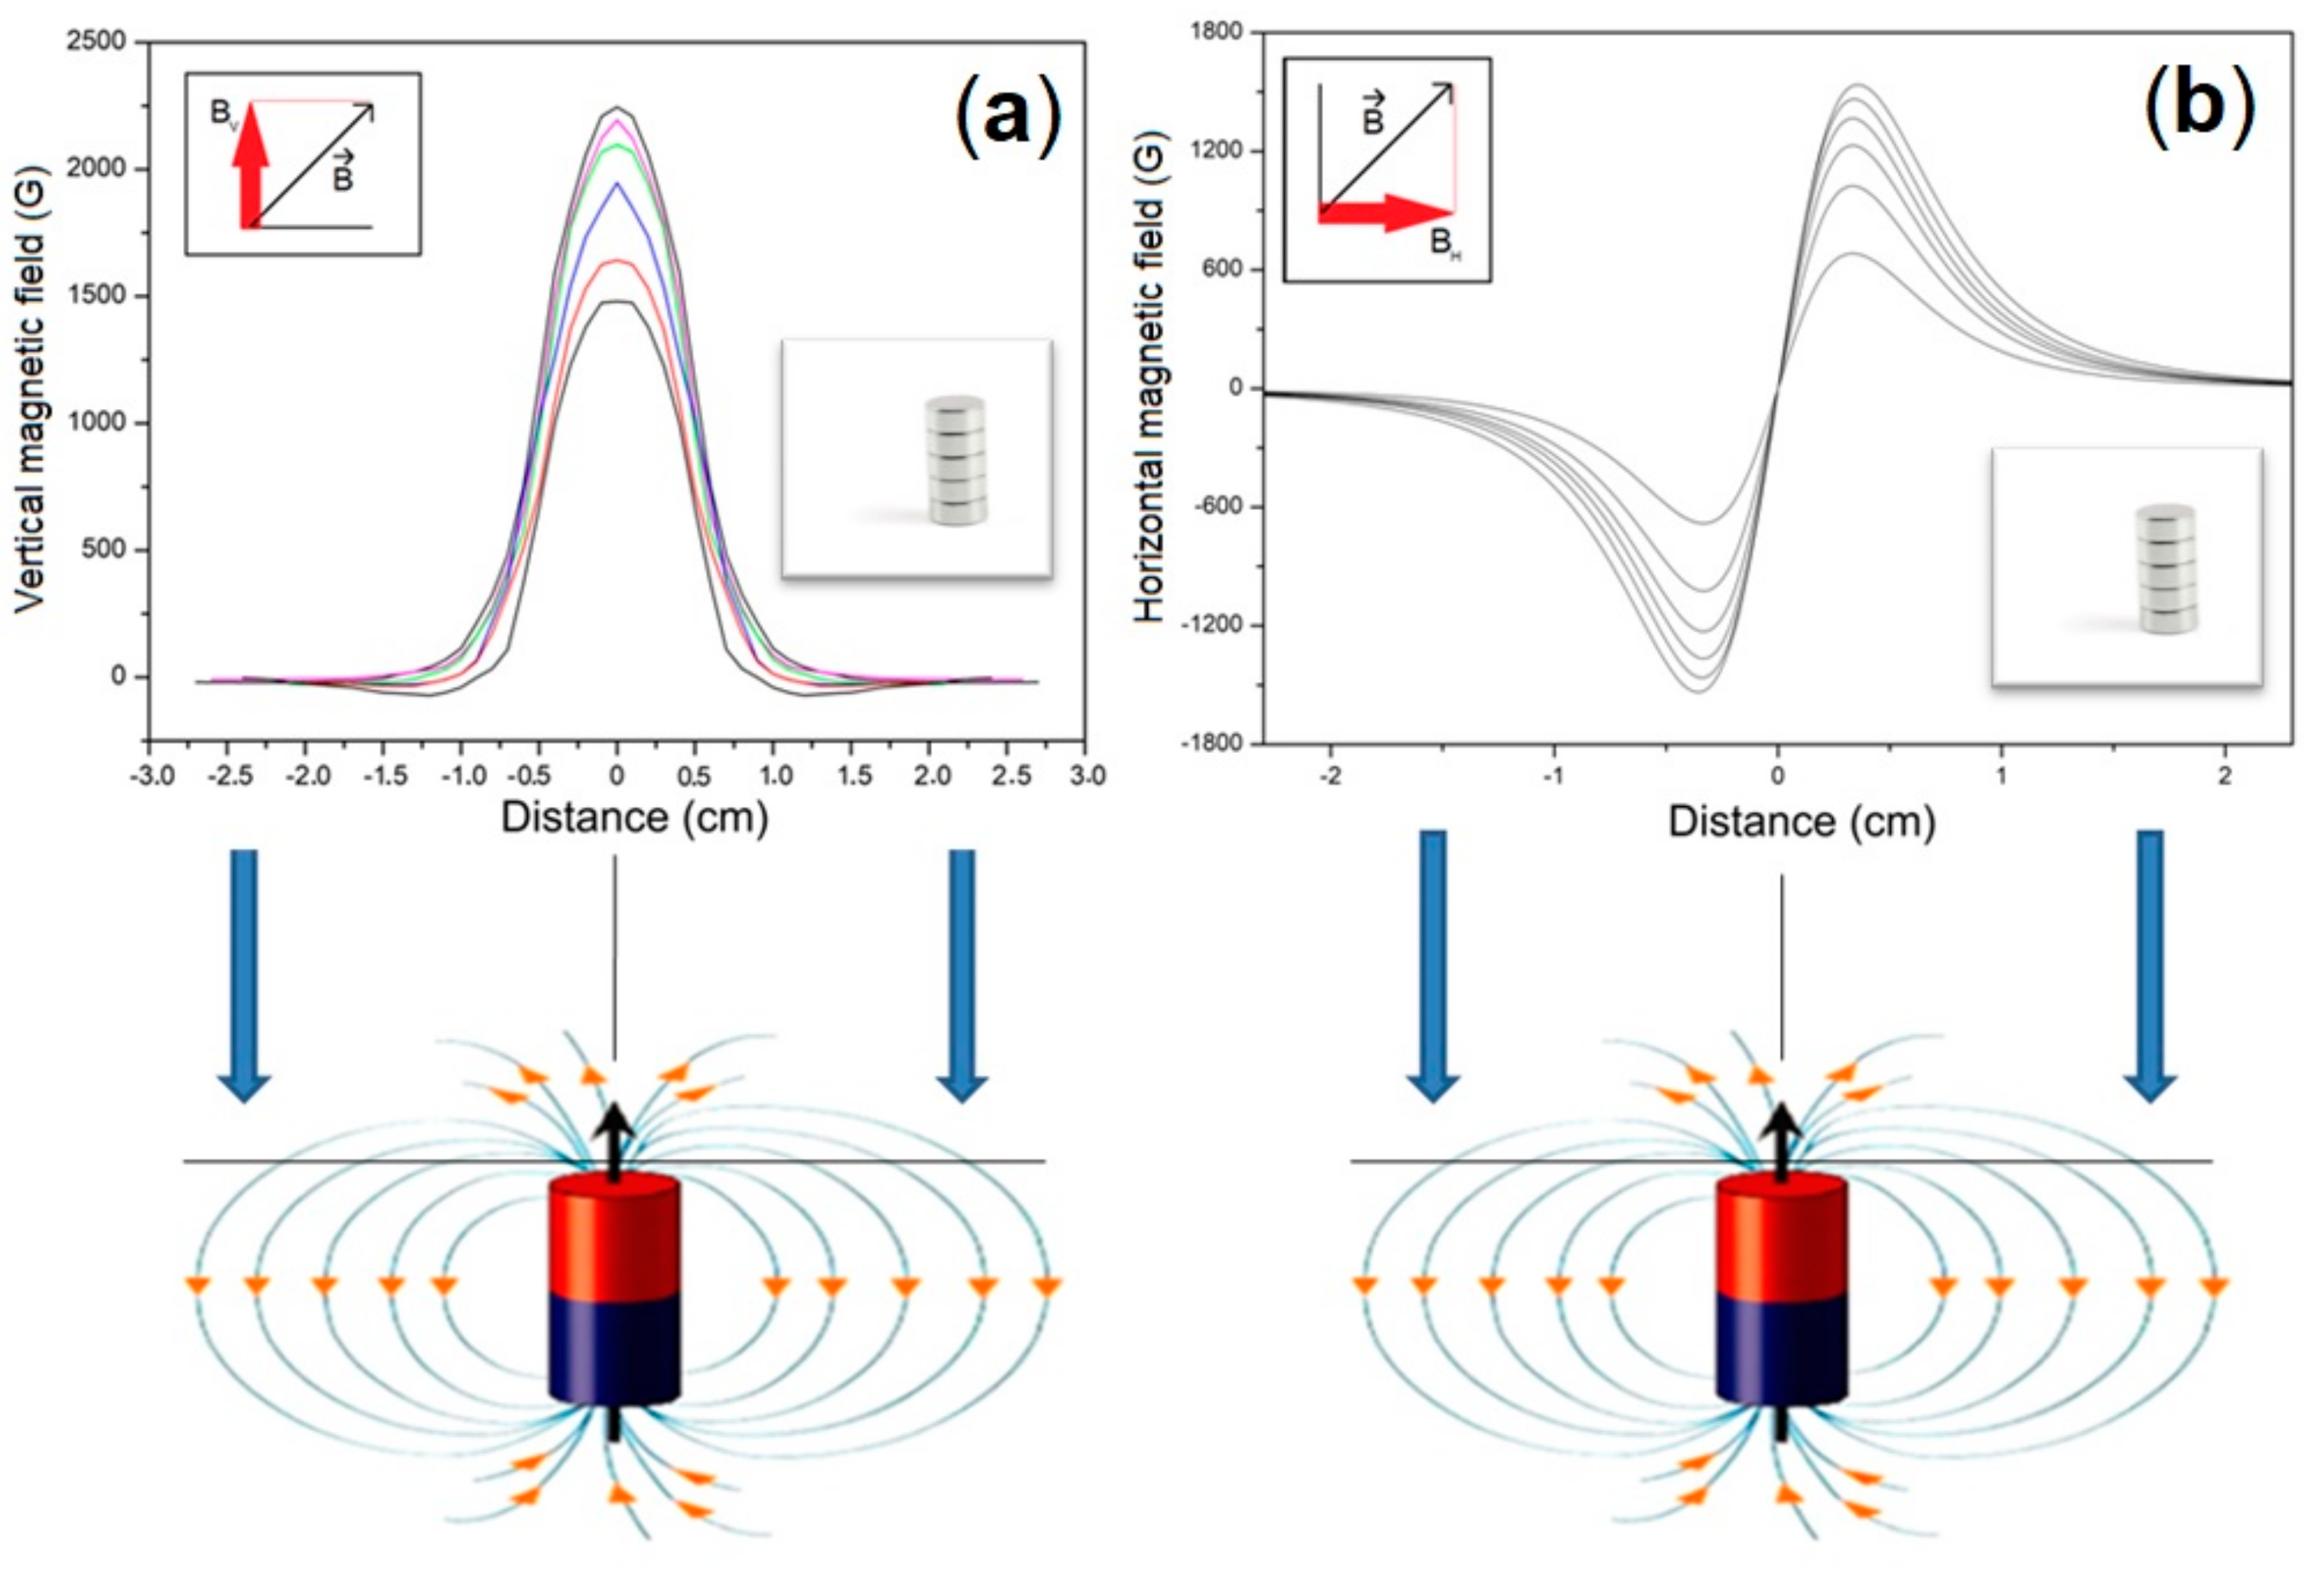
The source of the magnetic field in some of our observations of magneto-optical patterns is the use of stacked magnet disks. To increase the field, we make a column of up to six magnets, which increases the magnetic field strength. Placing the disk stack in the center of the Ferrocell with one of its bases facing the glass plate, we have the monopolar magnetic configuration. We present the intensity of the magnetic field in the vertical direction in (a) and in the horizontal direction in (b), in a line situated in the position of the plane where the thin film of ferrofluid is located. The lines show the effect of increasing the field by stacking disks that are shown in the photo of each graph. The magnetic field diagram in (a) shows us that the vertical field is maximum in the central part and decays symmetrically to the left and right. The diagram on the right shows that the magnetic field at the center of the disk is zero and varies symmetrically, but with the sign inverted as an odd function as we move away from the center of the stack of magnetic disks.
![Condensedmatter 07 00028 g002]()
Figure 3.
Details of the experimental apparatus. (a) The diagram of one of the polariscope configurations used in this work, in which the light passes through a polarizer, then passes through a ferrofluid film and through a linear analyzer. Throughout the article, we indicate the changes we made in the experimental arrangement. (b) An image of the set with the light diffuser, the polarizer, the Ferrocell, the analyzer, and the magnet. (c) An image of the apparatus, with an open side window showing the polarizers in (a). At the top of the instrument, we have the display in the form of a circular window.
Figure 4.
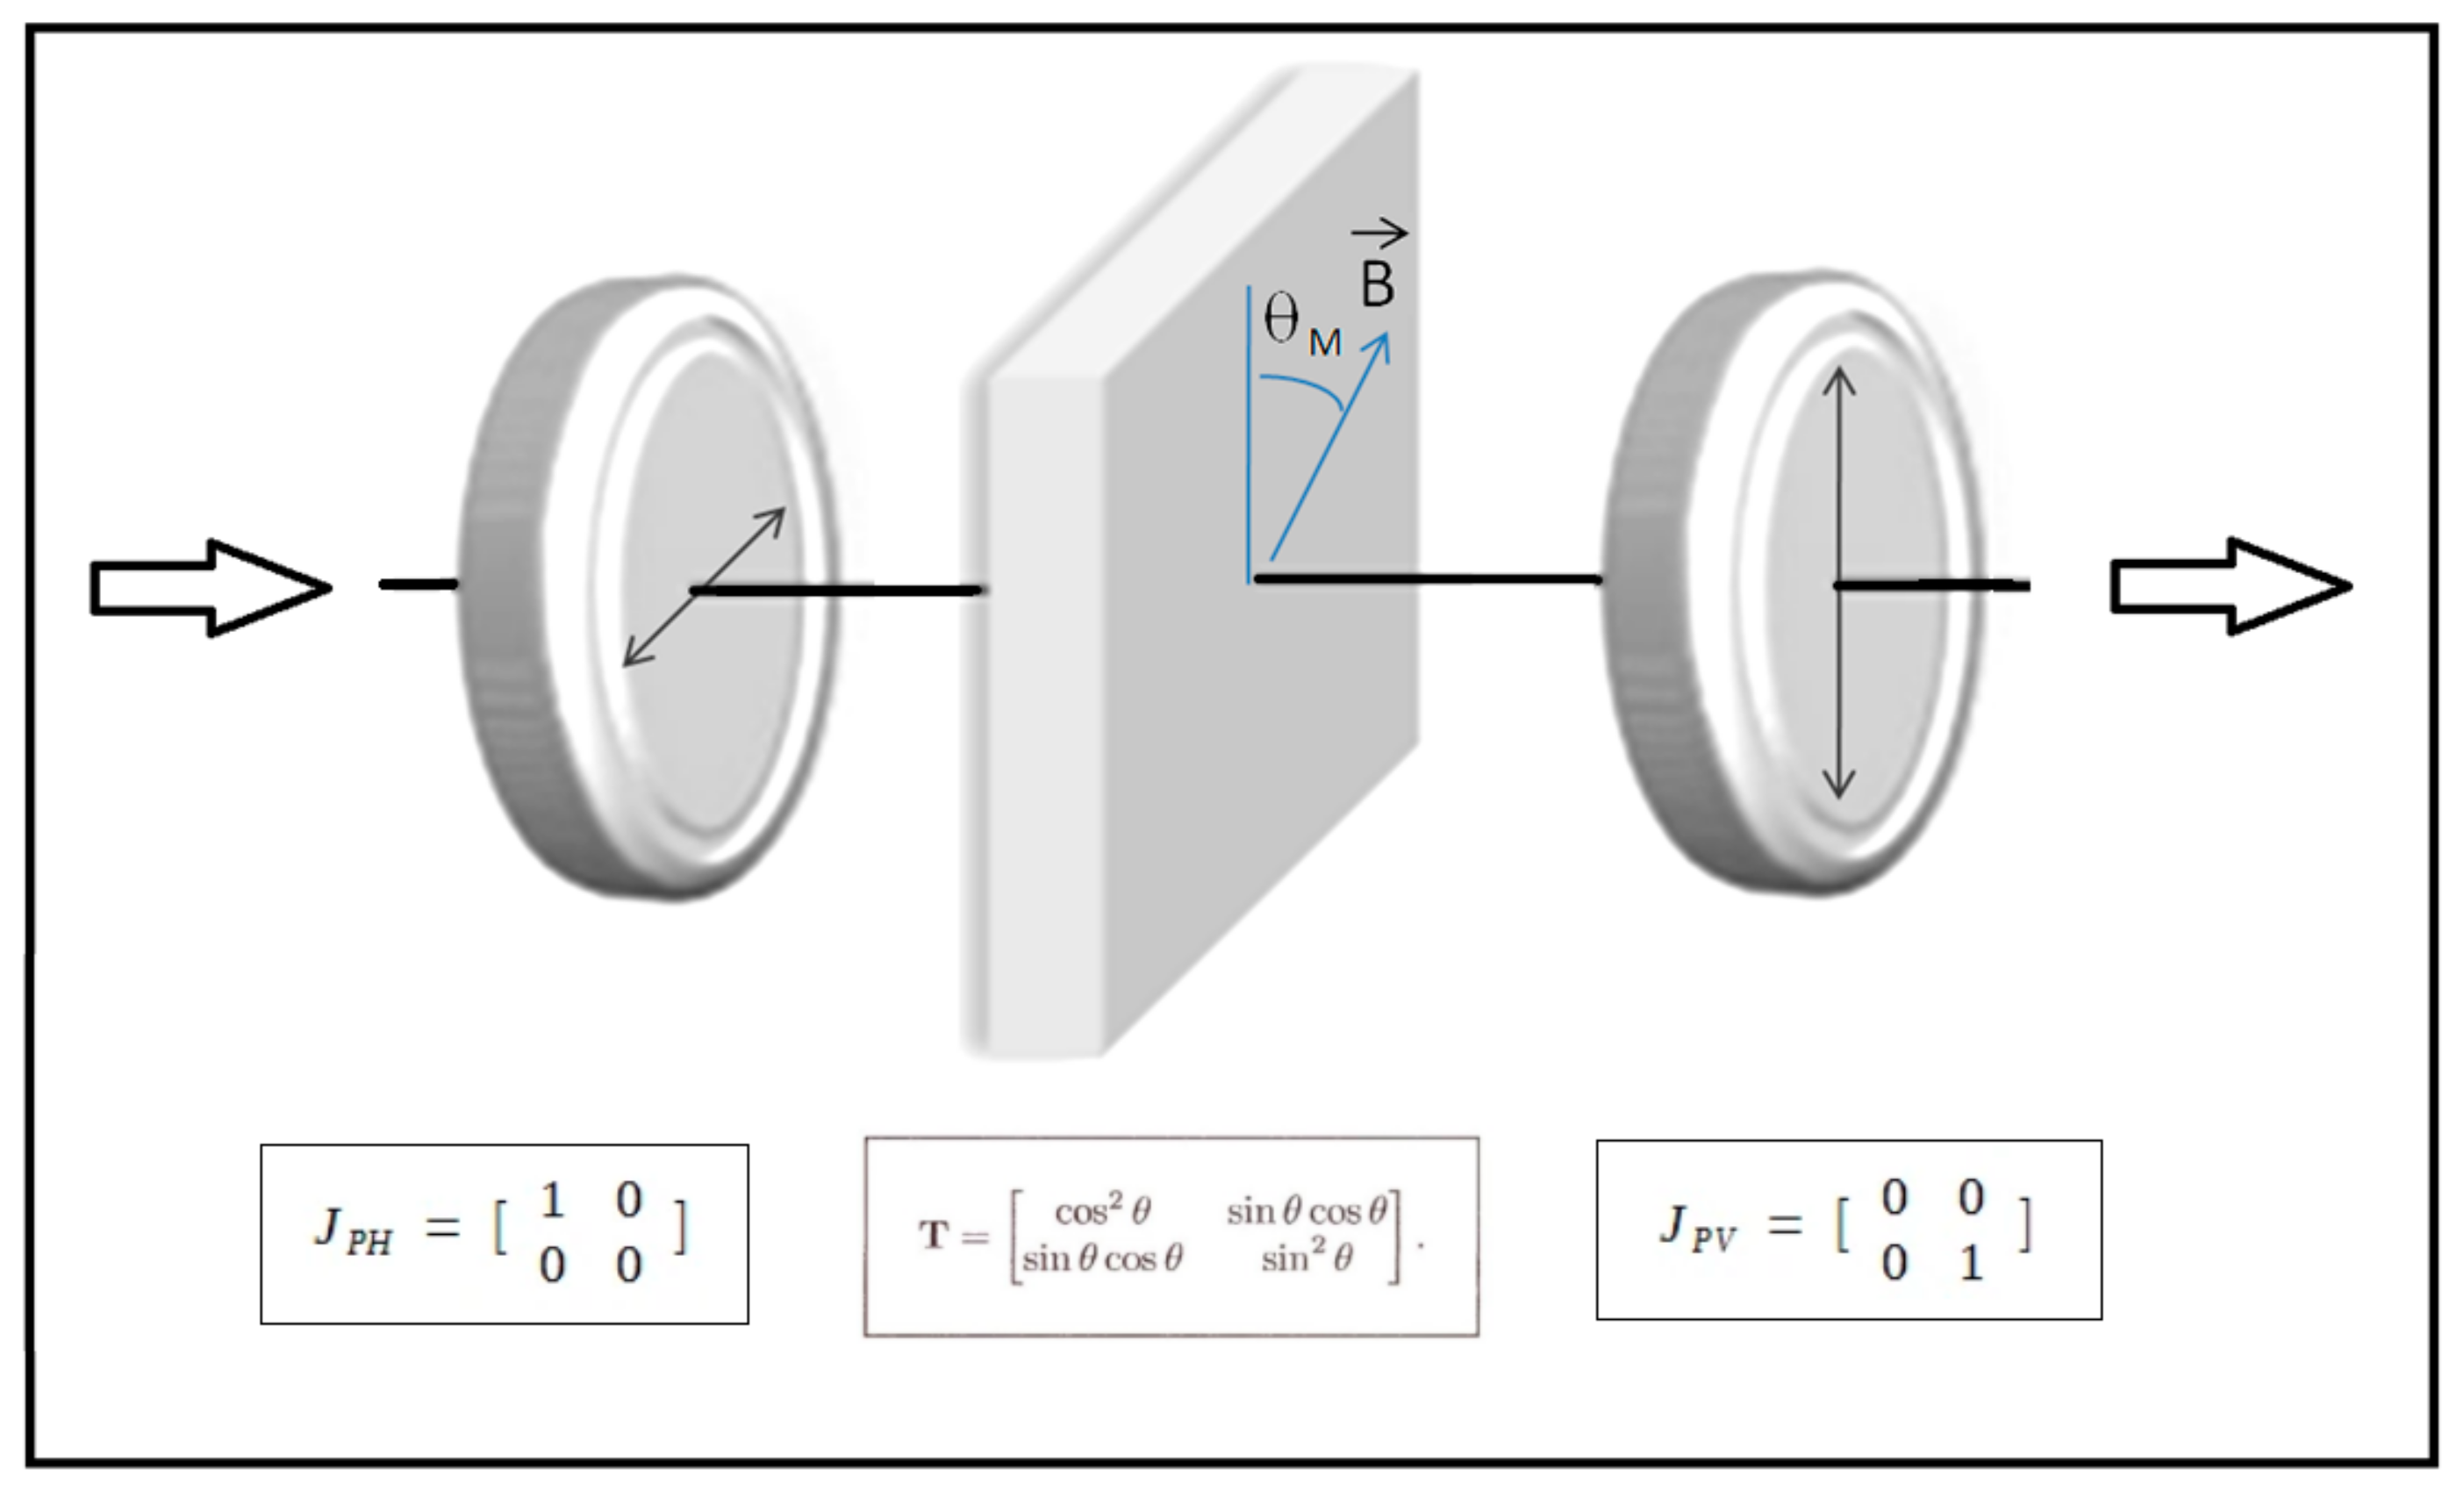
Diagram of the polariscope with a linear polarizer, Ferrocell, and linear analyzer and respective transfer function.
Figure 4.
Diagram of the polariscope with a linear polarizer, Ferrocell, and linear analyzer and respective transfer function.
Figure 5.
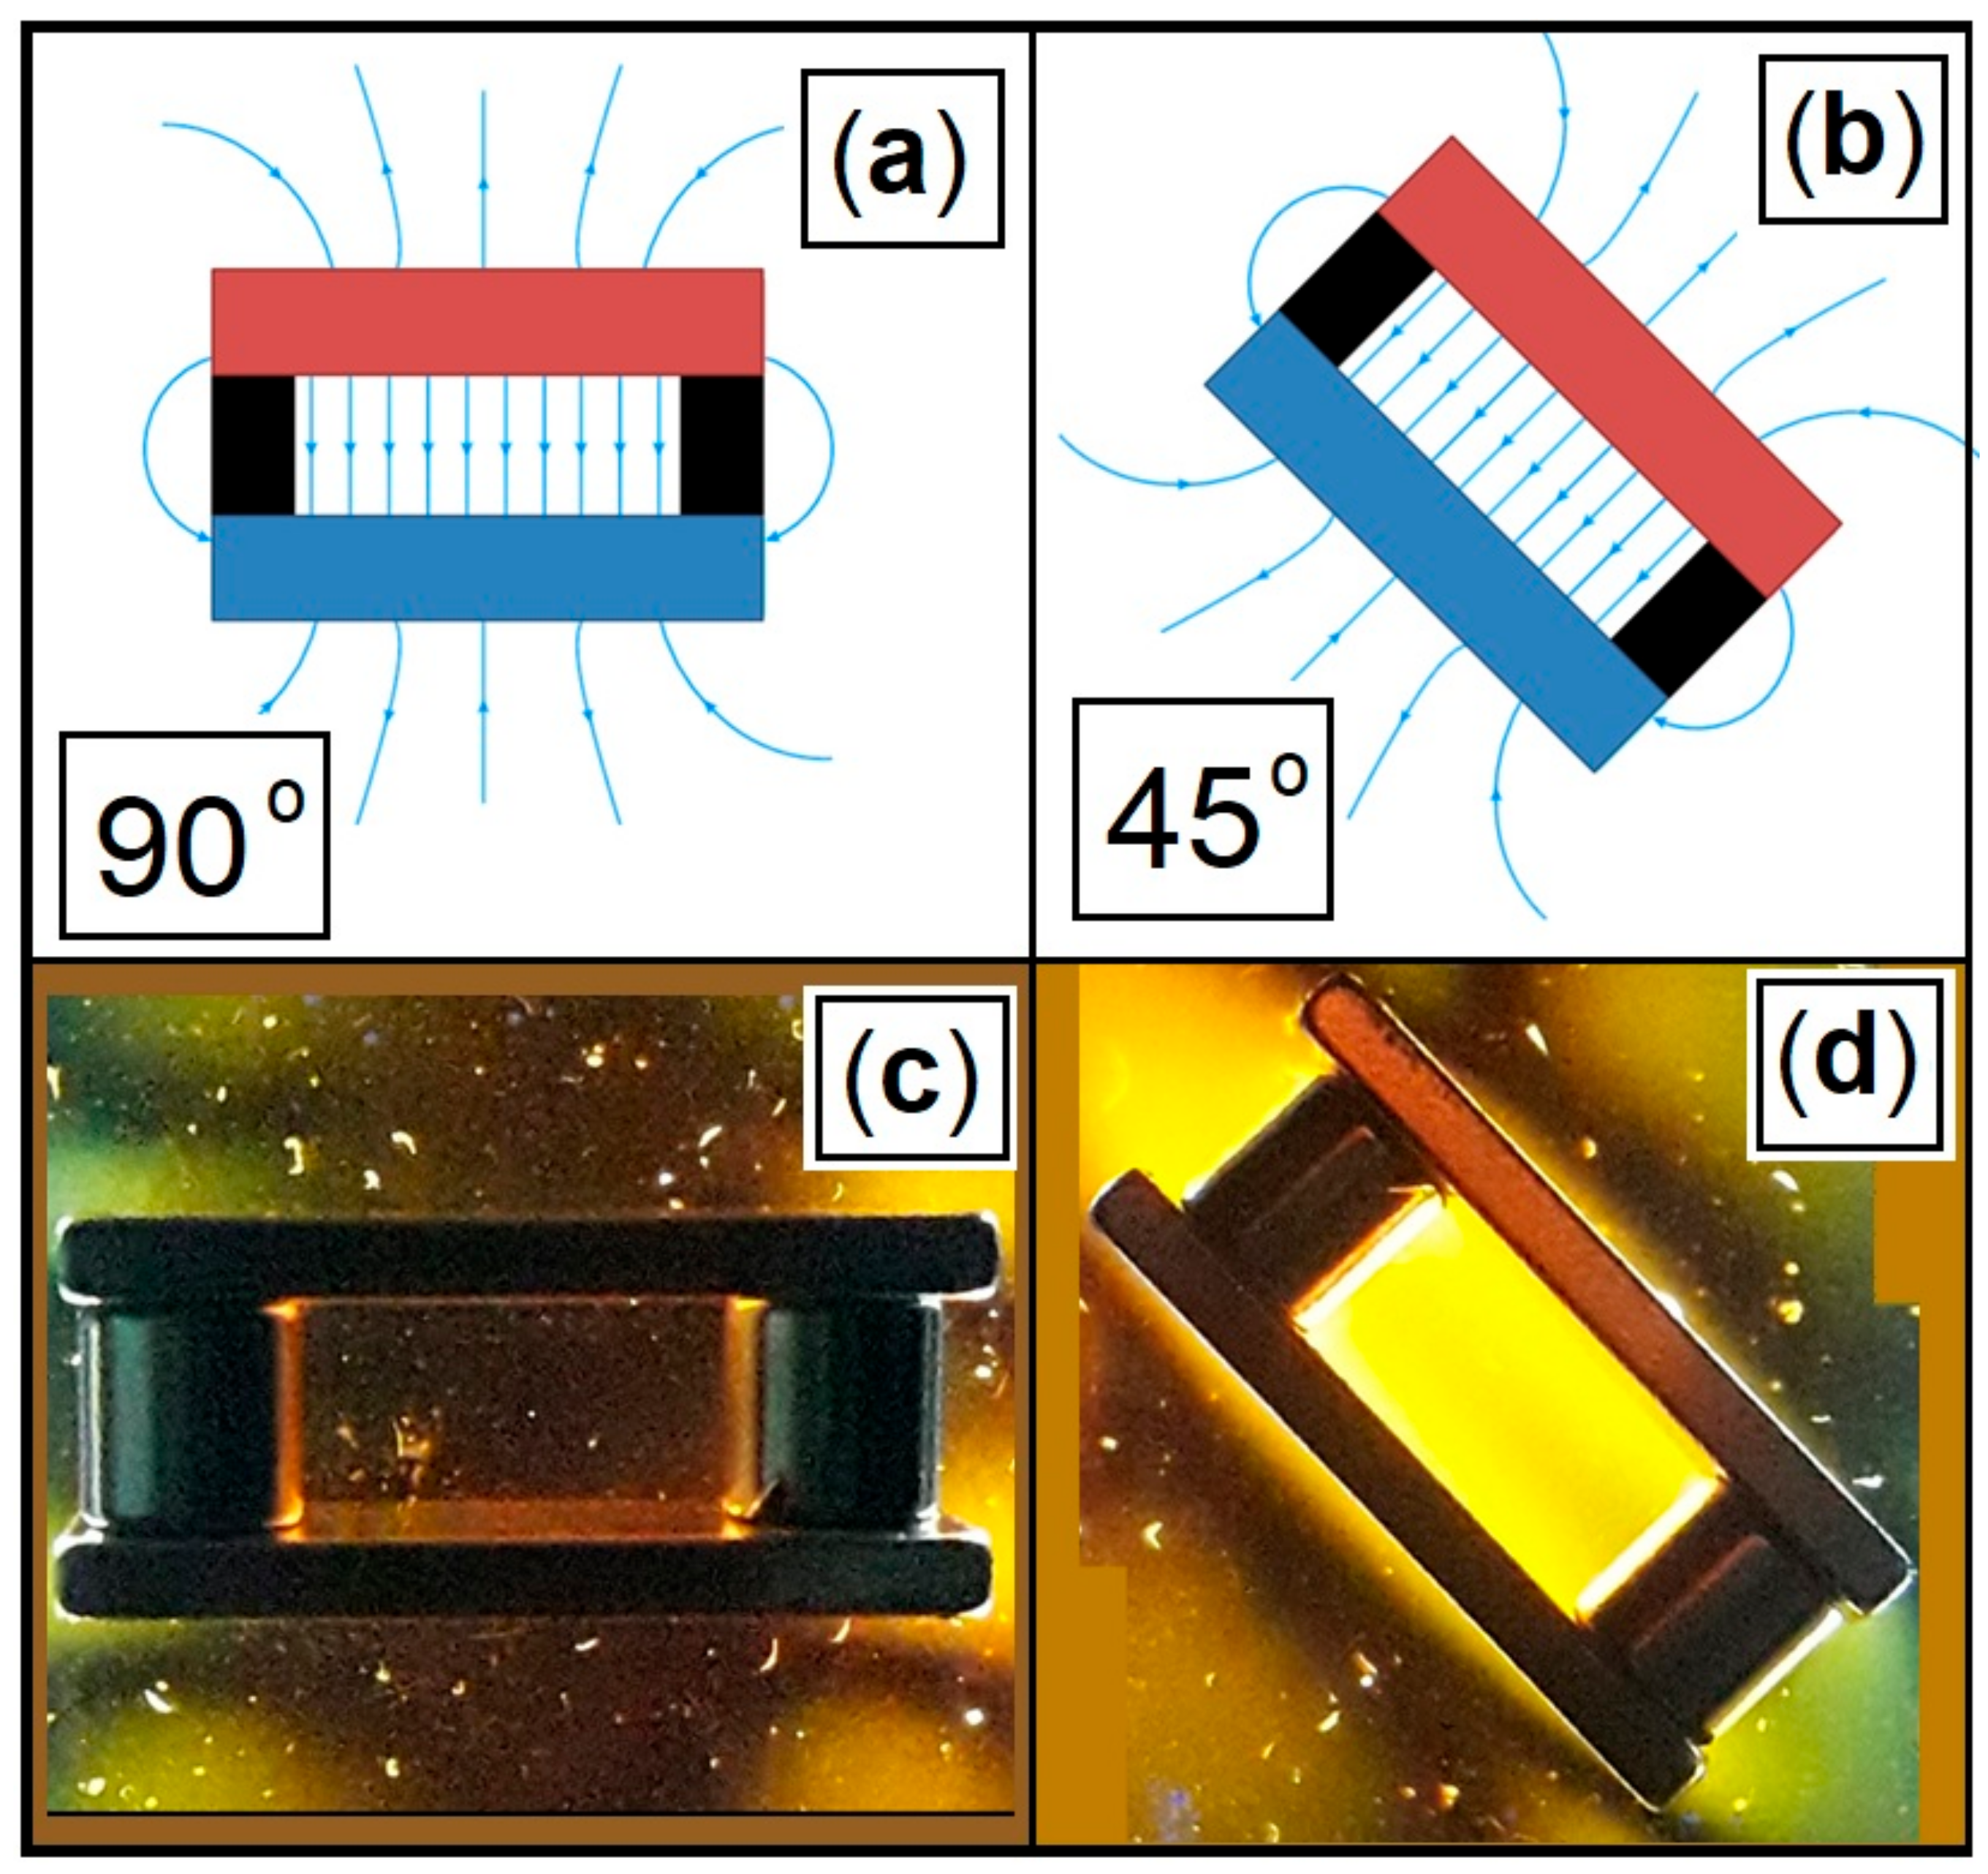
Example of Ferrocell, working as a controllable linear polarizer. In (a), we have the diagram of the parallel lines of the magnetic field between two magnets. In (c), this field is aligned with the polarizer and prevents the passage of light. In (b), we have the same diagram, but with the field lines between the two magnets at 45° of inclination with respect to the polarizer. In (d), we see the light passing with maximum intensity between the two magnets.
Figure 6.
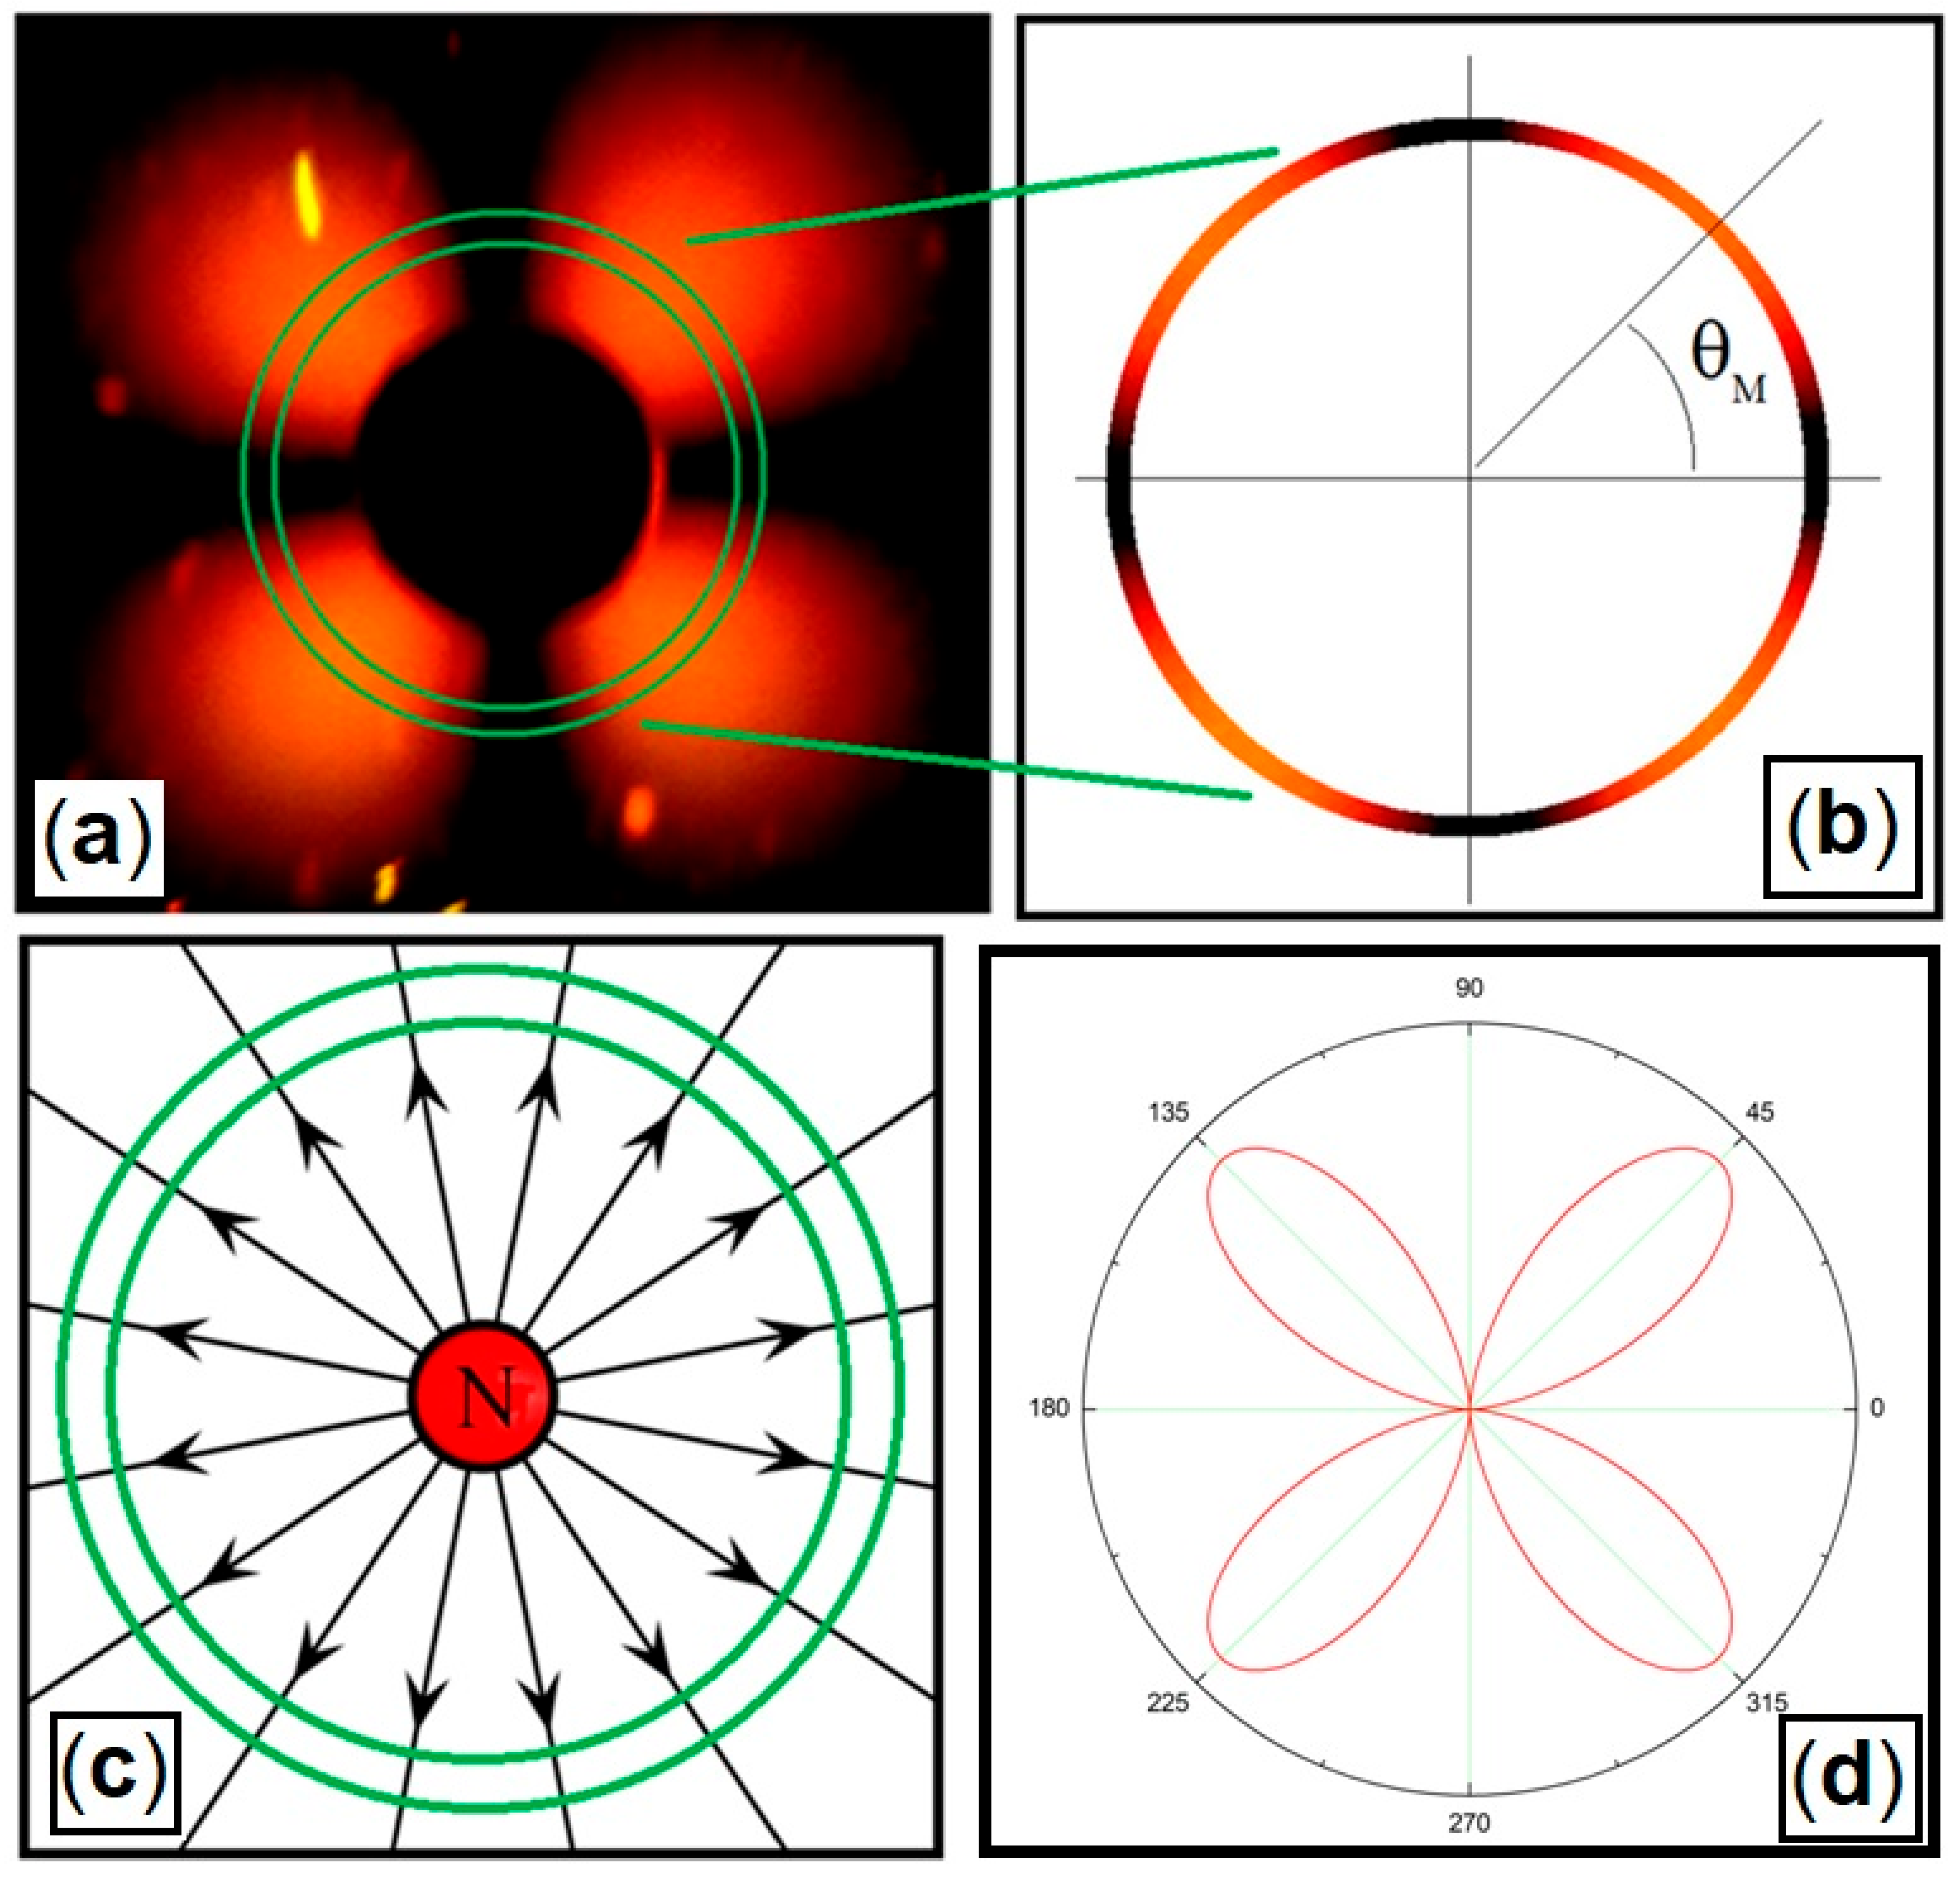
Checking the amplitude of light intensity as a function of angle. Placing a magnetic field in the monopolar configuration in (a), we choose a ring around the center of the magnetic “charge” (BV~1500 G) in (b). A diagram of the field lines is shown in (c). In (d), we have the representation of the luminous intensity as a function of the angle in polar coordinates of the sine squared function.
Figure 7.
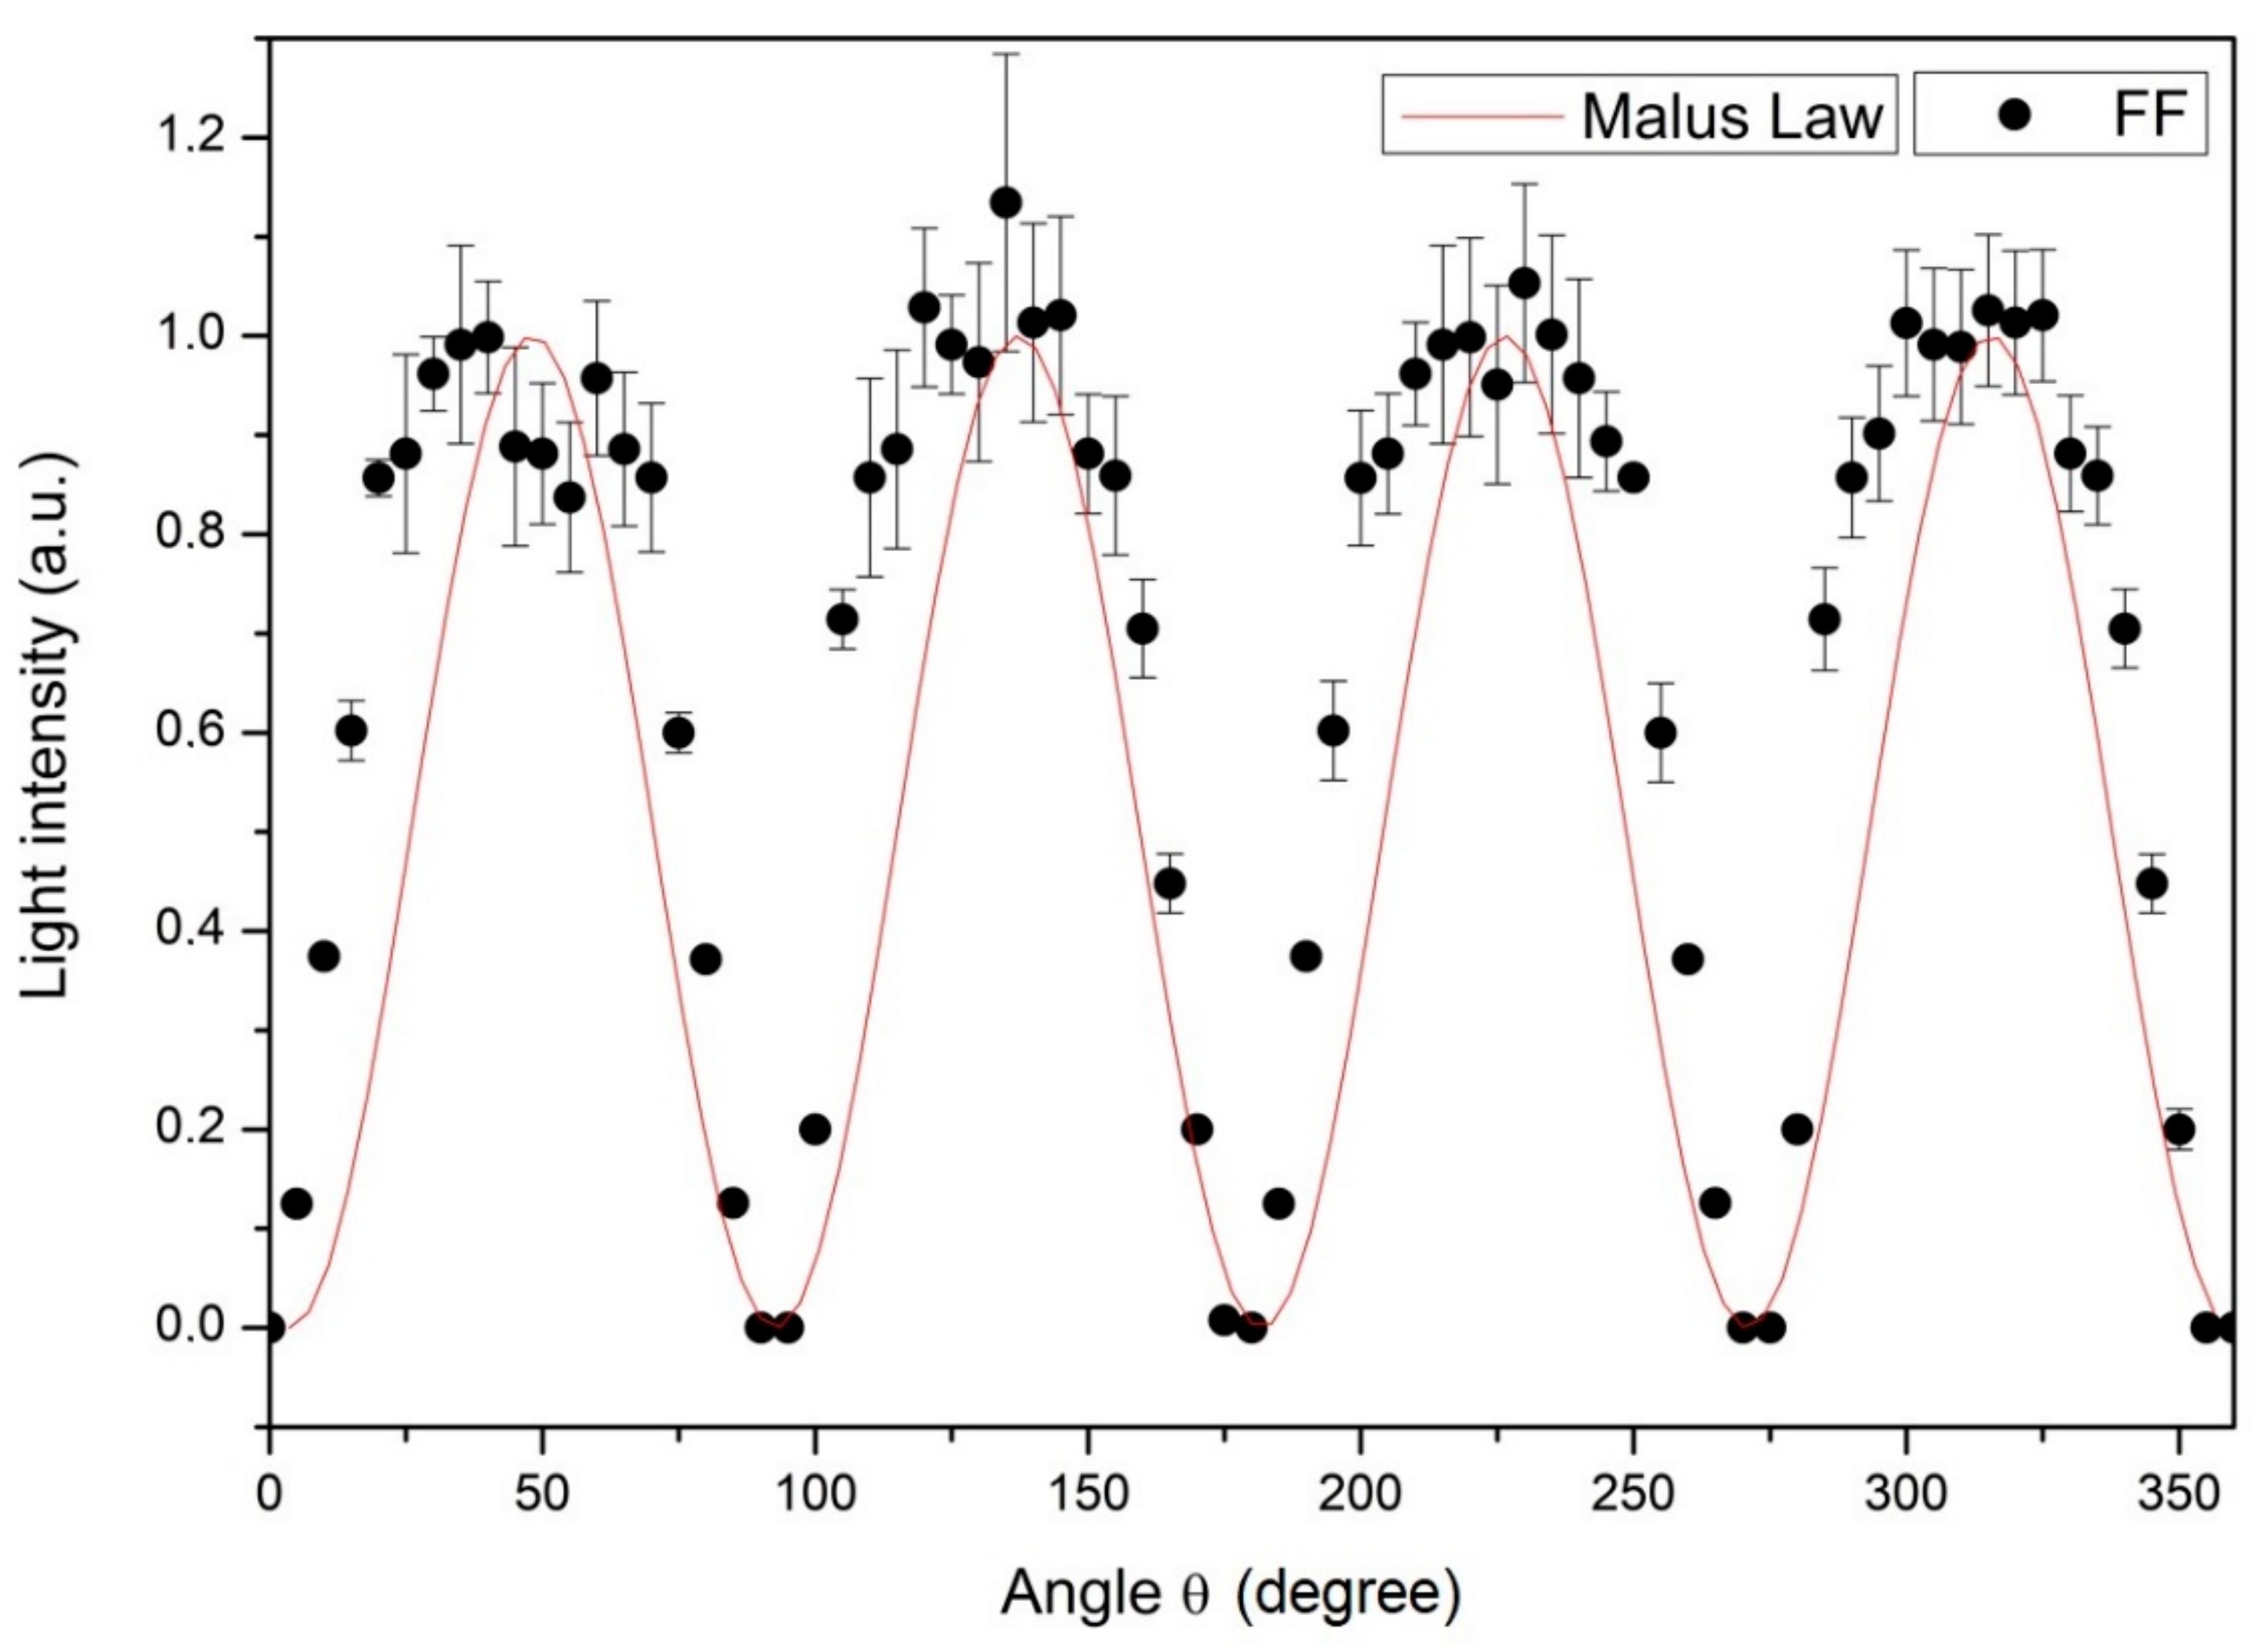
Comparison of the model obtained with Malus’ law for a radial diffraction grating with the measurements of light intensity as a function of the angle θ (measured in degrees) obtained experimentally with the Ferrocell.
Figure 7.
Comparison of the model obtained with Malus’ law for a radial diffraction grating with the measurements of light intensity as a function of the angle θ (measured in degrees) obtained experimentally with the Ferrocell.
Figure 8.
In (
a), we have the sequence of six images showing the increase in light patterns as a function of the increase in strength of the applied magnetic field. (
b) To analyze the effect of increasing the “luminous lobe” we chose a region marked with the red rectangle. (
c) Graph of luminous intensity obtained experimentally. The red line represents a fit of an exponentially decaying function to the experimental data. The inset shows a comparison between the image obtained experimentally and a simulation. The first image in (
a) and the data of
Figure 7 has the same conditions as the experiment shown in the inset in (
c). Color shift is an artifact of the camera.
Figure 9.
(a) Graphs of luminous decay as a function of distance for six different values of the applied magnetic field. (b) Graphs of the horizontal magnetic field in the Ferrocell plane region used for the luminous decays are shown above.
Figure 9.
(a) Graphs of luminous decay as a function of distance for six different values of the applied magnetic field. (b) Graphs of the horizontal magnetic field in the Ferrocell plane region used for the luminous decays are shown above.
Figure 10.
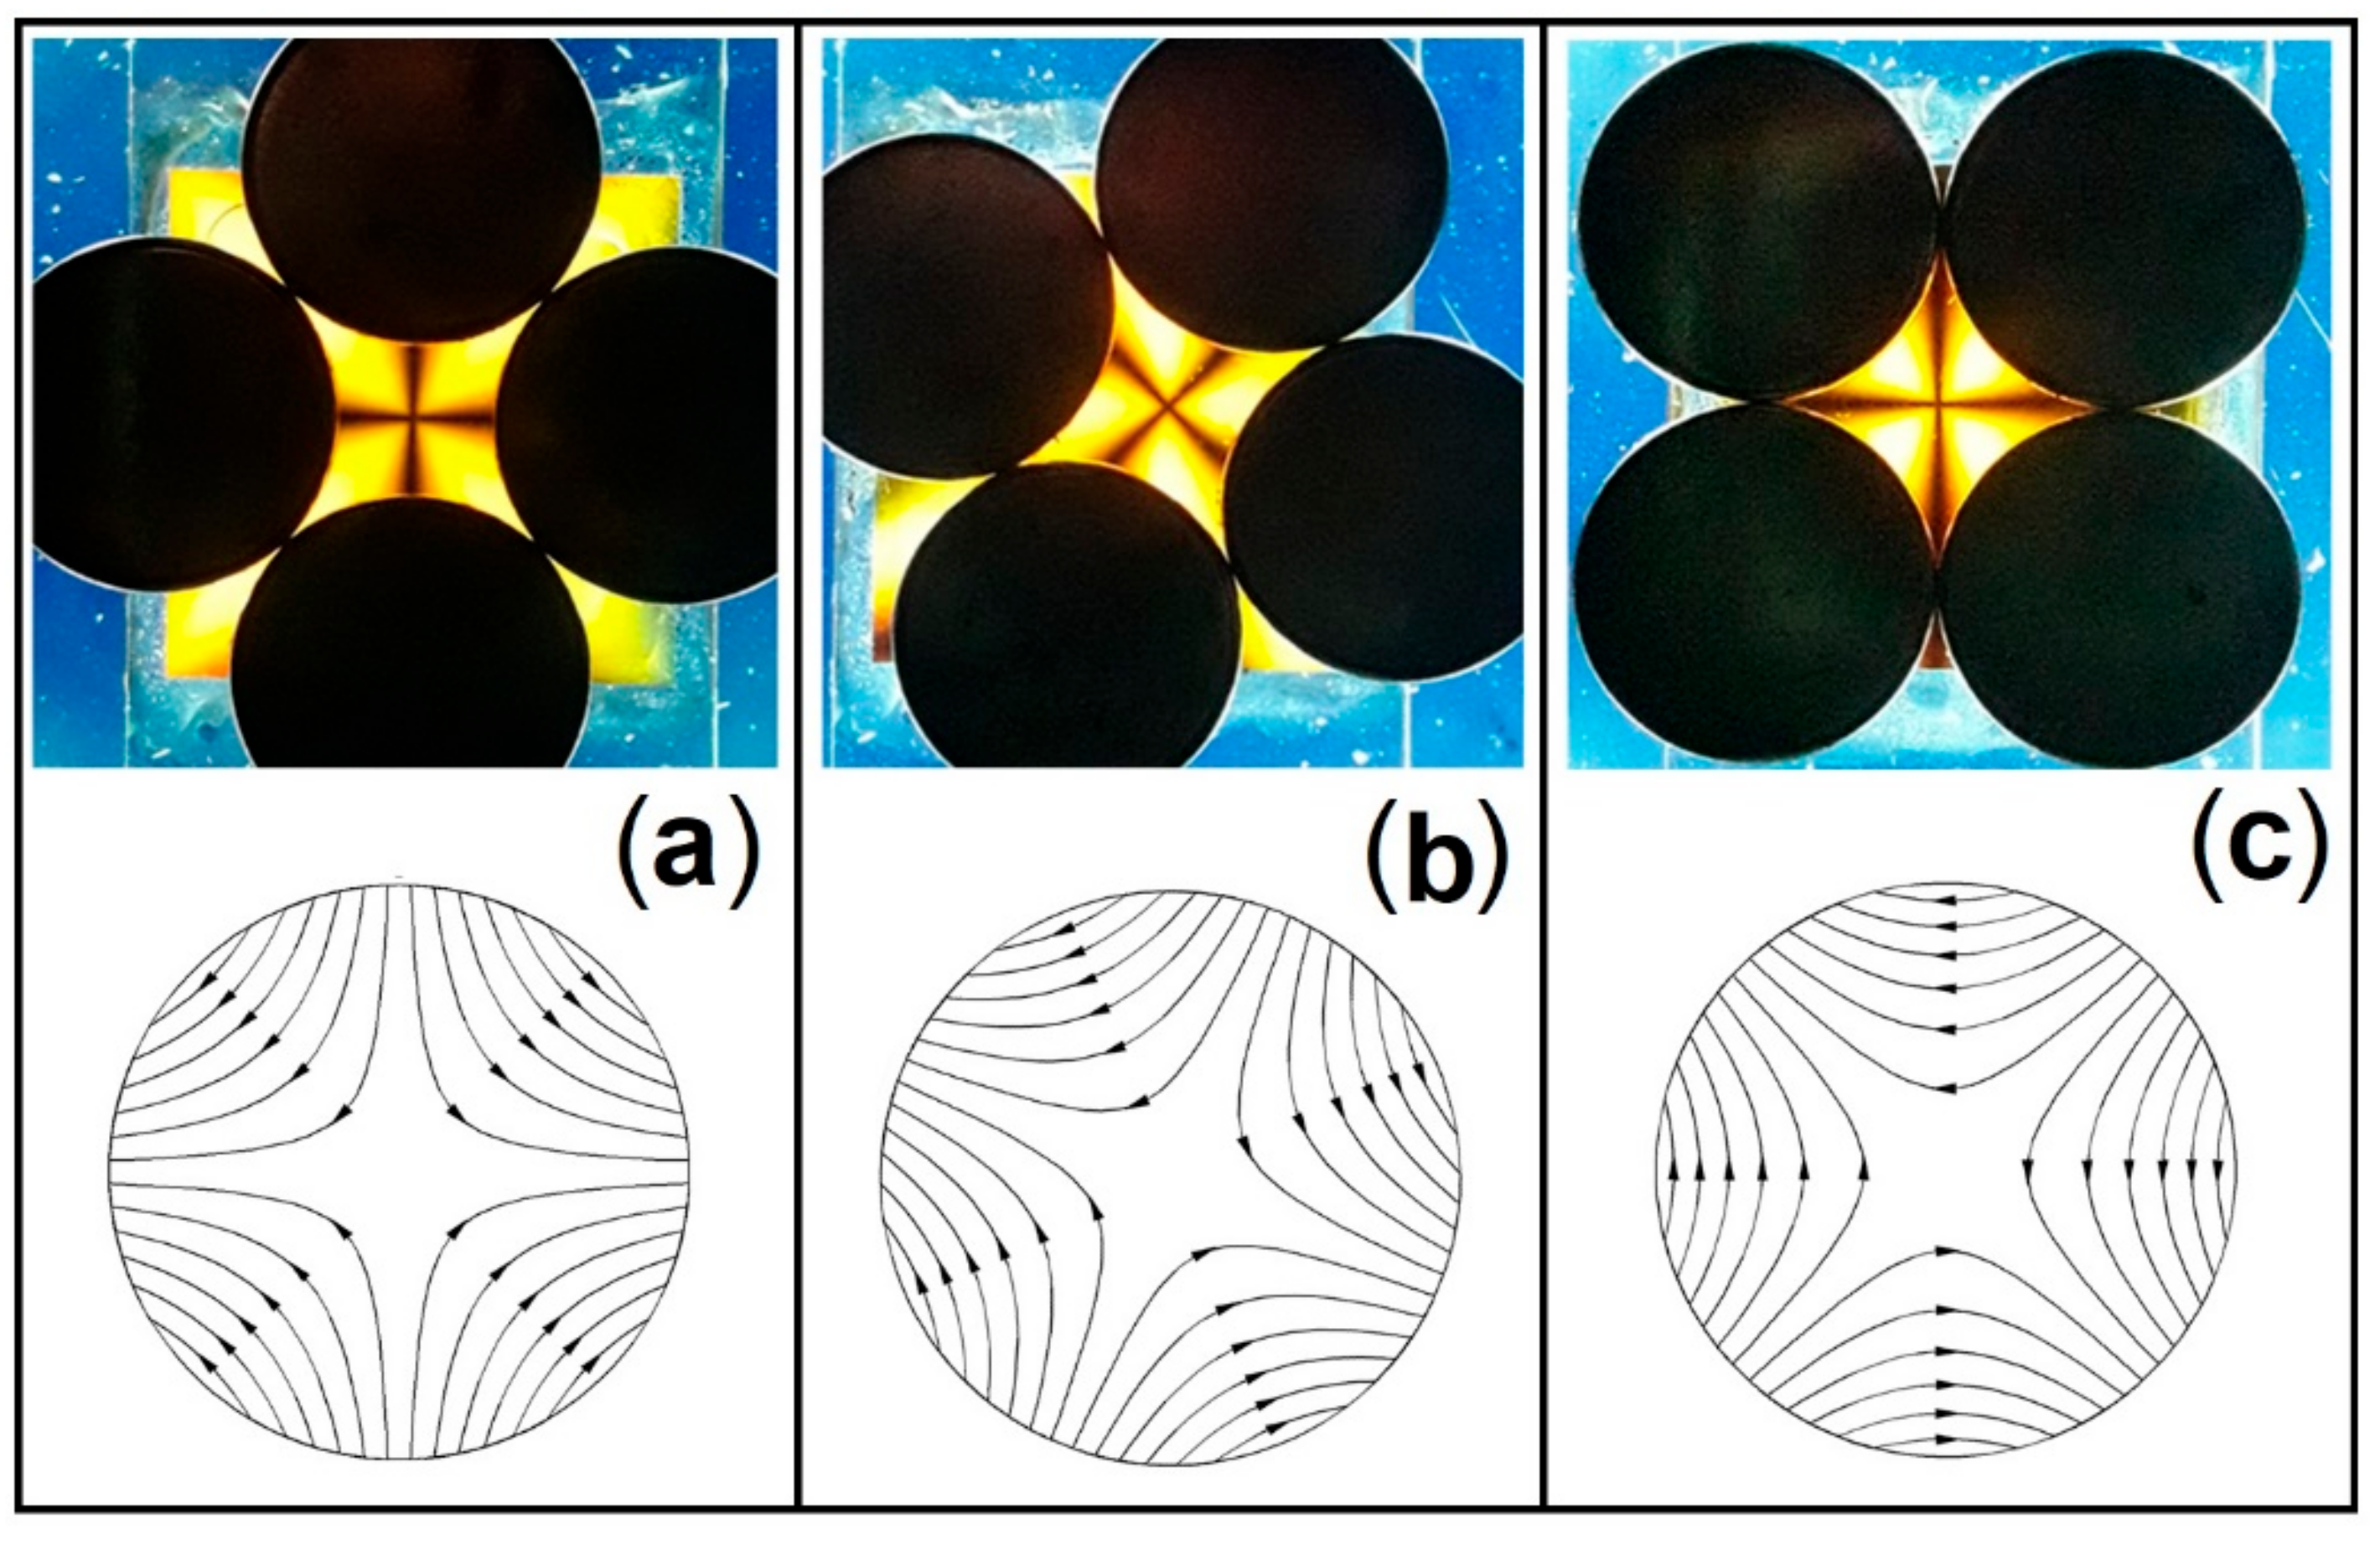
At the top, we have light patterns obtained with a tetrapolar magnetic field. At the bottom, we have representations of the corresponding magnetic field lines. In this sequence, we show that the rotation of the tetrapolar magnetic field leads to the rotation of the isogyres pattern. In (a), the central cross of the field is aligned with both the horizontal and the vertical isogyres, in (b), the tetrapolar field has been rotated 22.5° with respect to the previous case, and in (c), the field has been rotated 45° with respect to relative to the first light pattern in (a). In (c), the central cross of the field is not aligned with the isogyres.
Figure 11.
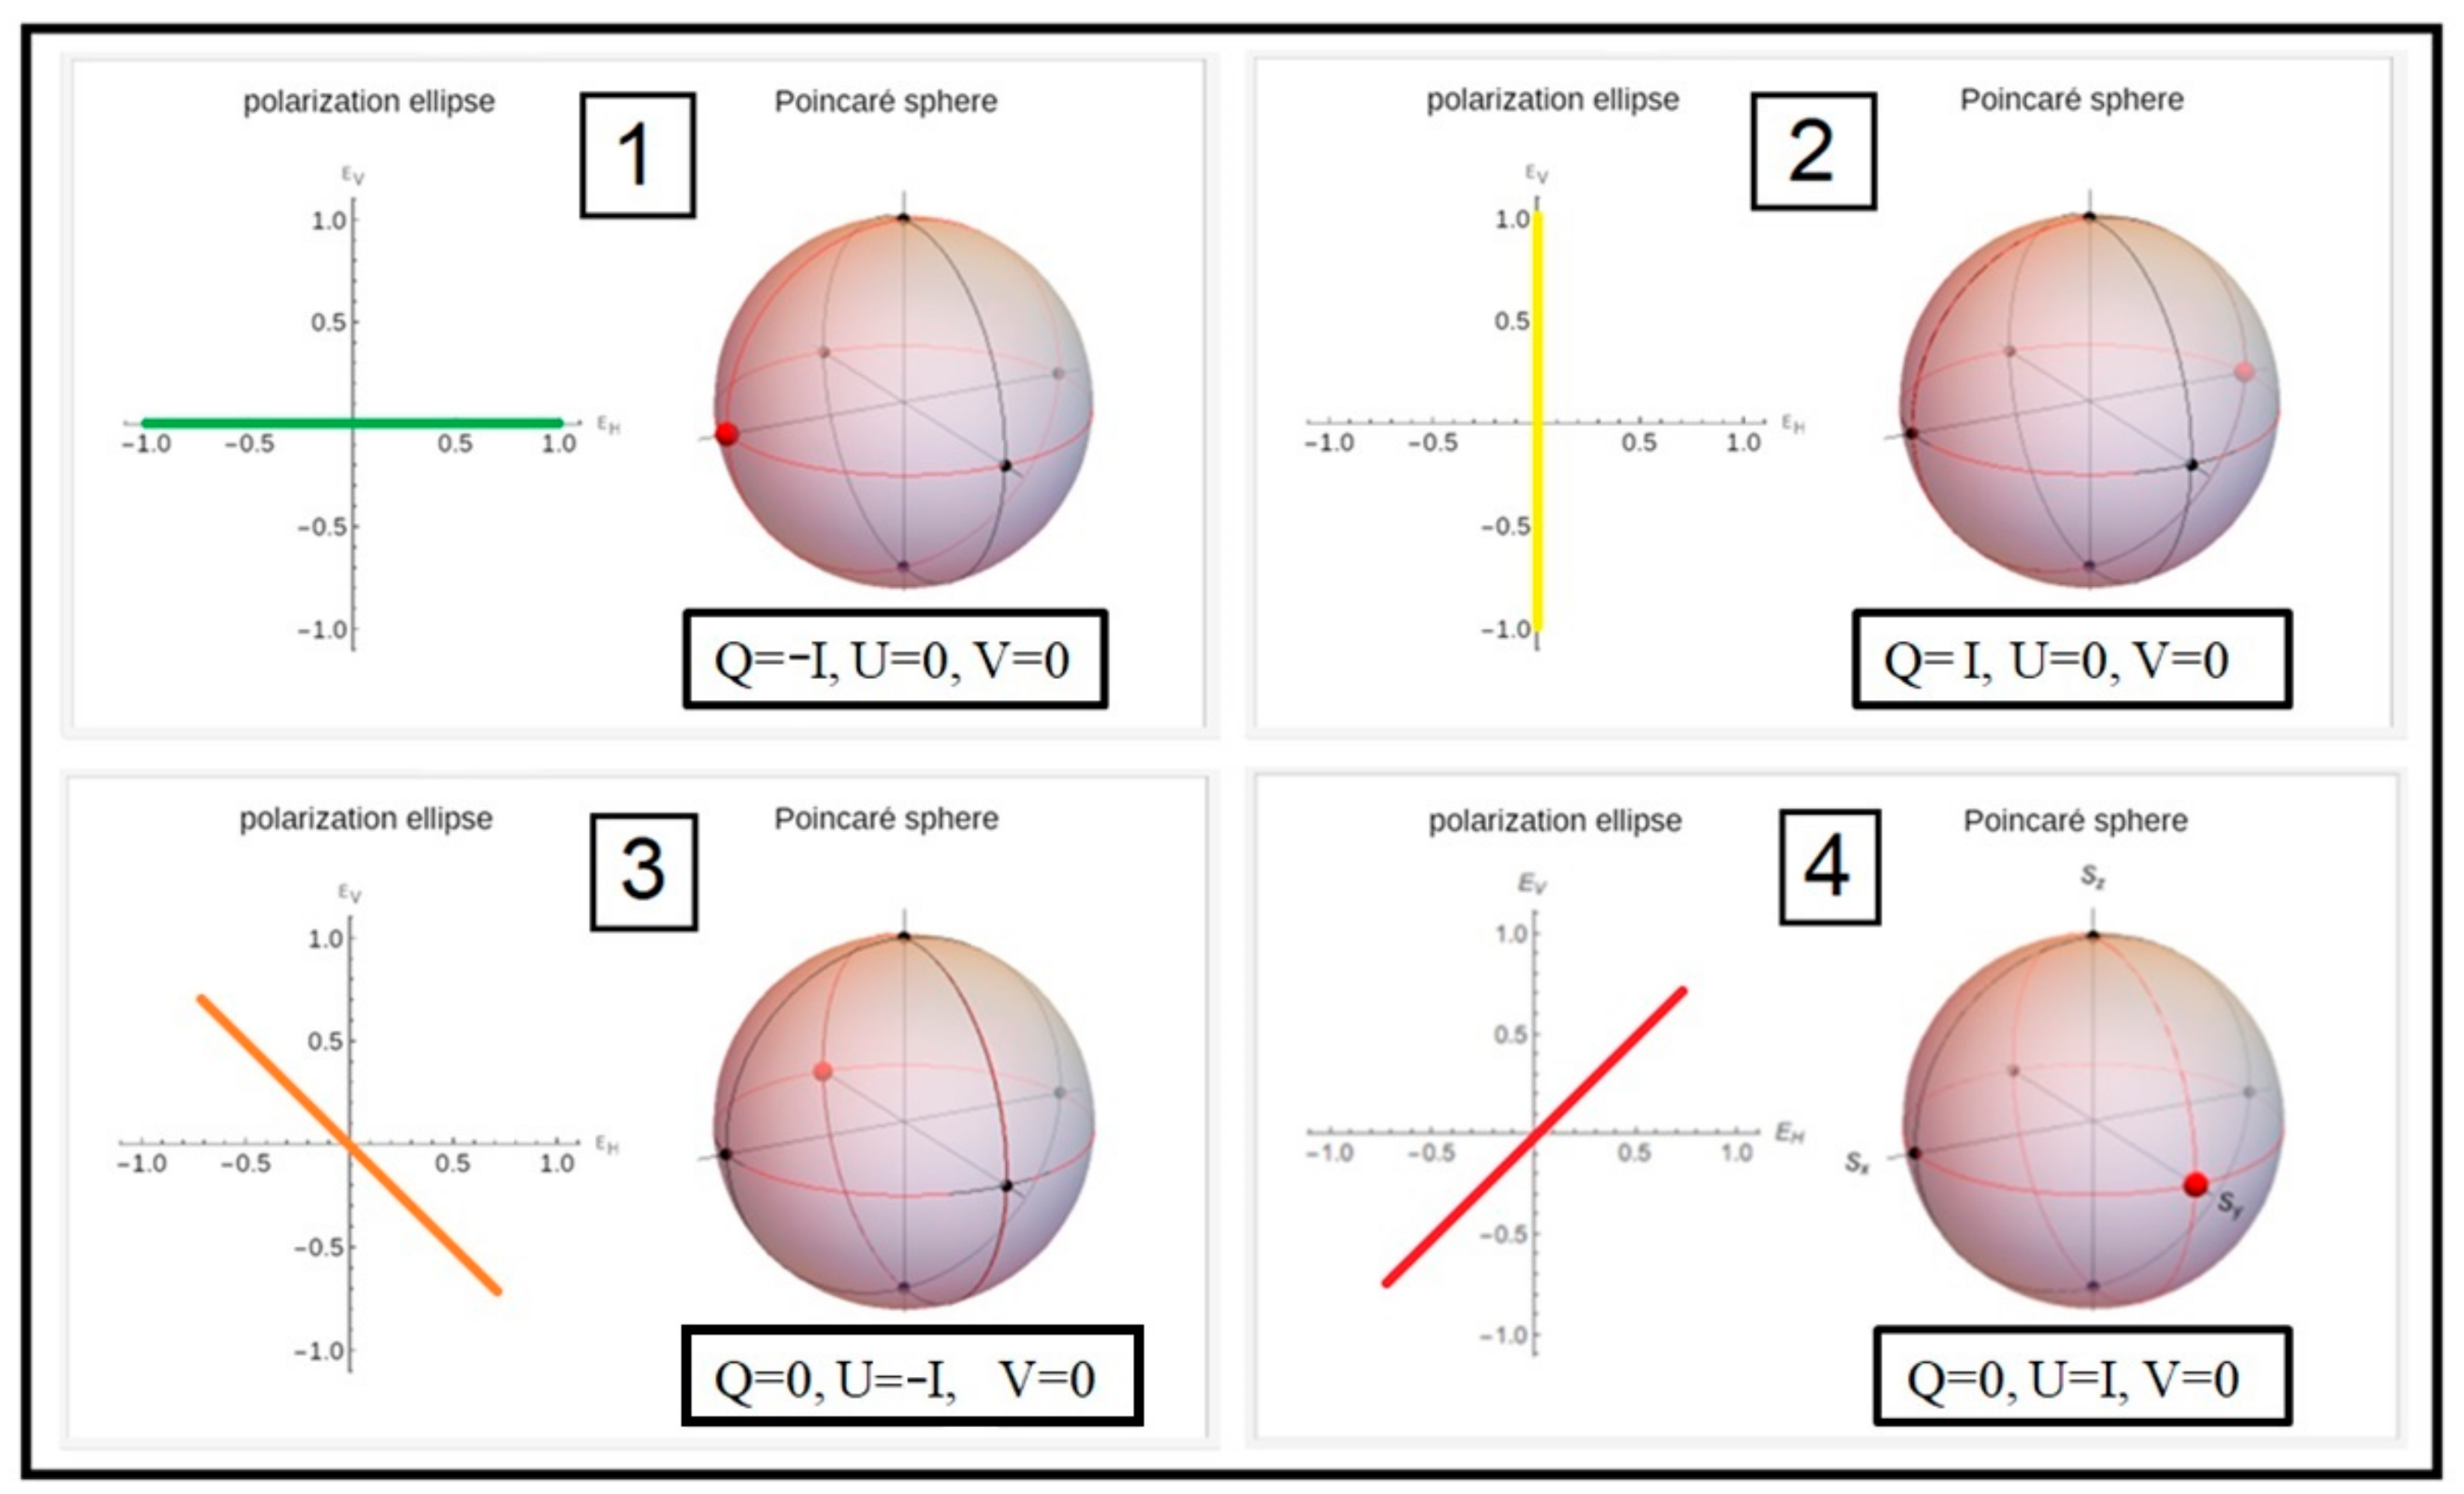
Observing Ferrocell linear polarization in a tetrapolar magnetic field. At each point in the Ferrocell plane, the electromagnetic wave has a characteristic polarization. The points with a minimum light intensity of the isogyres in (a) are represented in the magnetic field diagram (b) by the green and yellow straight segments tangent to these points, marked with the lines (1) and (2). At these points, the magnetic field and microneedles are perpendicular to the polarizer or analyzer. The points with maximum light intensity in (a) are represented with red and orange straight segments in (b), which show that the magnetic field and microneedles are at 45° with respect to the polarizer, marked with lines (3) and (4) in the magnetic field diagram. The magnetic field direction determines the orientation of the polarization of light.
Figure 12.
The Stokes parameters and correspondent Poincaré spheres [
31]. The Poincaré sphere is a good representation of the Stokes parameters of Equation (3). The Stokes parameters of a plane electromagnetic wave are always defined with respect to a reference plane containing the direction of wave propagation. The magnetic field induces a rotation in the reference plane around the propagation direction, thus the Stokes parameters are modified according to the rotation transformation rule. The colors red, orange, green, and yellow have the same correspondence as in
Figure 11.
Figure 13.
Ferrocell and the hexapolar magnetic field. In (a), we have the light pattern obtained with the Ferrocell in the presence of a symmetrical hexapolar magnetic field in (b), where we can see the formation of three lines of isogyres intersecting. In the magnetic field diagram in (b), we represent the polarization of local light with the green and blue line segments of some of the isogyre lines.
Figure 14.
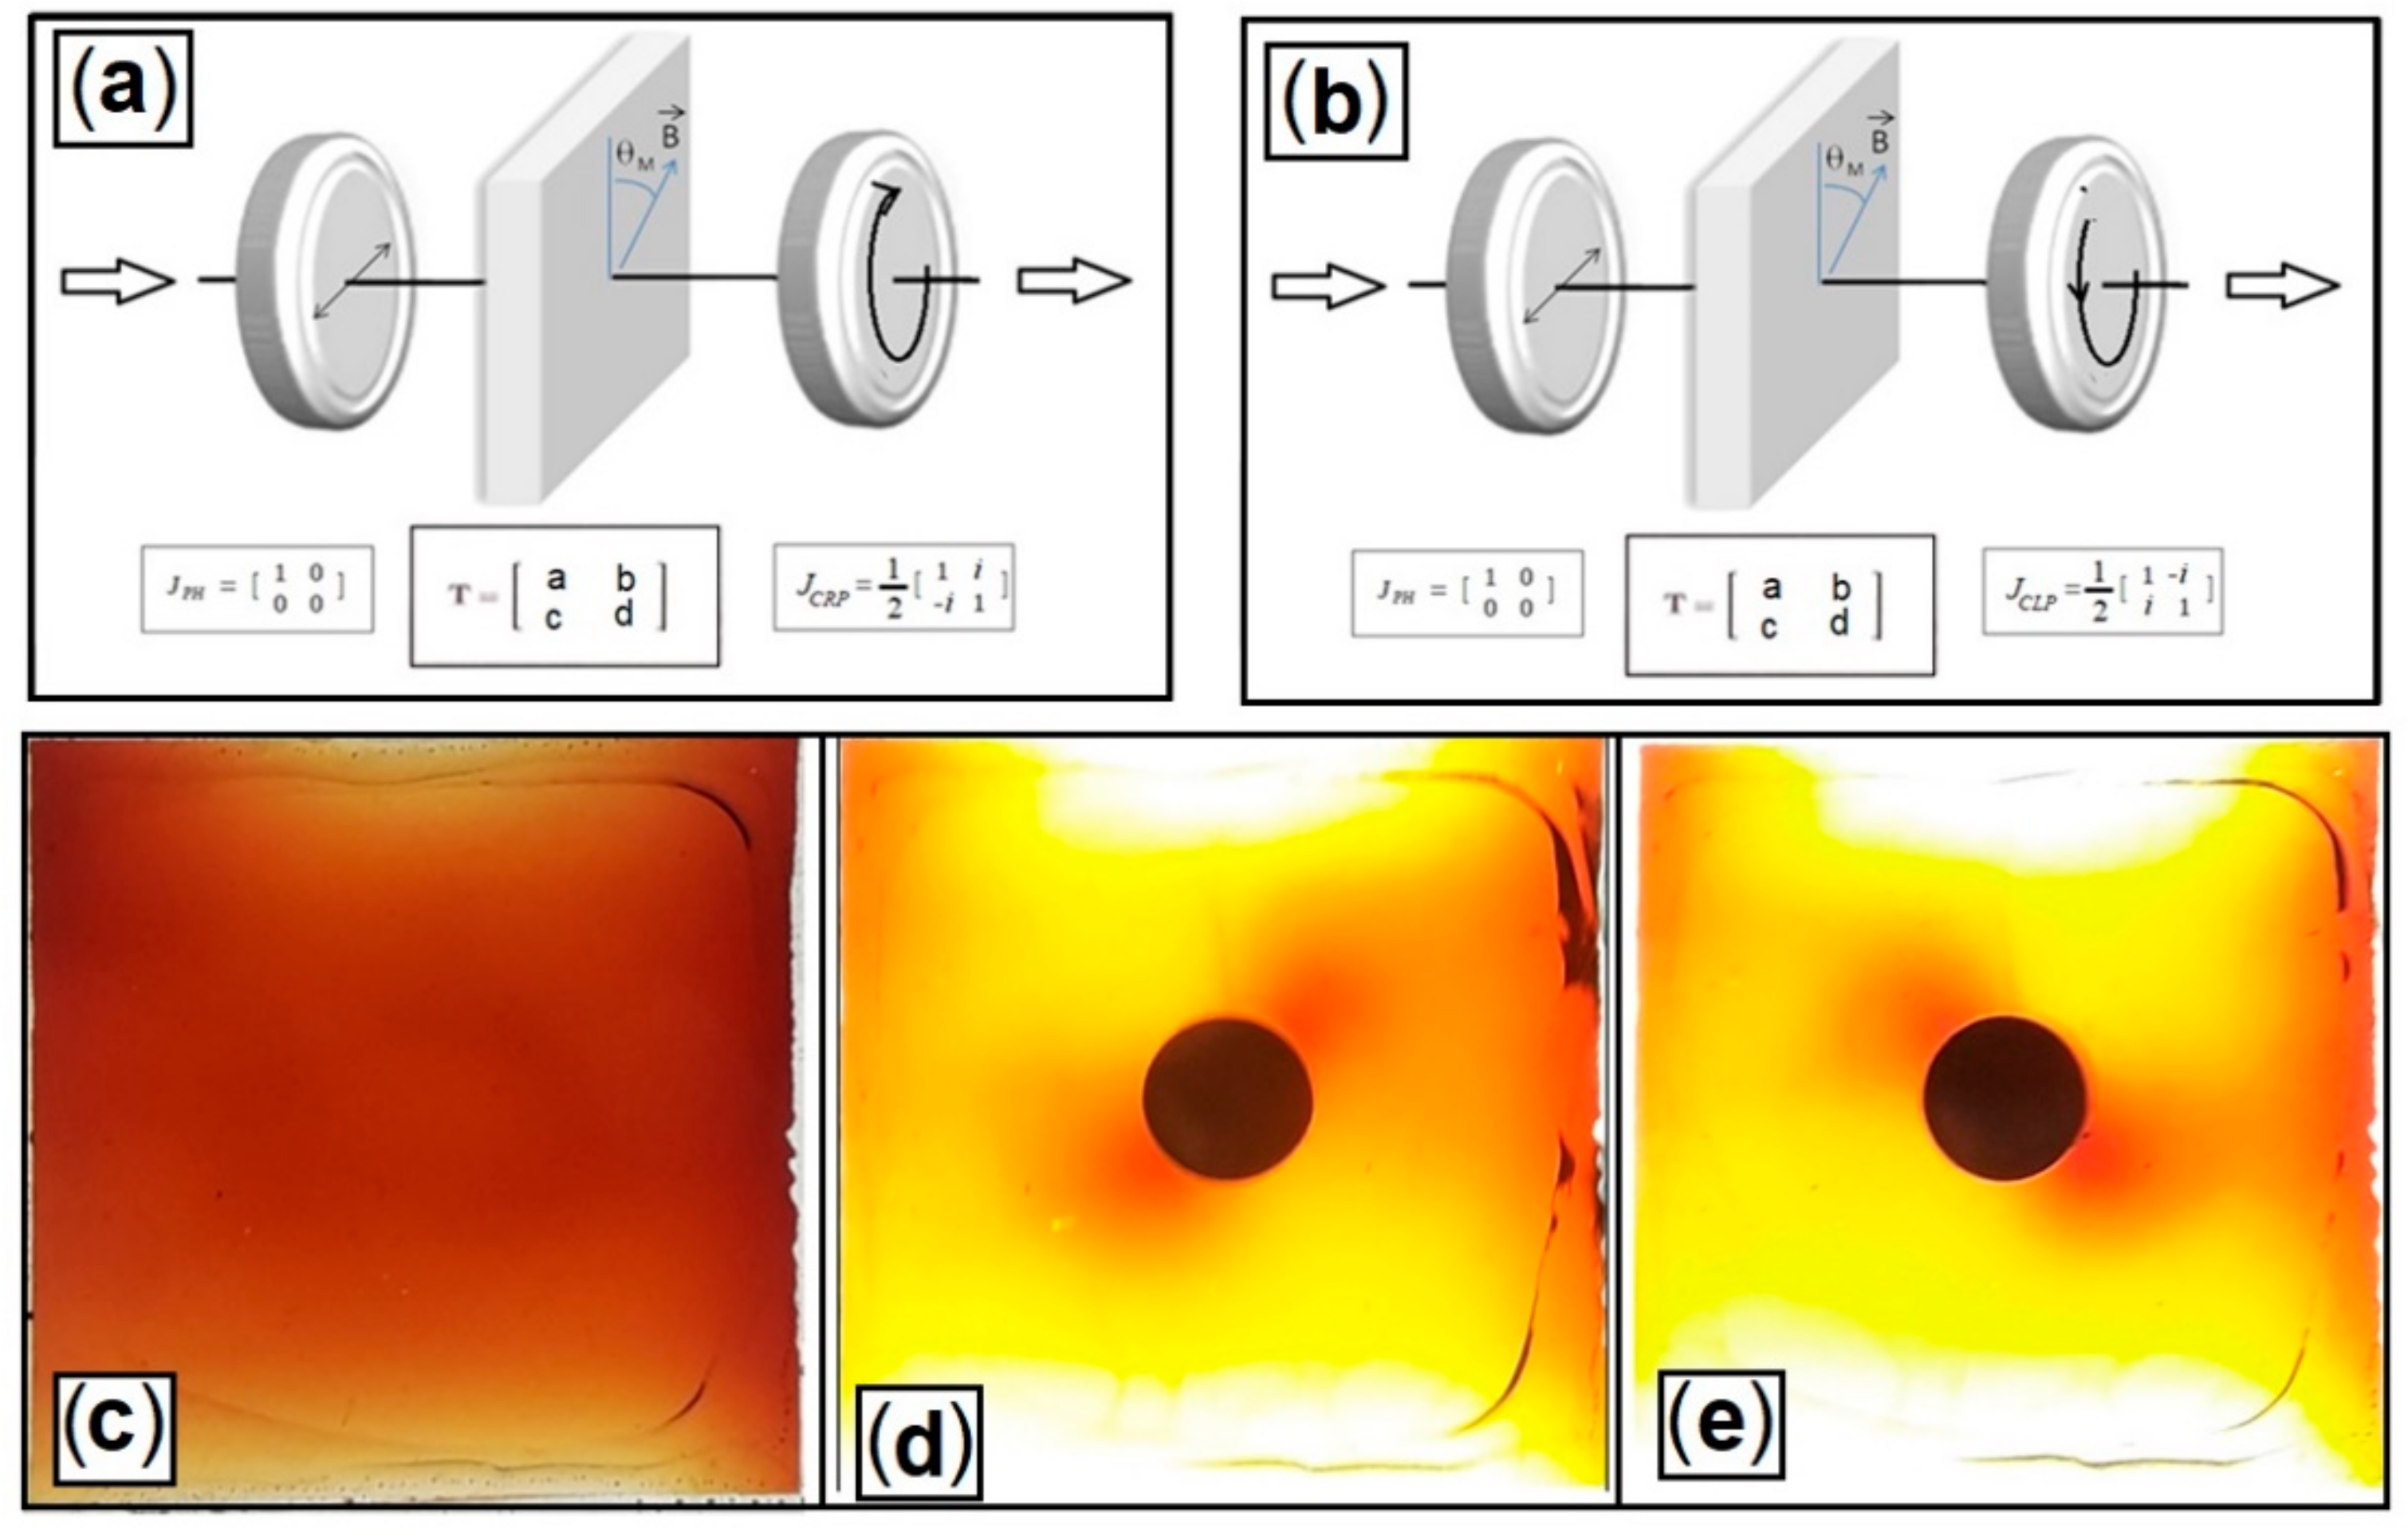
Circular polarization and the Ferrocell. We used a linear polarizer and a circular analyzer. The polariscopes are used to observe right-handed/clockwise circularly polarized in (a) and left-handed/counterclockwise circularly polarized light in (b). We see in (c) the Ferrocell without a magnetic field, in (d) the light patterns for the right circular polarization cases, and in (e) left circular polarization, using the monopolar magnetic field configuration. Compared with the case of linear polarization, we see that we now have two regions forming darkened lobes instead of having four luminous lobes. Another feature in these patterns is that the lobes seen with the right circular polarization are centered on a diagonal line that is perpendicular to the diagonal where the dark lobes of the left circular polarization are centered.
Figure 15.
In this polariscope configuration in (a), we have the diagram of a circular polarizer oriented inversely to the circular analyzer. In (b), we see the polariscope system with the Ferrocell without a magnetic field, with light being practically prevented from passing through the system. In (c), we have a right circular polarizer, a Ferrocell with a monopolar magnetic field, and a left circular analyzer. In (d), we have a left circular polarizer, a Ferrocell with a monopolar magnetic field, and a right circular analyzer. Compared to the previous case, in the current case, we have color separation.
Figure 16.
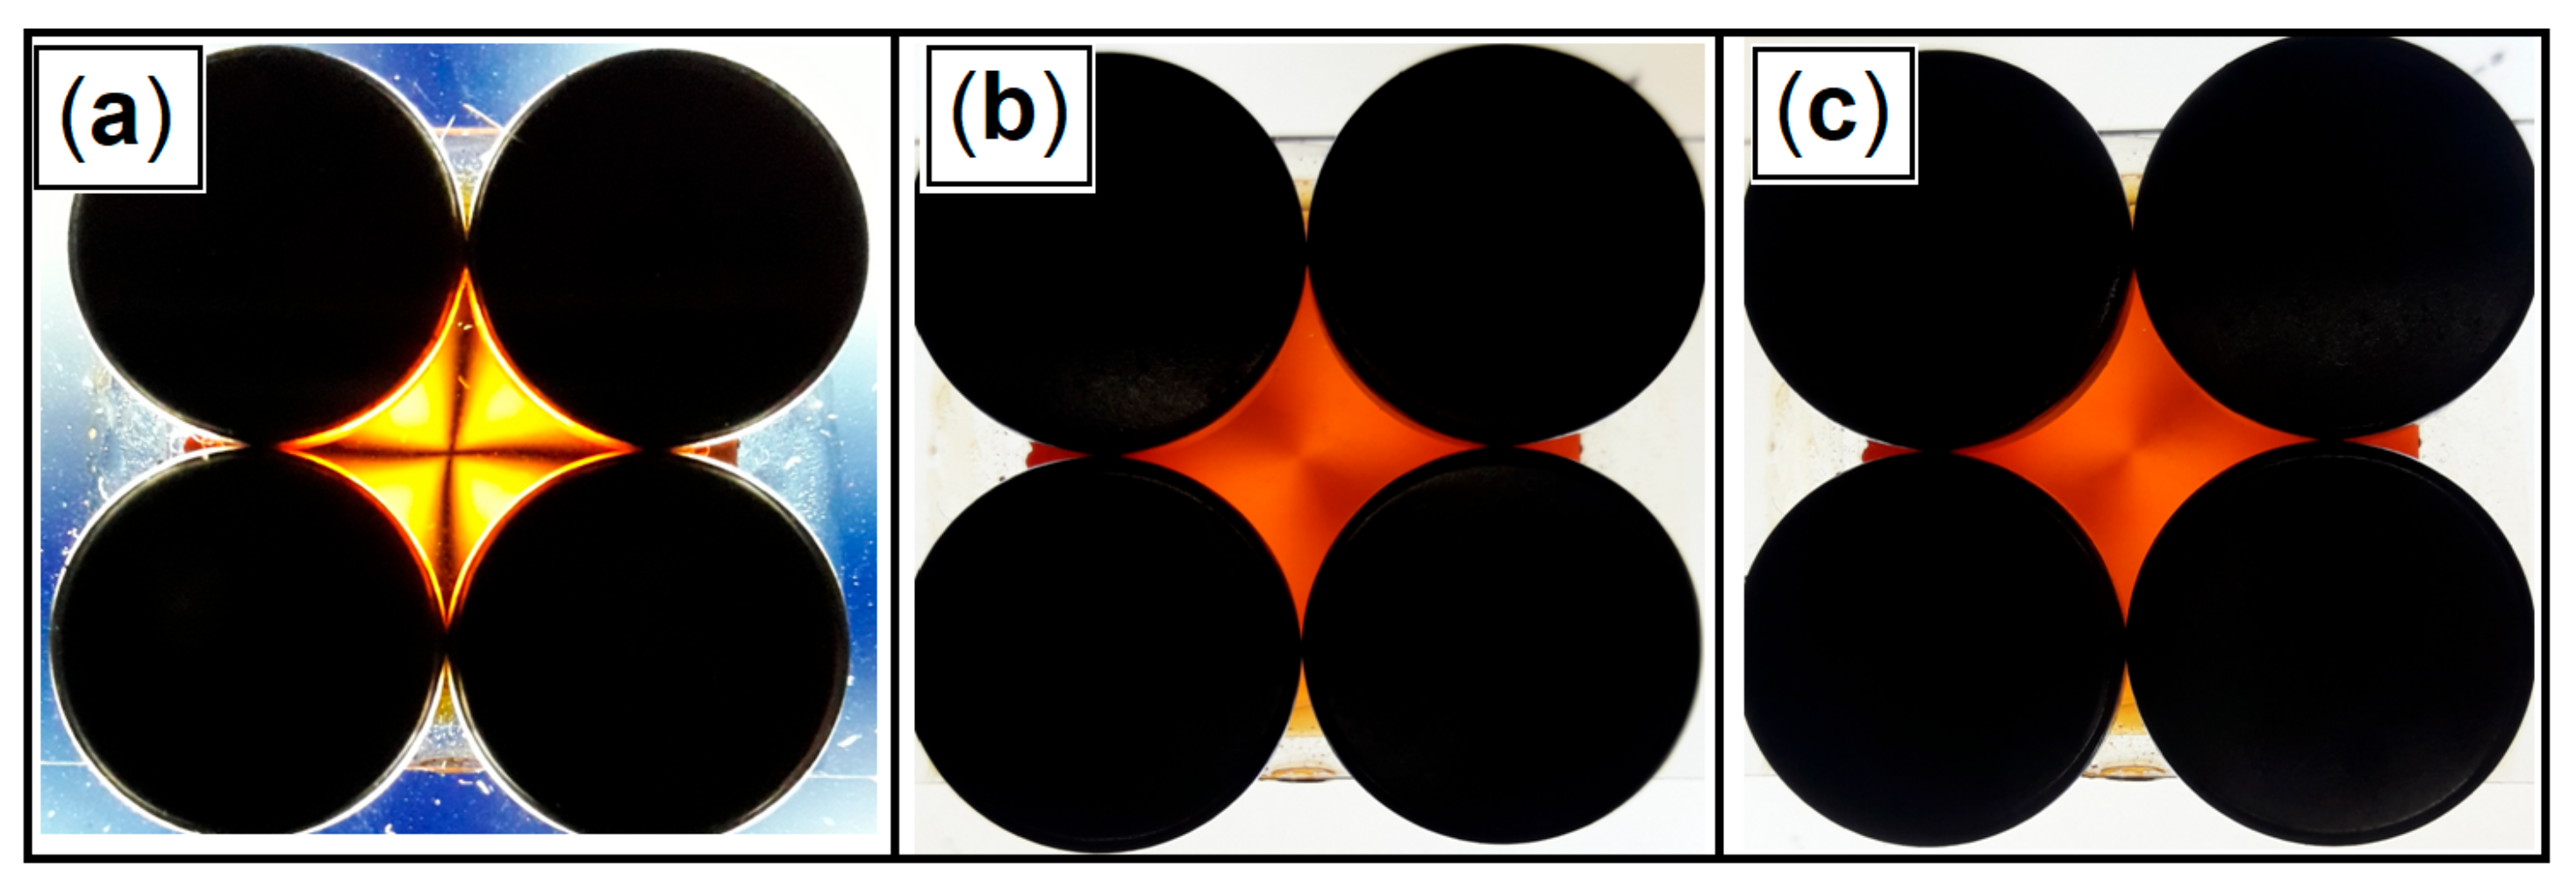
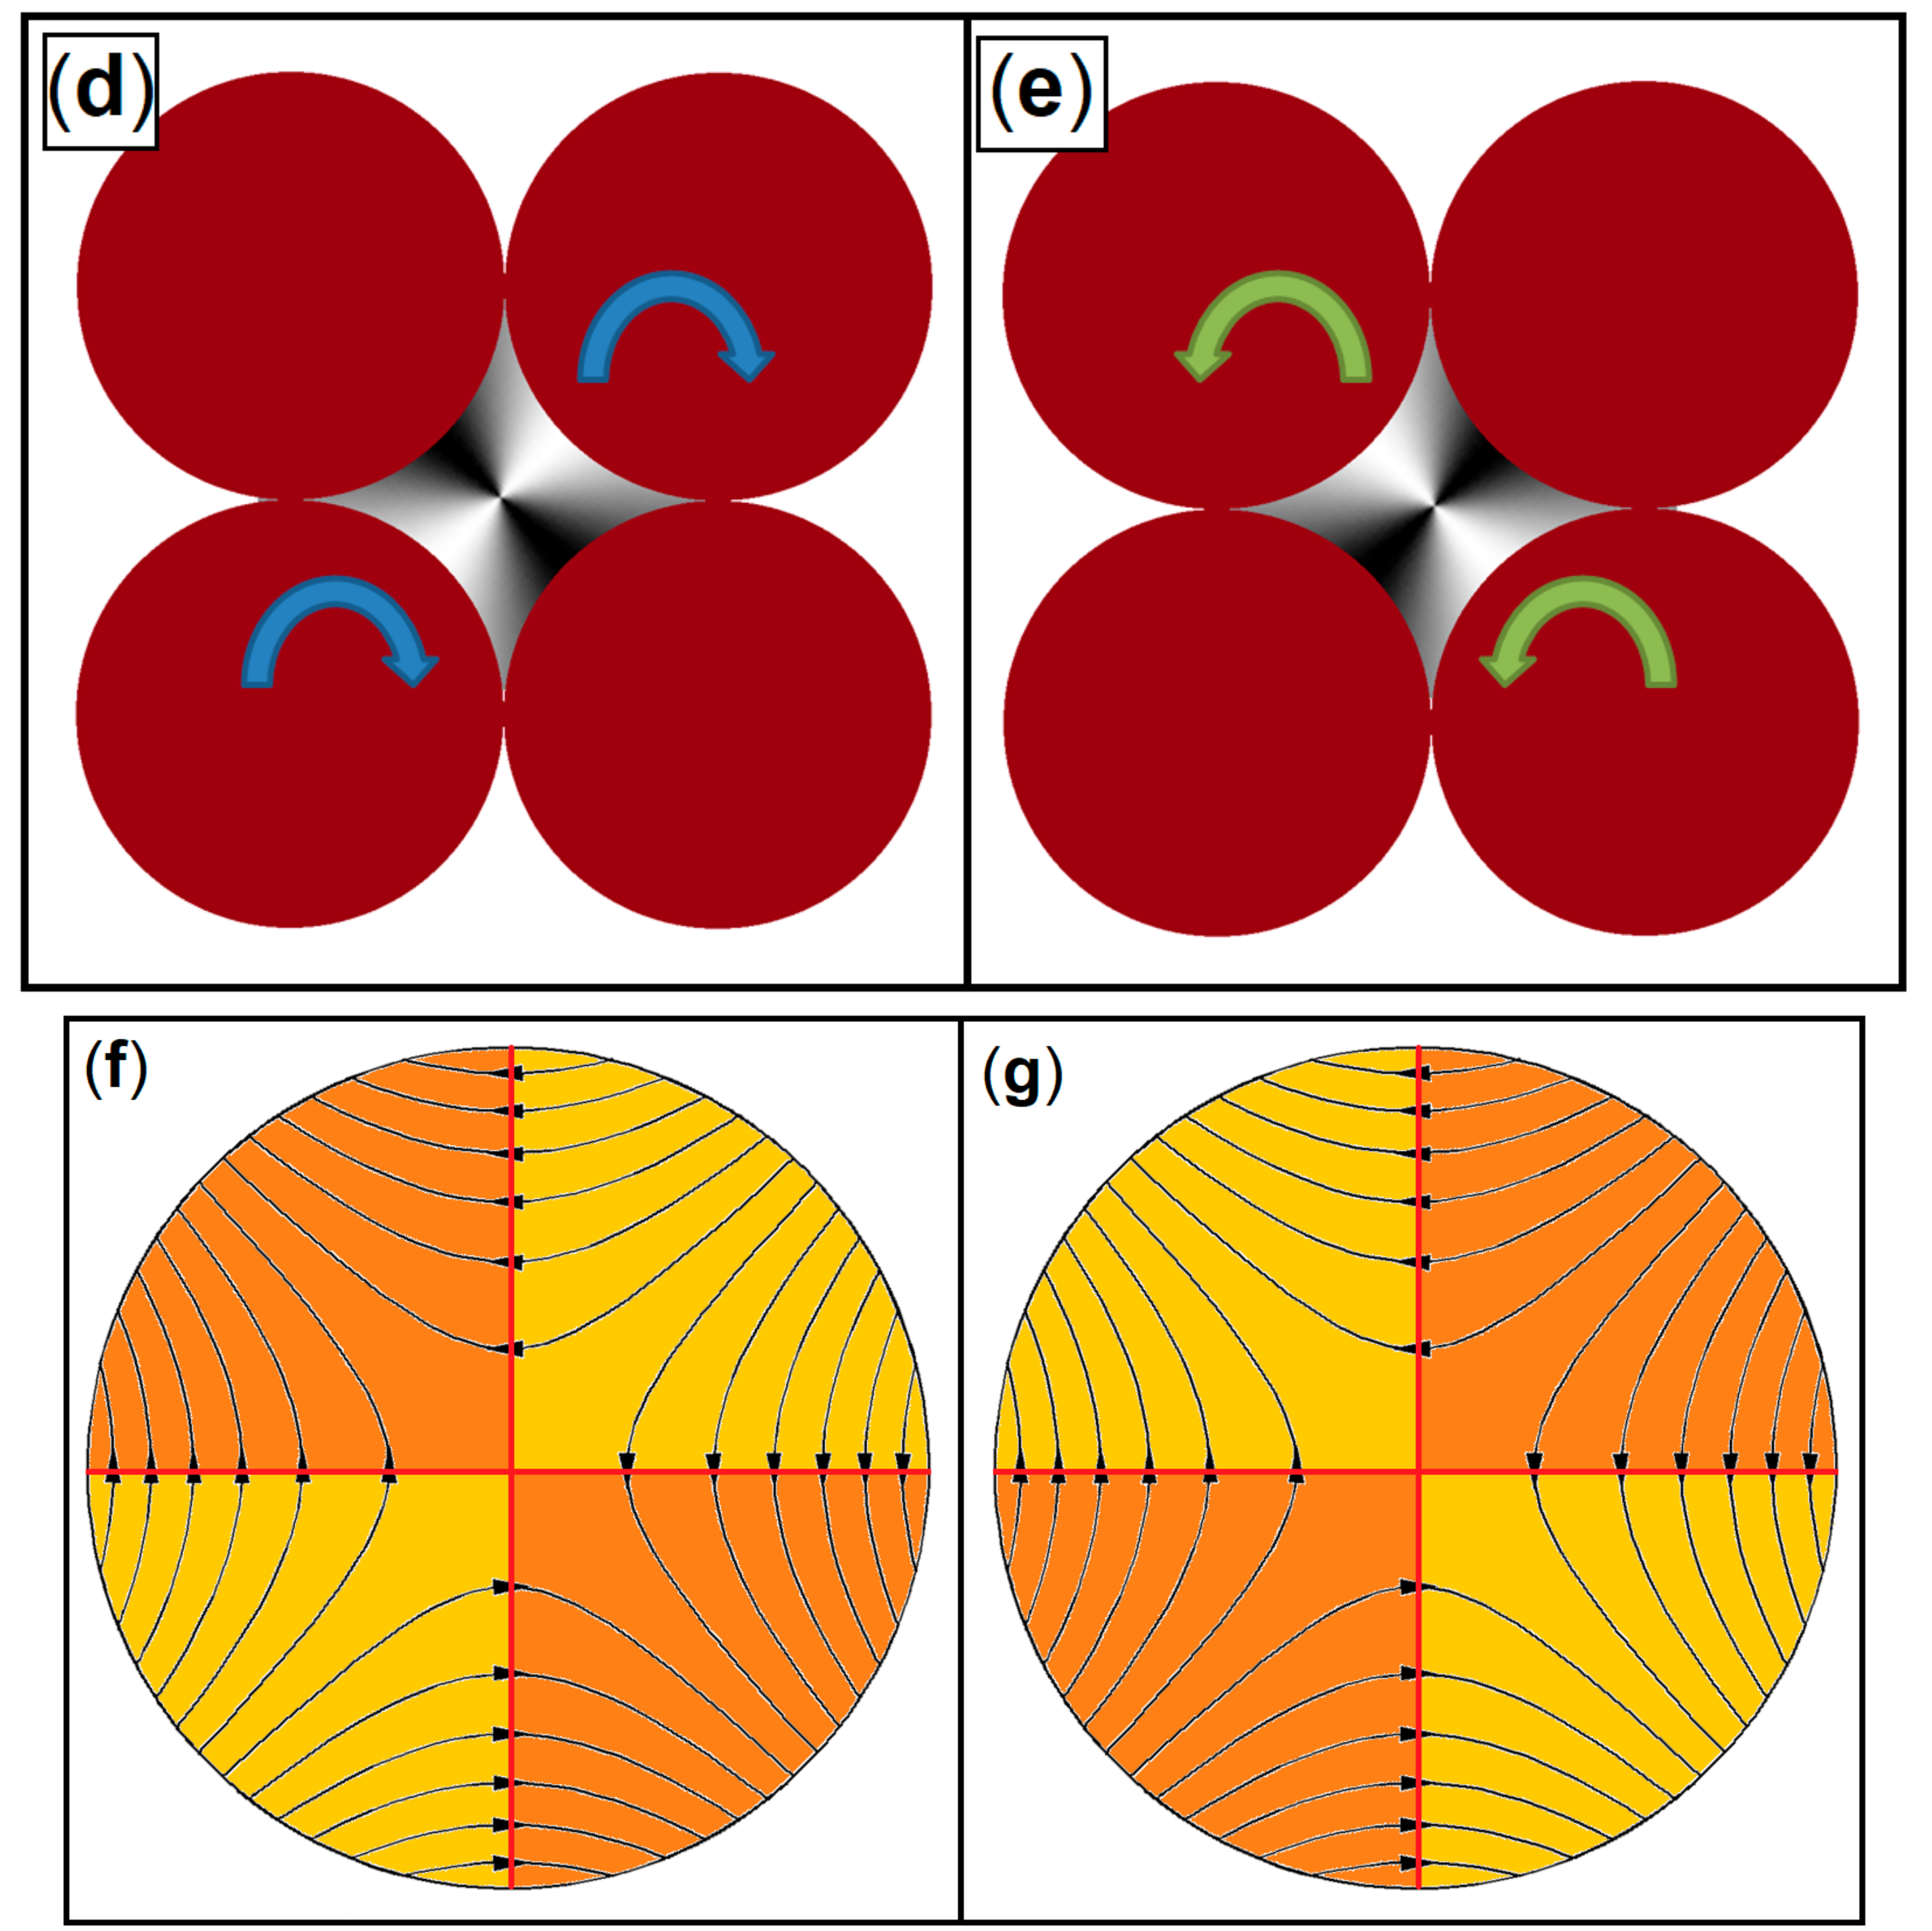
Circularly polarized light and tetrapolar field in Ferrocell. In these polariscopes, the light passes through a linear polarizer, through Ferrocell with a tetrapolar magnetic field and the analyzer will be changed in each case. In (a), we have a linear analyzer, in (b) a left circular analyzer, and in (c) a right circular analyzer. The diagram in (d) shows left circularly polarized light on one diagonal and the diagram in (e) shows right circularly polarized light on the other diagonal. In (f), (g), we show the magnetic field diagrams for each case of circular polarization orientation, indicating the regions of light intensity decrease with orange color and the intensity increase with yellow color.
Figure 17.
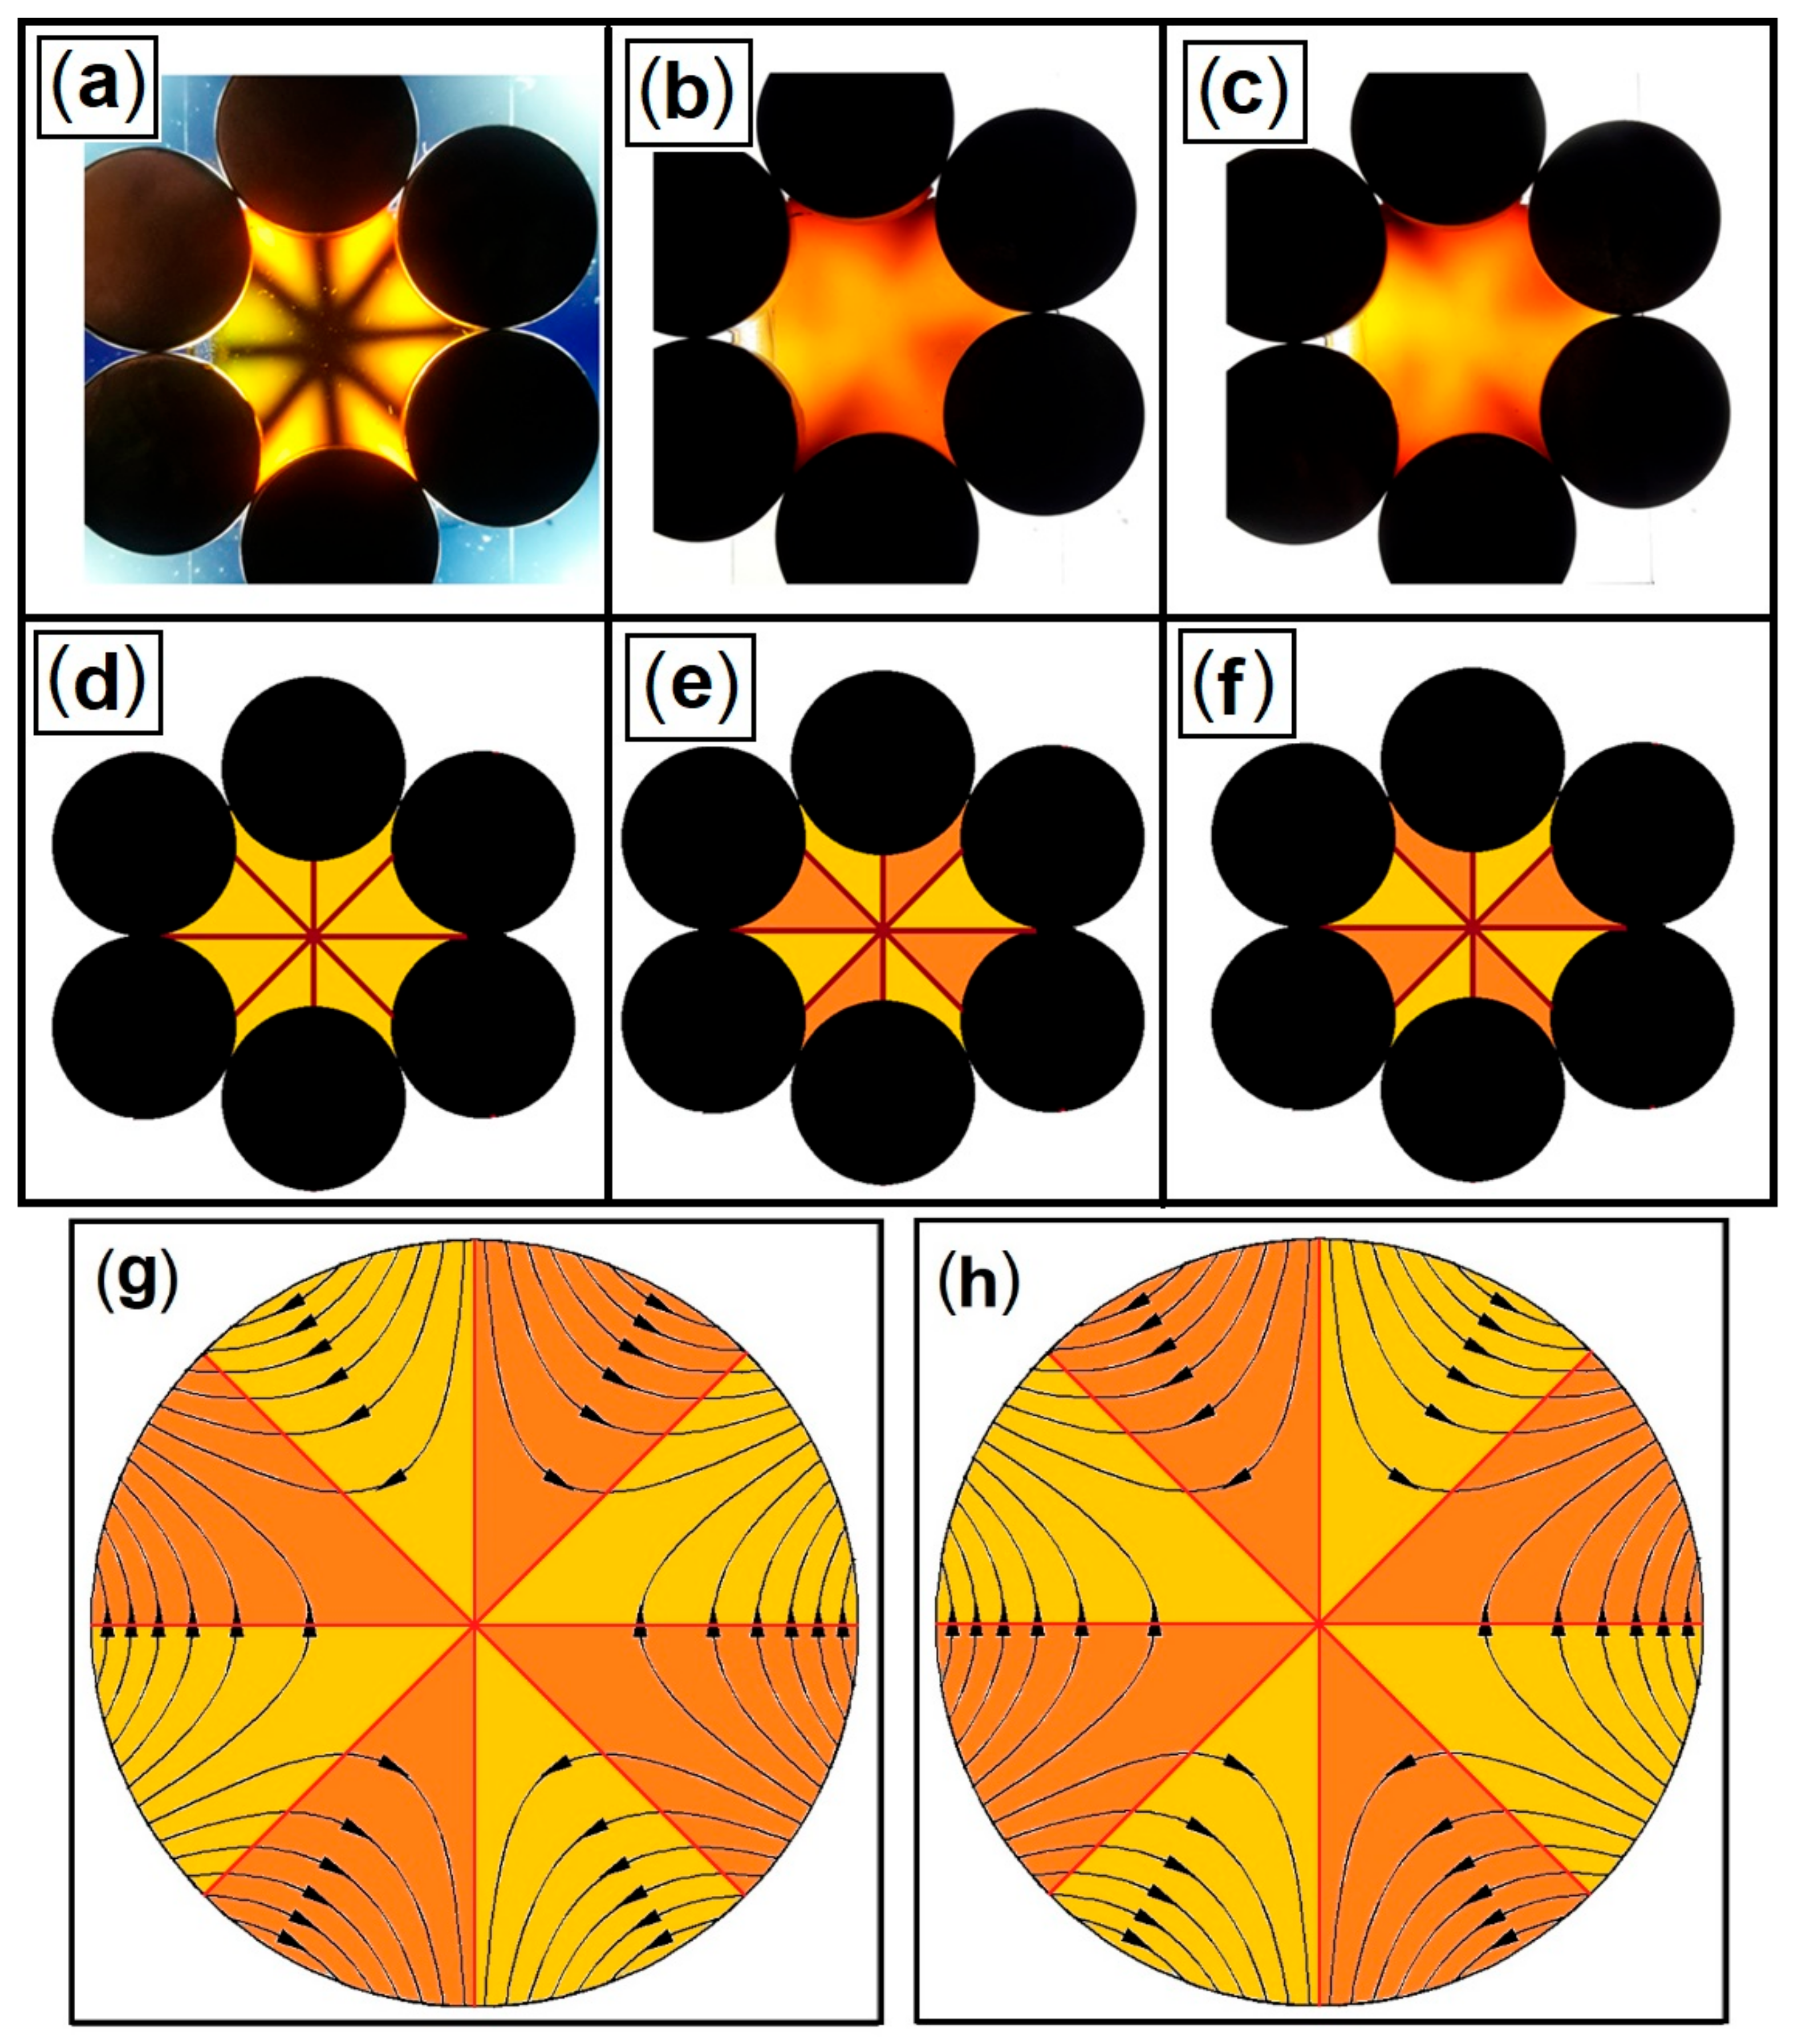
Circularly polarized light and hexapolar magnetic field in Ferrocell. In (a), we have the case of linear polarization, in (b) the circular polarization to the right, and in (c) the circular polarization to the left. Using yellow color for maximum intensity and orange color for minimum intensity, we show in (d) the diagram for linear polarization, in (e) the right circular polarization, and in (f) the left circular polarization. In (g), we have the diagram of the horizontal magnetic field with the superposition of lighter and darker regions for the right circular polarization and in (h) for the left circular polarization.
Figure 18.
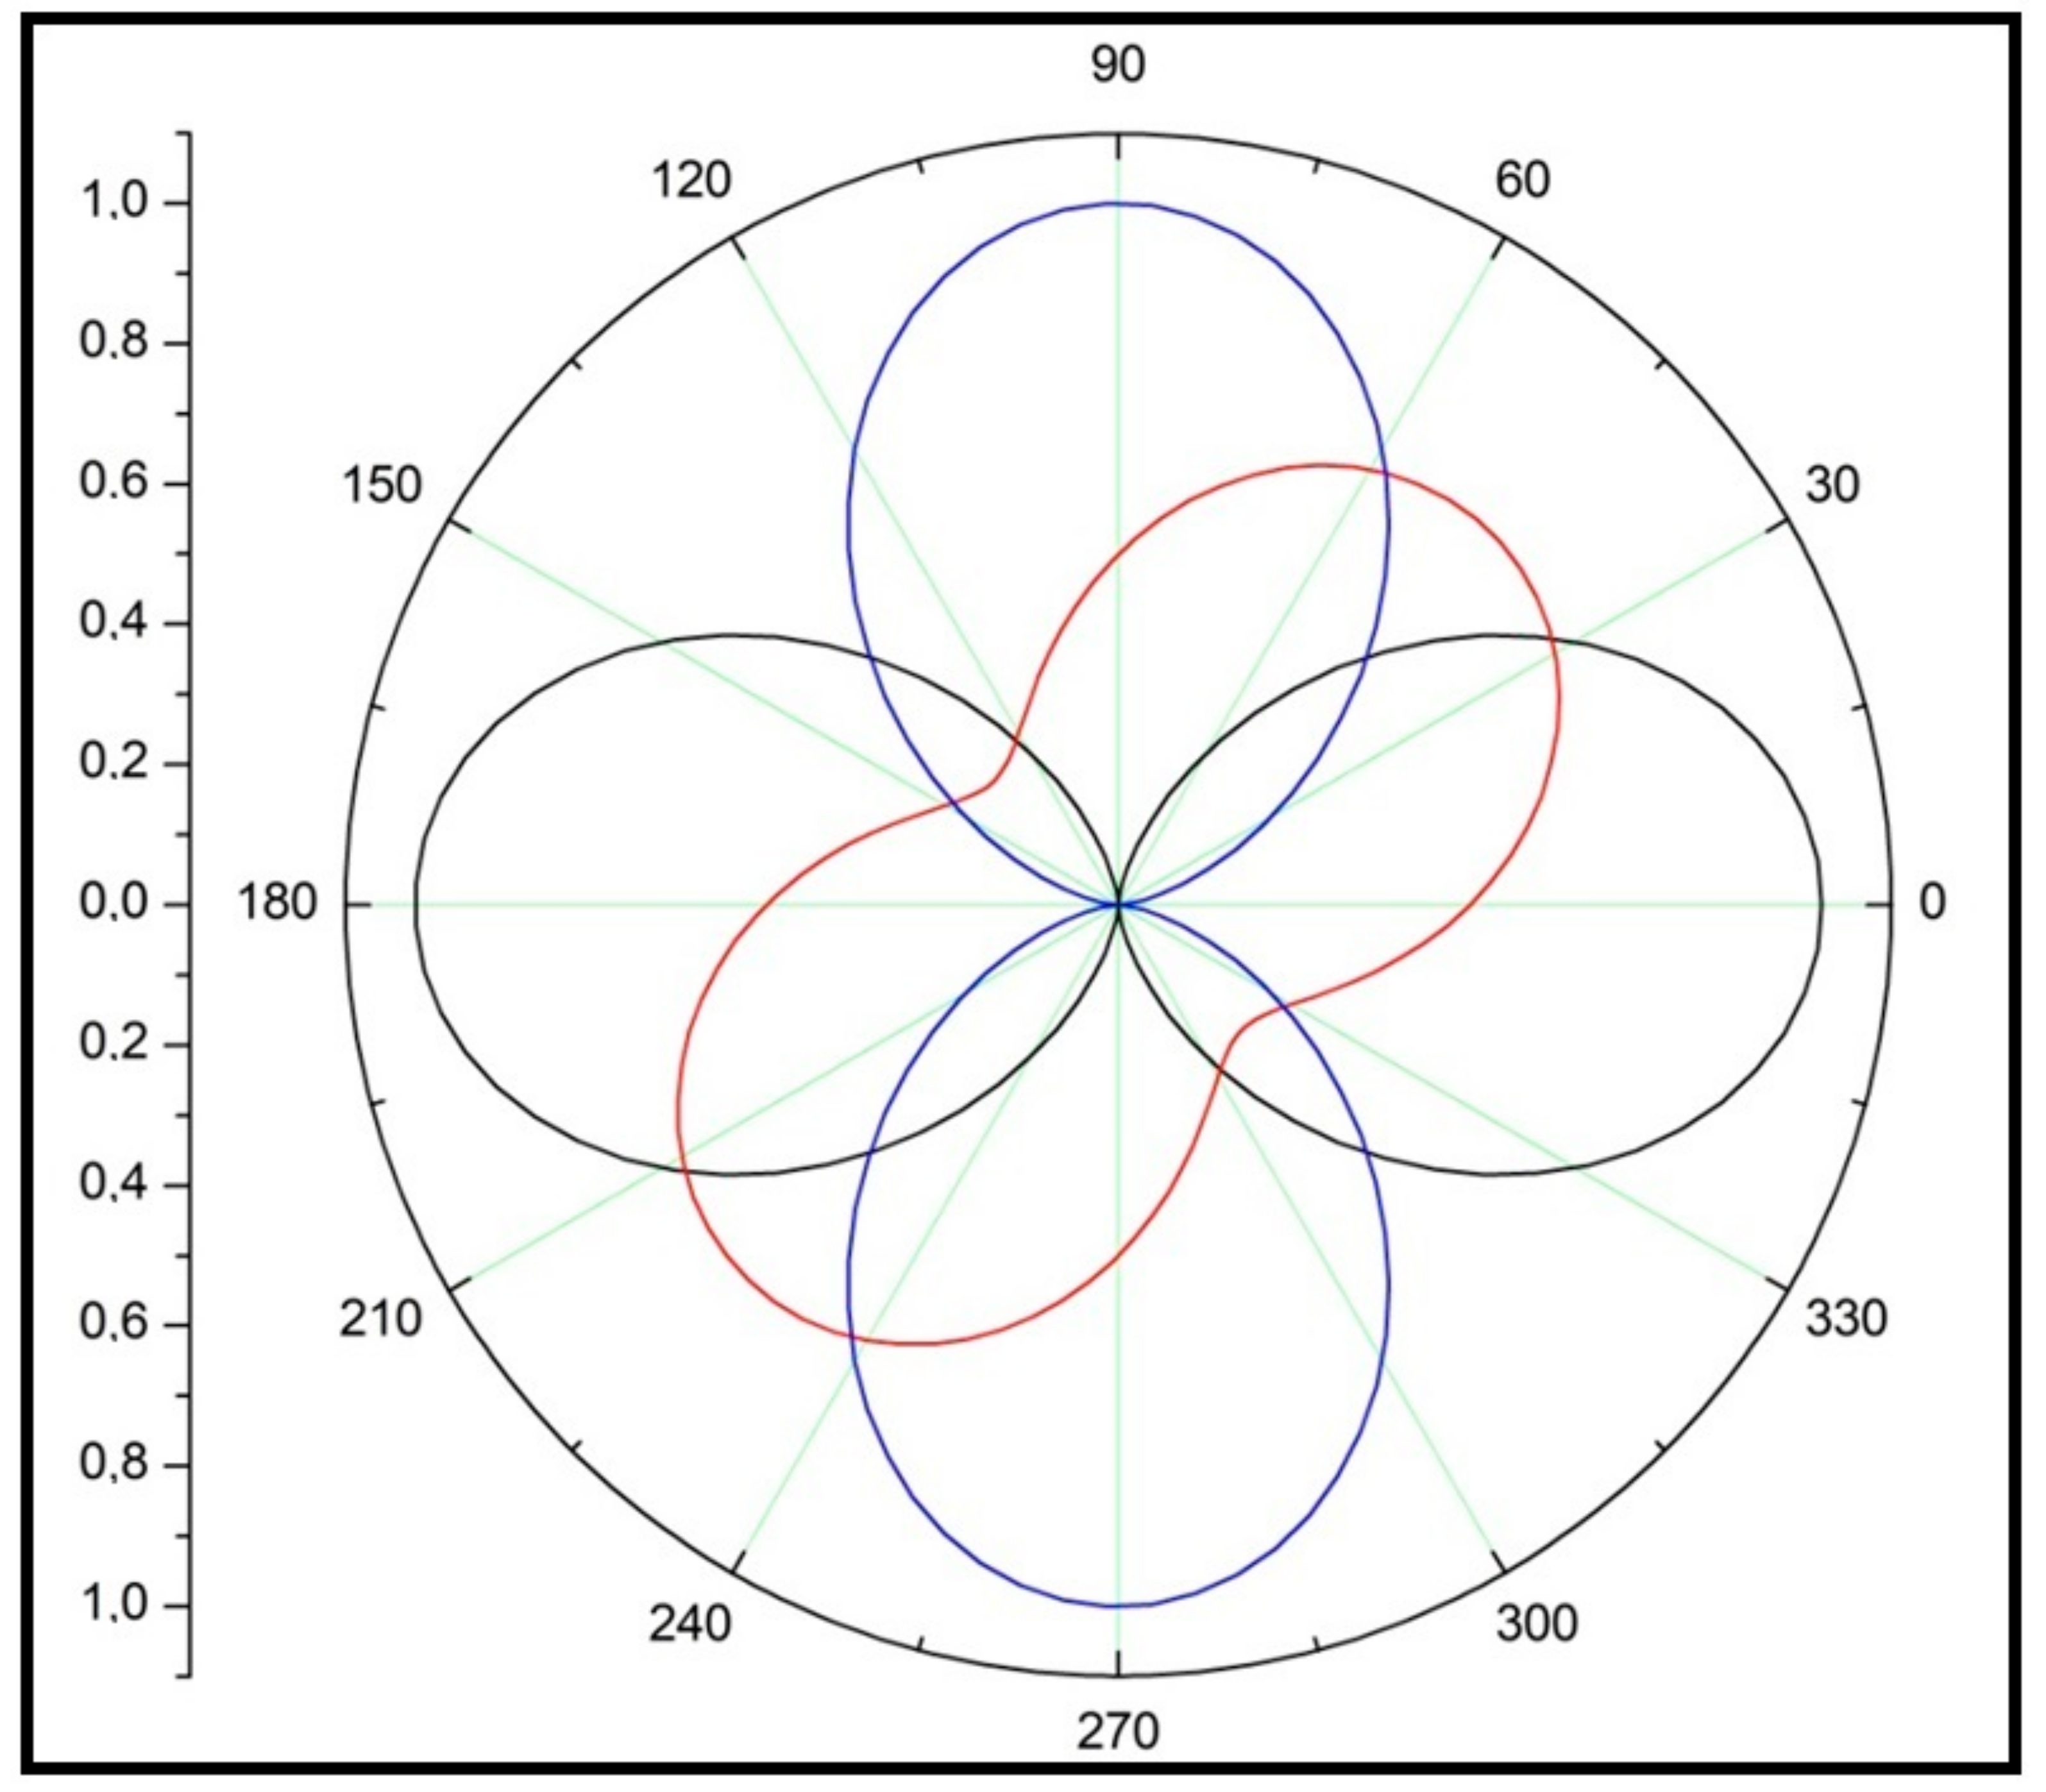
Luminous intensities in polar coordinates for the Stokes vector for the case of ∆ = 0 and λ = 0 (black line) and ∆ = 0 and λ = 1 (blue line) and ∆ = π/3 and λ = 1/ (red line).
Figure 18.
Luminous intensities in polar coordinates for the Stokes vector for the case of ∆ = 0 and λ = 0 (black line) and ∆ = 0 and λ = 1 (blue line) and ∆ = π/3 and λ = 1/ (red line).
Figure 19.
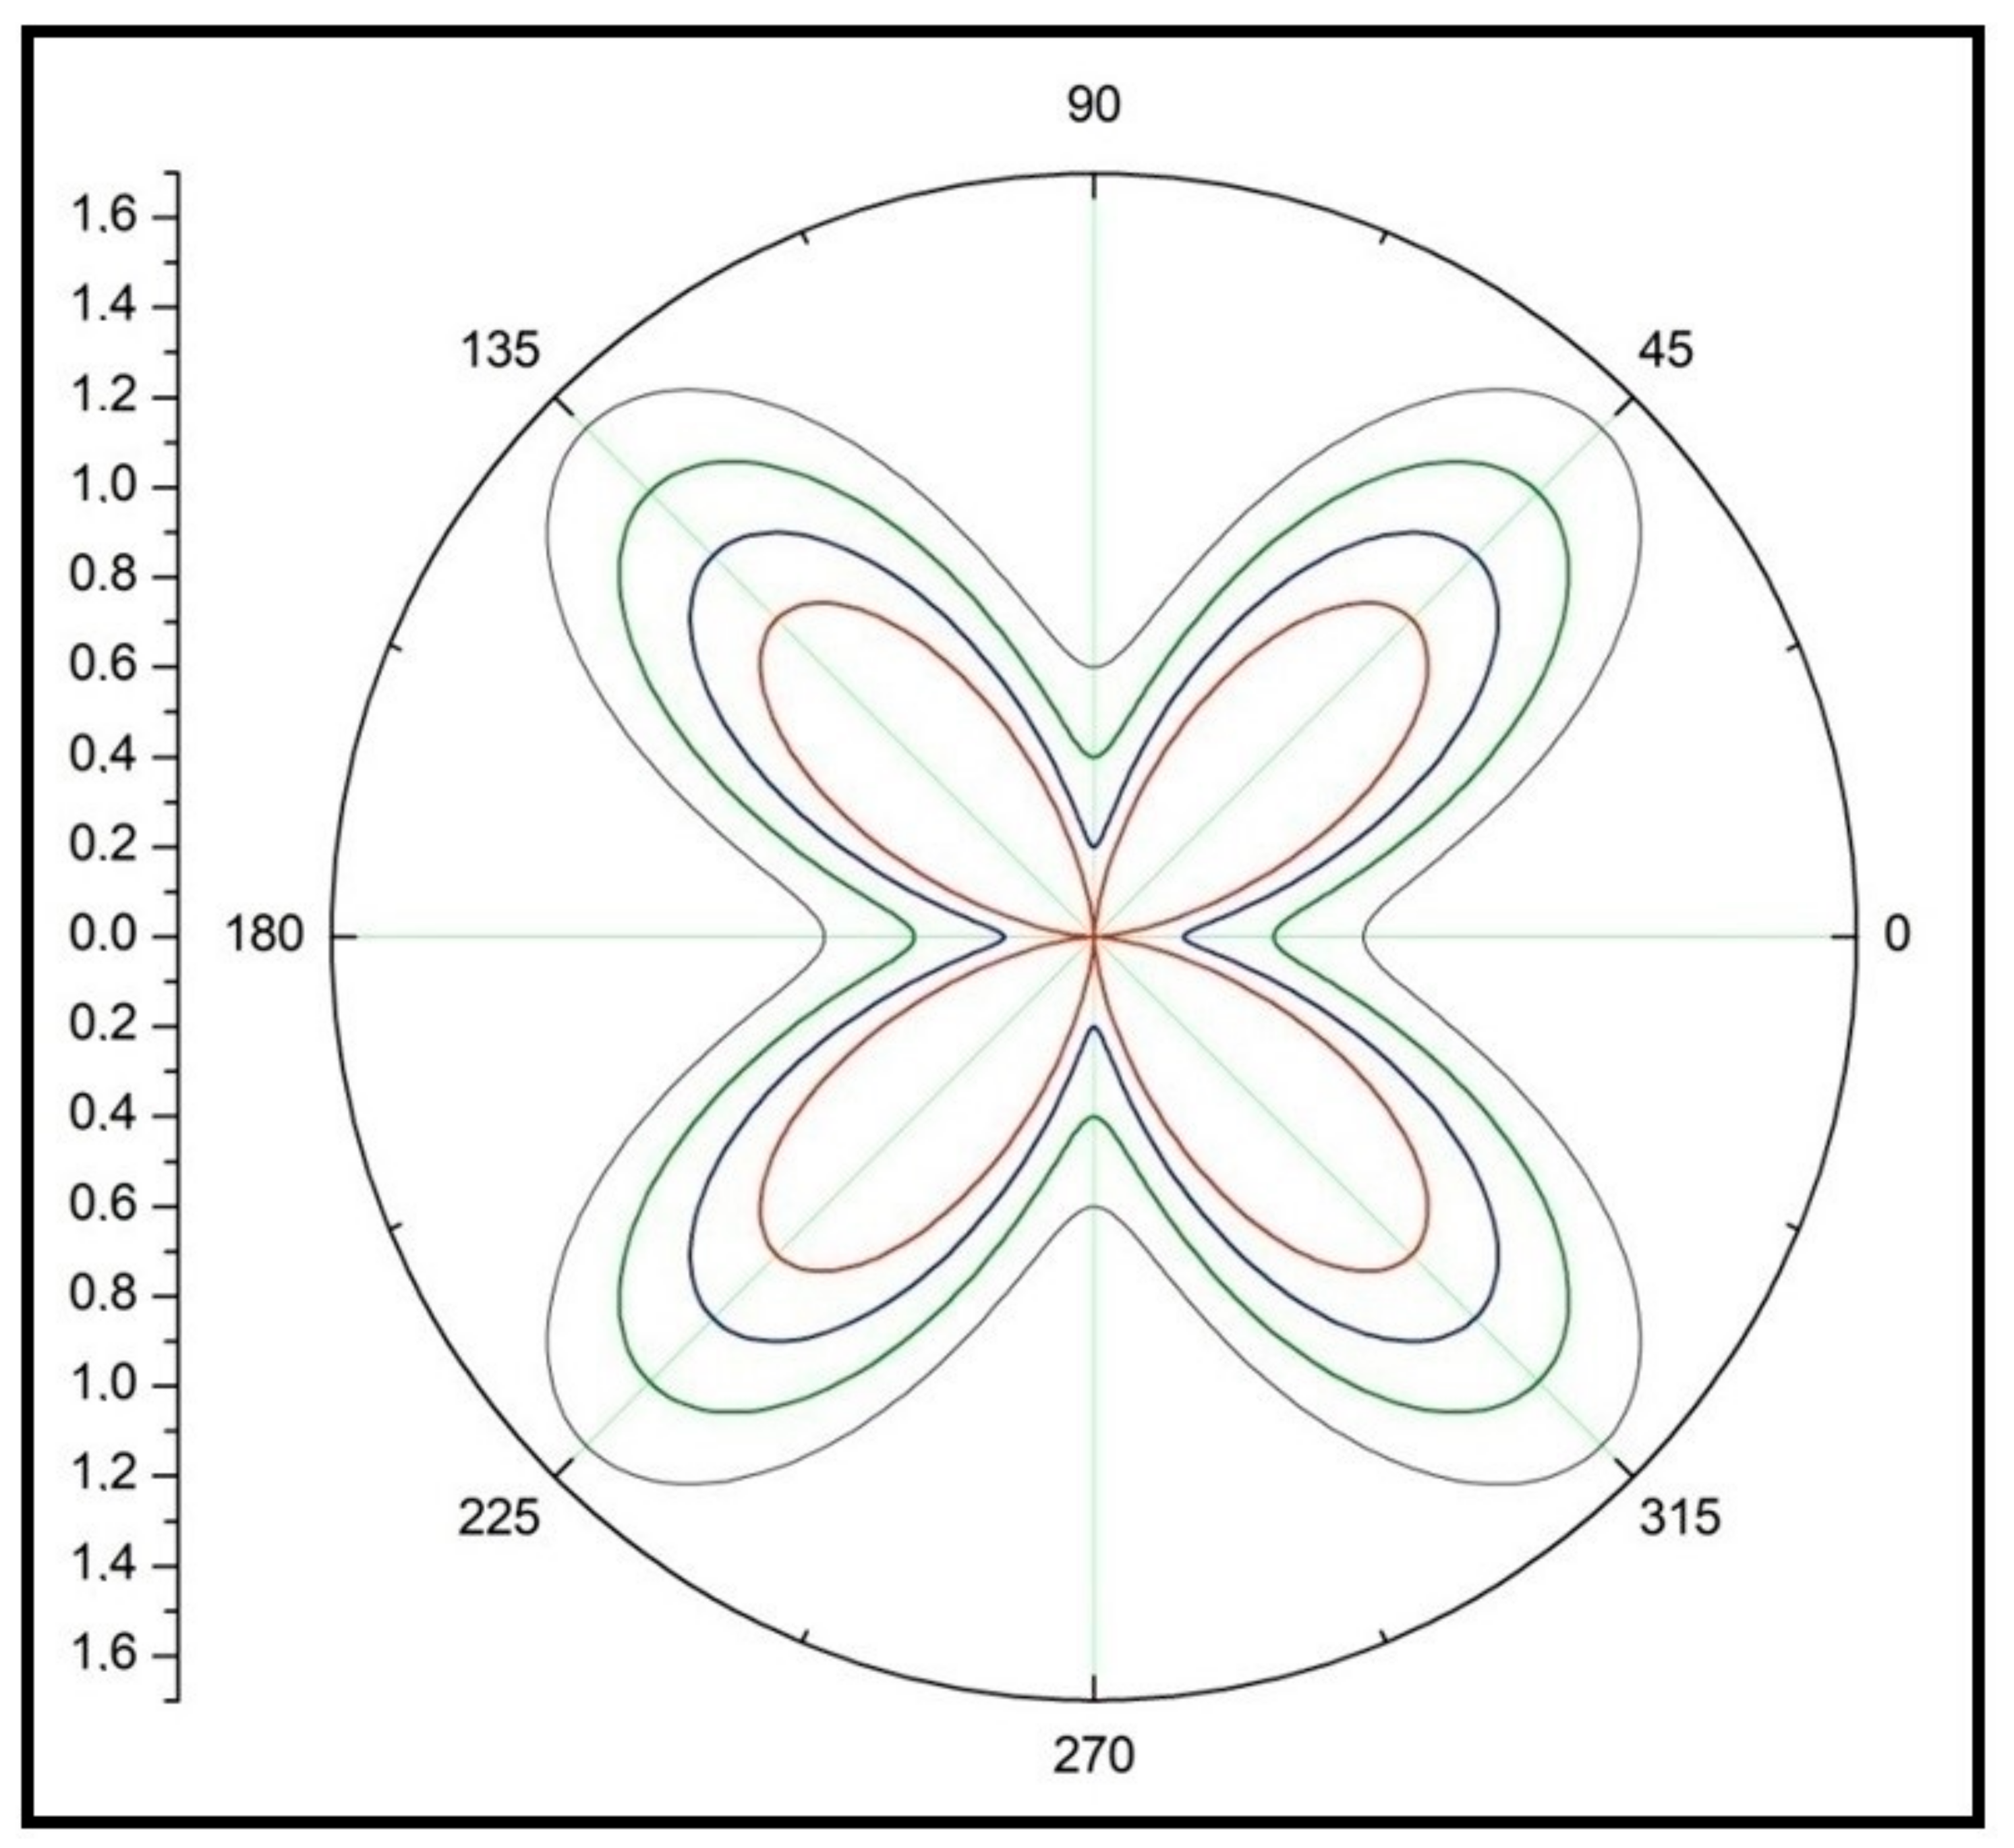
Polar plots for Stokes vector luminous intensity for the function of Equation (17) for ∆ = 0 (red line), ∆ = 0.20 (blue line), ∆ = 0.40 (green line) and ∆ = 0.60 (gray line).
Figure 19.
Polar plots for Stokes vector luminous intensity for the function of Equation (17) for ∆ = 0 (red line), ∆ = 0.20 (blue line), ∆ = 0.40 (green line) and ∆ = 0.60 (gray line).
Figure 20.
The two polar plots of the Stokes vector intensity refer respectively to the polarization states of light for Equation (18) for ∆ = 0.53 (blue line) and for ∆ = 1.00 for (red line).
Figure 20.
The two polar plots of the Stokes vector intensity refer respectively to the polarization states of light for Equation (18) for ∆ = 0.53 (blue line) and for ∆ = 1.00 for (red line).
