Article

Study of Multi-Pixel Scintillator Detector Configurations for Measuring Polarized Gamma Radiation

1
Department of Physics, Faculty of Science, University of Zagreb, Bijenička c. 32, 10000 Zagreb, Croatia
2
School of Physics, University of Sydney, Sydney, NSW 2006, Australia
*
Author to whom correspondence should be addressed.
Condens. Matter 2021, 6(4), 43; https://doi.org/10.3390/condmat6040043
Submission received: 9 October 2021 / Revised: 31 October 2021 / Accepted: 11 November 2021 / Published: 16 November 2021
(This article belongs to the Special Issue High Precision X-ray Measurements 2021)

Abstract

:
When a positron annihilates, two gamma photons are created with orthogonal polarizations. It is possible to use coincidence measurements where both photons undergo Compton scattering to estimate their initial relative polarization orientation. This information is of great interest in gamma imaging systems, such as Positron Emission Tomography, where it may be used as an additional tool to distinguish true coincidence events from scatter and random background. The successful utilization of this principle critically depends on the detector’s angular and energy resolution, which determine its polarimetric performance. In this study, we use Monte Carlo simulations based on the Geant4 toolkit to model two multi-pixel detector configurations identified as prospective for the measurement of gamma-ray polarization in PET. One is based on 2 mm × 2 mm × 20 mm LYSO scintillators and the other is based on 3 mm × 3 mm × 20 mm GAGG scintillators. Each configuration has a pair of modules, each consisting of 64 crystals set up in a single 8 × 8 matrix, where both the recoil electron and the Compton-scattered photon are absorbed. We simulate positron annihilation by generating two back-to-back gamma photons of 511 keV with orthogonal polarizations. The Compton scattering is successfully identified and the modulation of the azimuthal angle difference is clearly observed. The configuration based on GAGG crystals demonstrates slightly better polarimetric performance than the one based on LYSO crystals, reflected in the more pronounced azimuthal modulation.

1. Introduction

In the event of positron annihilation, a pair of entangled 511 keV gamma photons that are dominantly created in the process have close to opposite momenta and mutually orthogonal polarizations (Figure 1). The former characteristic of the process has been used in medical imaging with Positron Emission Tomography (PET), by exploiting the fact that two gammas will travel in a straight line path. The latter characteristic, polarization correlation of the created photons, has not yet been utilized in medical imaging.
In-silico studies have shown that the polarization correlations can be used as an additional tool to discriminate spurious random coincidences and body scatter events in PET, since these background events must be lacking in any such correlation [1,2,3]. Additionally, the polarization correlations can be used to create the image profile of the background events, which can then be statistically subtracted from the final image, contributing to better contrast in PET [4].
Experimentally, the polarization correlation of annihilation gamma quanta can be measured via Compton scattering, in which each photon undergoes scattering by angles θ 1 , 2 and azimuthal angles ϕ 1 , 2 . The differential cross-section for this scattering is given by the double Klein–Nishina cross-section [5]:
d 2 σ d Ω 1 d Ω 2 = r 0 4 16 F θ 1 F θ 2 1 G θ 1 G θ 2 F θ 1 F θ 2 cos 2 ϕ 1 ϕ 2
with F θ i = 2 + 1 cos θ i 3 2 cos θ i 3 and G θ i = sin 2 θ i 2 cos θ i 2 . For the fixed values of θ 1 , 2 , the cross-section has maxima for | ϕ 1 ϕ 2 | = 90°. This reflects the fact that the polarization correlation is conserved in Compton scattering, since photons are initially orthogonally polarized. The sensitivity of these measurements to the initial relative polarization of the gamma photons can be quantified by the polarimetric modulation factor μ :
μ P ϕ 1 ϕ 2 = 90 P ϕ 1 ϕ 2 = 0 P ϕ 1 ϕ 2 = 90 + P ϕ 1 ϕ 2 = 0
where P ϕ 1 ϕ 2 = 90 and P ϕ 1 ϕ 2 = 0 are the probabilities of observing the two gammas scattering with orthogonal or parallel azimuthal angles, respectively. The modulation is the strongest for θ 1 = θ 2 82° and its maximum value is μ m a x = 0.48 [5]; therefore, the events with these scattering angles are the most interesting for discriminating the signal and the background. On the other hand, the cross-section for Compton scattering of 511 keV gamma photons is more prominent for forward angles. Therefore, the region around θ 1 , 2 70 ° may also be useful since it offers higher scattering probability and a relatively strong modulation factor μ = 0.40 [3]. The values of the modulation factor are, however, lower for realistic detector geometries, since they are averaged over the finite detector acceptances.
A practical question is how to implement polarization measurement in PET. Measurement of Compton scattering using multi-layer position sensitive detectors is feasible in a laboratory, but scaling them to a clinical-size tomograph may be complex and expensive. The approach presented in this work is to measure the Compton scattering in single-layer position-sensitive detectors. A recent experimental study demonstrated that a feasible measurement of the polarization correlations of annihilation quanta can be achieved by a pair of position-sensitive detectors based on scintillator pixels read out on only one side by silicon photomultipliers [6]. In this proof-of-principle study, two detector modules with Lutetium Fine Silicate (LFS) crystals (3.14 mm × 3.14 mm × 20 mm in size) were assembled in 4 × 4 matrices with one-sided readout and a moderate polarimetric sensitivity was achieved. Since the sensitivity critically depends on the angular and, indirectly, on the energy resolution of the detector system, in this work, we conducted a simulation study of 8 × 8 detector matrices with two types and sizes of scintillating crystals in an attempt to optimize the polarimetric performance of detector modules applicable in PET.
The first configuration is based on Gadolinium Aluminum Gallium Garnet (GAGG) crystals, 3 mm × 3 mm × 20 mm in size, since this material offers a superb energy resolution [7]. The second configuration is based on Lutetium Yttrium Oxyorthosilicate (LYSO) crystals, 2 mm × 2 mm × 20 mm in size, where the smaller crystal pixels guarantee a better angular resolution.

2. Materials and Methods

2.1. Monte Carlo Simulations

Geant4-based Monte Carlo simulations were conducted to investigate the polarimetric sensitivities of different detector configurations to the initial polarization correlation of annihilation quanta. Geant4, version 10.06.p03 [8] was used and the physics models included were G4EmLivermorePolarizedPhysics with electromagnetic processes PIXE, Auger and AugerCascade enabled.
The simulated detector configurations consisted of two detector modules, with 64 scintillating crystals in each module, arranged in square-based 8 × 8 matrices (Figure 2). Two detector materials were compared in the study: LYSO and GAGG. We modeled different detector geometries: 2 × 2 × 20 mm3 for LYSO pixels and 3 × 3 × 20 mm3 for GAGG pixels, with 2.2 mm and 3.2 mm matrix pitch, respectively. LYSO is the most commonly used scintillating crystal in standard PET devices, with a high light yield and a fast decay time. GAGG is a relatively new material with promising characteristics for use in Compton detection systems, with a high light output, a slightly lower atomic number than LYSO and no intrinsic radioactivity. The properties of the materials are summarized in Table 1. Only active crystal volumes are simulated in this study, while the full experimental material budget (optical reflector, silicon photomultiplier, detector housing) is to be included in future research.
An isotropic point source of 511 keV gamma photons was simulated, placed at the central axis, 1.5 cm from each module, as shown in Figure 2. In each event, two gammas were emitted back-to-back. The first was set to have a random polarization vector and momentum direction, such that, in the particle reference frame, its polarization was in the x ^ direction. When its tracking finished, the second gamma was emitted, with its direction opposite to the first one and its polarization vector rotated by 90° with respect to the polarization vector of the first gamma. The effect of Doppler broadening was not included in the simulation, since we did not expect it to influence the polarimetric modulation.
The simulated energy deposition in each pixel, E, was smeared on an event-by-event basis by a Gaussian with a standard deviation:
σ ( E ) = E 511 × σ 511
where the energies are expressed in keV and σ 511 are deduced from experimentally determined energy resolutions at 511 keV. For LYSO, the energy resolution of 14% (FWHM) was modeled, while 10% (FWHM) was used for GAGG crystals, as reported in [7]. Smeared spectra from both detectors can be seen in Figure 3. The intrisic LYSO background radiation was not directly simulated since it is largely suppressed in coincidence measurements. However, its effect was implicit by smearing the energy with the experimentally measured resolution.

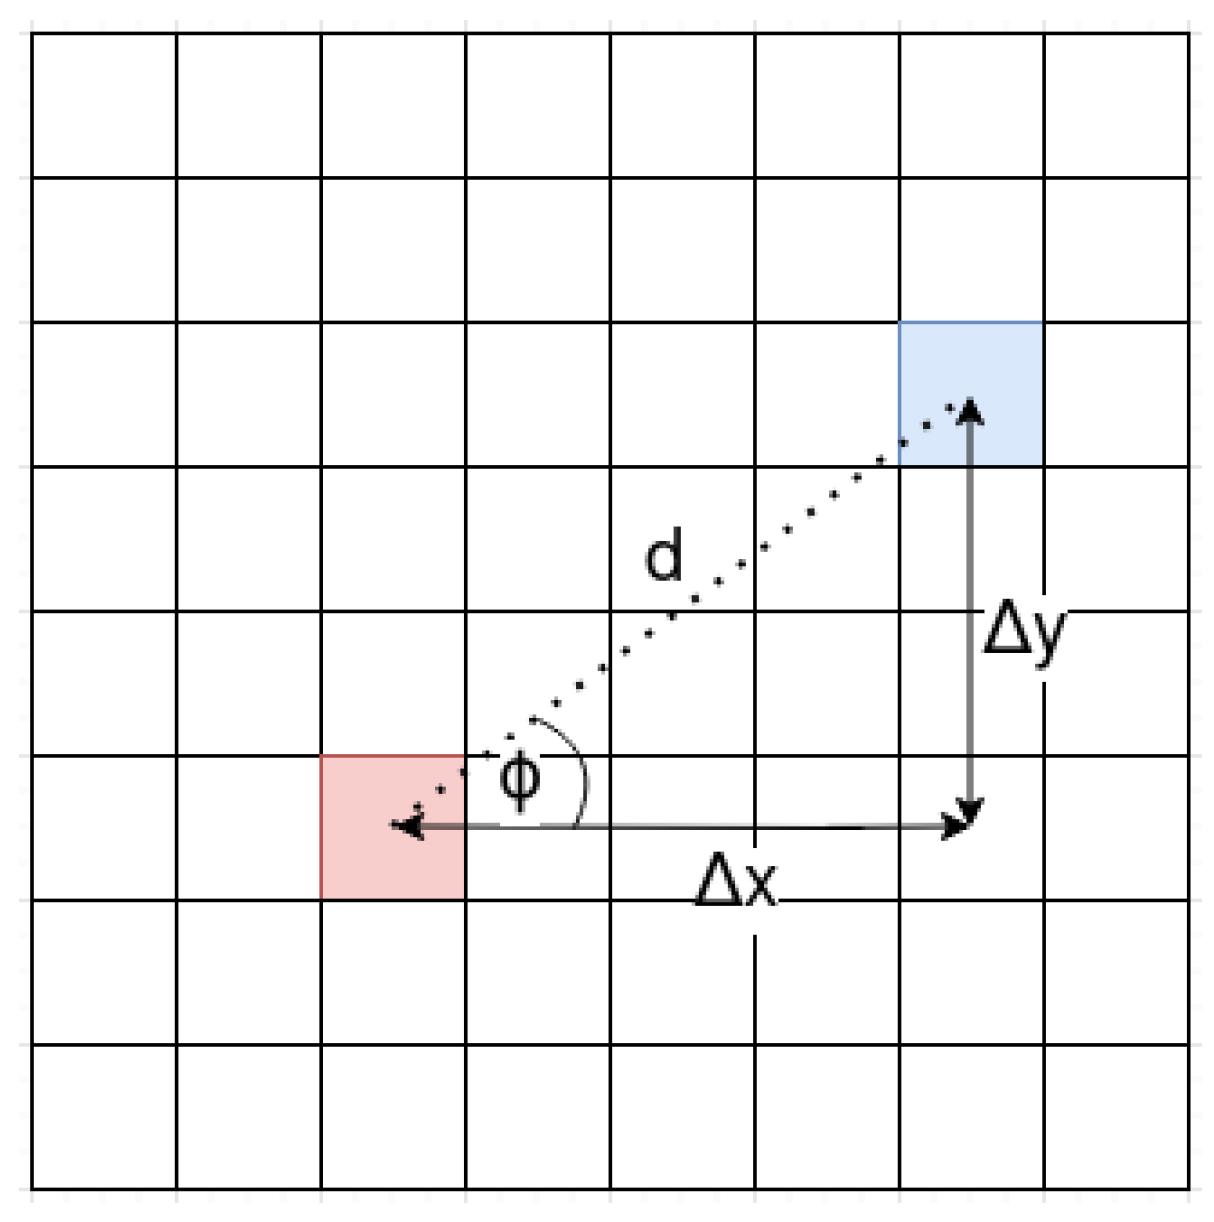
2.2. Reconstruction of Compton Events

The simulated data was analyzed following the same steps adopted in the analysis of experimentally measured data [6]. In each module, we selected pixels with more than 120 keV of deposited energy to avoid possible noise contribution. Compton events were identified as the ones where exactly two pixels fired in a module and the sum of their energies corresponded to the energy of the incident gamma.
Since the single-side readout detector matrices simulated in this study could not provide the depth-of-interaction information, Compton scattering of 511 keV gammas resulted in an ambiguous detector response for θ > 60 °. In events where two pixels fire with comparable energies, one cannot determine which one acted as the scatterer and which as the absorber. To reconstruct Compton scattering angle θ r e c , the pixel with the lower deposited energy is considered the scatterer, i.e., the one where the recoil electron is absorbed, since 511 keV gammas predominately scatter forward. To check this assumption, we compared the reconstructed scattering angle θ r e c with the true scattering angle θ s i m known from the simulation. This is shown in Figure 4 for GAGG detector. It can be seen how θ r e c is assigned to θ s i m and the ambiguity for scattering angles θ > 60 ° is visible. We quantify this effect in Table 2 and Table 3, for GAGG and LYSO configurations, respectively. The study showed that up to approximately 60% of events were correctly reconstructed for the theta ranges of interest. The tables also show the percentage of correctly reconstructed angles in two ranges of interest, 72 θ r e c 90 and 60 θ r e c 80 , and it is higher in the latter case. It is also clear that this percentage depends on the event topology, growing with increasing inter-pixel distance, d. This is expected since the backward Compton scattering results in the lower energy of the scattered gamma, which, on the other hand, has a shorter absorption length.
Finally, the Compton scattering angle, θ r e c , is calculated according to Compton scattering kinematics:
θ r e c = acos m e c 2 1 E γ 1 E γ 1
where E γ and E γ are the energies of the incoming and the scattered gammas, respectively. The recoil energy of the electron deposited inside the pixel is then E e = E γ E γ .
To reconstruct the azimuthal scattering angle ϕ in each module, the distances Δ x and Δ y between the first and second fired pixels in x and y directions, respectively, were calculated (Figure 5). Angle ϕ could then be obtained by using the formula:
ϕ = atan Δ y Δ x .

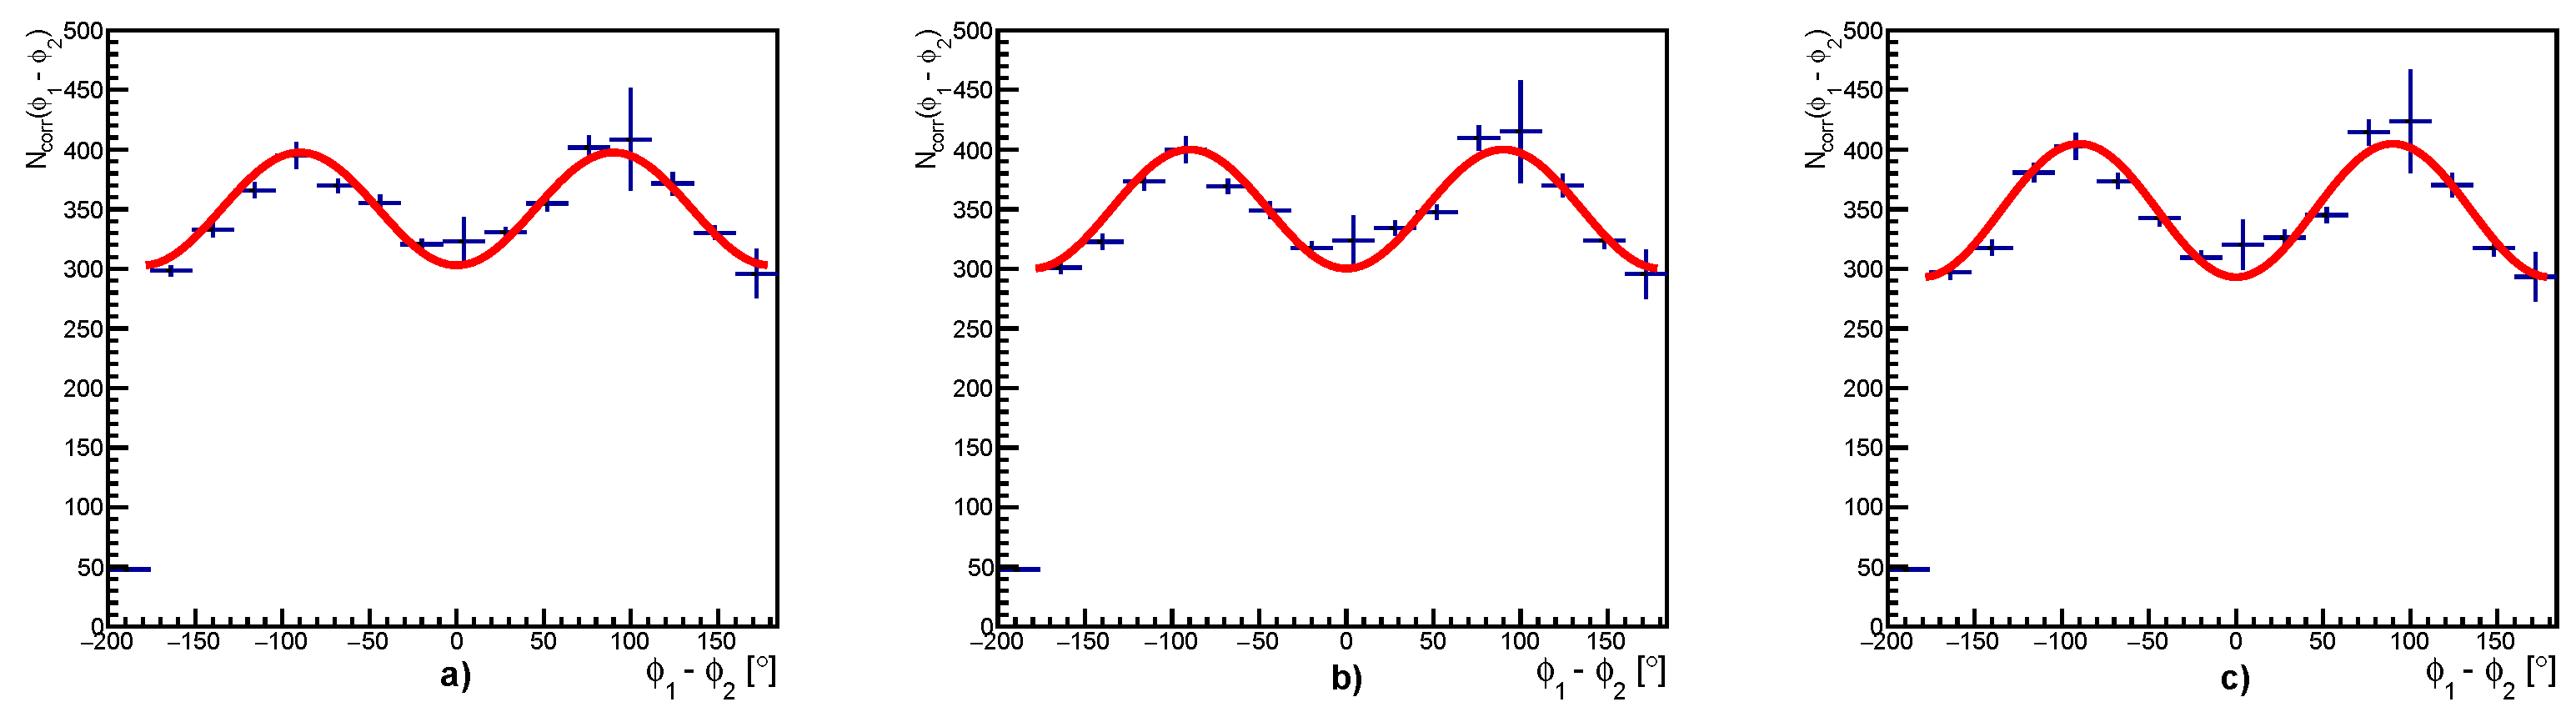
2.3. Extraction of the Modulation Factors

For the events where Compton scattering for both annihilation quanta was reconstructed, we extracted the distribution of the azimuthal angle difference N ( ϕ 1 ϕ 2 ) , for a selected range of reconstructed angles θ 1 , 2 , where 1 and 2 refer to modules 1 and 2, respectively. An example of such a distribution is shown in Figure 6a. However, the measured raw distributions were affected by the non-uniformity of the detector acceptance. The acceptance-corrected distribution N c o r r ( ϕ 1 ϕ 2 ) can be obtained according to:
N corr ϕ 1 ϕ 2 = N ϕ 1 ϕ 2 A n ϕ 1 ϕ 2 ,
where A n ϕ 1 ϕ 2 is the detector pair acceptance, obtained by simulating the detection of two back-to-back gamma photons without correlated polarization orientations. Figure 6b shows how the acceptance correction transforms the obtained angle ϕ 1 ϕ 2 distributions.
The polarimetric modulation factor μ corresponds to G θ 1 G θ 2 F θ 1 F θ 2 from Equation (1), and we expect:
N corr ϕ 1 ϕ 2 = M 1 μ cos 2 ϕ 1 ϕ 2 ,
where M is the average amplitude of the distribution, and μ is the polarimetric modulation factor from Equation (2). Hence, the polarimetric modulation factor μ can be determined by measuring the distribution of the azimuthal angle difference N ( ϕ 1 ϕ 2 ) of the Compton scattered gammas for chosen angles θ 1 and θ 2 and fitting it with Equation (7).

3. Results

3.1. GAGG Configuration

The simulated GAGG configuration consisted of two modules set 3 cm apart, with a 511 keV gamma source in between. The modules consisted of 64 crystal pixels, 3 mm × 3mm × 20 mm, assembled in 8 × 8 matrices. The simulated energy resolution of the detectors was 10% at 511 keV. In total, 10 9 events with a pair of correlated 511 keV photons were simulated.
Following the analysis procedure described above, we obtained the acceptance-corrected distributions N c o r r ( ϕ 1 ϕ 2 ) for two selected ranges of the scattering angle, 72 θ 1 , 2 90 and 60 θ 1 , 2 80 , which are shown in Figure 7 and Figure 8, respectively. The ϕ 1 ϕ 2 correlation was also explored depending on the inter-pixel distance, which determines the event topology. The distance of the two pixels fired in Compton scattering determines the mean angular resolution < Δ ϕ >, which has a large impact on the polarimetric modulation. Both Figure 7 and Figure 8 clearly show that the modulation is stronger when the pixels with small inter-pixel distances are excluded from the analysis. The resulting modulation factors for the GAGG configuration are summarized in Table 4.

3.2. LYSO Configuration

The simulated LYSO configuration consisted of two modules set 3 cm apart, with a 511 keV gamma source in between. The modules consisted of 64 crystal pixels, 2 mm × 2 mm × 20 mm, assembled in 8 × 8 matrices. The simulated energy resolution of the detectors was 14% at 511 keV. In total, 10 9 events with a pair of correlated 511 keV photons were simulated.
Following the analogous analysis, as for the GAGG configuration, the reconstructed distributions N c o r r ( ϕ 1 ϕ 2 ) were as shown in Figure 9 and Figure 10. From Figure 9 and Figure 10, it can be seen that the same conclusions can be drawn for LYSO configuration as for GAGG—the modulation factors increase with increasing inter-pixel distances, d, and they generally become larger for the scattering angles around θ 1 , 2 = 82 . The modulation factors are shown in Table 5.

3.3. Influence of the Escape X-ray on Detector Performance

Since the simulated crystal volumes are relatively small, the X-ray following the photoelectric absorption close to the crystal surface may escape into neighboring or farther crystals, contributing to pixel cross-talk. To quantify this effect in both simulated configurations, we focused on the central pixel in the module and plotted its simulated (non-smeared) energy deposition (Figure 11). The peak around 450 keV in LYSO or 460 keV in GAGG corresponded to events where X-ray escape happened following the photo-electric absorption. The simulation was then utilized to count pixels with various distances, where the X-ray was subsequently absorbed. The results are summarized in Table 6. For LYSO, 4.6% of all photoelectric interactions in the crystal resulted in X-ray escape, and 2.3% for GAGG crystals. As can be seen from Table 6, most of these X-ray photons were absorbed in the adjacent pixels.

4. Discussion and Conclusions

The simulation results show that the initial polarization correlations of annihilation quanta, translated to azimuthal correlations of the Compton scattereed gamma rays, can be observed with pixelated scintillation detectors. We generally observe that the modulation is stronger for θ 1 , 2 82 than for θ 1 , 2 70 in both simulated configurations, as expected from the Klein–Nishina cross-section.
The GAGG configuration with 3 mm × 3 mm × 20 mm crystals demonstrates slightly better performance than the LYSO configuration based on 2 mm × 2 mm × 20 mm crystals. In both cases, we observe the modulation’s dependence on the fired pixel-pair topology, i.e., the inter-pixel distance of the fired pixel pair. The trend is according to expectations—the azimuthal modulation amplitude grows with the increasing pixel distances, since they result in better azimuthal angular resolution. GAGG crystals also exhibit lower cross-talk than LYSO due to the escape X-rays. This is a consequence of their size (3 mm × 3mm × 20 mm) compared to LYSO (2 mm × 2 mm × 20 mm). Since GAGG crystals are larger in volume, fewer X-rays can escape the crystal. However, the results indicate that the effect of the cross-talk is negligible if the event analysis omits those Compton events in which adjacent pixels fire.
The modulation factors obtained in this study show trends that are in line with experimentally measured data using LFS crystals [6]; however, the values extracted in simulation are ~20% lower, although one would expect a slight increase owing to the improved energy and angular resolutions. This can be explained by a recent study that has shown that a proper implementation of quantum entanglement in Geant4 increases the actual modulation factors by approximately 40% [4], compared to the standard Livermore model utilized in this study. Thus, we expect the realistic μ to increase by ~40% on top of the values quoted in Table 4 and Table 5. However, this should not change the finding that the observable azimuthal modulation is slightly larger in the GAGG configuration using 3 × 3 × 20 mm3 crystals compared to LYSO with 2 × 2 × 20 mm3 crystals.
The study presented in this paper is a continuation of research on the implementation of polarization correlation detection in PET using the single-layer detector concept [6,11]. In this concept, the Compton scattering of each annihilation photon is detected in a single detector matrix. Although double Compton events are a relatively small fraction of all detected events in PET (3–5%, depending on detector configuration), the detection of correlated vs. non-correlated Compton events may be valuable in distinguishing the image profile of signal vs. background events, respectively [4], as well as for the rejection of scatter and random coincidences [2]. Owing to its simplicity, the single-layer scintillator concept offers a realistic implementation of the measurement of the polarization correlation in clinical-scale PET systems. The detection of polarization correlation could be used in (ToF)PET scanners in addition to the standard photo-electric detection and thus extend their capability at the cost of additional data processing, but without increasing the complexity of the hardware compared to the state-of-the-art devices.

Author Contributions

Conceptualization, M.M. and D.B.; methodology, A.M.K., M.M. and D.B.; software, A.M.K. and P.Ž.; formal analysis, A.M.K. and S.P.; investigation, A.M.K. and M.M.; resources, M.M. and D.B.; data curation, A.M.K. and S.P.; writing—original draft preparation, A.M.K. and M.M.; writing—review and editing, M.M. and Z.K.; visualization, A.M.K.; supervision, M.M. and Z.K.; project administration, M.M.; funding acquisition, M.M. and D.B. All authors have read and agreed to the published version of the manuscript.

Funding

This work was supported by the “Research Cooperability” Program of the Croatian Science Foundation, funded by the European Union from the European Social Fund under the Operational Programme Efficient Human Resources 2014–2020, grant number PZS-2019-02-5829.

Institutional Review Board Statement

Not applicable.

Informed Consent Statement

Not applicable.

Data Availability Statement

The data presented in this study will be available upon request.

Conflicts of Interest

The authors declare no conflict of interest.

References

  1. Kuncic, Z.; McNamara, A.; Wu, K.; Boardman, D. Polarization enhanced X-ray imaging for biomedicine. Nucl. Instrum. Methods Phys. Res. Sect. Accel. Spectrometers Detect. Assoc. Equip. 2011, 648, 208–210. [Google Scholar] [CrossRef]
  2. McNamara, A.; Toghyani, M.; Gillam, J.; Wu, K.; Kuncic, Z. Towards optimal imaging with PET: An in silico feasibility study. Phys. Med. Biol. 2014, 59, 7587–7600. [Google Scholar] [CrossRef] [PubMed]
  3. Toghyani, M.; Gillam, J.; McNamara, A.; Kuncic, Z. Polarisation-based coincidence event discrimination: An in silico study towards a feasible scheme for Compton-PET. Phys. Med. Biol. 2016, 61, 5803–5817. [Google Scholar] [CrossRef] [PubMed]
  4. Watts, D.P.; Bordes, J.; Brown, J.R.; Cherlin, A.; Newton, R.; Allison, J.; Bashkanov, M.; Efthimiou, N.; Zachariou, N.A. Photon quantum entanglement in the MeV regime and its application in PET imaging. Nat. Commun. 2021, 12, 2646. [Google Scholar] [CrossRef] [PubMed]
  5. Pryce, M.H.L.; Ward, J.C. Angular correlation effects with annihilation radiation. Nature 1947, 160, 435. [Google Scholar] [CrossRef]
  6. Makek, M.; Bosnar, D.; Pavelić, L.; Šenjug, P.; Žugec, P. Single-layer Compton detectors for measurement of polarization correlations of annihilation quanta. Nucl. Inst. Meth. Phys. Res. A 2019, 958, 162835. [Google Scholar] [CrossRef]
  7. Makek, M.; Bosnar, D.; Kožuljević, A.M.; Pavelić, L. Investigation of GaGG:Ce with TOFPET2 ASIC Readout for Applications in Gamma Imaging Systems. Crystals 2020, 10, 1073. [Google Scholar] [CrossRef]
  8. Agostinelli, S.; Allison, J.; Amako, K.A.; Apostolakis, J.; Araujo, H.; Arce, P.; Asai, M.; Axen, D.; Banerjee, S.; Behner, F.; et al. Geant4—A simulation toolkit. Nucl. Instrum. Methods Phys. Res. Sect. A Accel. Spectrometers Detect. Assoc. Equip. 2003, 506, 250–303. [Google Scholar] [CrossRef] [Green Version]
  9. Epic-Crystal. Available online: https://www.epic-crystal.com/oxide-scintillators/lyso-ce-scintillator.html (accessed on 28 September 2021).
  10. Lythe, L.; Hilger Crystals Ltd., Margate, UK. Personal communication, 2019.
  11. Makek, M.; Bosnar, D.; Pavelić, L. Scintillator Pixel Detectors for Measurement of Compton Scattering. Condens. Matter 2019, 4, 24. [Google Scholar] [CrossRef] [Green Version]
Figure 1. Schematic drawing of the geometry of annihilation quanta.
Condensedmatter 06 00043 g001
Figure 2. Visualization of the simulated GAGG detector configuration and the gamma source, with gammas shown in blue.
Condensedmatter 06 00043 g002
Figure 3. Smeared simulated single pixel spectra for (a) GAGG and (b) LYSO crystal.
Condensedmatter 06 00043 g003
Figure 4. Reconstructed vs. simulated θ in a GAGG module, (a) for all event topologies and (b) for event topologies with pixel distance 6.4 mm d 35.92 mm .
Condensedmatter 06 00043 g004
Figure 5. The cross-sectional schematic view the detector matrix. The Δ x and Δ y are defined as distances between pixel centers in the x and y direction, respectively, and d is the inter-pixel distance in the x–y plane.
Condensedmatter 06 00043 g005
Figure 6. (a) Simulated N ( ϕ 1 ϕ 2 ) distribution for correlated gamma photons in GAGG detector module for θ r e c = 82°, compared to the simulated distribution for non-correlated photons. (b) Acceptance-corrected distribution N c o r r ( ϕ 1 ϕ 2 ) , rebinned to avoid statistical fluctuations.
Condensedmatter 06 00043 g006
Figure 7. N c o r r ( ϕ 1 ϕ 2 ) distributions obtained for 72 θ 1 , 2 90 in GAGG, fit with Equation (7); (a) every event is taken into account, (b) events with d 1 , 2 > 3.2 mm, (c) events with d 1 , 2 > 4.6 mm.
Condensedmatter 06 00043 g007
Figure 8. N c o r r ( ϕ 1 ϕ 2 ) distributions obtained for 60 θ 1 , 2 80 in GAGG, fit with Equation (7); (a) every event is taken into account, (b) events with d 1 , 2 > 3.2 mm, (c) events with d 1 , 2 > 4.6 mm.
Condensedmatter 06 00043 g008
Figure 9. N c o r r ( ϕ 1 ϕ 2 ) distributions obtained for 72 θ 1 , 2 90 in LYSO, fit with Equation (7); (a) every event is taken into account, (b) events with d 1 , 2 > 2.2 mm, (c) events with d 1 , 2 > 3.2 mm.
Condensedmatter 06 00043 g009
Figure 10. N c o r r ( ϕ 1 ϕ 2 ) distributions obtained for 60 θ 1 , 2 80 in LYSO, fit with Equation (7); (a) every event is taken into account, (b) events with d 1 , 2 > 2.2 mm, (c) events with d 1 , 2 > 3.2 mm.
Condensedmatter 06 00043 g010
Figure 11. Simulated spectra of GAGG and LYSO crystals. The X-ray escape peaks are visible in red at around (a) 450 keV for LYSO and (b) 460 keV for GAGG crystals.
Condensedmatter 06 00043 g011
Table 1. The basic properties of LYSO and GaGG crystals [9,10].
LYSOGAGG
Light yield (ph/MeV)∼29,000∼55,000
Decay time (ns)4288
Zeffective6654.4
Density (g/cm3)7.26.63
Table 2. The percentage of the forward scattering angles θ correctly reconstructed in GAGG detector module, for selected θ ranges and different event topologies varying with inter-pixel distance d. Statistical uncertainty of the quoted values is up to 2%.
d (mm) 0 θ rec 90 60 θ rec 80 72 θ rec 90
3.20 d 35.92 58.4%52.0%53.6%
4.52 d 35.92 61.4%55.5%54.7%
6.40 d 35.92 62.3%56.6%55.0%
7.15 d 35.92 65.1%60.5%56.5%
9.05 d 35.92 65.1%60.5%56.6%
9.60 d 35.92 65.7%62.1%56.6%
Table 3. The percentage of the forward scattering angles θ correctly reconstructed in LYSO detector module, for selected θ ranges and different event topologies varying with inter-pixel distance d. Statistical uncertainty of the quoted values is up to 2%.
d (mm) 0 θ rec 90 60 θ rec 80 72 θ rec 90
2.20 d 24.6 54.5%47.4%50.2%
3.11 d 24.6 58.2%51.4%51.9%
4.40 d 24.6 58.9%52.1%52.1%
4.92 d 24.6 63.0%57.3%54.2%
6.30 d 24.6 65.2%60.4%55.6%
6.60 d 24.6 65.6%61.0%55.9%
Table 4. Polarimetric modulation factors μ of GAGG detector configuration, obtained for θ 1 , 2 intervals centered around 82° and 70° for different Compton event topologies.
72 θ 1 , 2 90 60 θ 1 , 2 80
d 1 , 2 (mm) Δ ϕ μ Δ ϕ μ
3.2 d 35.92 34.8°± 0.3°0.22 ± 0.0337.1°± 0.2°0.13 ± 0.03
6.4 d 35.92 19.1°± 0.3°0.26 ± 0.0319.6°± 0.2°0.17 ± 0.03
9.6 d 35.92 17.6°± 0.3°0.26 ± 0.0318.0°± 0.2°0.17 ± 0.03
Table 5. Polarimetric modulation factors μ of LYSO detector configuration, obtained for θ 1 , 2 intervals centered around 82° and 70° for different Compton event topologies.
72 θ 1 , 2 90 60 θ 1 , 2 80
d 1 , 2 (mm) Δ ϕ μ Δ ϕ μ
2.2 d 24.6 33.4°± 0.4°0.19 ± 0.0335.3°± 0.3°0.13 ± 0.03
4.4 d 24.6 23.1°± 0.4°0.22 ± 0.0324.2°± 0.3°0.15 ± 0.03
6.6 d 24.6 13.8°± 0.3°0.21 ± 0.0314.0°± 0.2°0.16 ± 0.03
Table 6. Percentages of escaped characteristic X-rays, for events with photoelectric interaction in a central crystal, contained in the neighboring crystals.
DetectorLYSOGAGG
Neighbors
1st adjacent3%2.2%
1st diagonal1%0.4%
2nd orthogonal0.1%0.01%
Publisher’s Note: MDPI stays neutral with regard to jurisdictional claims in published maps and institutional affiliations.

