Article

Spatially Resolved Spectral Imaging by A THz-FEL

1
The Institute of Scientific and Industrial Research (ISIR), Osaka University, 8–1 Mihogaoaka, Ibaraki, Osaka 5670047, Japan
2
Graduate School of Engineering Science, Osaka University, 1–3 Machikaneyama, Toyonaka, Osaka 5608531, Japan
3
Faculty of Science and Engineering, Setsunan University, 17–8 Ikedanaka-Machi, Neyagawa, Osaka 5728508, Japan
4
Department of Physics, Sapienza University, P.le Aldo Moro 5, 00185 Rome, Italy
5
Istituto Nazionale di Fisica Nucleare—Laboratori Nazionali di Frascati (INFN-LNF), Via Enrico Fermi 40, 00044 Frascati, Italy
6
International Centre for Material Science Superstripes, RICMASS, via dei Sabelli 119A, 00185 Rome, Italy
*
Author to whom correspondence should be addressed.
Current address: National Institutes of Natural Sciences, Institute for Molecular Science, UVSOR Facility, 38 Nishigo-Naka, Myodaiji, Okazaki, Aichi 4448585, Japan.
Current address: National Institutes for Quantum and Radiological Science and Technology, 2–4 Shirane, Tokai, Ibaraki 3191106, Japan.
§
Current address: High Energy Accelerator Research Organization, KEK, 1–1 Oho, Tsukuba, Ibaraki 3050801, Japan.
Condens. Matter 2020, 5(2), 38; https://doi.org/10.3390/condmat5020038
Submission received: 28 April 2020 / Revised: 17 May 2020 / Accepted: 2 June 2020 / Published: 4 June 2020

Abstract

:
Using the unique characteristics of the free-electron-laser (FEL), we successfully performed high-sensitivity spectral imaging of different materials in the terahertz (THz) and far-infrared (FIR) domain. THz imaging at various wavelengths was achieved using in situ spectroscopy by means of this wavelength tunable and monochromatic source. In particular, owing to its large intensity and directionality, we could collect high-sensitivity transmission imaging of extremely low-transparency materials and three-dimensional objects in the 3–6 THz range. By accurately identifying the intrinsic absorption wavelength of organic and inorganic materials, we succeeded in the mapping of spatial distribution of individual components. This simple imaging technique using a focusing optics and a raster scan modality has made it possible to set up and carry out fast spectral imaging experiments on different materials in this radiation facility.

1. Introduction

Terahertz (THz)-wave and/or far-infrared photons represent radiation located in the frequency region, which is well known as the “terahertz-gap”. This region is a frequency domain that is still particularly interesting in the field of radiation generation and detection technology. In terms of applicability, conventional light sources based on the blackbody emission and well-established spectrometers or interferometers are rather common tools. On the other hand, far-infrared radiation emitted by synchrotron radiation (SR) and free-electron-laser (FEL) sources is powerful for spectroscopy and microspectroscopy. Thanks to the high brilliance and focusing properties, these light sources important results have been obtained with experiments performed with these non-thermal radiation sources. Pump-probe experiments using intense and coherent photon sources to investigate non-linear materials properties can be realized only by using high-intensity FELs. In the recent years, we have performed various linear and non-linear experiments using the terahertz-free-electron-laser (THz-FEL) in the Institute of Scientific and Industrial Research (ISIR) of Osaka University [1,2,3,4].
Regarding the electromagnetic waves, THz and far-infrared (FIR) radiation falling in the “terahertz gap” share both the behavior of high-frequency radio waves and low-energy photons. For this reason, in different areas such as physics, chemistry, engineering, and bio-medicine, this radiation can be described by different units such as frequency, wavenumber, wavelength, and energy. Their mutual relationship is shown in Equation (1) with the reference to approximately 3 THz, where only the wavelength is inversely proportional to the others:
3 THz = 100 cm−1 = 100 μm = 12.4 meV
The terahertz band is conventionally understood as ranging from approximately 0.3 to 3 THz around 1 THz within the International Telecommunication Union (ITU) designated band of frequencies. In addition to the light sources having characteristics of intensity, stability, monochromaticity, or broadbandness, detectors with high sensitivity, high-speed response, and wide (linear) dynamic range are under development. Besides far-infrared photons emitted from a black body in accordance with Planck’s law, various other light sources exist, e.g., synchrotron radiation light sources, vacuum tubes including gyrotrons, gas, and solid-state lasers, superconducting devices, non-linear optical devices, and FELs, which are mainly described in this contribution.
The ISIR THz-FEL is a monochromatic, wavelength-tunable and highly coherent pulsed light source with megawatt-class peak intensity. For the first time in the 1970s and in the early phase, FELs produced radiation in the mid-infrared region [5]. The emission wavelength was continuously reduced down to the X-ray range with the goal of studying nano- and sub-nano-size objects and reach the pico- and sub-picosecond time resolution in different research areas [6,7]. On the other hand, although infrared FELs are relatively compact, the operation and the maintenance of these linear accelerators requite important human and/or economic supports from universities and institutions. Mainly for this reason, some FEL facilities in the infrared region were discontinued in the past. However, since the last decade, long wavelengths FELs are again attracting attention as high-intensity coherent radiation sources. Indeed, the increasing number of studies using infrared FEL radiation from the operational facilities is triggering the constructions of new infrared FELs and the plan of new IR and THz beamlines worldwide [8,9,10,11,12].

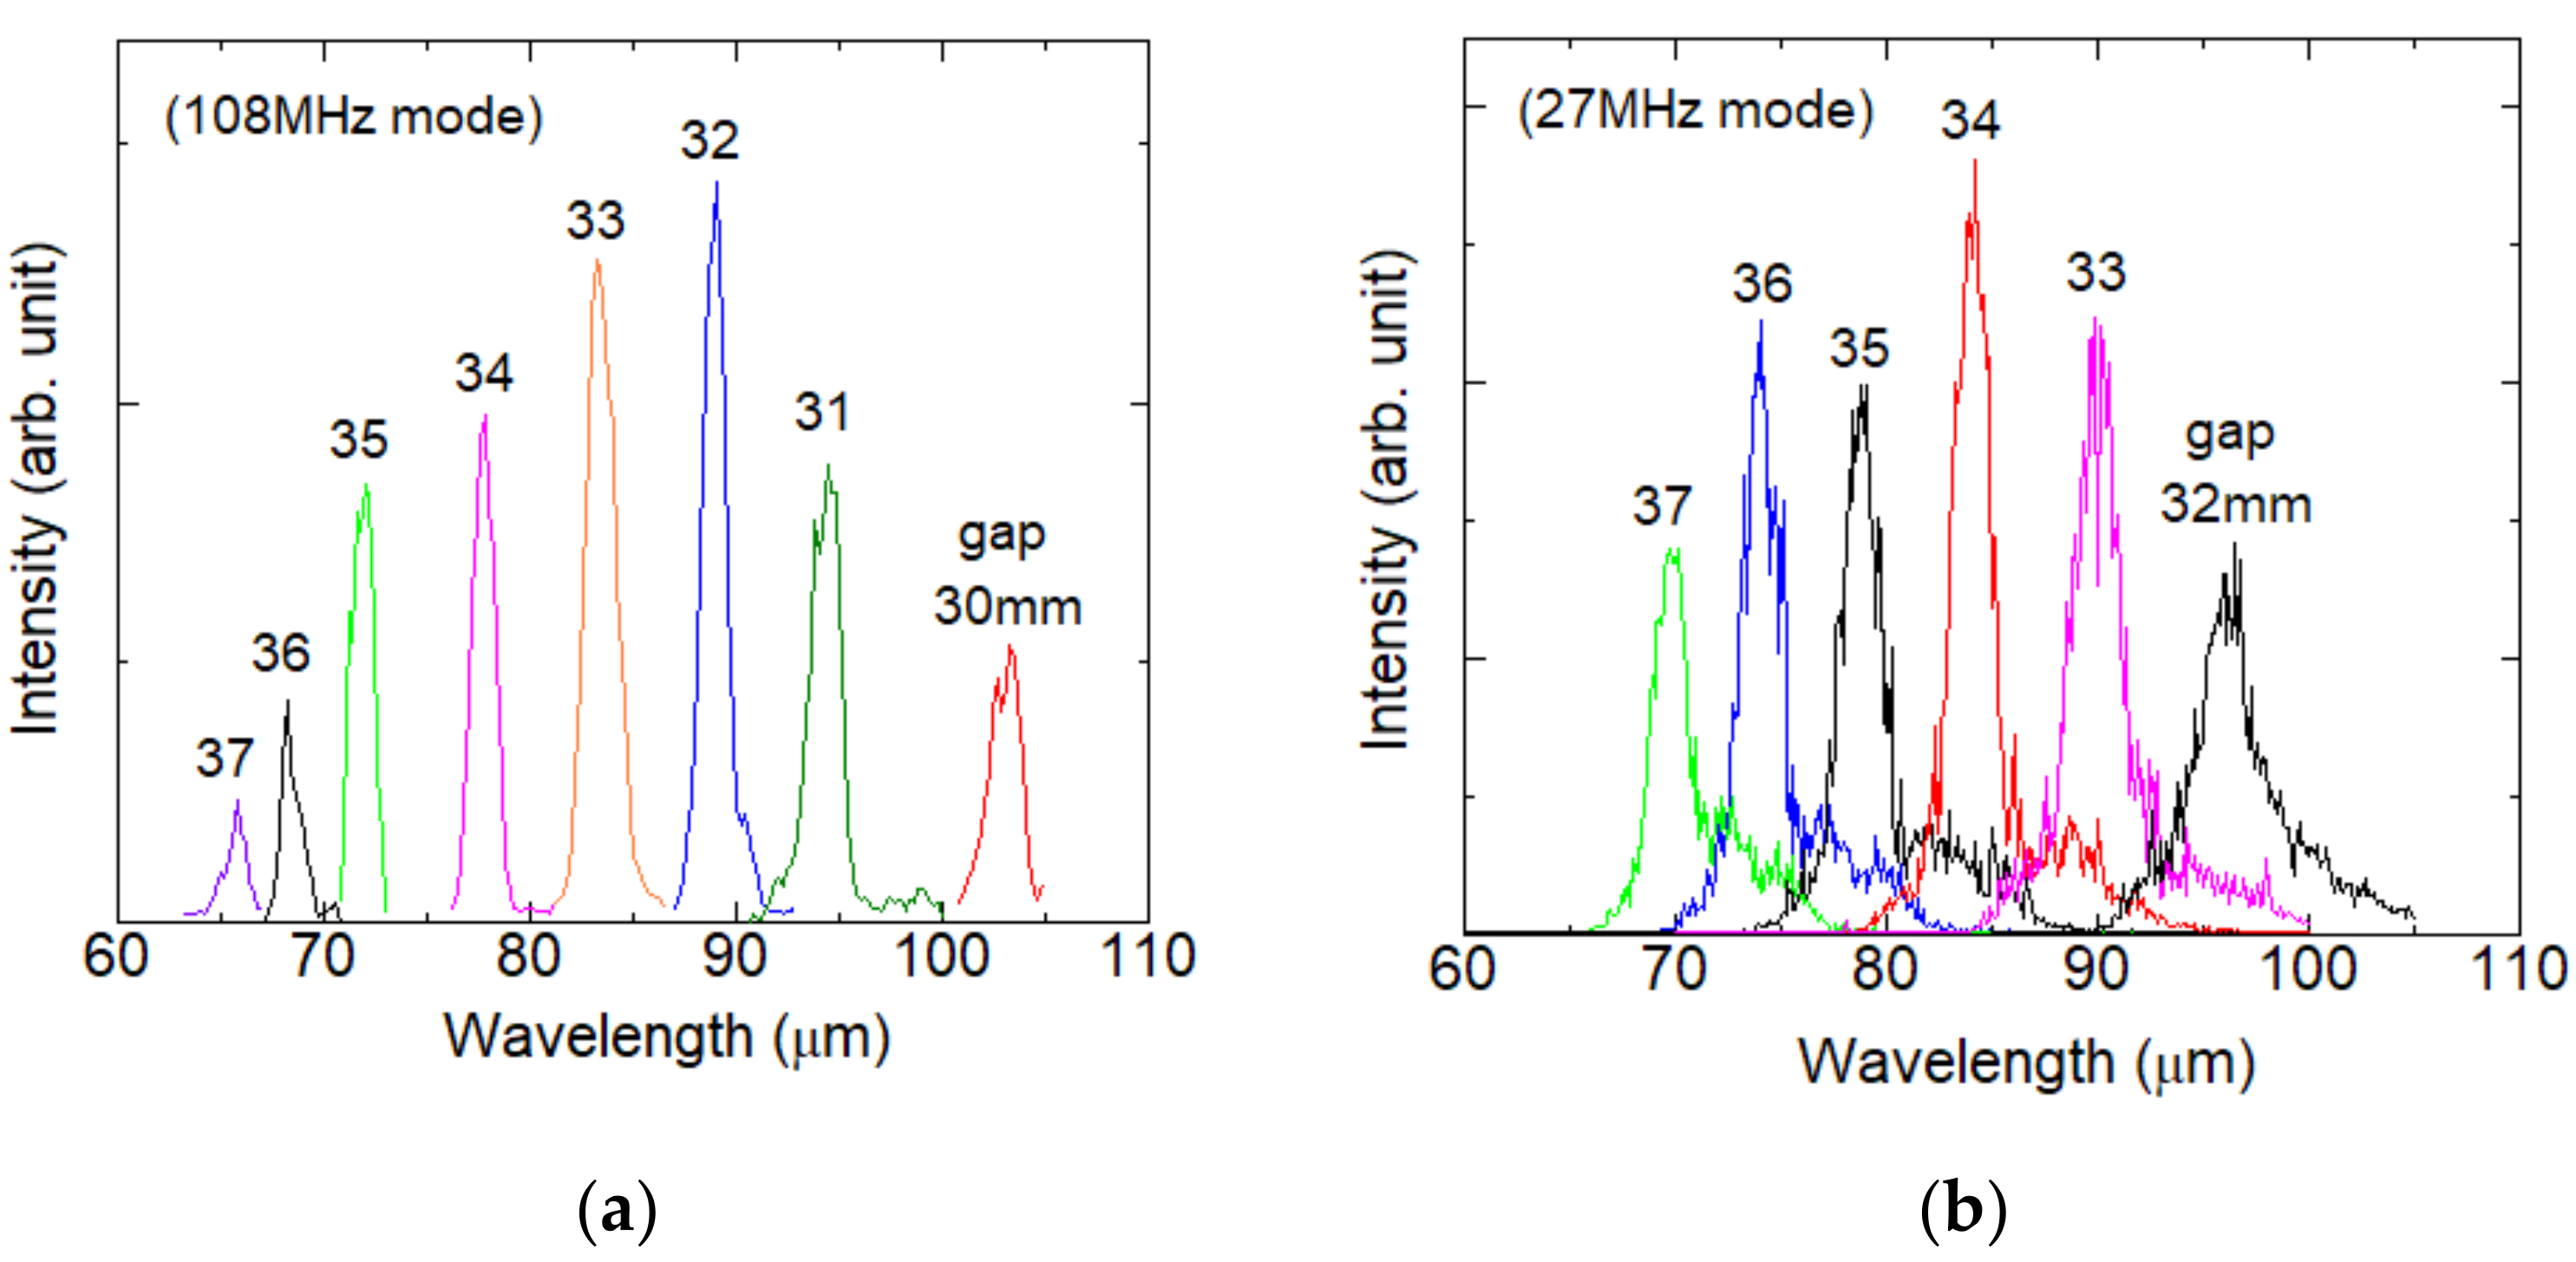
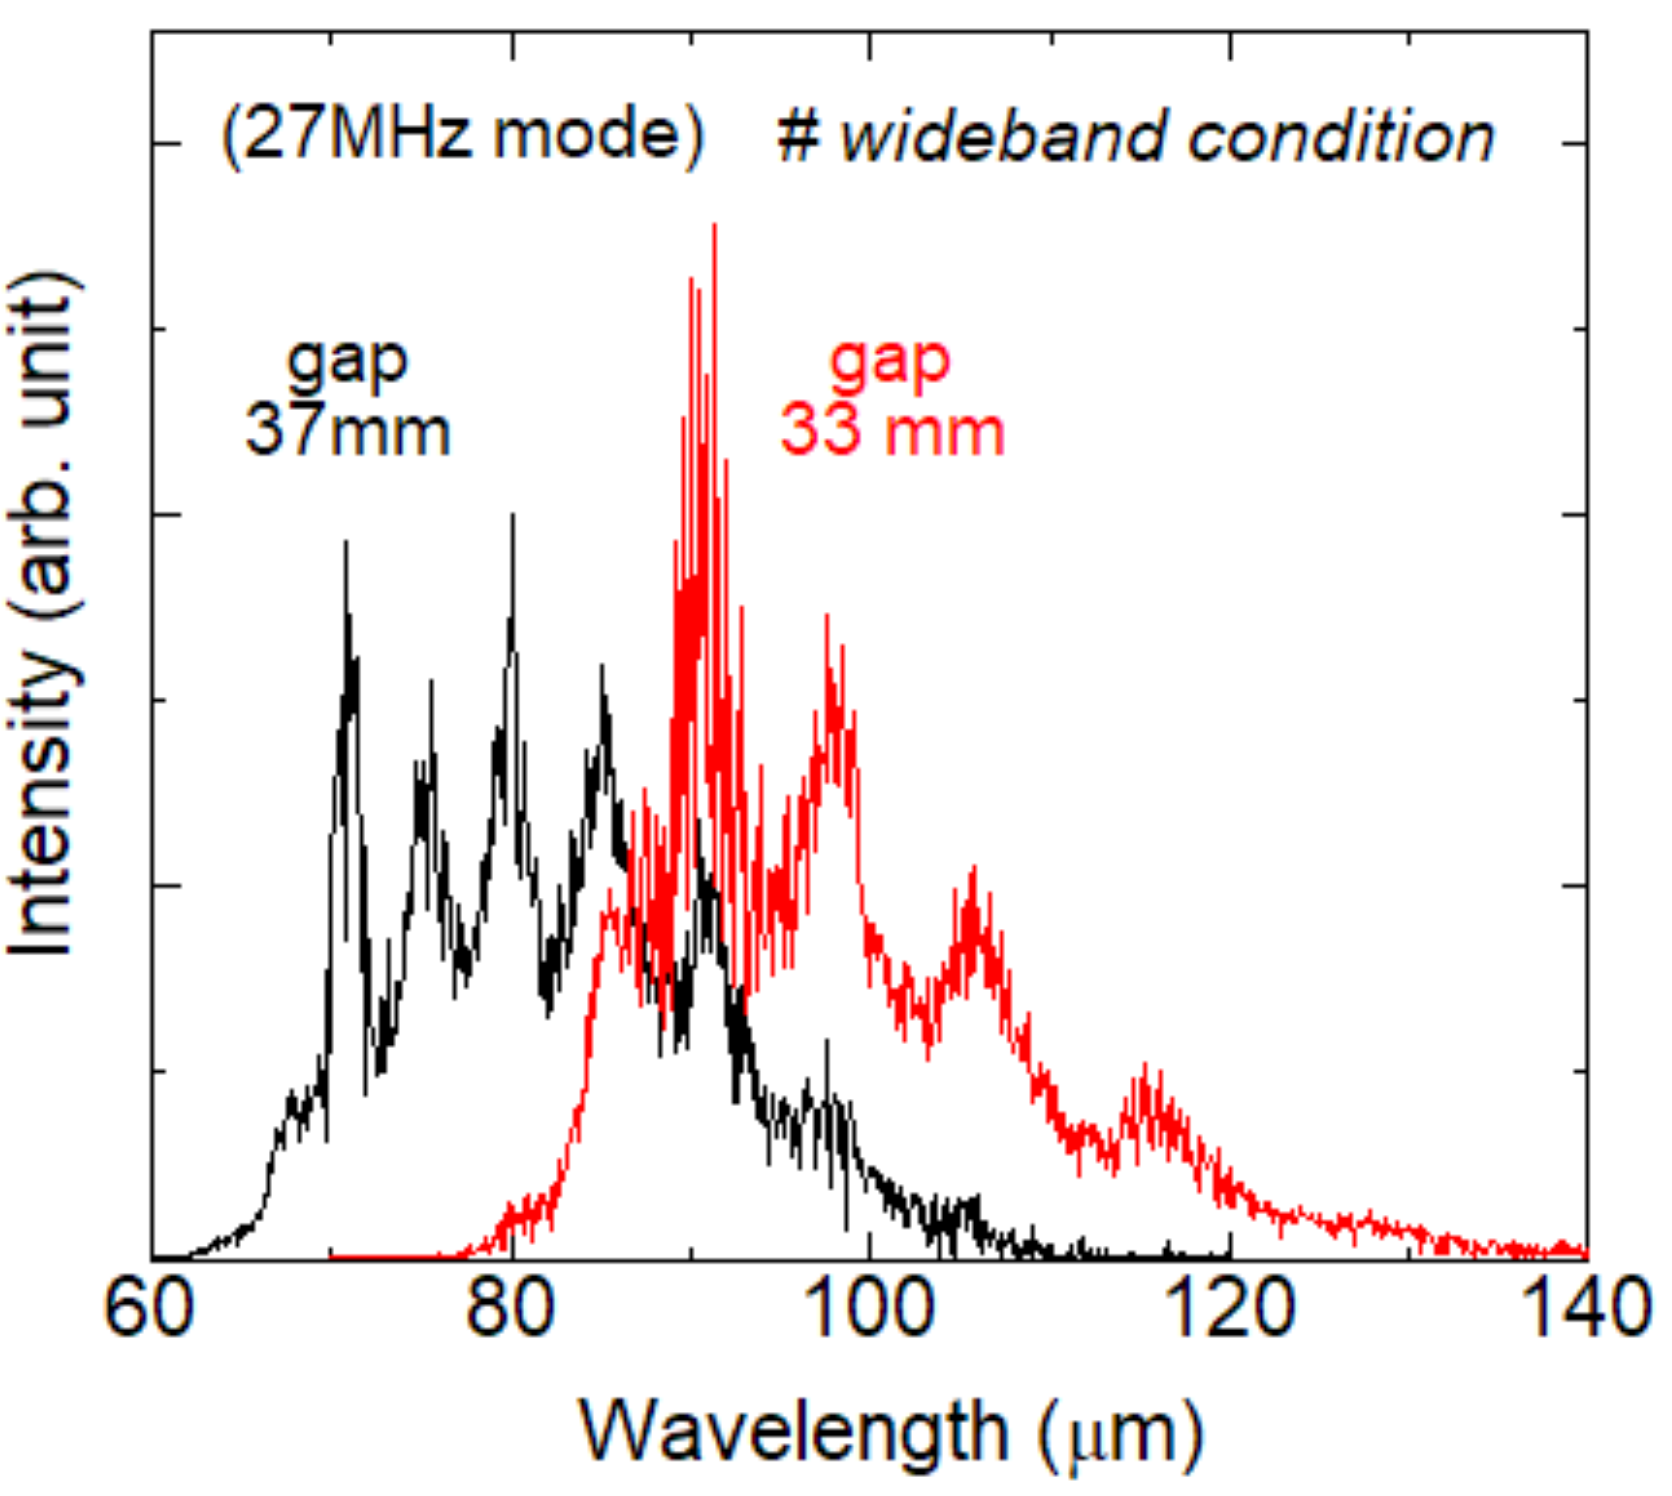
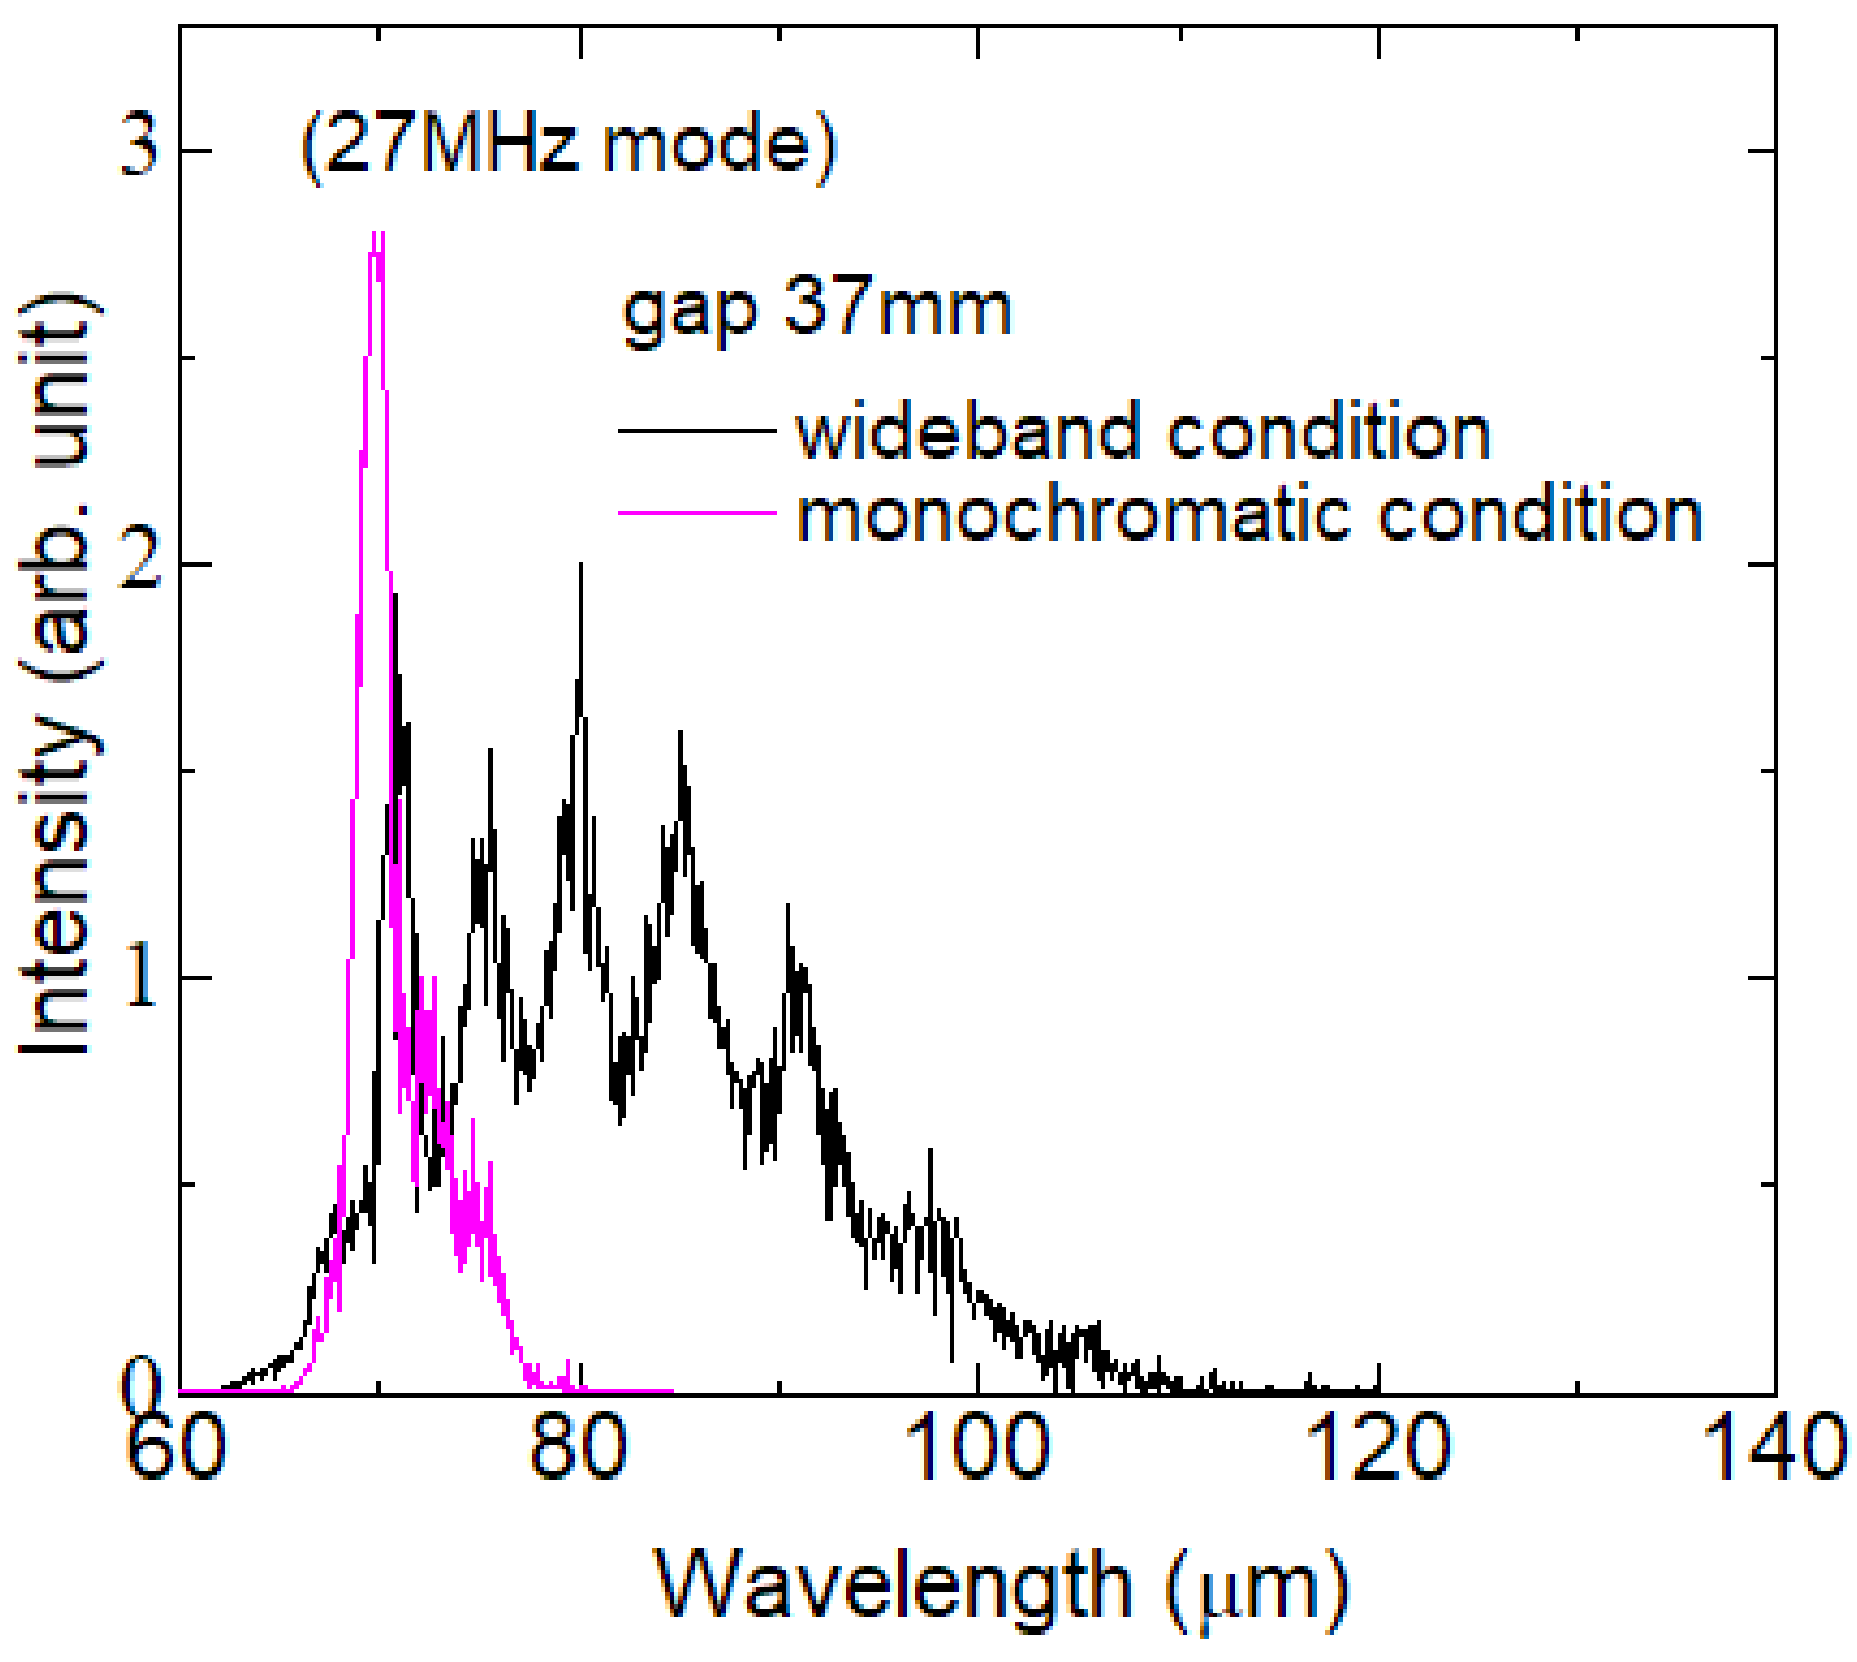
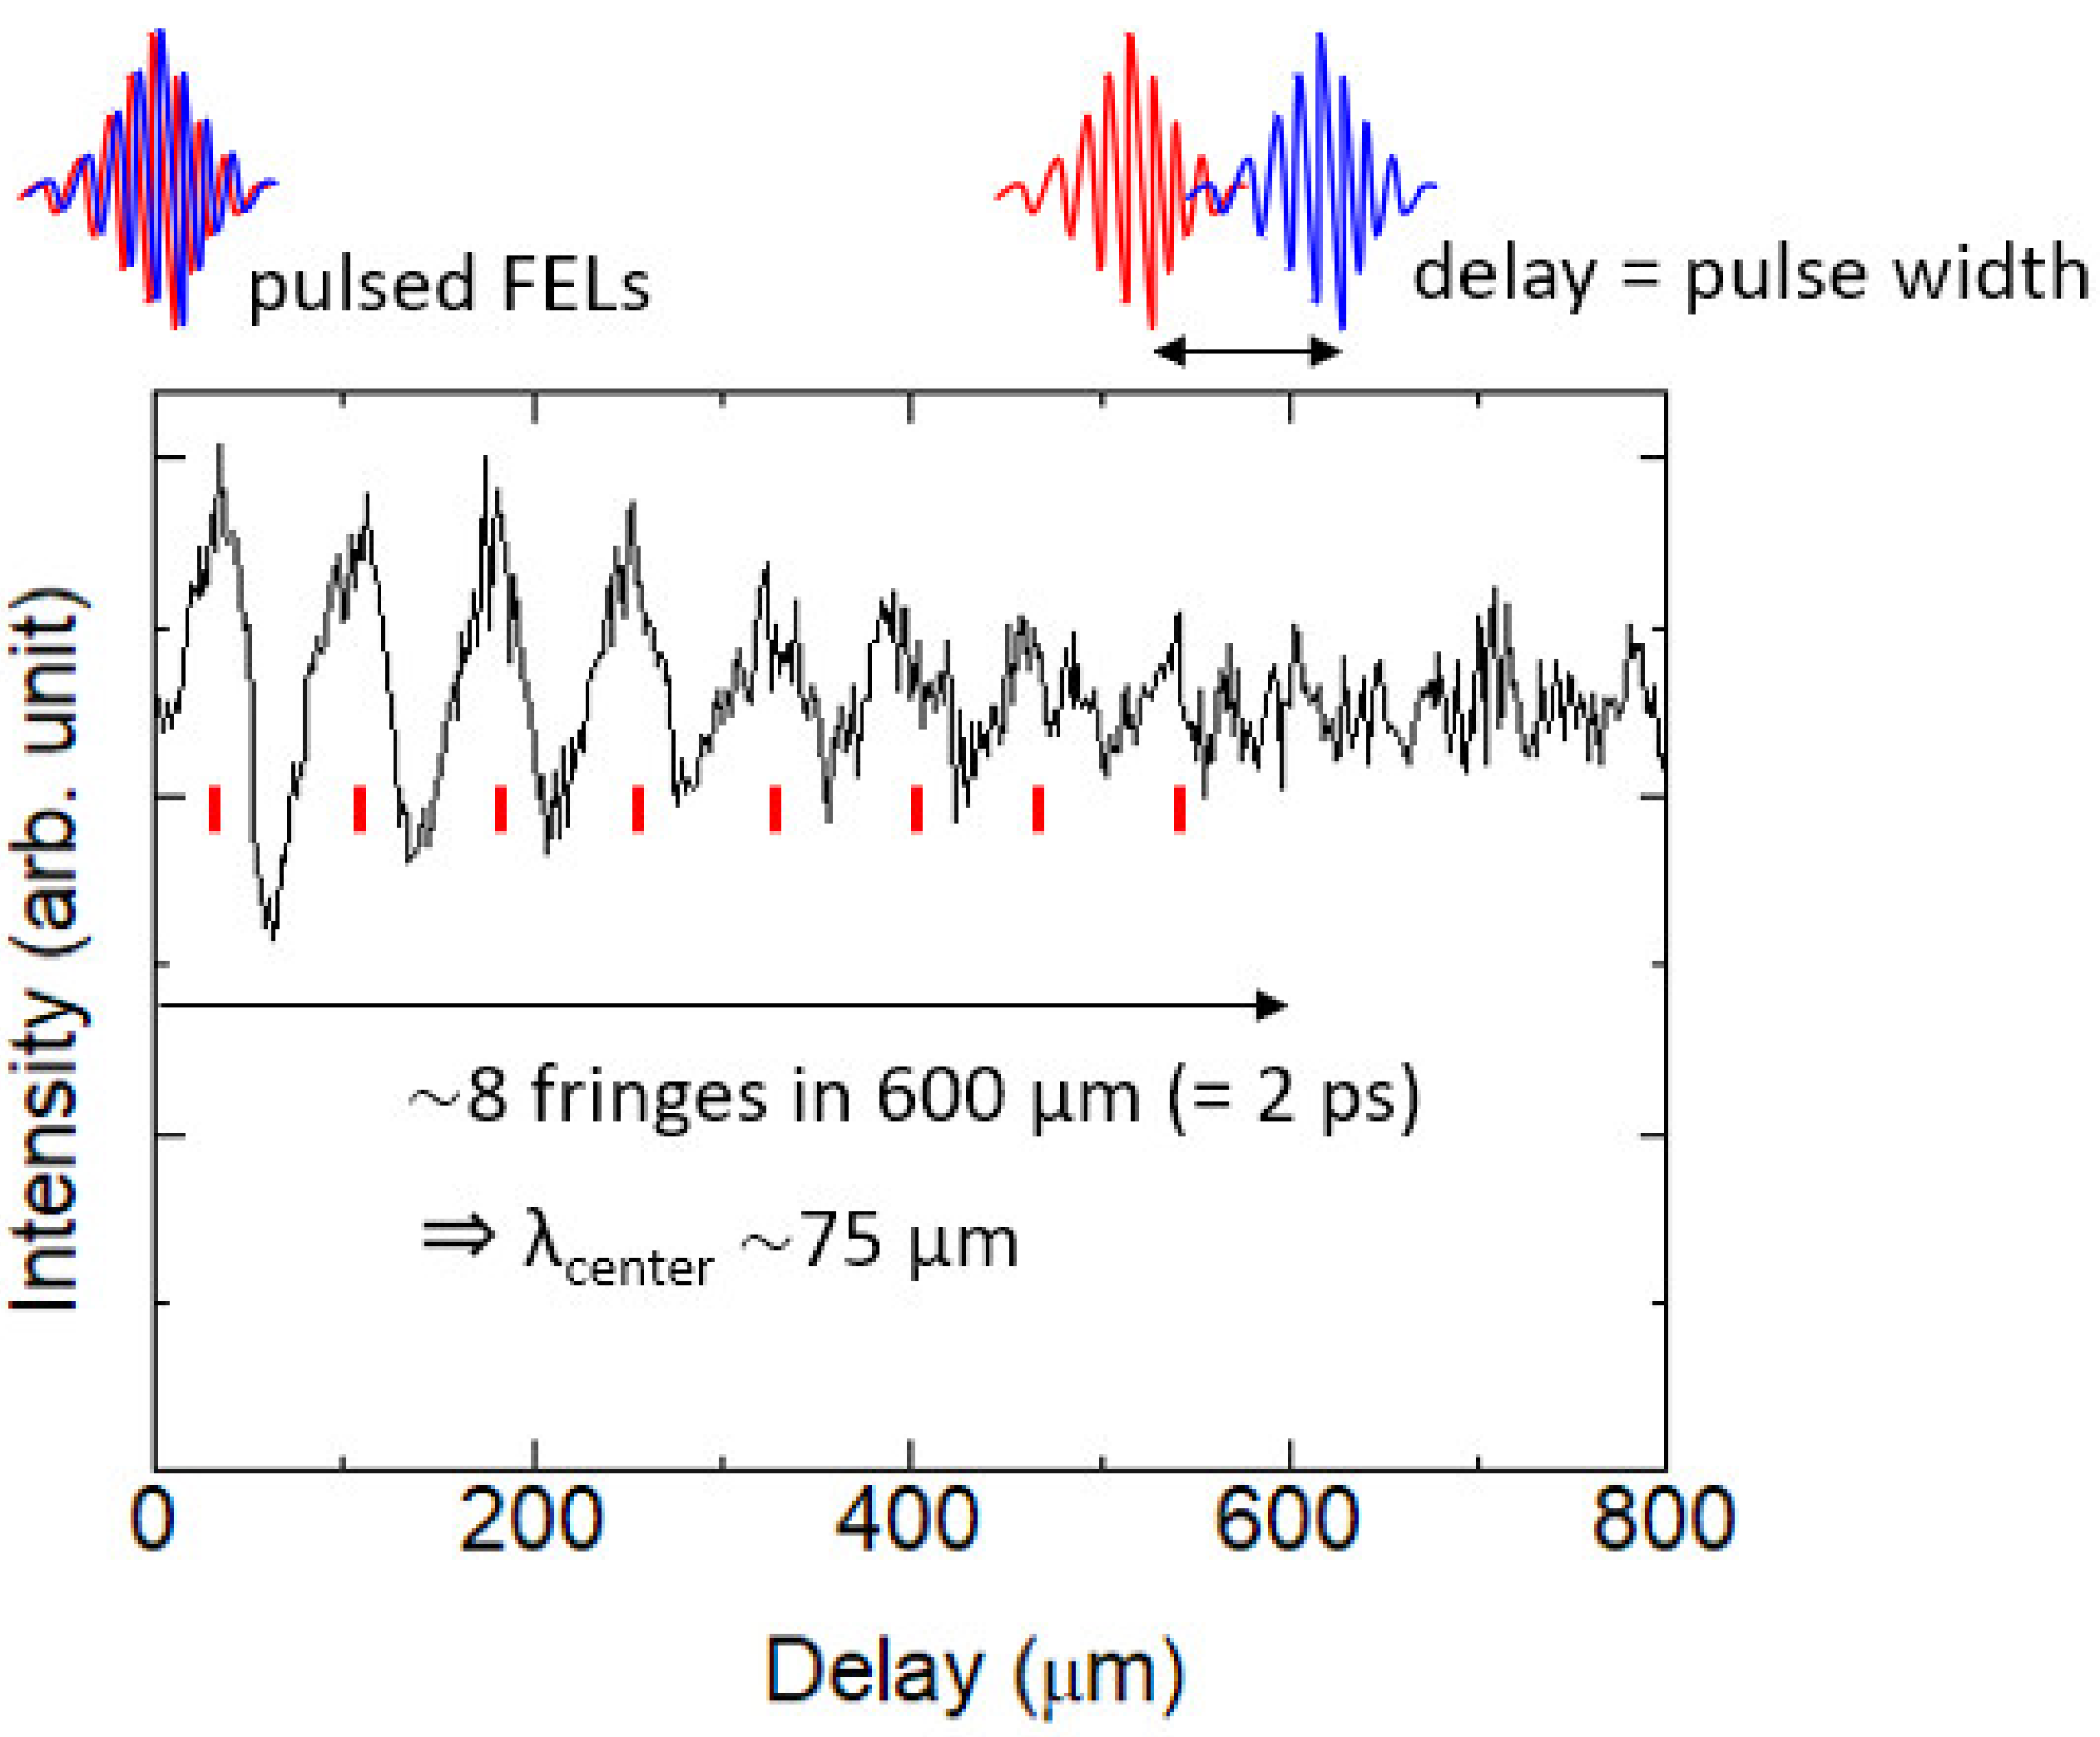
2. Characteristics of the ISIR THz-FEL

The FEL installed at the quantum beam science research facility in ISIR of the Osaka University can produce high-intensity pulsed light in the THz and FIR domains. The accelerator facility was established in 1957, and after almost 40 years, in 1978, the L-band electron linear accelerator was installed. After the first successful FEL oscillation [13], several upgrades have been realized. The details of the continuous improvement of the electron gun and the accelerator are summarized in Refs. [14,15,16,17,18]. In this contribution, we describe the experimental layout designed and assembled in ISIR and some recent experimental results obtained using this layout. The ISIR THz-FEL can be also used as a pump source thanks to the high intensity and time characteristics or as a probe source if combined with the irradiation of an external laser. In the next section, we will focus on microscopy and spectral-imaging experiments performed with the ISIR THz-FEL as the probe source and will discuss the typical FEL parameters we used for the experiments discussed below.
Figure 1 shows the pulsed time structure of the ISIR THz-FEL radiation reflecting the structure of an electron-bunch train. The FEL pulse train has a two-level structure. The first level is the micro-pulse, and the set of micro-pulses forms the macro-pulse. The long-time structure contains several macro-pulses emitted in sequence every 200 ms (5 Hz repetition). Each macro-pulse contains approximately 100 micro-pulses. The interval among micro-pulses depends on the FEL oscillation mode, i.e., 9.2 ns or 37 ns (= 9.2 ns × 4). The emission is due to ISIR THz-FEL’s pre-bunching system, which aims to increase the charge of the electron bunches. The time interval is 12 or 48 times longer than the length of 0.77 ns associated with the RF frequency of 1.3 GHz of the Klystron’s. The 9.2 ns interval is associated with the 108 MHz operation of the sub-harmonic buncher, while the 37 ns interval is due to the 27 MHz grid pulser installed on the thermal cathode electron gun.
In the spectroscopy experiments using the FEL as the radiation probe, a stable intensity mode with the micro-pulse interval of 9.2 ns (108 MHz mode) has been usually employed. For irradiation experiments on materials and for non-linear response experiments, the mode with the 37 ns interval (27 MHz mode) has been selected.
In this mode, the light intensity per micro-pulse was greatly increased and used as the pump source. In both modes, beam conditions are searched for the best monochromaticity and stability, and the irradiation energy is up to 10 mJ/macro-pulse in the 27 MHz mode and up to 1 mJ/macro-pulse in the 108 MHz mode. Figure 2 shows the typical wavelength dispersions of the THz-FEL in the (a) 108 MHz mode and the (b) 27 MHz mode. Although the monochromaticity differs much depending on the beam parameters and the FEL mode, the bandwidth is approximately 3% at the 108 MHz mode and approximately 10% at the 27 MHz mode under the best monochromaticity conditions. Actually, deep care must be taken when one adjusts the beam condition to make the energy maximized in the 27 MHz mode, because it often shows a wideband wavelength spectrum that can no longer be considered monochromatic (Appendix A).

3. Spectral Imaging Using THz-FEL

So far, THz imaging using various light sources and detectors has been performed, and technologies have been developed as in other wavelength regions [19,20,21,22,23,24]. Among them, time domain spectroscopy (TDS), quantum cascade laser (QCL), and terahertz parametric generator (TPG) using LiNbO3 non-linear optical crystals have been employed for the imaging at laboratory level below the 3 THz frequency domain. Moreover, the near field method has enabled the possibility of reaching a spatial resolution below the diffraction limit. However, THz/FIR radiation may not compete with X-rays in terms of transmittance and spatial resolution. That is, the most important motivation for imaging at the THz/FIR domain should be the observation of materials that have a characteristic response in this wavelength range. From this point of view, only a few imaging experiments at arbitrary monochromatic wavelengths, which can be called spectral imaging, are so far reported in the region below 3 THz [25,26]. In other words, conventional THz imaging has been hardly performed by probing the precise wavelength dependence of different materials characterized by specific absorptions, and most researchers have performed imaging by selecting an example that matches the wavelength maximum of each light source.
In the following, we will describe the status of spectroscopy for imaging using long wavelength radiation sources. Such a radiation, when emitted from a storage ring (SR), is competitive because of the brilliance, which is much higher than any standard laboratory light source based on thermal radiation. In this respect, SR is highly effective for any spectroscopic measurement of small areas using condensing optics, e.g., for microspectroscopy [27,28,29]. However, even in the case of SR sources, the total photon number is not enough for many experiments, especially in the far-infrared region. In general, it is necessary to accumulate spectra for several tens of seconds to several minutes using a Fourier transform infrared (FT-IR) spectrometer even for a single acquisition. Furthermore, it is well known that diffraction grating type spectrometers are more demanding in terms of photon numbers. Therefore, an impractical long-time integration is frequently required in 2D scan spectral imaging. For example, a scan of 50 × 50 points would require approximately 7 h, even if a FT-IR instrument takes only 10 s to measure each point. In contrast, THz-FEL is a quasi-monochromatic light source, and it is several orders of magnitude more intense than SR infrared radiation for both total photon number and illuminance. Thus, the spectral imaging using FEL is certainly realistic even when monochromatized through a diffraction grating-type spectrometer. We will present and discuss high-sensitive spectral imaging experiments performed with arbitrary monochromatic wavelengths in the range of 50–100 μm, i.e., the frequency range of 3–6 THz.

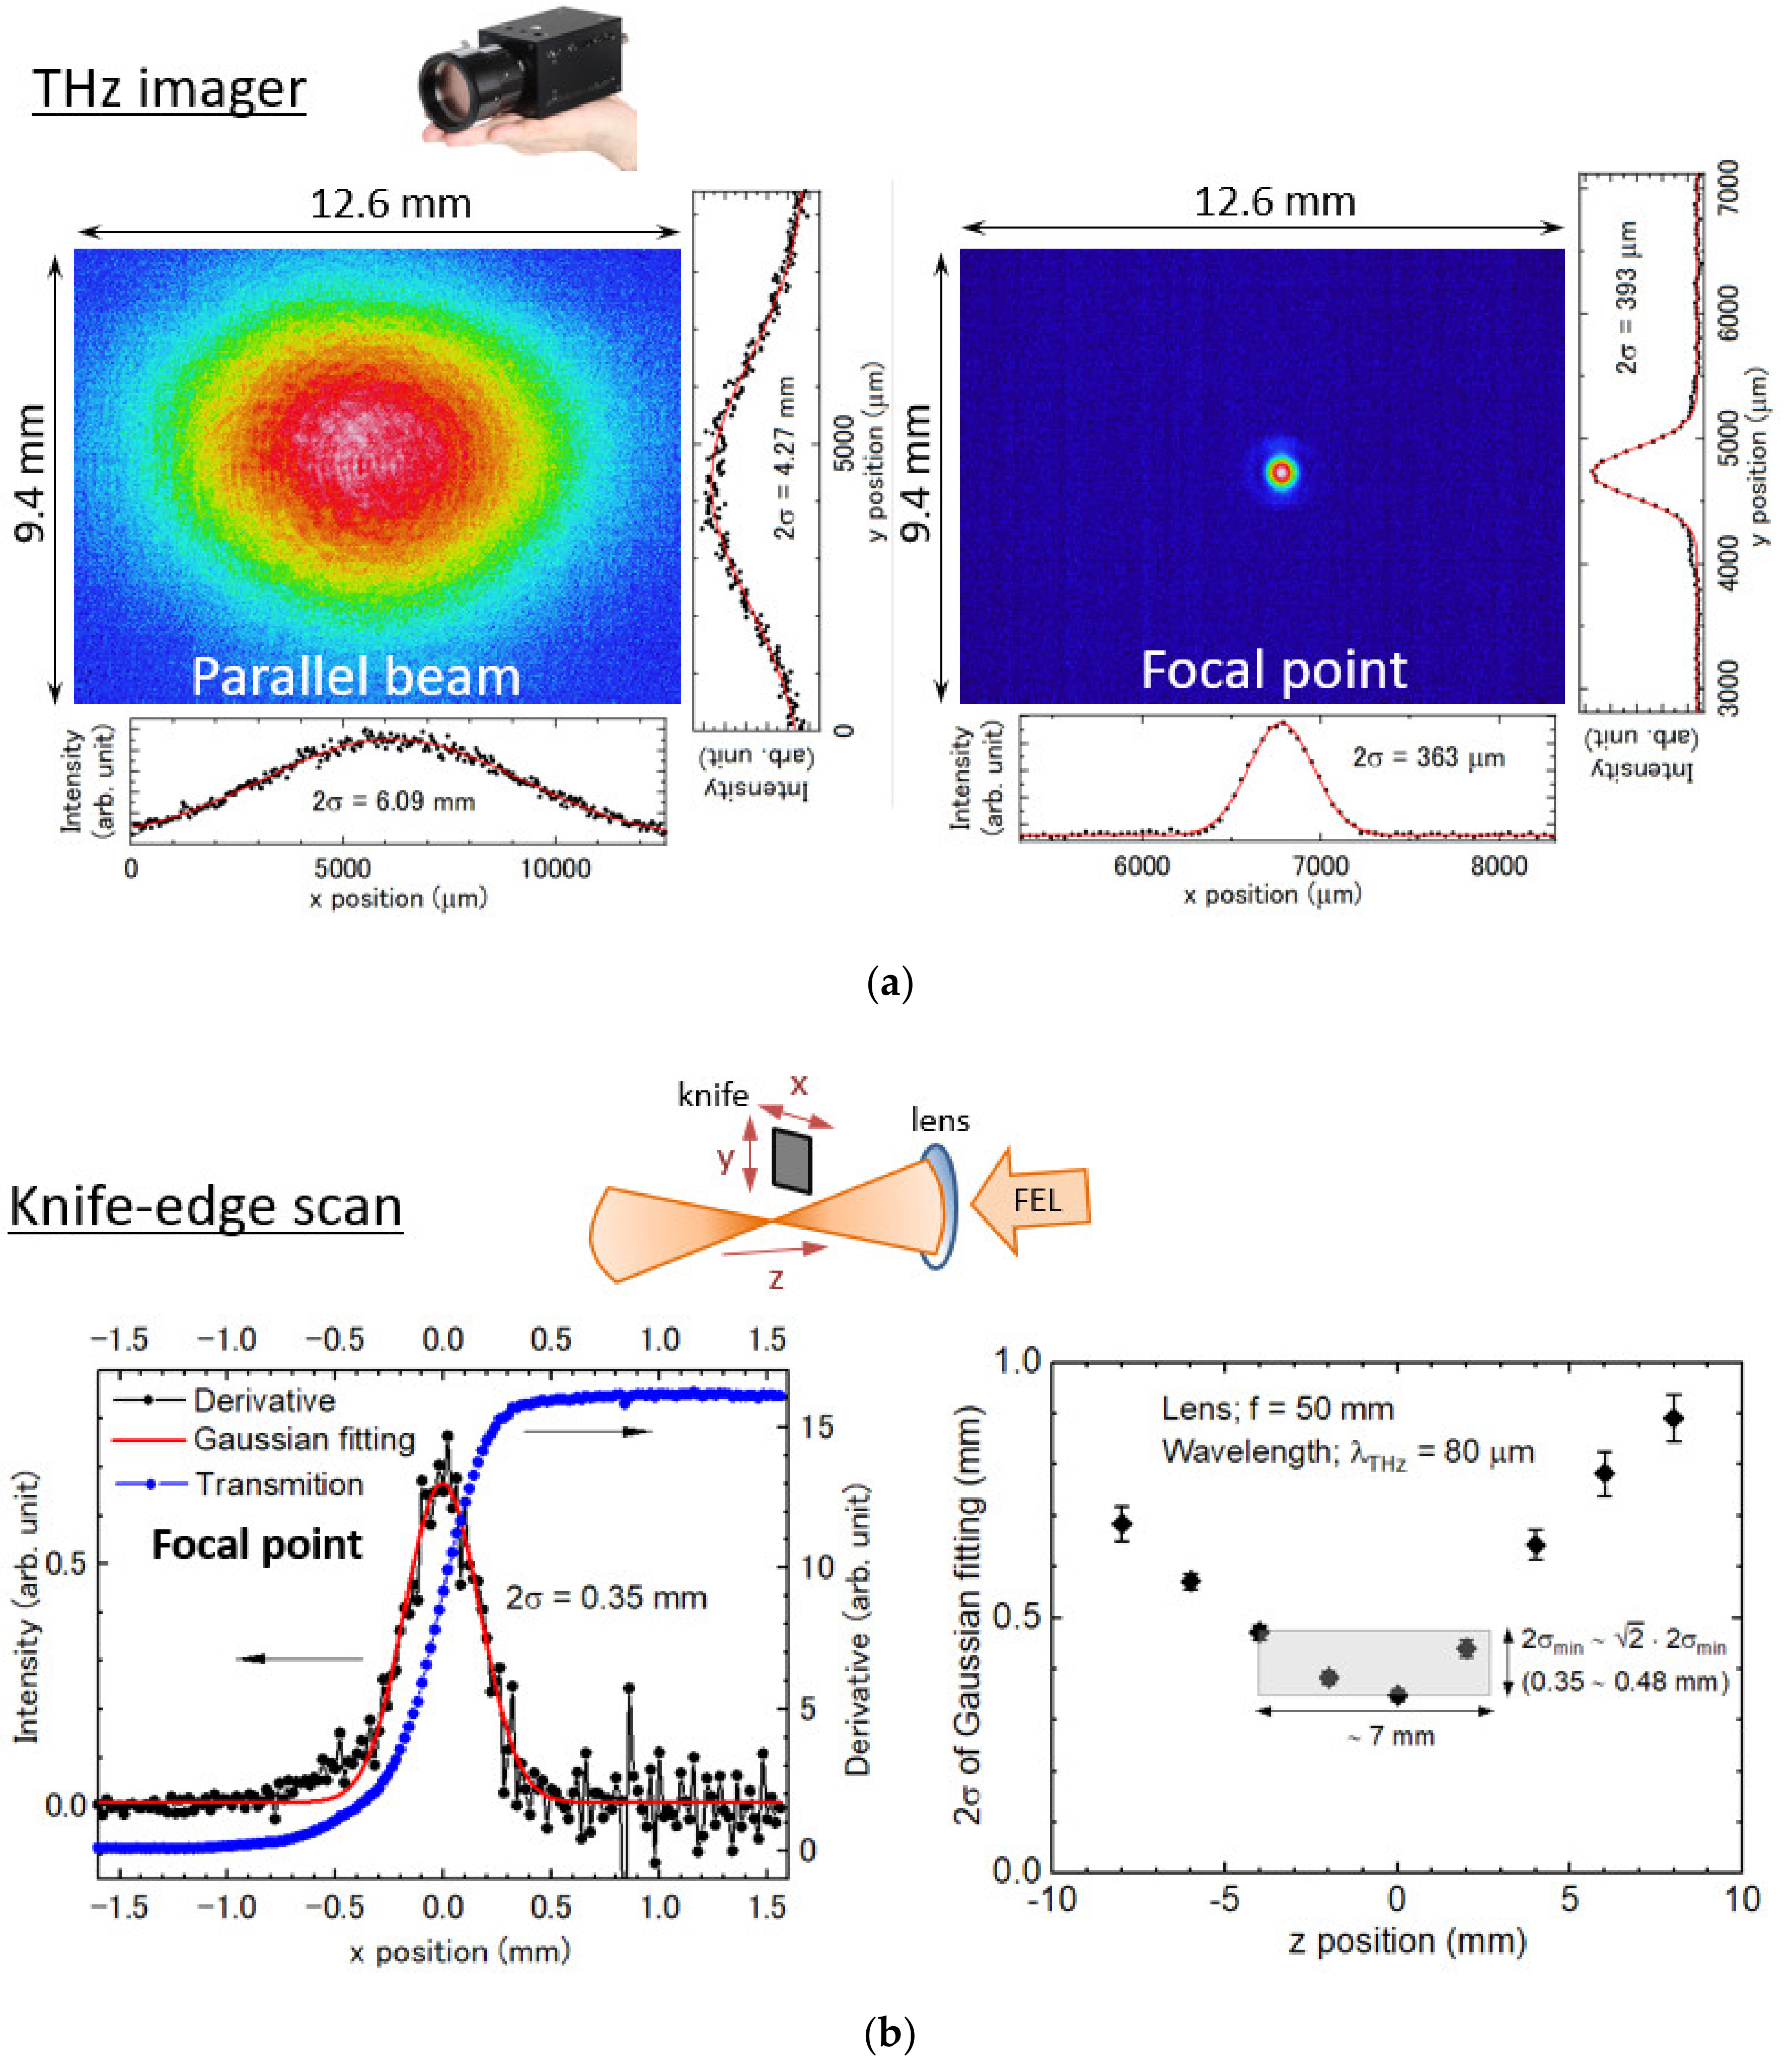
3.1. Optical Scheme and Beam Profile

For spectral imaging, the quasi-monochromatic FEL emission, as shown in Figure 2a, must be further monochromatized. Figure 3 shows the layout of the monochromator, the focusing optics, and the sample stage system to be really employed. FEL radiation transferred through the vacuum tube is first monochromatized by the diffraction grating in the monochromator and propagates from vacuum to atmosphere, as a parallel beam through a diamond window. The monochromatic FEL radiation is focused at the sample position by the lens and refocused on the detector in the transmission arrangement, or in the alternative reflection layout. The lens used is an F = 1.97 (effective aperture Φ = 25.4 mm, focal length f = 50 mm) Tsurupica lens, and the detector used is a COHERENT Energy Max energy sensor calibrated in the THz region. The measurement sample stage is a SIGMAKOKI motorized x-y stage that allows a raster scan in the x-y plane simultaneously with the pulse timing of the FEL.
Figure 4 shows (a) (left hand) the beam profiles of the THz-FEL taken by an uncooled THz imager (NEC Corporation, IR/V–T0831) [30] just after the vacuum window and (right hand) the focal point condensed by the Tsurupica lens and (b) the intensity profiles by a knife-edge scan near the focal point. The parallel beam of the THz-FEL obtained through a 1-inch diameter diamond vacuum window is focused to an area of approximately 350 μm in 2σ at the focal point. The beam profiles observed by the THz imager (Figure 4a), measured with a knife-edge scan (Figure 4b), show an almost Gaussian distribution in both parallel areas just after the vacuum window and the focal point. The beam profile distribution near the focal point was probed by a knife-edge scan at several points in the z-axis direction (optical axis direction). As a result, the Rayleigh length was estimated to be approximately 3.5 mm. As a consequence, we expect that a clear transmitting image can be obtained up to a thickness of the sample of approximately 7 mm or less.

3.2. Spectral Imaging of Solid Samples
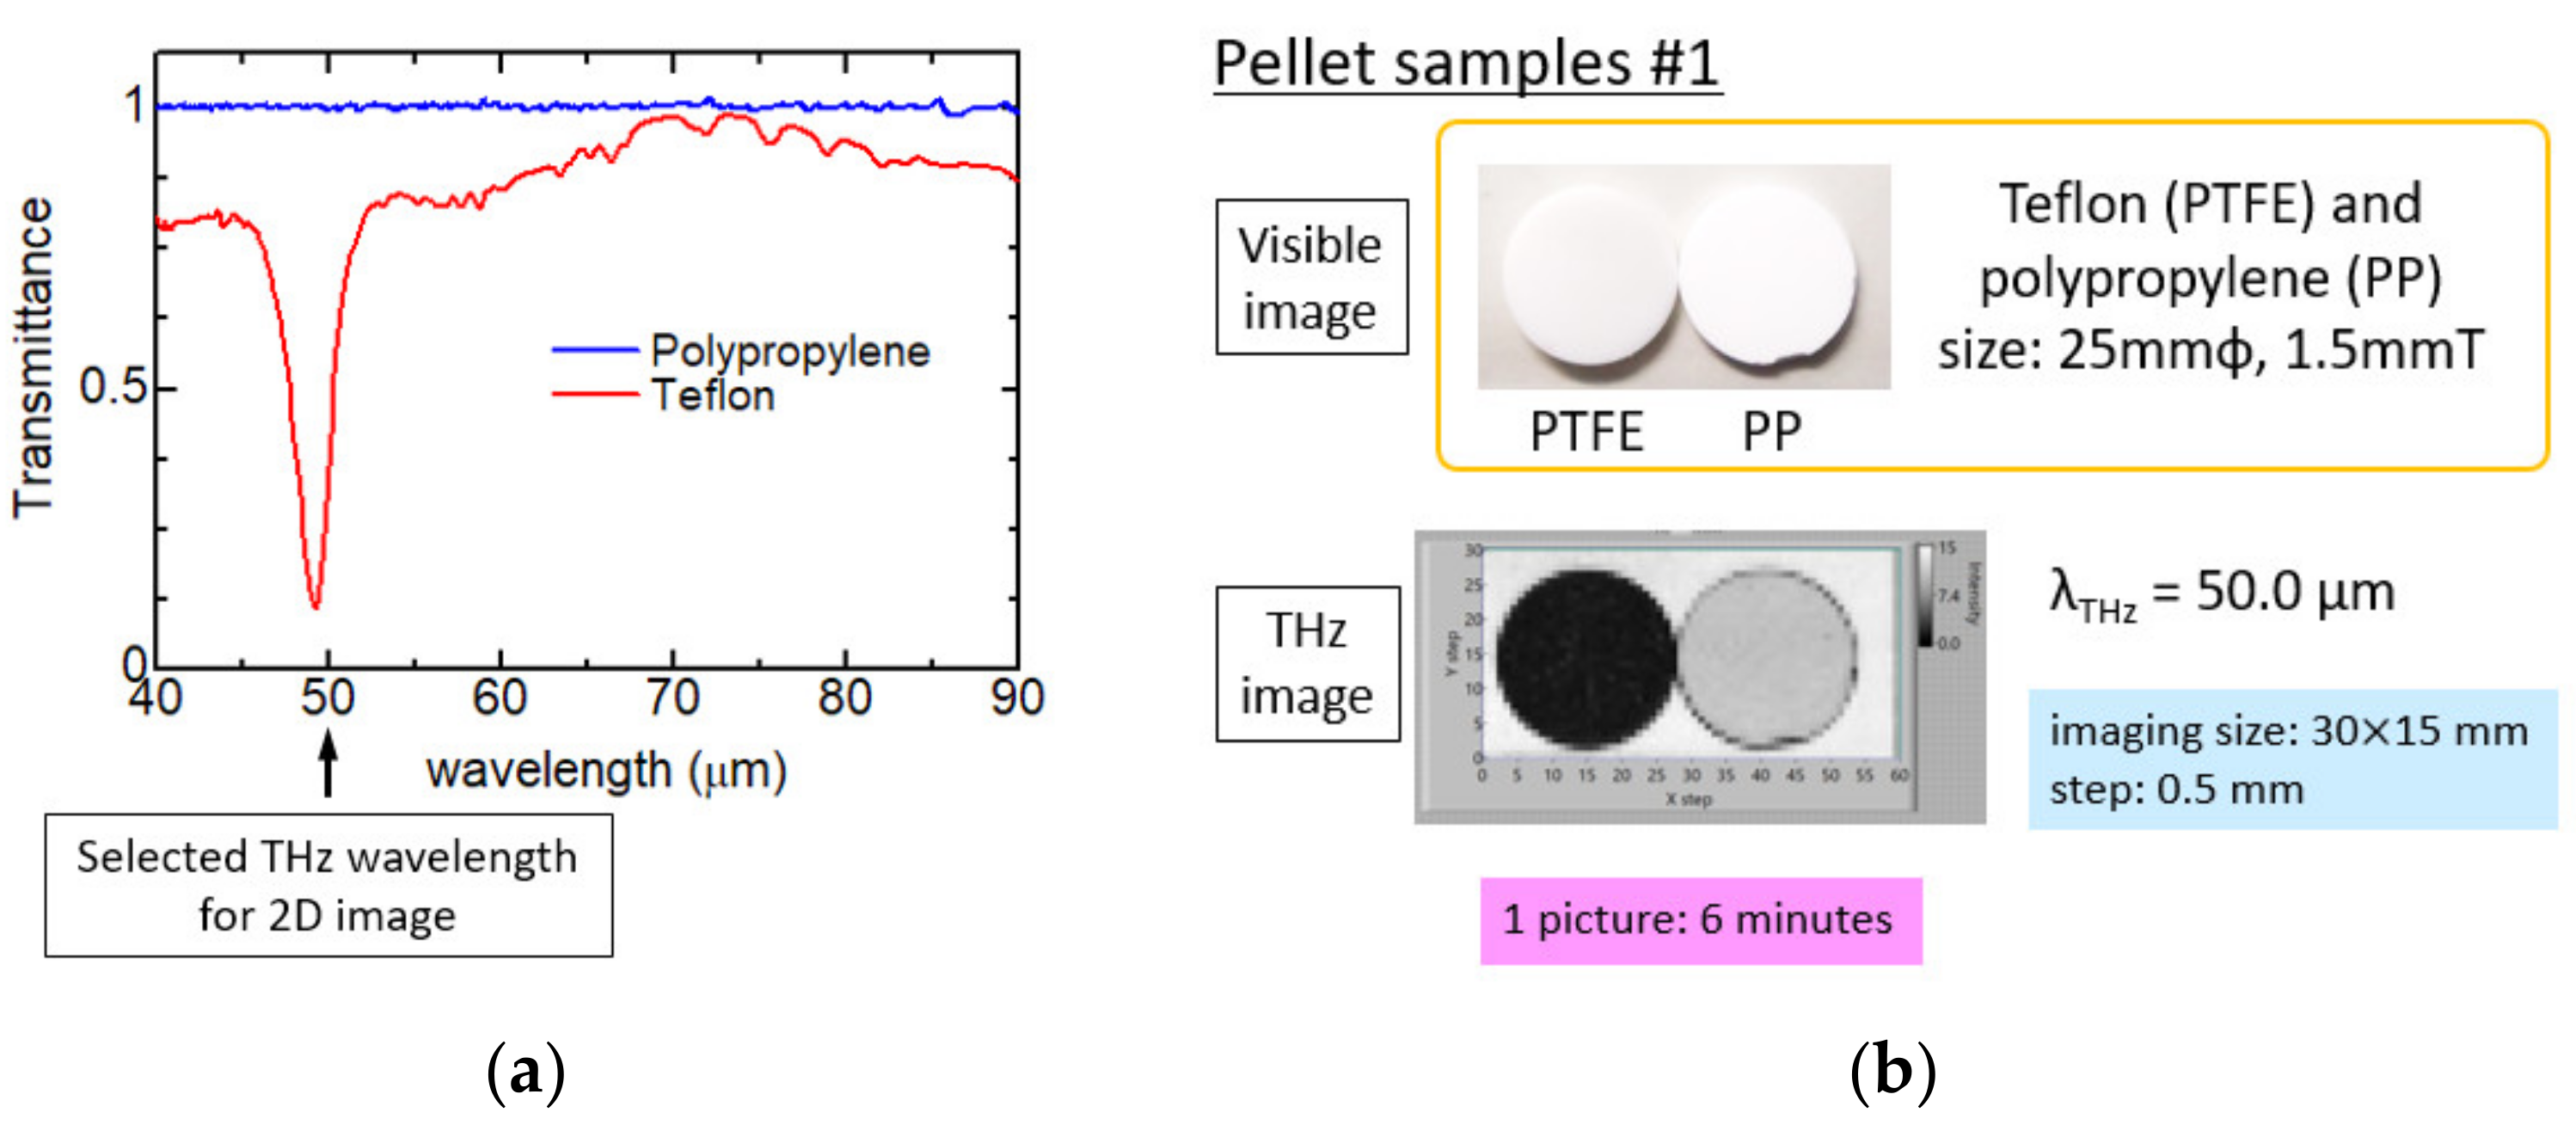
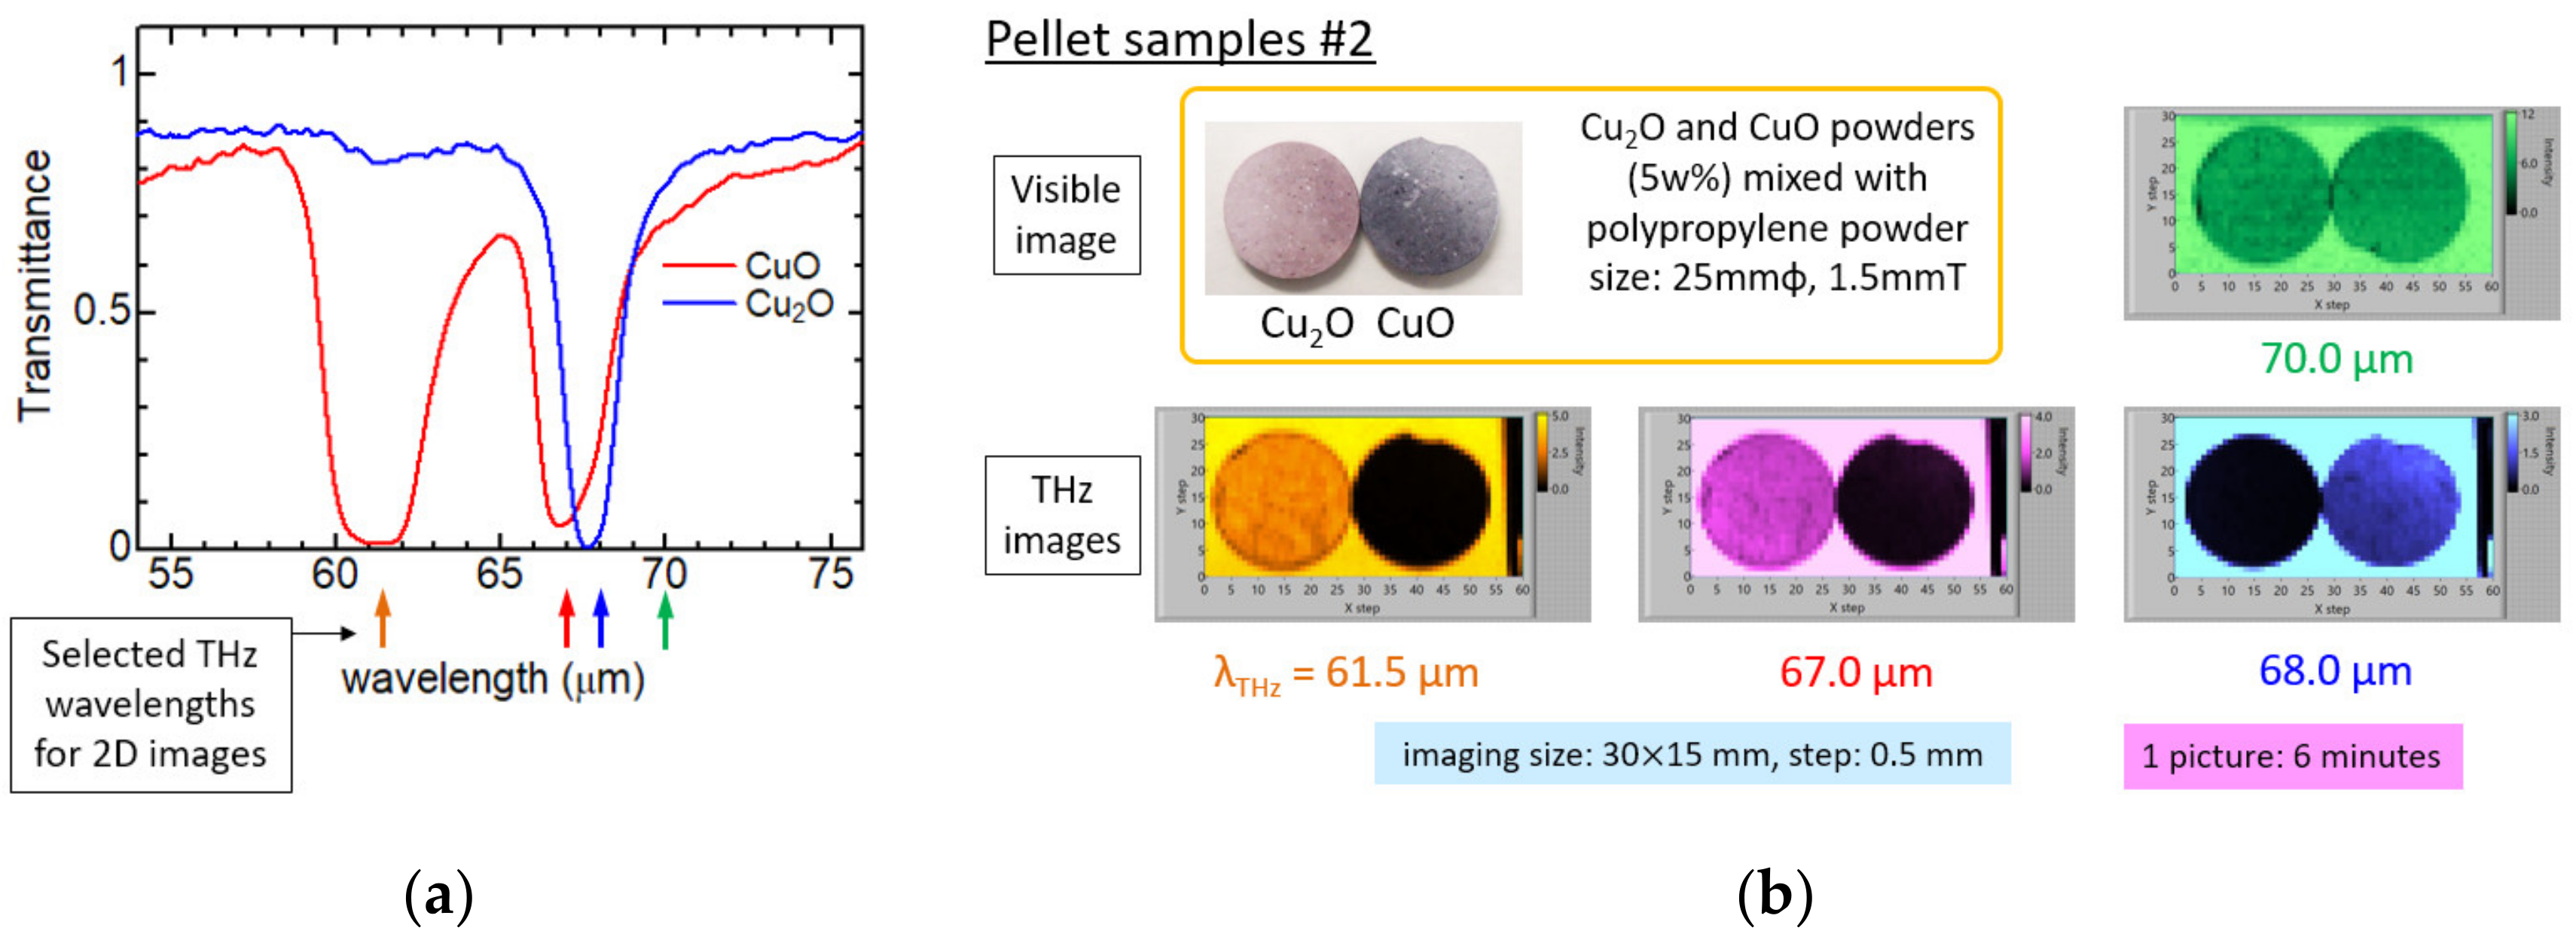
In the spectral-imaging experiment, the sample is placed at the FEL focal position. A He-Ne laser, which go through the same FEL optics, is used as a guide to set the sample at the FEL focal spot. In our layout, the FEL radiation after monochromatization by the diffraction grating spectrometer is collected by the lens, and the raster scan of the sample is automated by the stage to obtain a 2D image. The spatial resolution is determined by the degree of FEL focusing and by the step of the translation stage that moves the sample during the scan. In order to ensure that the sample is irradiated with the FEL pulse at each observation point, the stage is moved stepwise at 5 Hz, which is synchronized with the timing system of the linear accelerator [31]. The intensity of the monochromatized FEL radiation is sufficient for transmission and reflection experiments using one macro-pulse per point. When a raster scan of the sample is performed on an area of 2 cm × 2 cm with a scanning step ∆ = 500 μm, i.e., 1600 points at 5 Hz, a 2D spectral image can be collected within approximately 6 min.
Figure 5, Figure 6, Figure 7 and Figure 8 show the results of spectral images collected on pellets, 3D samples made by composite materials, opaque objects, and biological systems. Versatility and short time acquisitions represent the really unique capabilities of this layout. The time required for a single 2D image ranges from 5 to 60 min depending on the sample size and the raster-scan step. The relevance of this experiment resides in the observation of clear changes in the images using high-wavelength resolution. These were the experiments performed for the first time in the THz/FIR domain with such resolution and the first successful imaging of almost opaque objects at these wavelengths. We also successfully collected images showing non-linear behavior due to the high FEL intensity.

3.2.1. Pellets

Figure 5 and Figure 6 compare the spectral imaging of pellet samples collected in transmission. Figure 5a compares the infrared spectra of the Teflon (polytetrafluoroethylene, PTFE) and of the polypropylene (PP). PP has no intrinsic absorption in the THz/FIR region and is highly transparent. Therefore, as it can be seen in the figure, PP shows only a flat spectrum. On the other hand, PTFE shows a spectrum with an intense absorption peak around 50 μm. Both pellets are made from 100% pure powders of each material using a compression mold. Figure 5b shows the images of these pellets at the wavelength of the absorption peak in PTFE. The upper part is a visible image of the two pellets that can be hardly distinguishable, while collecting images at the absorption wavelength, a clear difference can be observed with a clear contrast. Next, imaging was performed on diluted pellets of CuO and Cu2O powder. With each powder, we made pellets at the dilution of 5% by weight together with PP powders.
Figure 6a shows the infrared spectra of CuO and Cu2O, respectively. CuO shows absorption peaks at the wavelengths of 61.5 μm and 67 μm while Cu2O shows an absorption peak at 68 μm. Figure 6b shows the images at the three absorption wavelengths and at 70 μm that are not absorbed by both CuO and Cu2O. It takes 6 min to collect each image. In panel 6(b), it can be seen that the image contrast changes with respect to the wavelength. In particular, the contrast between the images of CuO and Cu2O is clearly reversed with just a difference of 1 μm going from 67 μm up to 68 μm, clearly demonstrating the effectiveness of the monochromatic FEL for long-wavelength high-resolution spectral imaging.

3.2.2. Composite Materials with A Fine Structure

In Figure 7a, transmission imaging of an oily marker having a pen tip of 0.5 mm was performed while keeping the lid so that the pen tip would not dry. The lid is almost transparent, and the metal part and the liquid reservoir inside can be observed as opaque parts. The outer diameter is approximately 1 cm at the maximum. A clear image is obtained with a large depth of focus, which is expected from the Rayleigh length estimated at the focal point.

3.2.3. Opaque Systems
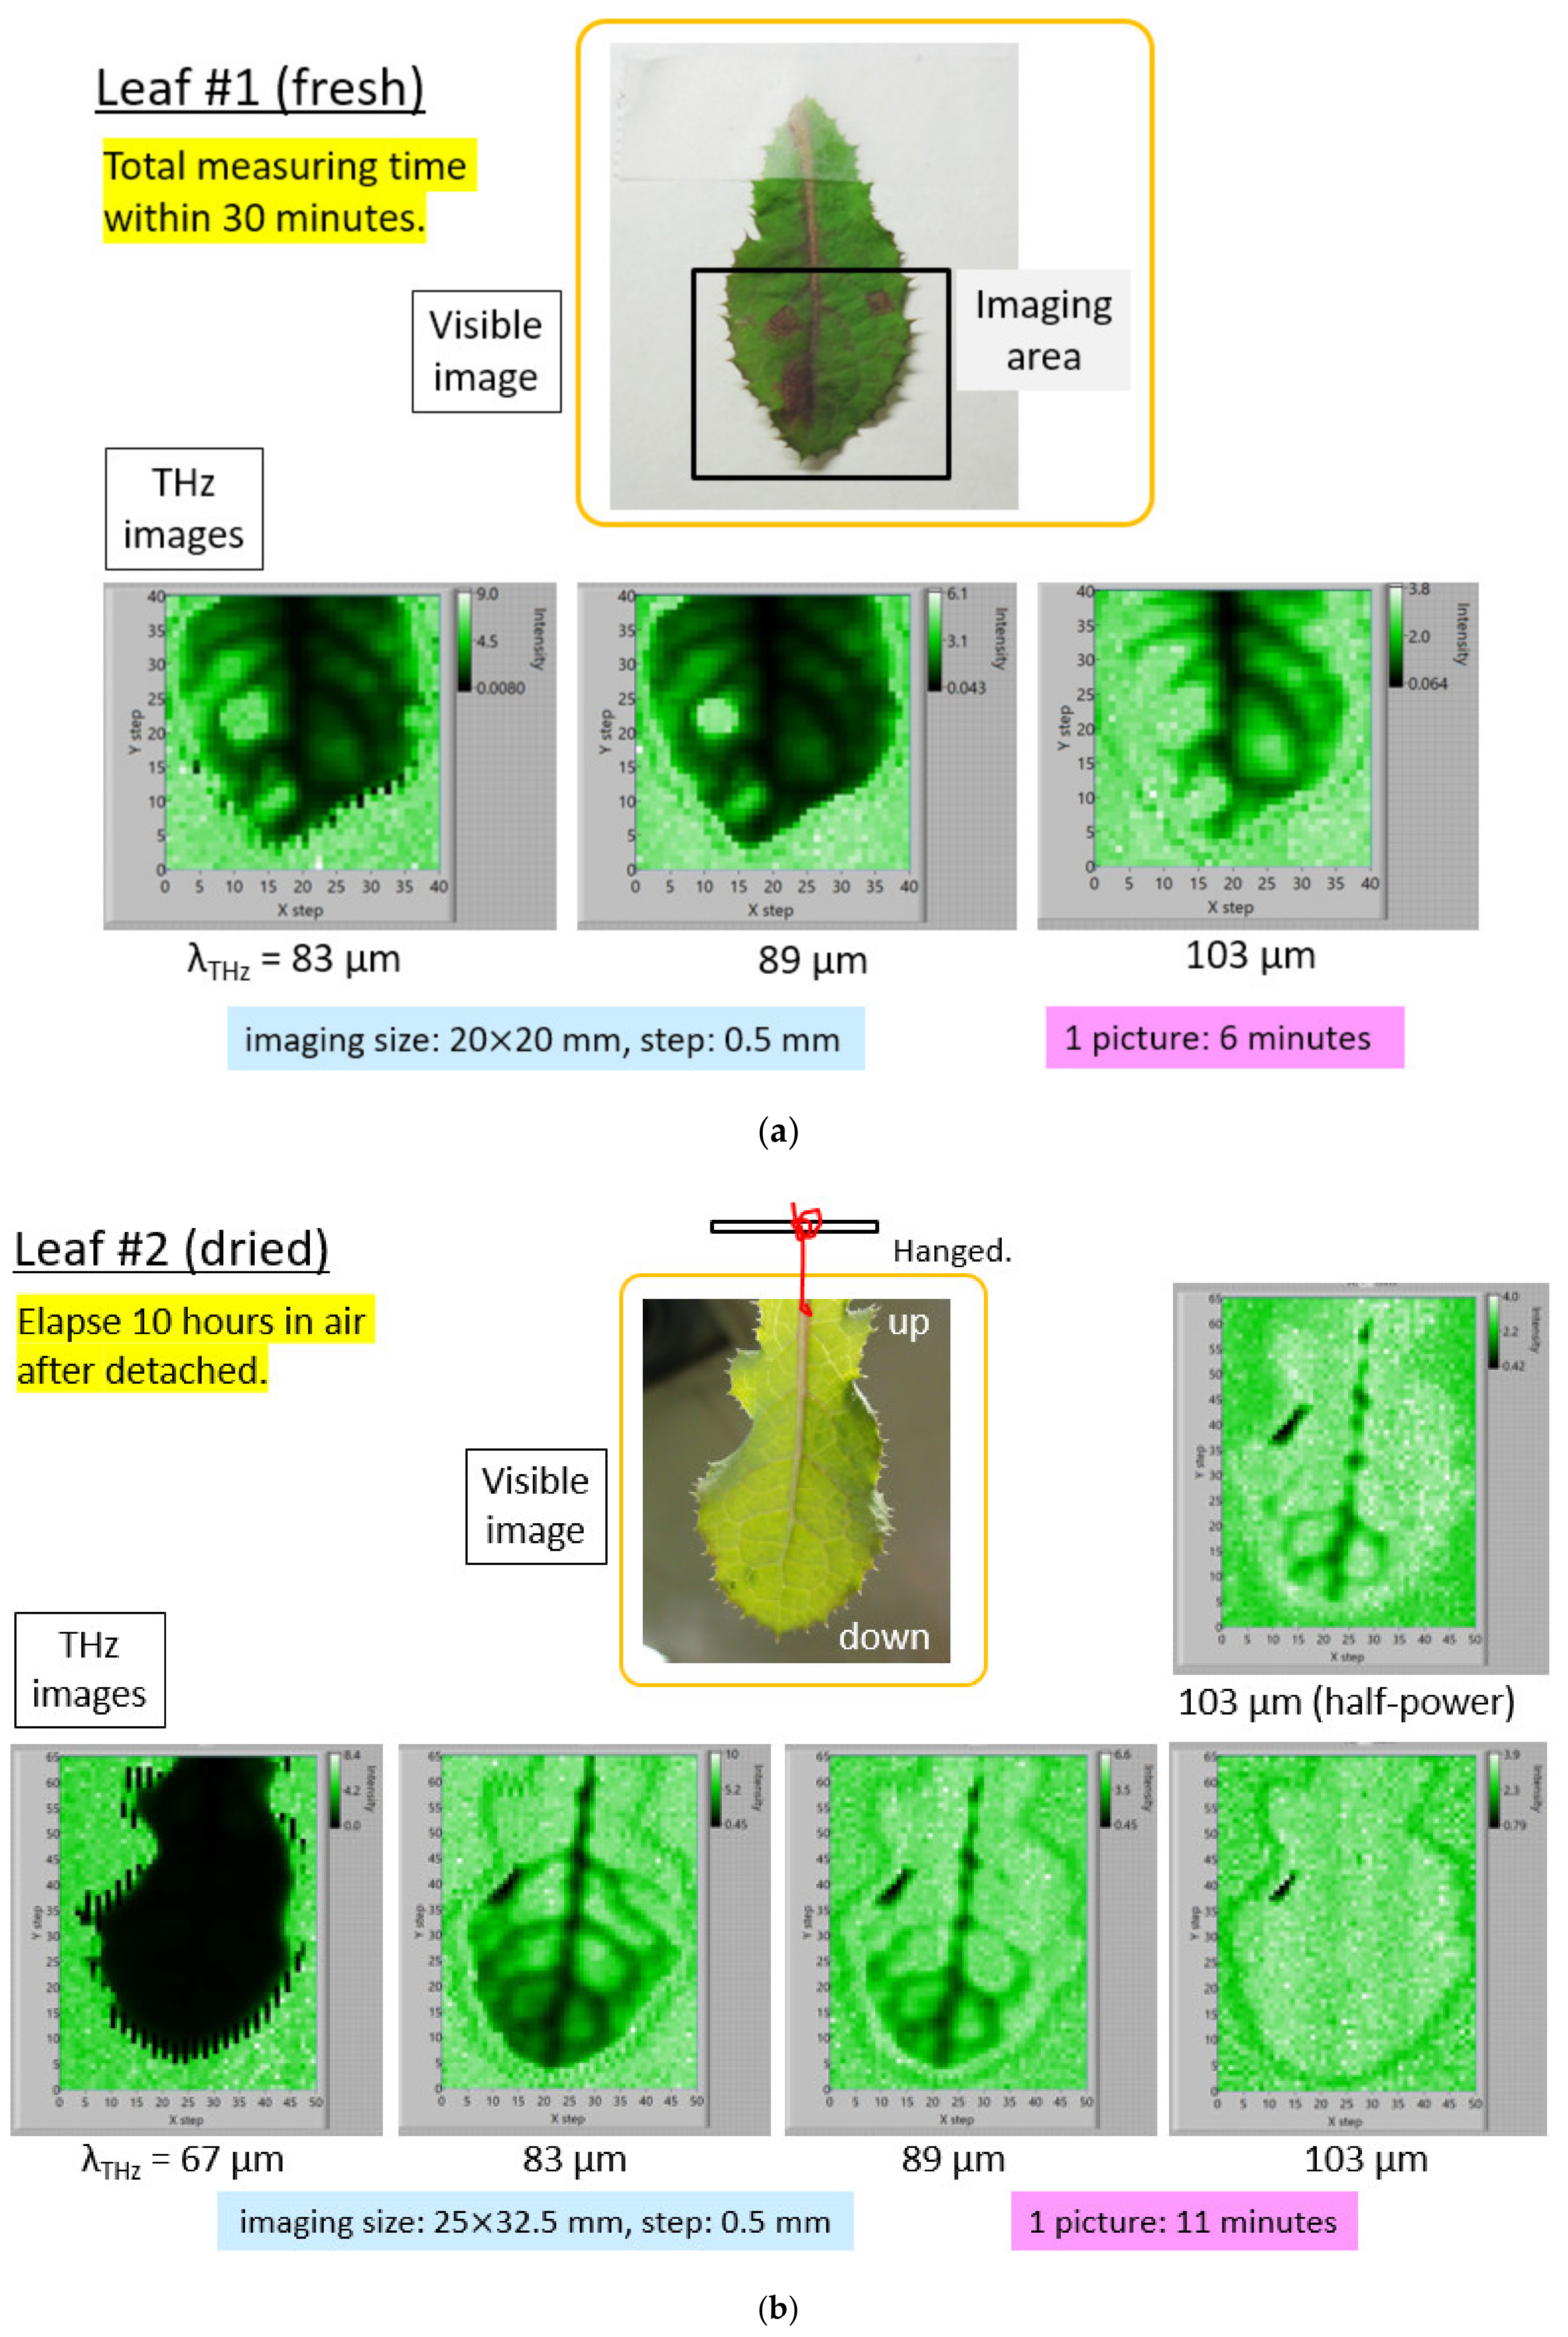
Particularly important applications of spectral images refer to hard and soft opaque objects or liquid substances. Mahjong tiles are made of lumps of urea resin and hardly transmit THz/FIR radiation. However, when transmission imaging was performed using FEL with a high-intensity monochromatic beam, we succeeded in observing the engraved character on the surface from behind, as shown in Figure 7b. Since the character is observed from behind, the left and right of the image is reversed. The contrast observed is due to the difference in the reflection and the scattering contributions of the FEL radiation between the flat part of the tile surface and the regions of the engraved text. There are several successful examples of THz transmission images of nuts at 0.1 THz (λTHz = 3000 μm) [32]. However, as far as we know, Figure 7c is the first in situ observation of dried peanut without peeling at approximately 3 THz (λTHz approximately 100 μm). The outer shell is shown with the orange color, while the two nuts touching each other can be recognized as dark areas in Figure 7c. Between the two nuts inside the shell, the lower nut seems to be drier and the internal embryo is seen through. Since the image including the outer shell is collected at the maximum FEL intensity, the detector was saturated in vacant space outside of the shell, causing a noise pattern due to the incorrect acquisition of the signal.
THz can be used also to collect images of liquids such as water. As an example, an image shown in Figure 7d was taken of a container filled with approximately 1 cm thickness of water. FEL radiation penetrates where the thickness of water is reduced: the neck and edge of the container, and the edge of water surface raised by surface tension. At the neck position with a red cap, the water thickness is approximately 2–3 mm and, to the best of our knowledge, in Figure 7d, we show the first THz transmission image of pure water. Since the image was obtained with a step scan over a wide area with a space resolution of 0.3 mm, it took one hour to collect this high-spatial resolution transmission image. The noise pattern near the edge of container was caused by the same reason of Figure 7c.

3.2.4. Leaves

THz images of leaves showing water distribution are already available in other studies. At ISIR, we tried to investigate their wavelength dependence and time dependence. The wavelength selected for imaging lies in a region where there is no absorption by atmospheric water vapor. At variegation spots highlighted by a dark color in the visible image shown in Figure 8a, the FEL radiation is well transmitted through leaf at any wavelength, even in fresh conditions. It is important to emphasize here, from these experimental results and those of another leaf in Figure 8b, that moisture and nutrients are not homogeneously distributed in leaves.
The image collected at 103 μm is the first image of the present measurement, but it is also measured with the highest transmission compared to the images collected at 89 μm and 83 μm. We would like to point out that the difference between these three images at different wavelengths is not merely due to the amount of the water content through the evaporation occurring with time, but it is due to the different absorbance versus wavelength. The reproducibility of the image at 103 μm was confirmed by measuring it twice, at the beginning and at the end of the experimental series after 30 min.
In order to evaluate how much water remains in a leaf after being detached, several images of a leaf hanged in air for 10 h were collected at several wavelengths, as shown in Figure 8b. Since this measurement is not time-sensitive, four different wavelengths were selected for imaging. Two images at 103 μm, taken twice with different FEL power, are also shown for reference.
Comparisons of the different images in Figure 8b pointed out that at the wavelength of 67 μm, there is still a large absorption in the whole leaf area, while at 103 μm, FEL radiation is almost completely transmitted through, making the pattern of the vein unrecognizable. The strong wavelength dependence in the dried leaf suggests that the decrease of the transmittance in these THz images of leaves is not only due to water, but also due to other substances present in the veins, such as nutrients. Therefore, we assume that water in leaves was almost evaporated after approximately 10 h, while nutrients still remained in the leaf veins, as we can understand from the observed large wavelength dependence. In the freshly detached leaf showed in Figure 8a, nutrients and moisture were homogeneously distributed throughout all veins of the leaf. However, in the leaf that was hanged and dried in air shown in Figure 8b, it is presumed that only the nutrients were concentrated in the lower part of the leaf during water evaporation. In addition, when the power of the FEL is changed as the intensity is halved at the wavelength of 103 μm, the vein pattern comes to be exposed again. One possibility resides in the nutrients in the veins remaining after water evaporation showing non-linear transmittance with respect to FEL intensity. The component analysis and the survey of the distribution of nutrients in leaves are indispensable for future biological science researches. The observed non-linear response can be the first case in THz imaging and could provide very useful information for future studies.

4. Conclusions

We performed unique spectral-imaging experiments in the THz/FIR range using a grating-type spectrometer, a focusing optics, and a sample stage synchronized with the time structure of the high power ISIR THz-FEL at Osaka University. Successful different images with high wavelength resolution of ∆λ = 1 μm have been obtained by tuning the gap of the undulator and the spectrometer. Moreover, thanks to the FEL time structure, fast spectral imaging was also feasible on different samples in various forms. Taking advantage of the high power of the FEL source, for the first time in the THz/FIR domain, we succeeded in the acquisition of transmission images of “opaque” solid materials and liquids. The versatile image acquisition system with raster scanning allowed monitoring changes in the composition of leaves. We also showed for the first time that non-linear phenomenon can be observed in images on changing the FEL intensity.
These results clearly point out the huge opportunities of these coherent high-power, high brilliance sources and the potential of scientific and technological researches in the THz/FIR domain and its interdisciplinary nature. The introduction of new sources, new detectors, control systems, and more advanced analysis techniques will be in great demand in the coming years.

Author Contributions

Conceptualization, project administration, A.I.; data curation, A.I. and M.F.; funding acquisition, A.I., S.L., A.M. and S.S.; investigation, A.I., K.K., M.F., R.K., H.F., A.H., S.M. and L.T.; resources, A.I., M.F., K.K. and R.K.; software, A.I., M.F., K.K. and R.K.; Writing—original draft, A.I; Writing—review and editing, A.M. and S.S. All authors have read and agreed to the published version of the manuscript.

Funding

This work was supported by JSPS KAKENHI Grant No.JP17K18989, by the research program “Dynamic Alliance for Open Innovation Bridging Human, Environment and Materials,” and by the Bilateral Cooperation Agreement between Italy and Japan of the Italian Ministry of Foreign Affairs and of the International Cooperation (MAECI) in the framework of the project of major relevance N. PGR0072.

Acknowledgments

We acknowledge K. Furukawa, and Y. Okada for their invaluable support during the THz-FEL operation.

Conflicts of Interest

The authors declare no conflict of interest.

Appendix A

The emission characteristics of the ISIR THz-FEL may change greatly depending on the beam setting. When measuring the wavelength spectrum, the bandwidth, the peak intensity, and the total energy have to be changed. As described in the text, when the total energy is set to the maximum at 27 MHz, the bandwidth significantly increases and shows a complex spectral shape (Figure A1).
Figure A1. Comparison of two FEL spectra in the 27 MHz mode for the 33 mm (red) and the 37 mm (black) gap (wideband condition).
Condensedmatter 05 00038 g0a1
In this condition, the area of the spectrum, that is proportional to the total energy, increases about three times (approximately 30 mJ/macro-pulse) [33] or more in this wideband scenario if compared with the monochromatic setup (approximately 10 mJ/macro-pulse). However, the maximum intensity at the central wavelength does not increase, as shown in Figure A2. Therefore, such beam conditioning has no advantage for spectral imaging when the FEL is monochromatized by a diffraction grating. At variance, it is detrimental, since it is characterized by higher beam instability. Meanwhile, the pulse width estimated from the autocorrelation of the pulsed FEL is shortened from approximately 20 ps to about several ps by adjusting to the wideband condition, as shown in Figure A3. It must be always clarified whether a short pulse or a monochromatic beam is required for the THz radiation in each experiment, and then it sets the FEL with the necessary parameters.
Figure A2. Comparison of two FEL spectra in the wideband (black) and monochromatic (purple) condition in the 27 MHz mode and the undulator gap sets to 37 mm.
Condensedmatter 05 00038 g0a2
Figure A3. The interference waveform of the pulsed FEL by autocorrelation.
Condensedmatter 05 00038 g0a3

References

  1. Hoshina, H.; Suzuki, H.; Otani, C.; Nagai, M.; Kawase, K.; Irizawa, A.; Isoyama, G. Polymer morphological change induced by terahertz irradiation. Sci. Rep. 2016, 6, 27180. [Google Scholar] [CrossRef] [PubMed]
  2. Nagai, M.; Aono, S.; Ashida, M.; Kawase, K.; Irizawa, A.; Isoyama, G. Luminescence induced by electrons outside zinc oxide nanoparticles driven by intense terahertz pulse trains. New J. Phys. 2017, 19, 053017. [Google Scholar] [CrossRef] [Green Version]
  3. Irizawa, A.; Suga, S.; Nagashima, T.; Higashiya, A.; Hashida, M.; Sakabe, S. Laser-induced fine structures on silicon exposed to THz-FEL. Appl. Phys. Lett. 2017, 111, 251602. [Google Scholar] [CrossRef]
  4. Kawasaki, T.; Tsukiyama, K.; Irizawa, A. Dissolution of a fibrous peptide by terahertz free electron laser. Sci. Rep. 2019, 9, 1–8. [Google Scholar] [CrossRef] [Green Version]
  5. Deacon, D.; Elias, L.R.; Madey, J.-M.J.; Ramian, G.J.; Schwettman, H.A.; Smith, T.I. First operation of a free-electron laser. Phys. Rev. Lett. 1977, 38, 892. [Google Scholar] [CrossRef]
  6. Shintake, T.; Tanaka, H.; Hara, T.; Tanaka, T.; Togawa, K.; Yabashi, M.; Otake, Y.; Asano, Y.; Bizen, T.; Fukui, T.; et al. A compact free-electron laser for generating coherent radiation in the extreme ultraviolet region. Nat. Photonics 2008, 2, 555–559. [Google Scholar] [CrossRef]
  7. Ishikawa, T.; Aoyagi, H.; Asaka, T.; Asano, Y.; Azumi, N.; Bizen, T.; Ego, H.; Fukami, K.; Fukui, T.; Furukawa, Y.; et al. A compact X-ray free-electron laser emitting in the sub-angstrom region. Nat. Photonics 2012, 6, 540–544. [Google Scholar] [CrossRef]
  8. Perucchi, A.; Mitri, S.D.; Penco, G.; Allaria, E.; Lupi, S. The TeraFERMI terahertz source at the seeded FERMI free-electron-laser facility. Rev. Sci. Instrum. 2013, 84, 022702. [Google Scholar] [CrossRef]
  9. Chiadroni, E.; Bacci, A.; Bellaveglia, M.; Boscolo, M.; Castellano, M.; Cultrera, L.; Di Pirro, G.; Ferrario, M.; Ficcadenti, L.; Filippetto, D.; et al. The SPARC linear accelerator based terahertz source. Appl. Phys. Lett. 2013, 102, 094101. [Google Scholar] [CrossRef] [Green Version]
  10. Buakor, K.; Chaisueb, N.; Rimjaem, S.; Saisut, J.; Thongbai, C.; Damminsek, K.; Thongpakdi, W. Development of linac-based MIR/THz FEL facility and photocathode RF-gun in Thailand. Proc. IPAC2017 2017, WEPAB083, 2763–2766. [Google Scholar]
  11. Miginsky, S.; Jang, K.H.; Gudkov, B.; Bae, S.; Jeong, Y.U.; Mun, J.; Lee, K.; Park, S.H.; Setiniyaz, S. A compact THz FEL at KAERI: The Project and the Status. Proc. FEL2017 2017, MOP048, 156–157. [Google Scholar]
  12. Li, H.-T.; Jia, Q.-K.; Zhang, S.-C.; Wang, L.; Yang, Y.-L. Design of FELiChEM: The first infrared free-electron laser user facility in China. Chinese Phys. C 2017, 41, 018102. [Google Scholar] [CrossRef] [Green Version]
  13. Okuda, S.; Honda, Y.; Kimura, N.; Ohkuma, J.; Yamamoto, T.; Suemine, S.; Okada, T.; Ishida, S.; Takeda, S.; Tsumori, K.; et al. Free-electron laser oscillation with a multibunch electron beam of the 38 MeV L-band linear accelerator at ISIR. Nucl. Instrum. Meth. A 1995, 358, 244–247. [Google Scholar] [CrossRef]
  14. Kato, R.; Kondo, S.; Igo, T.; Okita, T.; Konishi, T.; Suemine, S.; Okuda, S.; Isoyama, G. Lasing at 150 μm wavelength and measurement of the characteristics of the free-electron laser at ISIR Osaka University. Nucl. Instrum. Meth. A 2000, 445, 169–172. [Google Scholar] [CrossRef]
  15. Kashiwagi, S.; Kato, R.; Mihara, A.; Noda, T.; Isoyama, G.; Tsuchiya, K.; Shioya, T.; Yamamoto, S. Rigorous evaluation of the edge-focusing wiggler based on the magnetic field measurement. Phys. Rev. Spec. Top. Accel. Beams 2009, 12, 120703. [Google Scholar] [CrossRef] [Green Version]
  16. Kawase, K.; Kato, R.; Irizawa, A.; Fujimoto, M.; Kashiwagi, S.; Yamamoto, S.; Kamitsukasa, F.; Osumi, H.; Yaguchi, M.; Tokuchi, A.; et al. The high-power operation of a terahertz free-electron laser based on a normal conducting RF linac using beam conditioning. Nucl. Instrum. Meth. A 2013, 726, 96–103. [Google Scholar] [CrossRef]
  17. Suemine, S.; Kawase, K.; Sugimoto, N.; Kashiwagi, S.; Furukawa, K.; Kato, R.; Irizawa, A.; Fujimoto, M.; Ohsumi, H.; Yaguchi, M.; et al. Grid pulser for an electron gun with a thermionic cathode for the high-power operation of a terahertz free-electron laser. Nucl. Instrum. Meth. A 2015, 773, 97–103. [Google Scholar] [CrossRef]
  18. Tokuchi, A.; Kamitsukasa, F.; Furukawa, K.; Kawase, K.; Kato, R.; Irizawa, A.; Fujimoto, M.; Osumi, H.; Funakoshi, S.; Tsutsumi, R.; et al. Development of a high-power solid-state switch using static induction thyristors for a klystron modulator. Nucl. Instrum. Meth. A 2015, 769, 72–78. [Google Scholar] [CrossRef]
  19. Pham, H.H.N.; Hisatake, S.; Minin, O.V.; Nagatsuma, T.; Minin, I.V. Enhancement of spatial resolution of terahertz imaging systems based on terajet generation by dielectric cube. Appl. Phys. Lett. 2017, 2, 056106. [Google Scholar]
  20. Guerboukha, H.; Nallappan, K.; Skorobogatiy, M. Toward real-time terahertz imaging. Adv. Opt. Photon. 2018, 10, 843–938. [Google Scholar] [CrossRef]
  21. Smolyanskaya, O.A.; Chernomyrdin, N.V.; Konovko, A.A.; Zaytsev, K.I.; Ozheredov, I.A.; Cherkasova, O.P.; Nazarov, M.M.; Guillet, J.-P.; Kozlov, S.A.; Kistenev, Y.V.; et al. Terahertz biophotonics as a tool for studies of dielectric and spectral properties of biological tissues and liquids. Prog. Quantum Electron. 2018, 62, 1–77. [Google Scholar] [CrossRef]
  22. Chernomyrdin, N.V.; Kucheryavenko, A.S.; Kolontaeva, G.S.; Katyba, G.M.; Dolganova, I.N.; Karalkin, P.A.; Ponomarev, D.S.; Kurlov, V.N.; Reshetov, I.V.; Skorobogatiy, M.; et al. Reflection-mode continuous-wave 0.15λ-resolution terahertz solid immersion microscopy of soft biological tissues. Appl. Phys. Lett. 2018, 113, 111102. [Google Scholar] [CrossRef]
  23. Dolganova, I.N.; Zaytsev, K.I.; Yurchenko, S.O.; Karasik, V.E.; Tuchin, V.V. The Role of Scattering in Quasi-Ordered Structures for Terahertz Imaging: Local Order Can Increase an Image Quality. IEEE Trans. Terahertz Sci. Technol. 2018, 8, 403–409. [Google Scholar] [CrossRef]
  24. Zaytsev, K.I.; Dolganova, I.N.; Chernomyrdin, N.V.; Katyba, G.M.; Gavdush, A.A.; Cherkasova, O.P.; Komandin, G.A.; Shchedrina, M.A.; Khodan, A.N.; Ponomarev, D.S.; et al. The progress and perspectives of terahertz technology for diagnosis of neoplasms: A review. J. Opt. 2020, 22, 013001. [Google Scholar] [CrossRef]
  25. Angeluts, A.A.; Balakin, A.V.; Evdokimov, M.G.; Esaulkov, M.N.; Nazarov, M.M.; Ozheredov, I.A.; Sapozhnikov, D.A.; Solyankin, P.M.; Cherkasova, O.P.; Shkurinov, A.P. Characteristic responses of biological and nanoscale systems in the terahertz frequency range. Quantum Electron. 2014, 44, 614. [Google Scholar] [CrossRef]
  26. Murate, K.; Kawase, K. Perspective: Terahertz wave parametric generator and its applications. J. Appl. Phys. 2018, 124, 160901. [Google Scholar] [CrossRef]
  27. Kimura, S.; Nakamura, E.; Yamazaki, J.; Katoh, M.; Nishi, T.; Okamura, H.; Matsunami, M.; Chen, L.; Nanba, T. New infrared and terahertz beam Line BL6B at UVSOR. AIP Conf. Proc. 2004, CP705, 416–419. [Google Scholar]
  28. Irizawa, A.; Suga, S.; Isoyama, G.; Shimai, K.; Sato, K.; Iizuka, K.; Nanba, T.; Higashiya, A.; Niitaka, S.; Takagi, H. Direct observation of a pressure-induced metal-insulator transition in LiV2O4 by optical studies. Phys. Rev. B 2011, 84, 235116. [Google Scholar] [CrossRef]
  29. Marcelli, A.; Cinque, G. Infrared synchrotron radiation beamlines: High brilliance tools for IR spectromicroscopy. A practical guide to the characteristics of the broadband and brilliant non-thermal sources. In Biomedical Applications of Synchrotron Infrared Microspectroscopy; Moss, D., Ed.; Royal Society of Chemistry: London, UK, 2011; Chapter 3; pp. 67–104. [Google Scholar]
  30. Oda, N.; Sudou, T.; Ishi, T.; Okubo, S.; Isoyama, G.; Irizawa, A.; Kawase, K.; Kato, R. Externally triggered imaging technique for microbolometer-type terahertz imager. In Proc. SPIE 9856, Terahertz Physics, Devices, and Systems X: Advanced Applications in Industry and Defense; SPIE: Bellingham, WA, USA, 2016; p. 98560I. [Google Scholar]
  31. Kashiwagi, S.; Isoyama, G.; Kato, R.; Suemine, S. Development of a precise timing system for the ISIR L-band linac at Osaka University. Proc. FEL 2007 2007, WEPPH030, 413–416. [Google Scholar]
  32. Terahertz Inspection of Agricultural Products. Available online: https://terasense.com/applications/terahertz-agriculture/ (accessed on 24 April 2020).
  33. Kawase, K.; Nagai, M.; Furukawa, K.; Fujimoto, M.; Kato, R.; Honda, Y.; Isoyama, G. Extremely high-intensity operation of a THz free-electron laser using an electron beam with a higher bunch charge. Nucl. Instrum. Meth. A 2020, 960, 163582. [Google Scholar] [CrossRef]
Figure 1. Time structure of the pulsed Institute of Scientific and Industrial Research (ISIR) terahertz-free-electron-laser (THz-FEL). The pulse structure is approximately 4 μs in the macro-pulse and approximately 20 ps in the micro-pulse, respectively.
Condensedmatter 05 00038 g001
Figure 2. FEL spectra for different undulator gap values and modes. (a) Spectrum at variable gaps in the range of 30–37 mm at 108 MHz (monochromatic condition); (b) Spectrum at variable gaps in the range of 32–37 mm at 27 MHz (monochromatic condition).
Condensedmatter 05 00038 g002
Figure 3. Schematic layout of the monochromator, the focusing optics, and the sample stage system installed downstream the FEL. The blue layout is for transmission imaging, while the red layout refers to reflection imaging.
Condensedmatter 05 00038 g003
Figure 4. The beam profiles of the ISIR FEL (a) taken with a THz camera for the parallel beam (left) and at the focal point (right), and (b) the spatial resolution measured with the knife-edge scan around the focal point.
Condensedmatter 05 00038 g004
Figure 5. (a) Comparison of transmittance spectra of polytetrafluoroethylene (PTFE) and polypropylene (PP) by in situ observation; (b) 2D images of PTFE and PP pellets collected in transmission at λTHz = 50 μm.
Condensedmatter 05 00038 g005
Figure 6. (a) Comparison of transmittance spectra of Cu2O and CuO by in situ observation; (b) 2D images of Cu2O and CuO pellets collected in transmission at several THz wavelengths.
Condensedmatter 05 00038 g006
Figure 7. Comparison of 2D images of (a) a marker; (b) a mahjong tile; (c) a peanut (two nuts in a shell); (d) water collected in transmission at λTHz approximately 90 μm.
Condensedmatter 05 00038 g007
Figure 8. (a) shows a comparison of 2D images of a fresh leaf collected in transmission at different THz wavelengths. (b). Comparison of 2D images of a dried leaf collected in transmission at different THz wavelengths and different FEL powers.
Condensedmatter 05 00038 g008

