Article

Cross-Correlation of THz Pulses from the Electron Storage Ring BESSY II

1
Helmholtz-Zentrum Berlin für Materialien und Energie GmbH, Albert-Einstein-Strasse 15, 12489 Berlin, Germany
2
Department of Physics and Photon Science, Gwangju Institute of Science and Technology, Gwangju 61005, Korea
3
Deutsches Elektronen-Synchrotron DESY, Notkestrasse 85, 22607 Hamburg, Germany
4
Department of Physics, Sapienza University of Rome, Piazzale Aldo Moro 2, 00185 Roma, Italy
*
Author to whom correspondence should be addressed.
Condens. Matter 2020, 5(2), 24; https://doi.org/10.3390/condmat5020024
Submission received: 17 February 2020 / Revised: 24 March 2020 / Accepted: 25 March 2020 / Published: 27 March 2020

Abstract

:
Coherent synchrotron radiation from an electron storage ring is observed in the THz spectral range when the bunch length is shortened down to the sub-mm-range. With increasing stored current, the bunch becomes longitudinally unstable and modulates the THz emission in the time domain. These micro-instabilities are investigated at the electron storage ring BESSY II by means of cross-correlation of the THz fields from successive bunches. The investigations allow deriving the longitudinal length scale of the micro bunch fluctuations and show that it grows faster than the current-dependent bunch length. Our findings will help to set the limits for the possible time resolution for pump-probe experiments achieved with coherent THz synchrotron radiation from a storage ring.

1. Introduction

Coherent synchrotron radiation (CSR) emission from a relativistic electron bunch in a storage ring is a natural process of collective in-phase emission of all electrons and occurs for wavelengths λ longer than the electron bunch length [1]. The total power P(λ) emitted by N electrons can be calculated from the power p(λ) emitted by one electron [2]:
P ( λ ) = [ N + N ( N 1 ) f ( λ ) ] p ( λ ) ,
where f(λ) is the form factor given by the square of the Fourier transform of the normalized longitudinal electron distribution n(z) of the bunch:
f ( λ ) = | e 2 π i z λ n ( z ) d z | 2 .
Since the propagation of long wavelengths radiation is suppressed by the wave-guiding properties of the finite dimensions of the metallic walls of the vacuum chambers [3], bunch lengths have to be shortened below the cut-off wavelength in order to become detectable at the end of a beamline. This becomes valid for most of the electron storage rings for sub-mm bunches in the THz spectral range.
The longitudinal bunch length of the electrons in a storage ring can be controlled by the momentum compaction factor α—the ratio between the deviation of an electron from the reference orbit and its momentum deviation—and the temporal gradient of the rf (radiofrequency) cavity voltage. Short bunch lengths emitting coherently in the THz spectral range are obtained by reducing the momentum compaction factor from the value normally applied by tuning the storage ring optics [4] into the so-called “low α” mode. Such shorter bunches cause a coherent enhancement for a given number of electrons in the bunch which can be expressed by the amplification factor AF, the ratio between the coherent and incoherent emission spectrum, e.g., of the spectrum from the short electron bunch and from the bunch of nominal length. The longitudinal electron distribution in a storage ring in equilibrium can be treated as Gaussian for low bunch charges. For a Gaussian electron distribution, the coherent enhancement factor becomes Gaussian itself with the mean σz as the rms (root mean square) bunch length [2] having a maximum of N for infinite wavelength for a large ensemble of electrons:
A F ( λ ) = N   e ( 4 π σ z λ ) 2 .
Typically, 107–109 electrons per bunch are stored. According to Equation (1) the total power emitted from the bunch would then be proportional to the square of these values yielding an increase of seven to nine orders of magnitude compared to the incoherent bunch emission. Such an enormous power increase influences the electron bunch and produces bunch instabilities. The own CSR field of the bunch and its space charges on the conductive chamber walls affect the bunch shape in such a way that the bunch becomes longer and distorted from the Gaussian form. These longitudinal distortions contain higher Fourier frequency components responsible for a broader CSR power spectrum. Numerical calculations show a steepening of the leading edge of the bunch due to its own CSR wake field [5]. Further, the electron distribution becomes unstable above a certain stored charge threshold and initial small density perturbations can then cause micro-bunching due to the intense wake field finally emitting stochastically THz bursts [6,7]. All these longitudinal density fluctuations in a scale shorter than the nominal bunch length are associated with a coherent increase of emitted THz power at higher photon energies than expected for the nominal Gaussian bunch shape.
More than fifteen years have passed since it was proven that CSR is a suitable source for diffraction-limited Fourier transform spectroscopy [8] and the first successful scientific experiment using THz radiation from short electron bunches was performed [9]. The low α technology is now becoming available at several storage rings worldwide (e.g., [10,11,12,13,14,15]) and this powerful broadband source allows for many scientific experiments [16] including THz- electron paramagnetic resonance (EPR) [17] and high-resolution spectroscopy with THz frequency combs [18]. Currently, storage rings offer to users the low α mode at reduced currents stored. However, strong longitudinal bunch focusing by superconducting rf cavities in a storage ring will extent the bursting threshold to higher currents and shortens CSR pulses to a couple of THz [19] making this short-bunch scheme not only more attractive to far infrared/THz but also for time-resolved X-ray experiments [20].
Even though a significant progress has been achieved over the last years of offering short-bunch operation, a consistent picture of bunch deformation and bunch instabilities in low α operational mode of an electron storage ring is still under discussion. Especially, the transition from stable CSR emission via quasi harmonic micro-bunching to the chaotic bursting is very different among the various storage ring facilities and call for sophisticated diagnostics. The electron bunch spatio-temporal dynamics have been studied by the experimentally obtained spectral content of THz pulses in comparison with numerical simulations [21,22,23]. A straightforward approach to study the emitted CSR pulses is not available due to the lack of suitable THz recording electronics, but the quasi-direct observation of sub-picosecond microstructures within an electron bunch became recently possible by a time-stretching scheme [24,25,26].
This paper reports on cross-correlation measurements from subsequent bunches emitting THz pulses at the storage ring BESSY II. By applying a simple model for the projection of the longitudinal phase space quantitative information on the dynamics of bunch instabilities, which are derived and compared to experimental findings.

2. Experimental Section

The measurements presented were conducted at the IRIS beamline [27] at the electron storage ring BESSY II during several dedicated low α shifts. The beamline accepts THz and infrared dipole radiation 60 mrad horizontally and 40 mrad vertically from the storage ring. The fundamental rf of BESSY II is 500 MHz with a harmonic number of 400 in a circumference of 240 m. Thus, the revolution frequency is 1.25 MHz with a minimum bunch spacing of 2 ns. A train of 350 consecutive bunches build up the fill pattern. For our investigation, the storage ring operated with a low-α-optics and a synchrotron frequency of fs = 1.75 kHz providing an rms bunch length of 1 mm in the limit of zero current [28]. The same synchrotron frequency is applied for normal low α operation. This operational mode is offered to the storage ring users for pump-probe and THz spectroscopic experiments two times a year.
The IRIS beamline is equipped with a commercial Fourier transform (FT) vacuum spectrometer which operates down to 2 cm−1 and which utilizes several bolometers as detectors suitable for diverse applications. The spectra shown in this study were obtained by a 1.6 K Si composite bolometer. The bolometer has a response time of about 2 ms and a high-frequency cut-off at about 2 THz.
A free optical port of the beamline, only separated from the vacuum of the beamline to the ambient by a Picarin™ window, delivers a quasi-collimated beam. This beam feeds a home-built Martin–Puplett type interferometer (MPI) [29]. The MPI allows for the measurement of the auto and cross-correlation function of the CRS. While for the auto-correlation mode of the MPI the two mirror arms are set to equal lengths for the cross-correlation mode one mirror arm length is extended by 0.3 m in order to set the delay to the temporal distance between two bunches of 2 ns.
The correlation function measured was a mean correlation over the integration time of the detection and which was much longer than the revolution time of the storage ring. In the case of the auto-correlation the mean of all individual bunch correlations was measured. The cross-correlation yields the mean correlation of the fields from all pairs of successive bunches. In this context, it should be mentioned that the inverse Fourier transformation of the auto-correlation function results in the spectrum of the CRS emission.
In this study, we performed cross-correlation measurements for bunch charges between 5 and 50 pC with the MPI schematically shown in Figure 1. A mechanical chopper (65 Hz) modulated the THz radiation. The aforementioned 1.6 K Si composite bolometer was used as a detector and a lock-in amplifier recovered the modulated THz signal. A room-temperature band-pass filter was placed in front of the bolometer to produce a transform-limited Gaussian pulse. The filter was chosen so that the center frequency is in the range of maximum of the recorded CSR spectrum.
For time-domain analyses the power of the CSR and incoherent infrared synchrotron radiation were recorded by directly focusing the collimated beam from the optical port into an appropriate detector. A magnetically enhanced 4.2 K InSb hot-electron bolometer was used for the THz range. The detector has a response time of 2 µs (-3 dB) and is sensitive between 0.06 and 1.5 THz. In addition, a mercury-cadmium-telluride (MCT) detector was employed. The MCT detector has a response time of 5 µs and is sensitive down to 650 cm−1 (about 20 THz) and therefore only recording the incoherent spectral part of the synchrotron radiation. A fast Fourier transform (FFT) spectrum analyzer provided the time-domain power spectra of the signal from both detectors.

3. Results and Discussion

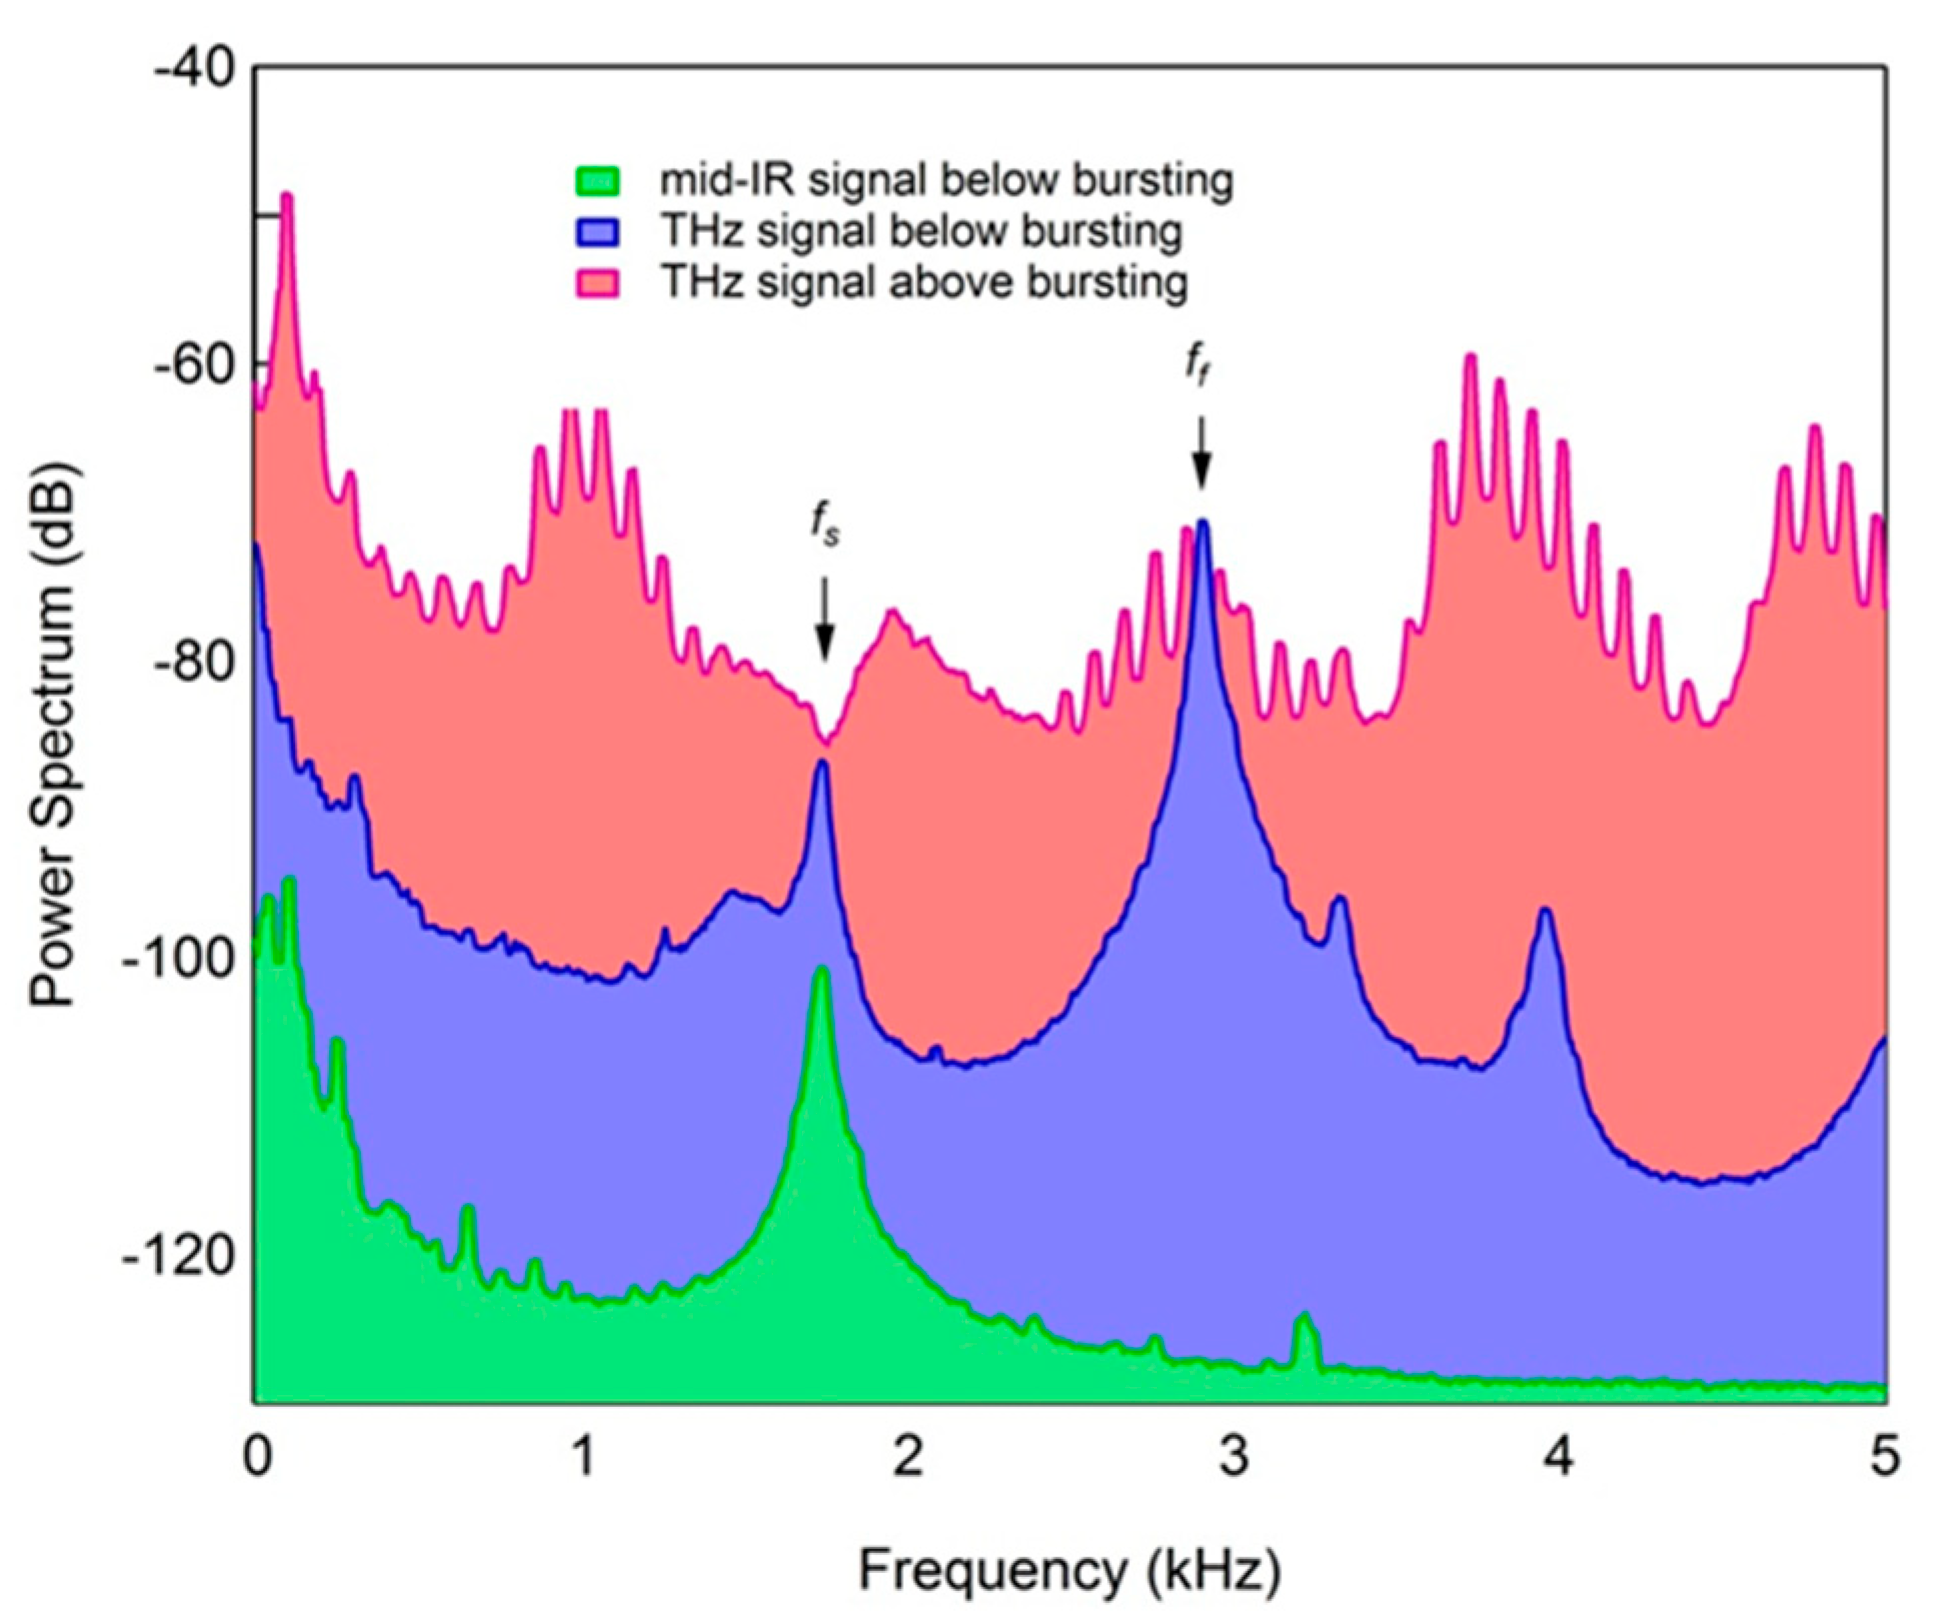
3.1. Coherent Synchrotron Emission

Figure 2 shows the coherent enhancement above the bursting threshold for a 46 pC bunch (3 × 10⁸ electrons) and a synchrotron frequency of fs = 1.75 kHz measured with the vacuum FT spectrometer. Assuming a Gaussian bunch form, the experimental data fit neither the number of electrons nor the nominal rms bunch length of 1 mm. A pure Gaussian electron distribution with the above parameters would produce a spectral power. Below 60 GHz the finite dimensions of the dipole chamber of a free height of 35 mm at BESSY II almost shield the radiation. Additional diffraction losses from the beamline limit a realistic detection of the CSR even below 0.1 THz. Figure 2 cartoons this spectral region as well. If one uses the Equations (1) and (2) with the nominal rms bunch length to describe the CSR process, bunch shapes different from Gaussian have to be assumed (e.g., saw tooth shape). Such bunch shapes would contain higher frequency components explaining the broad experimentally observed amplification factor. However, the measured coherent enhancement fits perfectly a Gaussian over four orders of magnitudes indicating that the CSR is emitted from a longitudinal micro bunch structure with an rms micro bunch length of 0.17 mm. Moreover, only less than 0.1‰ of the electrons from the nominal bunch charge are involved in the detected coherent process.
Below a charge threshold of about 30 pC, the bunch distortion is stable in time and so the CSR power does. Above this threshold, the bunch distortion becomes longitudinally unstable and modulates the THz emission in the time-domain. Figure 3 shows the power spectrum of the temporal behavior of the CSR for two different bunch charges, below and above the threshold. The synchrotron frequency fs is clearly seen in the power spectra for the coherent and incoherent part of the synchrotron radiation. For the coherent radiation below the bursting threshold, a longitudinal instability develops in a very regular repetition of a fundamental frequency ff at about 3.75 kHz. This frequency is about twice the synchrotron frequency fs. As it is also observed at other storage ring facilities [24,30], the fundamental frequency of instability shifts to higher frequencies and gains in strength with increasing bunch charge and even mix with different other modes. A higher bunch charge produces saw-tooth type instability and the duration of a saw-tooth determines the side-band structure. A further increase of bunch charge leads to a turbulent longitudinal bunch distortion causing CSR bursts emitting randomly shown in Figure 3 for the CSR power spectrum for a bunch charge of 46 pC. A more detailed picture of the temporal structure of CSR bursts at BESSY II is published elsewhere [31,32].
The existence of two thresholds in the electron bunch spatio-temporal dynamics while increasing the total charge of the bunch has been pointed out in [21]. The first threshold found indicates the presence of micro-structures drifting in the bunch profile and is signaled by the appearance of a resonance in the power spectral density at high frequencies (above 30 kHz) which is outside the range of our measurement. The second threshold indicates that the micro-structures are strong enough to persist after about half a revolution period of the electron bunch in the longitudinal phase space. It is linked with the appearance of another resonance in the power spectral density at about twice the fs, in perfect agreement with our observation. An analytical link between the structure of the longitudinal phase space of the electrons and the frequencies seen in the power spectrum of the CSR emission during instabilities is derived in [33].

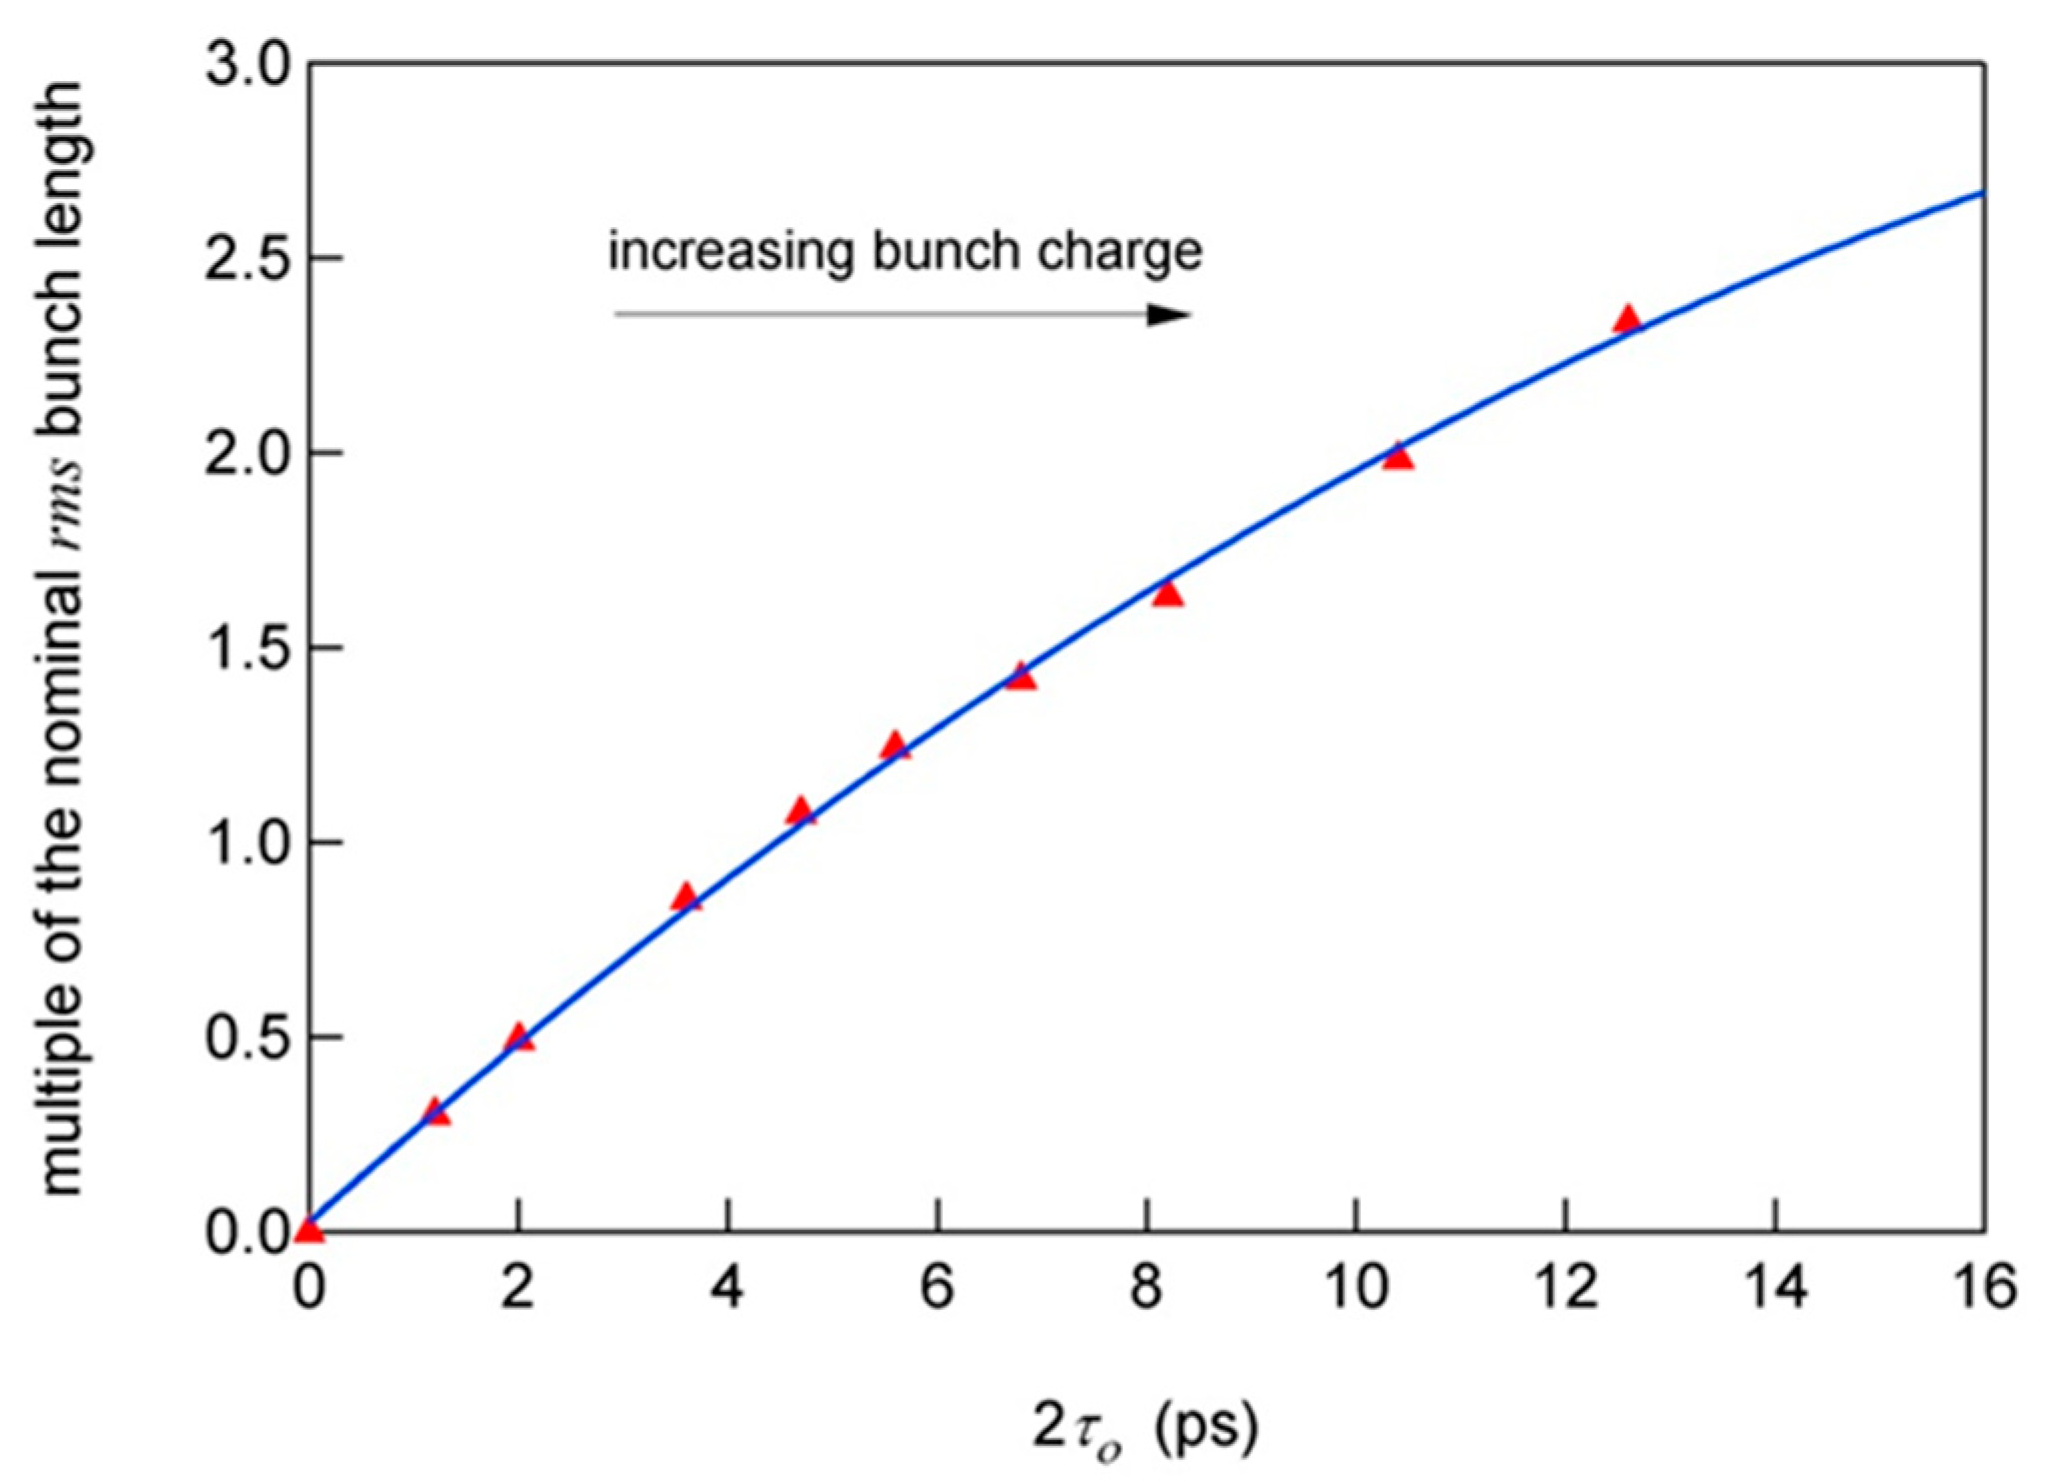
3.2. Cross-Correlation of Subsequent Bunches

Next, we like to draw a simple picture of the mechanism of the longitudinal instability by assuming a longitudinal oscillation with frequency ff of the emitting micro bunch. Despite this scheme is extremely simple, it reproduces well the mechanism described in [21], where the longitudinal phase space of the electron bunch, after the first threshold, presents some sub-structures that evolve in time with a rotating movement due to the synchrotron rotation. Those sub-structures translate into a micro-bunching in the associated bunch profile. Each micro-bunch oscillates harmonically in a region whose length depends on how long the sub-structure persists in the bunch.
In contrast to established temporal approaches we follow a statistical approach to describe the bunch dynamics. Our simple model assumes that the micro bunch has an oscillating phase against the nominal bunch position and tries to describe the amplitude of this phase oscillation in respect to the bunch charge.
The oscillating phase shift τ (t) of the individual micro bunch in time units can be expressed by
τ ( t ) = τ o ( q ) cos ( 2 π   f f   t ) ,  
with τo as the maximum oscillation phase which is a function of the bunch charge q. With the assumption that the instability is a single bunch effect each micro bunch behaves independently and experiences all possible phase shifts over the integration time of the detector. Therefore, a measured cross-correlation of CSR pulses from pairs of successive micro-bunches can mathematically be treated as the auto-correlation of the mean from all CSR pulses. The mean electrical field of the pulse is given by the convolution integral of the single CSR pulse shape with the probability P(τ, dτ) = p(τ) dτ that the individual pulse shift can be found in the interval [τ, τ + dτ]:
E ( t ) ¯ = E ( t ) P ( τ ( t ) , d τ ) = E ( ξ ) P ( τ ( t ξ ) , d τ )     d ξ .
In analogy to the harmonic oscillator model (e.g., [34]) we assume that the probability density function p(τ) is proportional to the time dt in which the CSR pulse phase changes by and can be written in its normalized form to:
p ( τ ) = 1 π   τ o 1 1 ( τ τ o ) 2 , τ o τ τ o .  
In Figure 4 the probability density function multiplied by the maximum of the oscillating phase is presented. It is obvious, that the turning points at ±τo yield the highest probability for the phase shift. The inset of this figure shows a cartoon of the longitudinal projection of the resulting mean pulse trace under investigation. As stated above the theoretical cross-correlation of the successive CSR pulses can be obtained by the correlation of the mean CSR pulse from Equation (5):
E ( t ) ¯ E ( t ) ¯ = E ( ξ ) ¯ E ( t + ξ ) ¯ d ξ
The experimental cross-correlation was measured utilizing the Martin–Puplett interferometer as shown in Figure 1 with a nominal optical pass difference between the two interferometer arms equal to the distance between subsequent bunches in the bunch trail. For experimental and mathematical simplicity, we restrict our consideration not to the entire CSR spectrum of the micro bunch but to a limited bandwidth achieved by passing the radiation through a band-pass filter.
Figure 5 shows the power spectrum of the electrical field of the new created CSR pulse when passing the filter and which is according to the Wiener–Khinchin theorem [35] the squared Fourier transform of the measured field auto-correlation. A Gaussian fit to the spectrum yields an rms spectral width of 8.5 GHz (0.29 cm−1) and a center frequency of 0.22 THz (7.4 cm−1). These values are then used to construct an analytical transform-limited Gaussian pulse E(t) by using the time-bandwidth product [36]. Figure 5 also shows this pulse with a rms temporal width for the Gaussian envelope of 9.4 ps.
The amplitude of the cross-correlation as the function of the time delay between the two spectrometer arms is exemplarily shown in Figure 5. For the calculation τo was set to zero and the result compares well with the measured cross-correlation for a pulse emitted from a bunch below the bursting threshold. Note that the experimentally obtained cross-correlation function is superimposed by a constant dc voltage signal. This dc component corresponds to the mean of the power of the two pulses (e.g., [37]) and therefore is used for power normalization of the experimental cross-correlation function.
From both the theoretical and measured cross-correlation functions, shown in Figure 6, a contrast calculates as the difference between the maximum and the minimum of the modulation amplitudes. This contrast, shown in Figure 7, is independent of the bunch charge in the stable mode below 28.6 pC (vertical dashed line in Figure 7) where no oscillating instabilities appear. Above that charge, instabilities start to appear in the nominal bunch and the contrast drops rapidly to zero and develops with further increasing charge into an expiring oscillation. The oscillation period in the contrast function relates to the center frequency and the shape of the band path filter applied. In order to fit the theoretical contrast given as a function of the phase shift amplitude to the ring current (and accordingly to bunch charge units), distinctive data points were chosen from the theoretical and measured contrast to scale the abscissa. The inset of Figure 7 shows the polynomial fit function to this scaling procedure.
The theoretical contrast as a function of ring current describes remarkably well the measured data as shown in Figure 7. This holds, even the experimental data were obtained at several temporal experiment shifts over one year of observation at the storage ring and proofs the stability and reproducibility of the BESSY II ring and the low α set up offered to THz users. Note, that for a given center frequency of the band-pass filter the relation between the contrast of the cross-correlation function and the phase shift of the pulse is completely determined and the only assumption made is that the micro pulse is oscillating in longitudinal direction. With the scaling relation shown in Figure 7 one has a ruler in hands to measure the longitudinal phase shift amplitude of the micro-bunch directly from the ring current stored. It is obvious that the model discussed above is not only valid for one oscillating micro bunch but also applies to higher instability modes where more than one micro bunch is involved. The projection of higher azimuthal modes, for example quadrupole or sextupole modes, are very similar to two or three harmonically oscillating micro-bunches also described by Equation (6).
In [28] an empirical relation is given to describe the measured rms length of the nominal bunch at BESSY II for low α operation and different synchrotron frequencies as a function of the bunch charge. Here, the nominal lengths were measured by means of a streak camera for bunches longer than 1.5 ps. As an example, this empirical relation results an rms length of about 3.9 ps for a bunch of 28.6 pC and a synchrotron frequency of 1.75 kHz just when the oscillating instability becomes observable by our measurements. As introduced before, ο describes a longitudinal region in the nominal bunch profile of the oscillating instability whose length depends on how long the sub-structure persists in the bunch.
Figure 8 shows this characteristic length for given bunch charges in units of the rms length of the nominal bunch taken from [28]. The characteristic micro bunch length increases stronger than the nominal bunch length. It reaches about the 2.5-fold of the nominal rms length for the limit of the highest bunch charge analyzed by the cross-correlation method proposed. Further higher bunch charges define the limit of our model when the bunch instabilities become chaotic and a cross-correlation signal is not anymore detectable.

4. Summary

A simple model is given which provides a tool for studying longitudinal bunch instabilities observed in the coherent emission from short electron bunches. The model is based on the cross-correlation of successive transform-limited Gaussian THz pulse. Such pulses are produced by passing the CSR through a narrow band-pass filter. The model describes the oscillating CSR instability in the THz spectral range by means of oscillating micro bunches and it is justified by the theory described in [21]. These micro bunches are built up by a very small fraction of electrons from the nominal bunch.
The cross-correlation of the THz fields from two successive bunches allows the evaluation of the oscillation phase of the micro bunches in respect to the nominal bunch position. As the result, the measured oscillation phase increases faster than the nominal bunch length with increasing bunch charge in the bunch charge region investigated. These investigations provide not only a picture on the longitudinal phase space but might also be of interest to define the limits of time resolution for pump-probe experiments with THz coherent synchrotron radiation at a storage ring.

Author Contributions

Conceptualization, U.S. and P.K.; Formal analysis, U.S., J.L., B.M. and M.O.; Writing—original draft, U.S.; Writing—review & editing, P.K., J.L., B.M. and M.O. All authors have read and agreed to the published version of the manuscript.

Funding

This research received no external funding.

Acknowledgments

We like to thank G. Wüstefeld, K. Holldack and R. Mitzner for fruitful discussion and acknowledge the support of A. Höhl and T. Neitzke.

Conflicts of Interest

The authors declare no conflict of interest.

References and Note

  1. Carr, G.L.; Martin, M.C.; McKinney, W.R.; Jordan, K.; Neil, G.R.; Williams, G.P. High-Power Terahertz Radiation from Relativistic Electrons. Nature 2002, 420, 153–156. [Google Scholar] [CrossRef] [PubMed]
  2. Williams, G.P.; Hirschmugl, C.J.; Kneedler, E.M.; Takacs, P.Z.; Shleifer, M.; Chabal, Y.J.; Hoffmann, F.M. Coherence Effects in Long-Wavelength Infrared Synchrotron Radiation Emission. Phys. Rev. Lett. 1989, 62, 261–263. [Google Scholar] [CrossRef] [PubMed]
  3. Nodvick, J.S.; Saxon, D.S. Suppression of Coherent Radiation by Electrons in a Synchrotron. Phys. Rev. 1954, 96, 180–184. [Google Scholar] [CrossRef]
  4. Abo-Bakr, M.; Feikes, J.; Holldack, K.; Wüstefeld, G.; Hübers, H.-W. Steady-State Far-Infrared Coherent Synchrotron Radiation Detected at BESSY II. Phys. Rev. Lett. 2002, 88, 254801. [Google Scholar] [CrossRef] [PubMed]
  5. Sannibale, F.; Byrd, J.M.; Loftsdóttir, Á.; Venturini, M.; Abo-Bakr, M.; Feikes, J.; Holldack, K.; Kuske, P.; Wüstefeld, G.; Hübers, H.-W.; et al. A Model Describing Stable Coherent Synchrotron Radiation in Storage Rings. Phys. Rev. Lett. 2004, 93, 094801. [Google Scholar] [CrossRef] [PubMed] [Green Version]
  6. Heifets, S.; Stupakov, G.; Krinsky, S. Coherent Synchrotron Radiation Instability in a Bunch Compressor. Phys. Rev. Spec. Top. Accel. Beams 2002, 5, 064401. [Google Scholar] [CrossRef] [Green Version]
  7. Venturini, M.; Warnock, R. Bursts of Coherent Synchrotron Radiation in Electron Storage Rings: A Dynamical Model. Phys. Rev. Lett. 2002, 89, 224802. [Google Scholar] [CrossRef] [Green Version]
  8. Abo-Bakr, M.; Feikes, J.; Holldack, K.; Kuske, P.; Peatman, W.; Schade, U.; Wüstefeld, G.; Hübers, H.-W. Brilliant, Coherent Far-Infrared (THz) Synchrotron Radiation. Phys. Rev. Lett. 2003, 90. [Google Scholar] [CrossRef]
  9. Singley, E.; Abo-Bakr, M.; Basov, D.; Feikes, J.; Guptasarma, P.; Holldack, K.; Hübers, H.; Kuske, P.; Martin, M.; Peatman, W.; et al. Measuring the Josephson Plasma Resonance in Bi2Sr2CaCu2O8 Using Intense Coherent THz Synchrotron Radiation. Phys. Rev. B 2004, 69, 092512. [Google Scholar] [CrossRef]
  10. Müller, A.-S.; Birkel, I.; Gasharova, B.; Huttel, E.; Kubat, R.; Mathis, Y.-L.; Moss, D.A.; Mexner, W.; Rossmanith, R.; Wuensch, M.; et al. Far Infrared Coherent Synchrotron Edge Radiation at ANKA. In Proceedings of the 2005 Particle Accelerator Conference, Knoxville, TN, USA, 16–20 May 2005; pp. 2518–2520. [Google Scholar]
  11. Barros, J.; Manceron, L.; Brubach, J.B.; Creff, G.; Evain, C.; Couprie, M.E.; Loulergue, A.; Nadolski, L.; Tordeux, M.A.; Roy, P. Toward Highly Stable Terahertz Coherent Synchrotron Radiation at the Synchrotron SOLEIL. J. Phys. Conf. Ser. 2012, 359, 4–8. [Google Scholar] [CrossRef] [Green Version]
  12. Hashimoto, S.; Shoji, Y.; Ando, A.; Takahashi, T. Observation of Coherent Synchrotron Radiation at NewSUBARU. In Proceedings of the 2005 Particle Accelerator Conference, Knoxville, TN, USA, 16–20 May 2005; pp. 4188–4190. [Google Scholar]
  13. Mochihashi, A.; Hosaka, M.; Katoh, M.; Shimada, M.; Kimura, S. UVSOR-II Electron Storage Ring. In Proceedings of the 2006 European Particle Accelerator Conference, Edinburgh, UK, 26–30 Jun 2006; pp. 3380–3382. [Google Scholar]
  14. Martin, I.P.S.; Rehm, G.; Thomas, C.; Bartolini, R. Experience with Low-Alpha Lattices at the Diamond Light Source. Phys. Rev. Spec. Top. Accel. Beams 2011, 040705, 1–11. [Google Scholar] [CrossRef] [Green Version]
  15. Feikes, J.; von Hartrott, M.; Ries, M.; Schmid, P.; Wüstefeld, G.; Hoehl, A.; Klein, R.; Müller, R.; Ulm, G. Metrology Light Source: The First Electron Storage Ring Optimized for Generating Coherent THz Radiation. Phys. Rev. Spec. Top. Accel. Beams 2011, 14, 030705. [Google Scholar] [CrossRef]
  16. Schade, U.; Ortolani, M.; Lee, J. THz Experiments with Coherent Synchrotron Radiation from BESSY II. Synchrotron Radiat. News 2007, 20, 17–24. [Google Scholar] [CrossRef]
  17. Schnegg, A.; Behrends, J.; Lips, K.; Bittl, R.; Holldack, K. Frequency Domain Fourier Transform THz-EPR on Single Molecule Magnets Using Coherent Synchrotron Radiation. Phys. Chem. Chem. Phys. 2009, 11, 6820. [Google Scholar] [CrossRef] [PubMed]
  18. Tammaro, S.; Pirali, O.; Roy, P.; Lampin, J.F.; Ducournau, G.; Cuisset, A.; Hindle, F.; Mouret, G. High Density Terahertz Frequency Comb Produced by Coherent Synchrotron Radiation. Nat. Commun. 2015, 6, 1–6. [Google Scholar] [CrossRef] [PubMed] [Green Version]
  19. Wüstefeld, G.; Jankowiak, A.; Knobloch, J.; Ries, M. Simultaneous Long and Short Electron Bunches in the BESSY II Storage Ring. In Proceedings of the 2011 International Particle Accelerator Conference, San Sebastian, Spain, 4–9 September 2011; pp. 2936–2938. [Google Scholar]
  20. Jankowiak, A.; Wüstefeld, G. Low-α Operation of BESSY II and Future Plans for an Alternating Bunch Length Scheme BESSY VSR. Synchrotron Radiat. News 2013, 26, 22–24. [Google Scholar] [CrossRef]
  21. Evain, C.; Barros, J.; Loulergue, A.; Tordeux, M.A.; Nagaoka, R.; Labat, M.; Cassinari, L.; Creff, G.; Manceron, L.; Brubach, J.B.; et al. Spatio-Temporal Dynamics of Relativistic Electron Bunches during the Micro-Bunching Instability in Storage Rings. Europhys. Lett. 2012, 98, 40006. [Google Scholar] [CrossRef]
  22. Roussel, E.; Evain, C.; Le Parquier, M.; Szwaj, C.; Bielawski, S.; Manceron, L.; Brubach, J.-B.; Tordeux, M.-A.; Ricaud, J.-P.; Cassinari, L.; et al. Observing Microscopic Structures of a Relativistic Object Using a Time-Stretch Strategy. Sci. Rep. 2015, 5, 10330. [Google Scholar] [CrossRef]
  23. Evain, C.; Roussel, E.; Le Parquier, M.; Szwaj, C.; Tordeux, M.A.; Brubach, J.B.; Manceron, L.; Roy, P.; Bielawski, S. Direct Observation of Spatiotemporal Dynamics of Short Electron Bunches in Storage Rings. Phys. Rev. Lett. 2017, 118, 1–6. [Google Scholar] [CrossRef] [Green Version]
  24. Steinmann, J.L.; Boltz, T.; Brosi, M.; Bründermann, E.; Caselle, M.; Kehrer, B.; Rota, L.; Schönfeldt, P.; Schuh, M.; Siegel, M.; et al. Continuous Bunch-by-Bunch Spectroscopic Investigation of the Micro-bunching Instability. Phys. Rev. Accel. Beams 2018, 21, 110705. [Google Scholar] [CrossRef] [Green Version]
  25. Brosi, M.; Steinmann, J.L.; Blomley, E.; Boltz, T.; Bründermann, E.; Gethmann, J.; Kehrer, B.; Mathis, Y.L.; Papash, A.; Schedler, M.; et al. Systematic Studies of the Microbunching Instability at Very Low Bunch Charges. Phys. Rev. Accel. Beams 2019, 22, 20701. [Google Scholar] [CrossRef] [Green Version]
  26. Bielawski, S.; Blomley, E.; Brosi, M.; Bründermann, E.; Burkard, E.; Evain, C.; Funkner, S.; Hiller, N.; Nasse, M.J.; Niehues, G.; et al. From Self-Organization in Relativistic Electron Bunches to Coherent Synchrotron Light: Observation Using a Photonic Time-Stretch Digitizer. Sci. Rep. 2019, 9, 1–9. [Google Scholar] [CrossRef] [PubMed]
  27. Peatman, W.B.; Schade, U. A Brilliant Infrared Light Source at BESSY. Rev. Sci. Instrum. 2001, 72, 1620–1624. [Google Scholar] [CrossRef]
  28. Feikes, J.; Holldack, K.; Kuske, P.; Wüstefeld, G. Sub-Picosecond Electron Bunches in the BESSY Storage Ring. In Proceedings of the 2004 European Particle Accelerator Conference, Lucerne, Switzerland, 5–9 July 2004; pp. 1954–1956. [Google Scholar]
  29. Martin, D.H.; Puplett, E. Polarised Interferometric Spectrometry for the Millimetre and Submillimetre Spectrum. Infrared Phys. 1969, 10, 105–109. [Google Scholar] [CrossRef]
  30. Billinghurst, B.E.; Bergstrom, J.C.; Baribeau, C.; Batten, T.; May, T.E.; Vogt, J.M.; Wurtz, W.A. Longitudinal Bunch Dynamics Study with Coherent Synchrotron Radiation. Phys. Rev. Accel. Beams 2016, 19, 1–11. [Google Scholar] [CrossRef] [Green Version]
  31. Wüstefeld, G. Short Bunches in Electron Storage Rings and Coherent Synchrotron Radiation. In Proceedings of the 2008 European Particle Accelerator Conference, Genoa, Italy, 23–27 June 2008; pp. 26–30. [Google Scholar]
  32. Kuske, P. Investigation of the Temporal Structure of CSR-Bursts at BESSY II. In Proceedings of the 2009 Particle Accelerator Conference, Vancouver, BC, Canada, 4–8 May 2009; pp. 4682–4684. [Google Scholar]
  33. Roussel, E.; Evain, C.; Szwaj, C.; Bielawski, S. Microbunching Instability in Storage Rings: Link between Phase-Space Structure and Terahertz Coherent Synchrotron Radiation Radio-Frequency Spectra. Phys. Rev. Spec. Top. Accel. Beams 2014, 17, 1–6. [Google Scholar] [CrossRef]
  34. Blochinzew, D.I. Grundlagen der Quantenmechanik; Deutscher Verlag der Wissenschaften: Berlin, Germany, 1953; p. 147. [Google Scholar]
  35. Cohen, L. The Generalization of the Wiener-Khinchin Theorem. In Proceedings of the 1998 IEEE International Conference on Acoustics, Speech and Signal Processing, Seattle, WA, USA, 12–15 May 1998; Volume 3, pp. 1577–1580. [Google Scholar]
  36. The time–bandwidth product of a Fourier-transform limited Gaussian-shaped pulse is about 0.08 when the rms criterion is used for the temporal and spectral width
  37. Griffiths, P.R.; de Haseth, J.A. Fourier Transform Infrared Spectroscopy; John Wiley & Sons, Ltd.: New York, NY, USA, 1986; p. 3. [Google Scholar]
Figure 1. Optical scheme of the Martin–Puplett type interferometer (MPI) for cross-correlation measurement of subsequent bunches. The collimated coherent synchrotron radiation (CSR) comes from the exit port of the beamline and is modulated by a chopper before entering the MPI. The radiation is split into the two arms by the beamsplitter and is reflected back from the rooftop mirrors via the beamsplitter to the exit of the interferometer. Both beams pass a band-pass filter before being focused and recombined at the Si-detector.
Condensedmatter 05 00024 g001
Figure 2. Measured amplification factor for the nominal BESSY low α operation at 1.75 kHz synchrotron frequency (red curve) and the corresponding Gaussian fit (dashed green curve). The dotted blue curve shows the expected amplification factor assuming a Gaussian bunch of 46 pC (3 × 10⁸ electrons) with nominal rms bunch length of 1 mm. The yellow-shaded region below 5 cm-1 indicates the cut-off for CSR propagation.
Condensedmatter 05 00024 g002
Figure 3. Power spectrum for the time-domain of the integral emitted power for a bunch charge of 26 pC below the bursting threshold (green and blue curve) and for 46 pC well above the bursting threshold (red curve). The green curve was taken with a mercury-cadmium-telluride (MCT) detector only recording the incoherent synchrotron radiation while the blue and red curve were obtained from an InSb-bolometer with an entrance filter only passing through radiation below 100 1.5 THz.
Condensedmatter 05 00024 g003
Figure 4. Probability density function for the normalized phase shift τ/το. Dashed lines indicate the turning points of the sinusoidal oscillation. The inset shows schematically the longitudinal projection of the trail of mean bunches in the storage ring with a nominal bunch separation of 2 ns. 2το translates into a characteristic length where the micro-bunch is found in the longitudinal phase space over time.
Condensedmatter 05 00024 g004
Figure 5. (a) measured transmittance of the band-pass filter (blue) and the corresponding Gaussian fit (red) with a center at 7.4 cm−1 and an rms spectral width of 0.29 cm−1. (b) temporal structure of a constructed Fourier-transform limited pulse when passed through the band-pass filter with the fitted characteristics shown in (a).
Condensedmatter 05 00024 g005
Figure 6. Comparison between the measured cross-correlation (lower red curve) of a CSR pulse from a bunch of 20 pC (below bursting threshold) and the calculated cross-correlation (blue curve above, normalized and dc component removed) using the transform-limited pulse in Figure 5. While the overall envelope of the measured cross-correlation agrees very well with the calculated one additional side wings appear caused by the asymmetric filter edges.
Condensedmatter 05 00024 g006
Figure 7. Theoretical (red curve) and measured contrast (different markers and colors represent the different experimental runs) of the cross-correlation as a function of the ring current stored. The abscissa for the theoretical contrast is scaled according to the fit for the phase shift amplitude shown in the inset (blue curve).
Condensedmatter 05 00024 g007
Figure 8. The characteristic length of the oscillating micro bunch for the corresponding bunch charges (red marks) given in rms units of the current-dependent nominal bunch length. The blue curve is a fit to guide the eyes.
Condensedmatter 05 00024 g008

