Boron Concentration Induced Co-Ta-B Composite Formation Observed in the Transition from Metallic to Covalent Glasses

 , , , , ,
Abstract

1. Introduction
2. Methods
2.1. Theoretical Methods
2.2. Experimental Methods
3. Results and Discussion
3.1. Glass Transition
3.2. Topology
3.3. Electronic Structure
3.4. Magnetization
4. Conclusions
Supplementary Materials
Author Contributions
Funding
Acknowledgments
Conflicts of Interest
References
- Ashby, M.; Greer, A.L. Metallic glasses as structural materials. Scripta Mater. 2006, 54, 321–326. [Google Scholar] [CrossRef]
- Telford, M. The case for bulk metallic glass. Mater. Today 2004, 7, 36–43. [Google Scholar] [CrossRef]
- Inoue, A.; Shen, B.; Takeuchi, A. Developments and Applications of Bulk Glassy Alloys in Late Transition Metal Base System. Mater. Trans. 2006, 47, 1275–1285. [Google Scholar] [CrossRef]
- Gilman, J.J. Metallic glasses. Science 1980, 208, 856–861. [Google Scholar] [CrossRef]
- Schuh, C.A.; Hufnagel, T.C.; Ramamurty, U. Mechanical behavior of amorphous alloys. Acta Mater. 2007, 55, 4067–4109. [Google Scholar] [CrossRef]
- Greer, A.L. Metallic glasses… on the threshold. Mater. Today 2009, 12, 14–22. [Google Scholar] [CrossRef]
- Shen, T.D.; Schwarz, R.B. Bulk ferromagnetic glasses prepared by flux melting and water quenching. Appl. Phys. Lett. 1999, 75, 49–51. [Google Scholar] [CrossRef]
- Wu, Y.; Hui, X.D.; Lu, Z.P.; Liu, Z.Y.; Liang, L.; Chen, G.L. Effects of metalloid elements on the glass-forming ability of Fe-based alloys. J. Alloy. Compd. 2009, 467, 187–190. [Google Scholar] [CrossRef]
- Wang, J.; Li, R.; Hua, N.; Zhang, T. Co-based ternary bulk metallic glasses with ultrahigh strength and plasticity. J. Mater. Res. 2011, 26, 2072–2079. [Google Scholar] [CrossRef]
- Inoue, A.; Shen, B.L.; Koshiba, H.; Kato, H.; Yavari, A.R. Ultra-high strength above 5000 MPa and soft magnetic properties of Co-Fe-Ta-B bulk glassy alloys. Acta Mater. 2004, 52, 1631–1637. [Google Scholar] [CrossRef]
- Kontis, P.; Köhler, M.; Evertz, S.; Chen, Y.-T.; Schnabel, V.; Soler, R.; Bednarick, J.; Kirchlechner, C.; Dehm, G.; Raabe, D.; et al. Nano-laminated thin film metallic glass design for outstanding mechanical properties. Scripta Mater. 2018, 155, 73–77. [Google Scholar] [CrossRef]
- Schnabel, V.; Köhler, M.; Music, D.; Bednarcik, J.; Clegg, W.J.; Raabe, D.; Schneider, J.M. Ultra-stiff metallic glasses through bond energy density design. J. Phys. Condens. Mat. 2017, 29, 265502. [Google Scholar] [CrossRef]
- Music, D.; Hensling, F.; Pazur, T.; Bednarcik, J.; Hans, M.; Schnabel, V.; Hostert, C.; Schneider, J.M. Bonding and elastic properties of amorphous AlYB14. Solid State Commun. 2013, 169, 6–9. [Google Scholar] [CrossRef]
- Stock, M.; Molian, P. Femtosecond pulsed laser deposition of amorphous, ultrahard boride thin films. J. Vac. Sci. Technol. A 2004, 22, 670. [Google Scholar] [CrossRef]
- Tian, Y.; Bastawros, A.F.; Lo, C.C.H.; Constant, A.P.; Russell, A.M.; Cook, B.A. Superhard self-lubricating AlMgB14 films for microelectromechanical devices. Appl. Phys. Lett. 2003, 83, 2781–2783. [Google Scholar] [CrossRef]
- Gupta, S.; Patel, N.; Miotello, A.; Kothari, D.C. Cobalt-Boride: An efficient and robust electrocatalyst for Hydrogen Evolution Reaction. J. Power Sources 2015, 279, 620–625. [Google Scholar] [CrossRef]
- Hohenberg, P.; Kohn, W. Inhomogeneous Electron Gas. Phys. Rev. 1964, 136, B864–B871. [Google Scholar] [CrossRef]
- Hostert, C.; Music, D.; Bednarcik, J.; Keckes, J.; Kapaklis, V.; Hjorvarsson, B.; Schneider, J.M. Ab initio molecular dynamics model for density, elastic properties and short range order of Co-Fe-Ta-B metallic glass thin films. J. Phys. Condens. Mat. 2011, 23, 475401. [Google Scholar] [CrossRef][Green Version]
- Ozaki, T.; Kino, H. Numerical atomic basis orbitals from H to Kr. Phys. Rev. B 2004, 69, 195113. [Google Scholar] [CrossRef]
- Ozaki, T.; Kino, H. Efficient projector expansion for the ab initio LCAO method. Phys. Rev. B 2005, 72, 45121. [Google Scholar] [CrossRef]
- Perdew, J.P.; Burke, K.; Ernzerhof, M. Generalized Gradient Approximation Made Simple. Phys. Rev. Lett. 1996, 77, 3865–3868. [Google Scholar] [CrossRef]
- Kresse, G.; Furthmüller, J. Efficient iterative schemes for ab initio total-energy calculations using a plane-wave basis set. Phys. Rev. B 1996, 54, 11169–11186. [Google Scholar] [CrossRef]
- Kresse, G.; Joubert, D. From ultrasoft pseudopotentials to the projector augmented-wave method. Phys. Rev. B 1999, 59, 1758–1775. [Google Scholar] [CrossRef]
- Blöchl, P.E. Projector augmented-wave method. Phys. Rev. B 1994, 50, 17953–17979. [Google Scholar] [CrossRef]
- Monkhorst, H.J.; Pack, J.D. Special points for Brillouin-zone integrations. Phys. Rev. B 1976, 13, 5188–5192. [Google Scholar] [CrossRef]
- Hoffmann, R. How Chemistry and Physics Meet in the Solid State. Angew. Chem. Int. Ed. Engl. 1987, 26, 846–878. [Google Scholar] [CrossRef]
- Dronskowski, R.; Bloechl, P.E. Crystal orbital Hamilton populations (COHP): Energy-resolved visualization of chemical bonding in solids based on density-functional calculations. J. Phys. Chem. 1993, 97, 8617–8624. [Google Scholar] [CrossRef]
- Deringer, V.L.; Tchougréeff, A.L.; Dronskowski, R. Crystal orbital Hamilton population (COHP) analysis as projected from plane-wave basis sets. J. Phys. Chem. A 2011, 115, 5461–5466. [Google Scholar] [CrossRef]
- Maintz, S.; Deringer, V.L.; Tchougréeff, A.L.; Dronskowski, R. Analytic projection from plane-wave and PAW wavefunctions and application to chemical-bonding analysis in solids. J. Comput. Chem. 2013, 34, 2557–2567. [Google Scholar] [CrossRef]
- Maintz, S.; Deringer, V.L.; Tchougréeff, A.L.; Dronskowski, R. LOBSTER: A tool to extract chemical bonding from plane-wave based DFT. J. Comput. Chem. 2016, 37, 1030–1035. [Google Scholar] [CrossRef]
- Schnabel, V.; Köhler, M.; Evertz, S.; Gamcova, J.; Bednarcik, J.; Music, D.; Raabe, D.; Schneider, J.M. Revealing the relationships between chemistry, topology and stiffness of ultrastrong Co-based metallic glass thin films: A combinatorial approach. Acta Mater. 2016, 107, 213–219. [Google Scholar] [CrossRef]
- Zhang, Y.; Whitlow, H.J.; Winzell, T.; Bubb, I.F.; Sajavaara, T.; Arstila, K.; Keinonen, J. Detection efficiency of time-of-flight energy elastic recoil detection analysis systems. Nucl. Instrum. Methods Phys. Res. Sect. B Beam Interact. Mater. Atoms 1999, 149, 477–489. [Google Scholar] [CrossRef]
- Ström, P.; Petersson, P.; Rubel, M.; Possnert, G. A combined segmented anode gas ionization chamber and time-of-flight detector for heavy ion elastic recoil detection analysis. Rev. Sci. Instrum. 2016, 87, 103303. [Google Scholar] [CrossRef]
- Janson, M.S. CONTES Instruction Manual; Uppsala University: Uppsala, Sweden, 2004. [Google Scholar]
- Dippel, A.-C.; Liermann, H.-P.; Delitz, J.T.; Walter, P.; Schulte-Schrepping, H.; Seeck, O.H.; Franz, H. Beamline P02.1 at PETRA III for high-resolution and high-energy powder diffraction. J. Synchrotron. Radiat. 2015, 22, 675–687. [Google Scholar] [CrossRef]
- Hammersley, A.P. FIT2D. An Introduction and Overview; ESRF Internal Report ESRF97HA02T; European Synchrotron Radiation Source: Grenoble, France, 1997. [Google Scholar]
- Hammersley, A.P.; Svensson, S.O.; Thompson, A. Calibration and correction of spatial distortions in 2D detector systems. Nucl. Instrum. Meth. A 1994, 346, 312–321. [Google Scholar] [CrossRef]
- Hammersley, A.P.; Svensson, S.O.; Hanfland, M.; Fitch, A.N.; Hausermann, D. Two-dimensional detector software: From real detector to idealised image or two-theta scan. High Press. Res. 1996, 14, 235–248. [Google Scholar] [CrossRef]
- Juhás, P.; Davis, T.; Farrow, C.L.; Billinge, S.J.L. PDFgetX3: A rapid and highly automatable program for processing powder diffraction data into total scattering pair distribution functions. J. Appl. Crystallogr. 2013, 46, 560–566. [Google Scholar] [CrossRef]
- Biesinger, M.C.; Payne, B.P.; Grosvenor, A.P.; Lau, L.W.M.; Gerson, A.R.; Smart, R.S.C. Resolving surface chemical states in XPS analysis of first row transition metals, oxides and hydroxides: Cr, Mn, Fe, Co and Ni. Appl. Surf. Sci. 2011, 257, 2717–2730. [Google Scholar] [CrossRef]
- Gupta, P.K.; Mauro, J.C. Composition dependence of glass transition temperature and fragility. I. A topological model incorporating temperature-dependent constraints. J. Chem. Phys. 2009, 130, 94503. [Google Scholar] [CrossRef]
- Henke, B.L.; Gullikson, E.M.; Davis, J.C. X-Ray Interactions: Photoabsorption, Scattering, Transmission, and Reflection at E = 50–30,000 eV, Z = 1–92. At. Data Nucl. Data Tables 1993, 54, 181–342. [Google Scholar] [CrossRef]
- Emin, D. Unusual properties of icosahedral boron-rich solids. J. Solid State Chem. 2006, 179, 2791–2798. [Google Scholar] [CrossRef]
- Bao, R.; Chrisey, D.B. Short range order structure of amorphous B4C boron carbide thin films. J. Mater. Sci. 2011, 46, 3952–3959. [Google Scholar] [CrossRef]
- Lannin, J.S. Rama scattering in amorphous boron. Solid State Commun. 1978, 25, 363–366. [Google Scholar] [CrossRef]
- Delaplane, R.G.; Dahlborg, U.; Howells, W.S.; Lundström, T. A neutron diffraction study of amorphous boron using a pulsed source. J. Non-Cryst. Solids 1988, 106, 66–69. [Google Scholar] [CrossRef]
- Nagel, S.R.; Tauc, J. Nearly-Free-Electron Approach to the Theory of Metallic Glass Alloys. Phys. Rev. Lett. 1975, 35, 380–383. [Google Scholar] [CrossRef]
- Kittel, C.; Hunklinger, S. Einführung in die Festkörperphysik, 15th ed.; unveränd. Aufl.; Oldenbourg: München, Germany, 2013; ISBN 978-3-486-59755-4. [Google Scholar]
- Higdon, C.; Cook, B.; Harringa, J.; Russell, A.; Goldsmith, J.; Qu, J.; Blau, P. Friction and wear mechanisms in AlMgB14-TiB2 nanocoatings. Wear 2011, 271, 2111–2115. [Google Scholar] [CrossRef]
- Mavel, G.; Escard, J.; Costa, P.; Castaing, J. ESCA surface study of metal borides. Surf. Sci. 1973, 35, 109–116. [Google Scholar] [CrossRef]
- Wang, Y.; Fan, J.; Trenary, M. Surface chemistry of boron oxidation. 1. Reactions of oxygen and water with boron films grown on tantalum(110). Chem. Mater. 1993, 5, 192–198. [Google Scholar] [CrossRef]
- Hasegawa, R.; Ray, R. Magnetization of glassy Co-B alloys. J. Appl. Phys. 1979, 50, 1586–1588. [Google Scholar] [CrossRef]


| Composition (at.%) | Tg in K |
|---|---|
| Co67Ta11B22 | 757 ± 1 |
| Co56Ta10B34 | 829 ± 1 |
| Co53Ta9B38 | 899 ± 2 |
| Co46Ta8B46 | 900 ± 5 |
| Co40Ta8B52 | 773 ± 1 |
| Co37Ta4B59 | 595 ± 1 |
| Co35Ta4B61 | 600 ± 1 |
| Co33Ta5B62 | 607 ± 1 |
| Co32Ta3B65 | - |
| Co18Ta4B78 | 573 ± 1 |
| Co12Ta3B85 | 575 ± 1 |
| Quantity | Onset B Network Evolution (at.% B) | Onset Percolating B-Network (at.% B) |
|---|---|---|
| Glass transition | 46 | 59 |
| Topology | 40 | 70 |
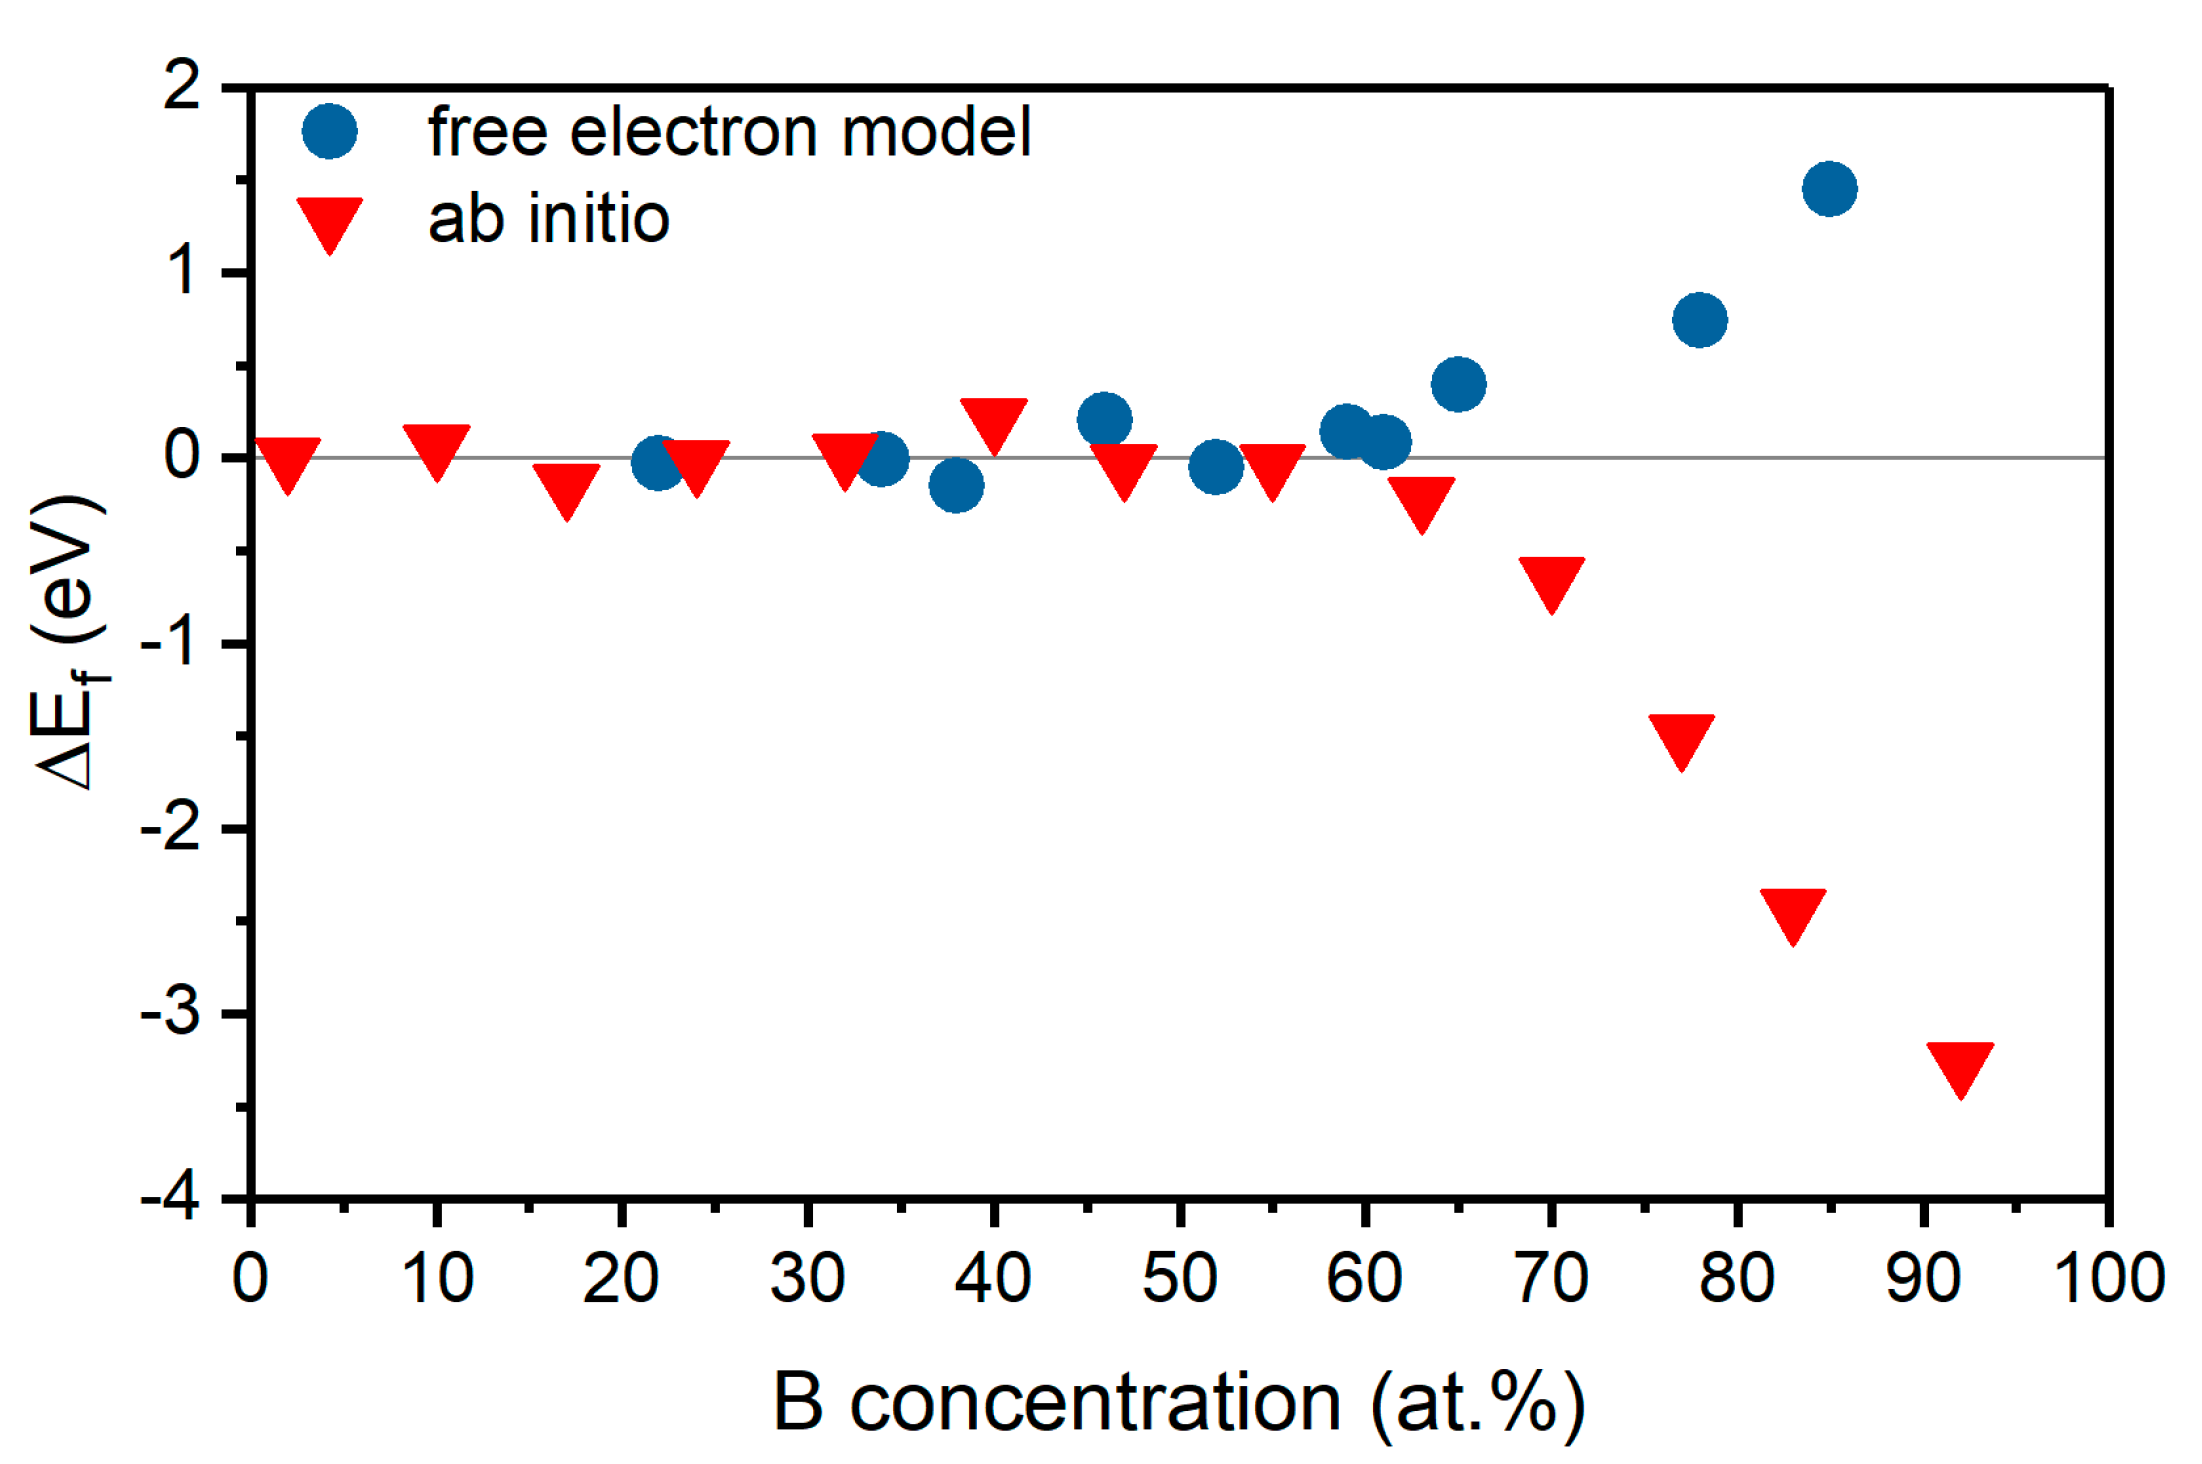
| Free-electron model | - | 70 |
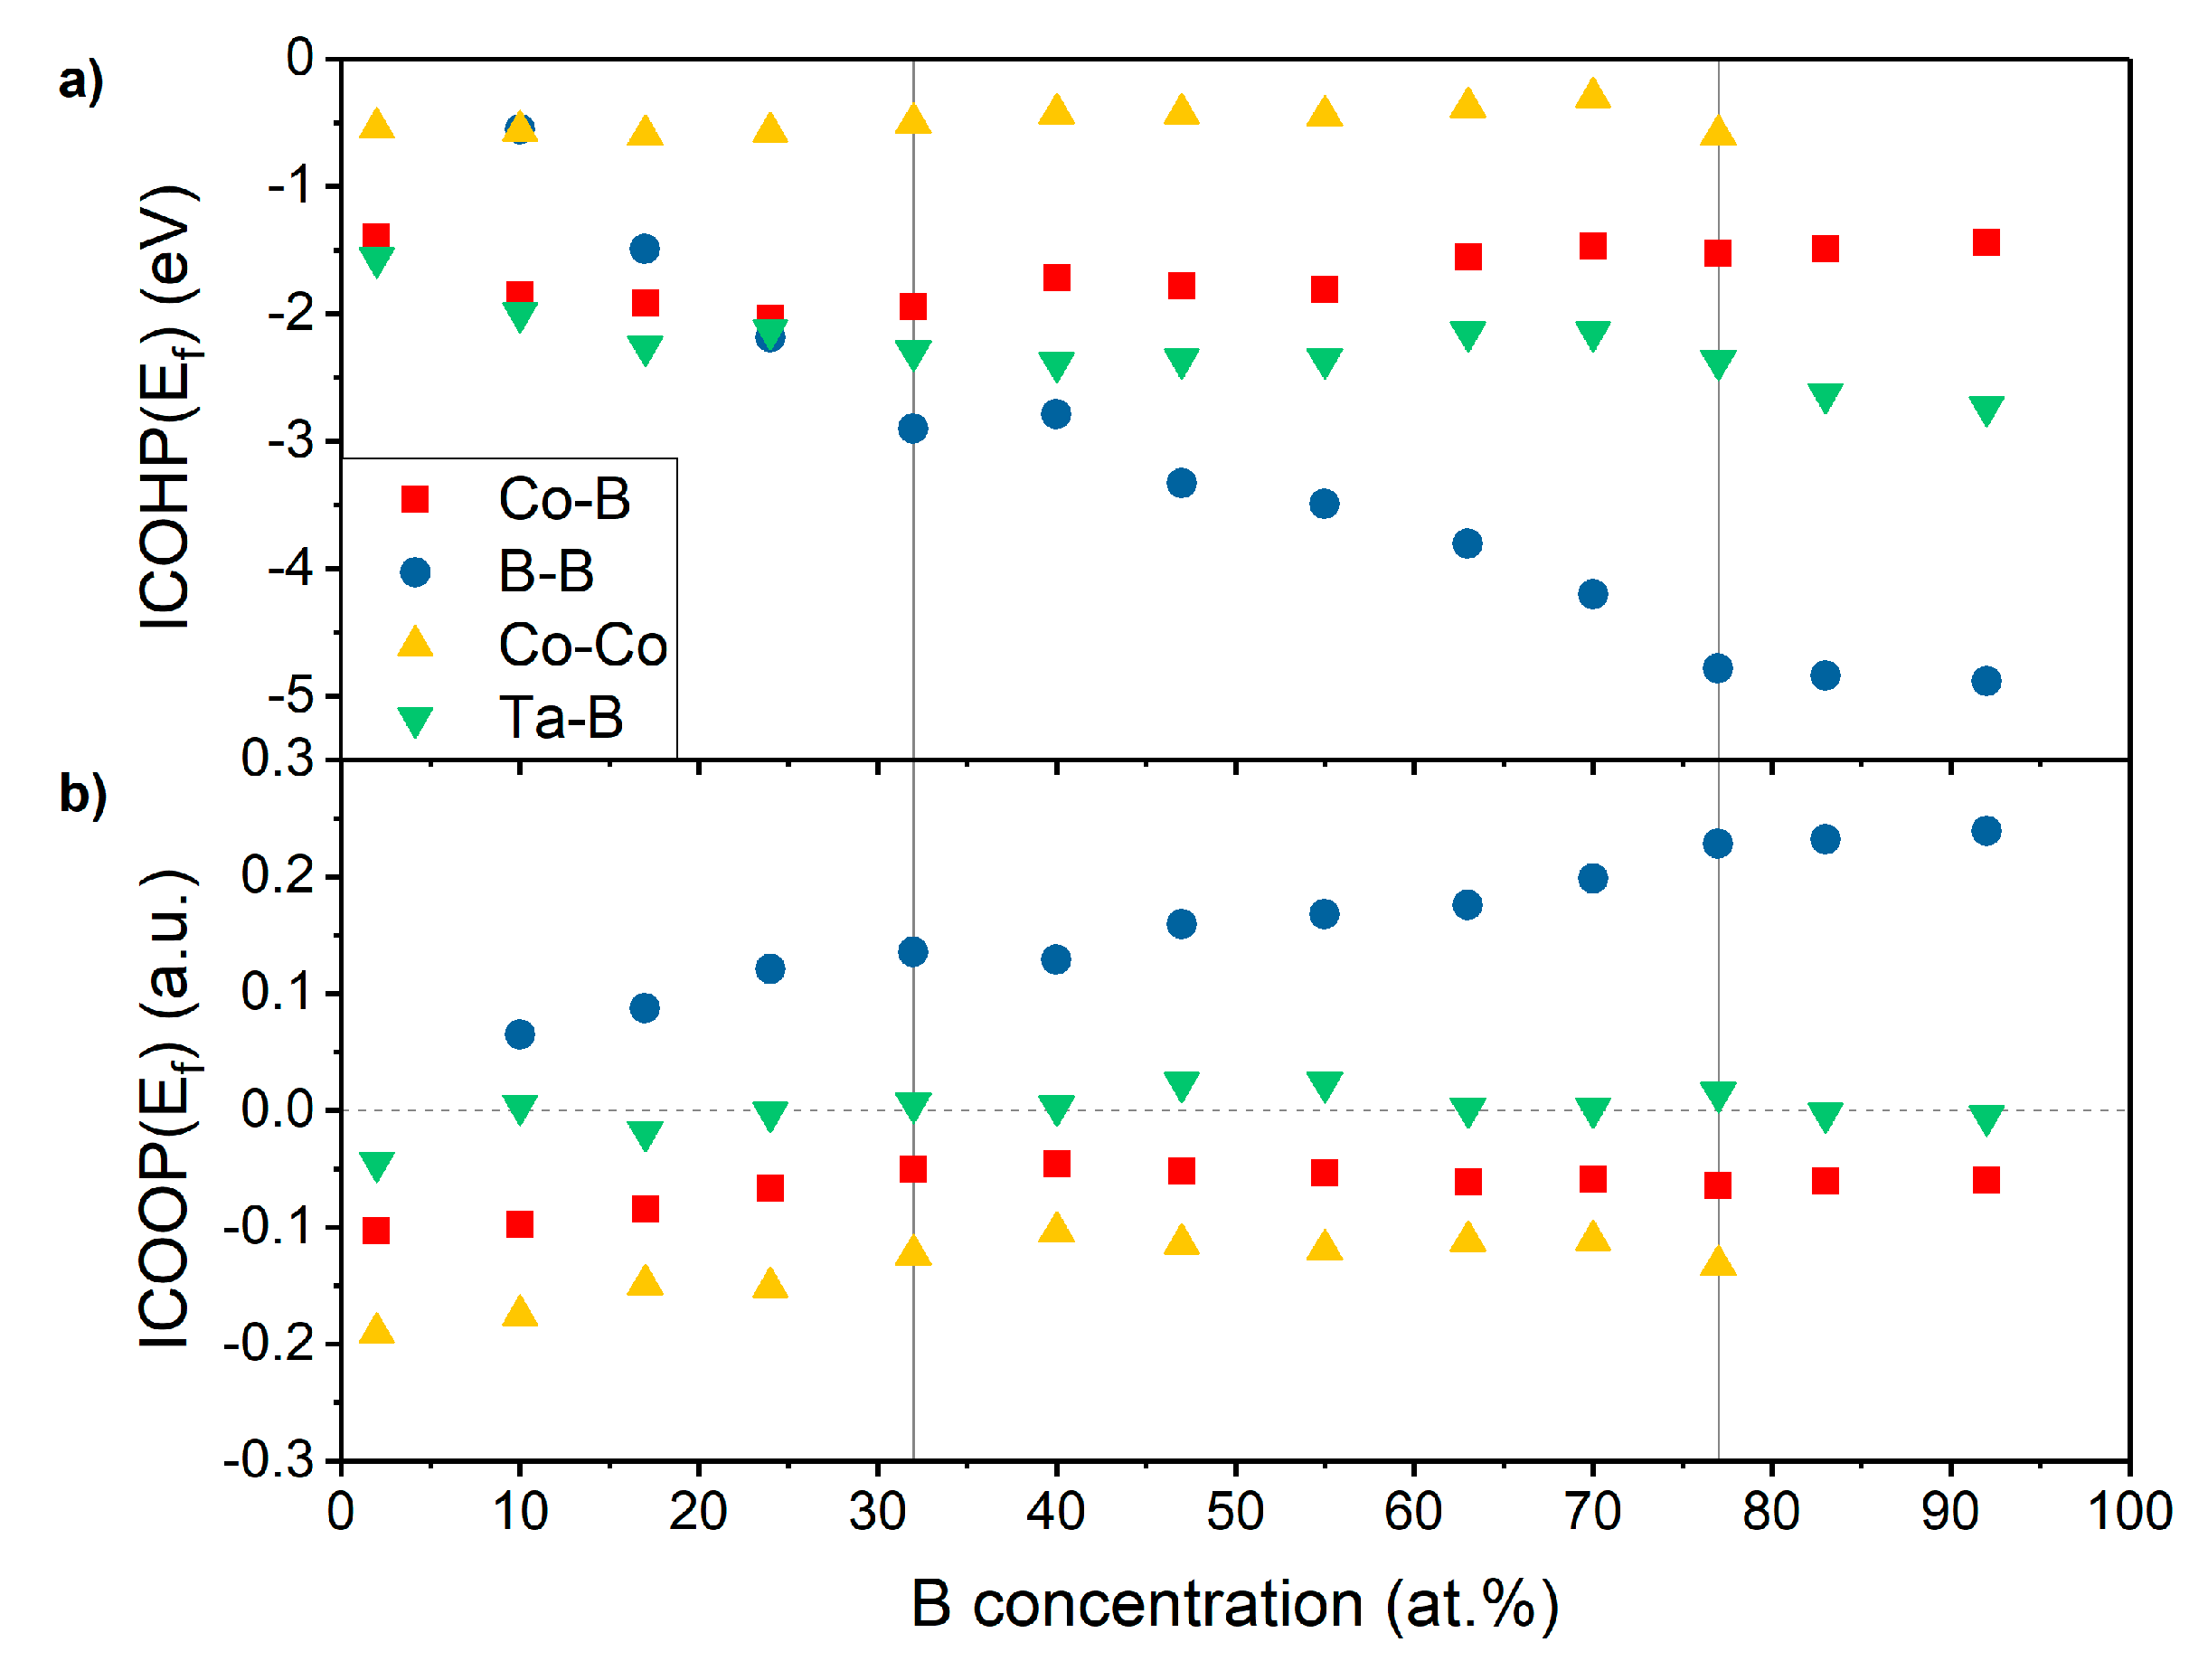
| Bonding | 32 | 77 |
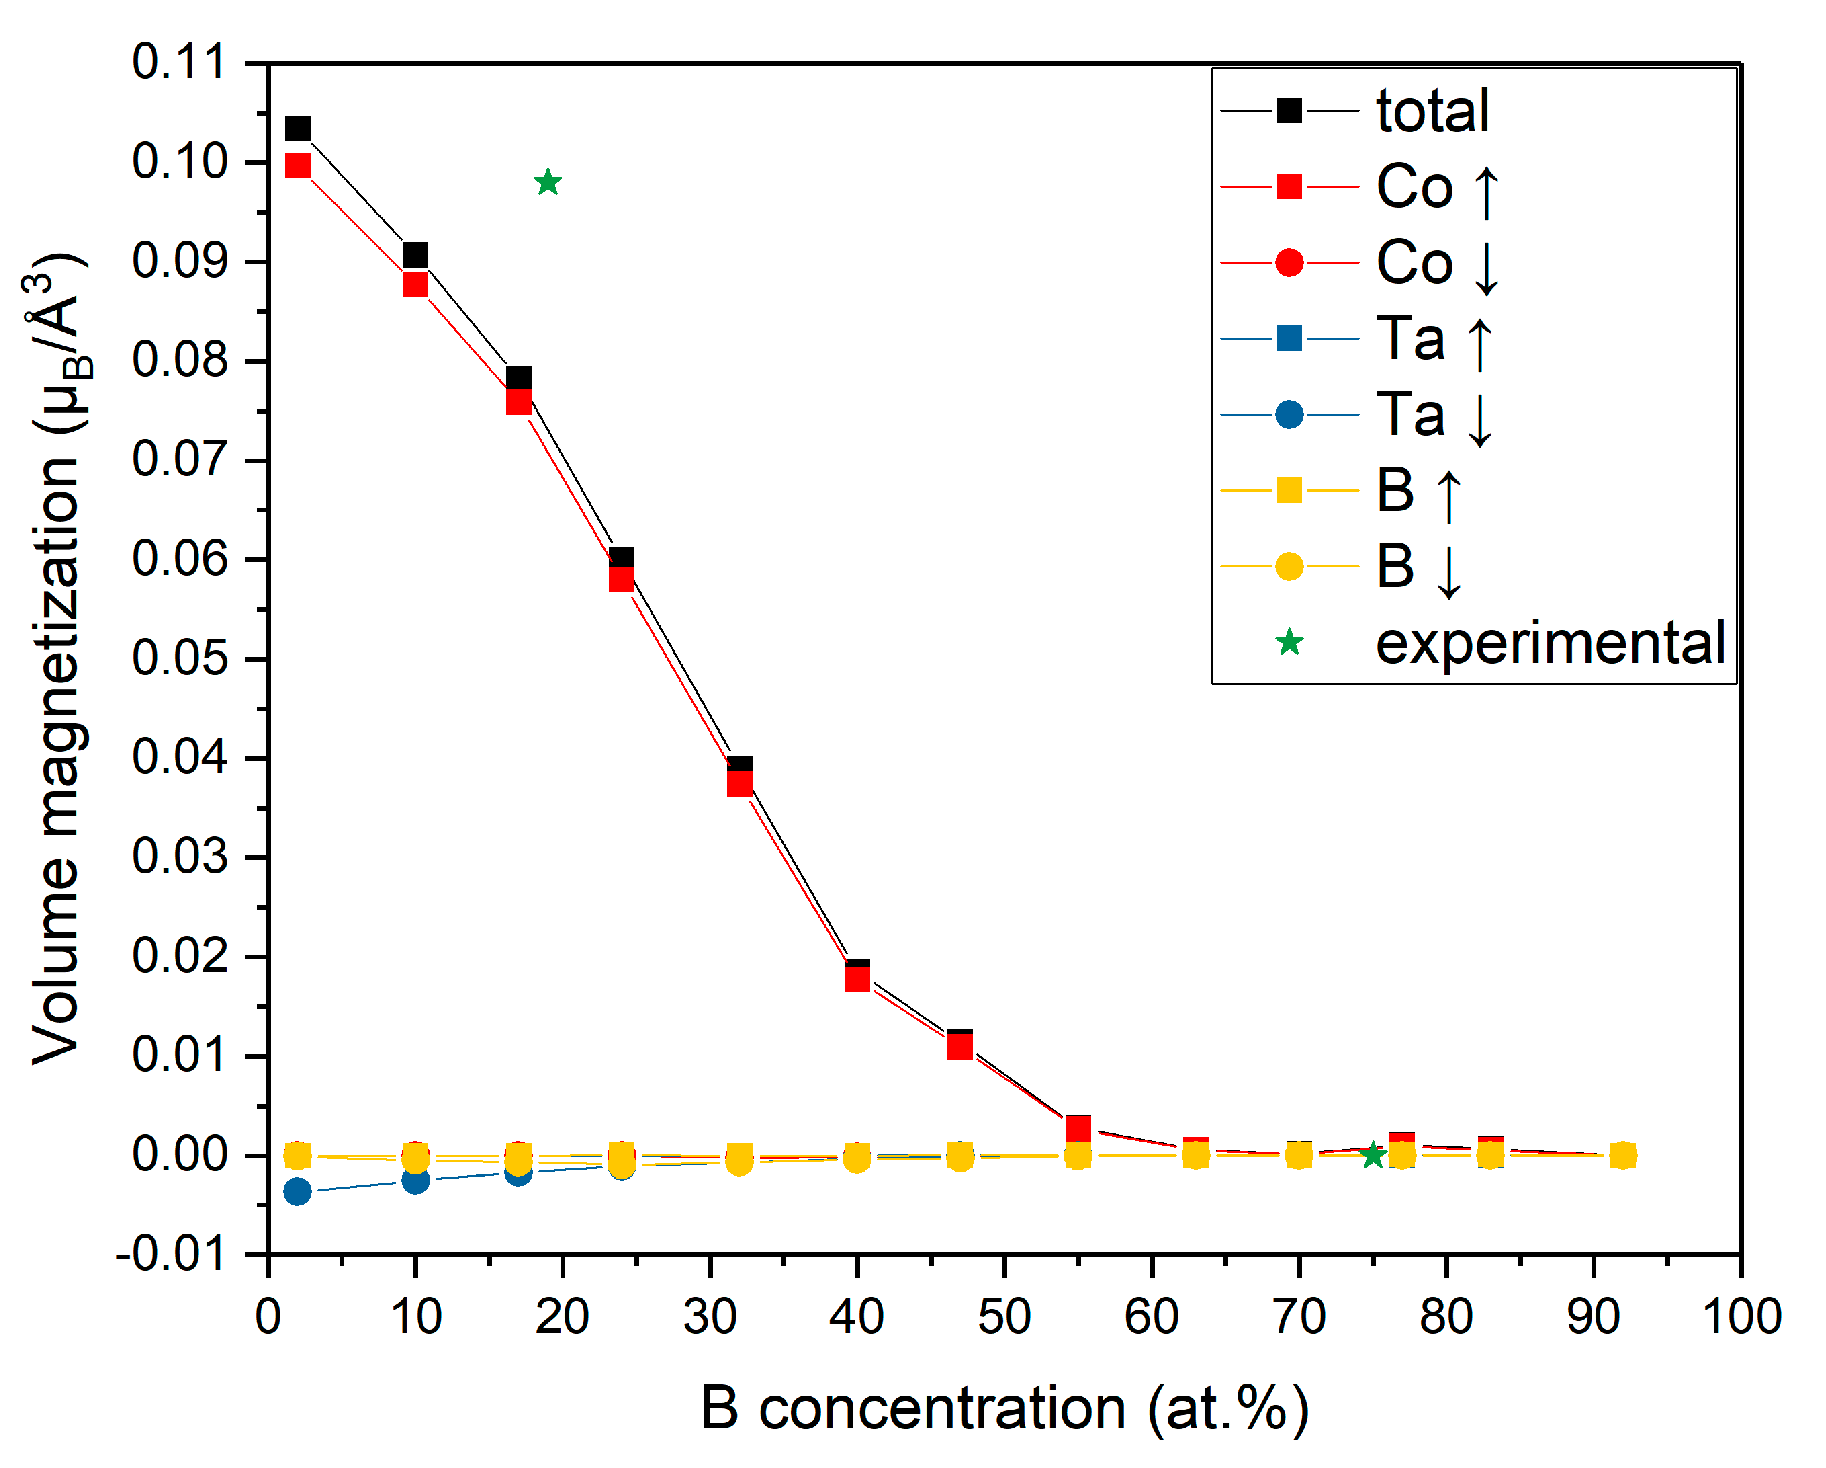
| Volume magnetization | 40 | 70 |
© 2020 by the authors. Licensee MDPI, Basel, Switzerland. This article is an open access article distributed under the terms and conditions of the Creative Commons Attribution (CC BY) license (http://creativecommons.org/licenses/by/4.0/).
Share and Cite
Evertz, S.; Prünte, S.; Patterer, L.; Marshal, A.; Holzapfel, D.M.; Schökel, A.; Hans, M.; Primetzhofer, D.; Schneider, J.M. Boron Concentration Induced Co-Ta-B Composite Formation Observed in the Transition from Metallic to Covalent Glasses. Condens. Matter 2020, 5, 18. https://doi.org/10.3390/condmat5010018
Evertz S, Prünte S, Patterer L, Marshal A, Holzapfel DM, Schökel A, Hans M, Primetzhofer D, Schneider JM. Boron Concentration Induced Co-Ta-B Composite Formation Observed in the Transition from Metallic to Covalent Glasses. Condensed Matter. 2020; 5(1):18. https://doi.org/10.3390/condmat5010018
Chicago/Turabian StyleEvertz, Simon, Stephan Prünte, Lena Patterer, Amalraj Marshal, Damian M. Holzapfel, Alexander Schökel, Marcus Hans, Daniel Primetzhofer, and Jochen M. Schneider. 2020. "Boron Concentration Induced Co-Ta-B Composite Formation Observed in the Transition from Metallic to Covalent Glasses" Condensed Matter 5, no. 1: 18. https://doi.org/10.3390/condmat5010018
APA StyleEvertz, S., Prünte, S., Patterer, L., Marshal, A., Holzapfel, D. M., Schökel, A., Hans, M., Primetzhofer, D., & Schneider, J. M. (2020). Boron Concentration Induced Co-Ta-B Composite Formation Observed in the Transition from Metallic to Covalent Glasses. Condensed Matter, 5(1), 18. https://doi.org/10.3390/condmat5010018