Single Crystal Growth and Superconducting Properties of Antimony-Substituted NdO0.7F0.3BiS2

Abstract
:1. Introduction
2. Experimental Section
3. Results
4. Conclusions
Acknowledgments
Author Contributions
Conflicts of Interest
References
- Mizuguchi, Y.; Fujihisa, H.; Gotoh, Y.; Suzuki, K.; Usui, H.; Kuroki, K.; Demura, S.; Takano, Y.; Izawa, H.; Miura, O. BiS2-based layered superconductor Bi4O4S3. Phys. Rev. B 2012, 86, 220510. [Google Scholar] [CrossRef]
- Singh, S.K.; Kumar, A.; Gahtri, B.; Sharma, G.; Patnaik, S.; Awana, V.P.S. Bulk Superconductivity in Bismuth Oxysulfide Bi4O4S3. J. Am. Chem. Soc. 2012, 134, 16504–16507. [Google Scholar] [CrossRef] [PubMed]
- Mizuguchi, Y.; Demura, S.; Deguchi, K.; Takano, Y.; Fujihisa, H.; Gotoh, Y.; Izawa, H.; Miura, O. Superconductivity in Novel BiS2-Based Layered Superconductor LaO1−xFxBiS2. J. Phys. Soc. Jpn. 2012, 81, 114725. [Google Scholar] [CrossRef]
- Awana, V.P.S.; Kumar, A.; Jha, R.; Kumar Singh, S.; Pal, A.; Saha, S.J.; Patnaik, S. Appearance of superconductivity in layered LaO0.5F0.5BiS2. Solid State Commun. 2013, 157, 21–23. [Google Scholar] [CrossRef]
- Demura, S.; Mizuguchi, Y.; Deguchi, K.; Okazaki, H.; Hara, H.; Watanabe, T.; Denholme, S.J.; Fujioka, M.; Ozaki, T.; Fujihisa, H.; et al. New Member of BiS2-Based Superconductor NdO1−xFxBiS2. J. Phys. Soc. Jpn. 2013, 82, 033708. [Google Scholar] [CrossRef]
- Jha, R.; Kumar, A.; Singh, S.K.; Awana, V.P.S. Superconductivity at 5 K in NdO0.5F0.5BiS2. J. Appl. Phys. 2013, 113, 056102. [Google Scholar] [CrossRef]
- Xing, J.; Li, S.; Ding, X.; Yang, H.; Wen, H.-H. Superconductivity appears in the vicinity of semiconducting-like behavior in CeO1−xFxBiS2. Phys. Rev. B 2012, 86, 214518. [Google Scholar] [CrossRef]
- Jha, R.; Kumar, A.; Sngh, S.K.; Awana, V.P.S. Synthesis and Superconductivity of New BiS2 Based Superconductor PrO0.5F0.5BiS2. J. Supercond. Nov. Magn. 2013, 26, 499–502. [Google Scholar] [CrossRef]
- Yazici, D.; Huang, K.; White, B.D.; Jeon, I.; Burnett, V.W.; Friedman, A.J.; Lum, I.K.; Nallaiyan, M.; Spagna, S.; Maple, M.B. Superconductivity induced by electron doping in La1−xMxOBiS2 (M = Ti, Zr, Hf, Th). Phys. Rev. B 2013, 87, 174512. [Google Scholar] [CrossRef]
- Hiroi, T.; Kajitani, J.; Omachi, A.; Miura, O.; Mizuguchi, Y. Evolution of Superconductivity in BiS2-Based Superconductor LaO0.5F0.5Bi(S1−xSex)2. J. Phys. Soc. Jpn. 2015, 84, 024723. [Google Scholar] [CrossRef]
- Kajitani, J.; Omachi, A.; Hiroi, T.; Miura, O.; Mizuguchi, Y. Chemical pressure effect on Tc in BiS2-based Ce1−xNdxO0.5F0.5BiS2. Phys. C Supercond. Appl. 2014, 504, 33–35. [Google Scholar] [CrossRef]
- Fang, Y.; Yazici, D.; White, B.D.; Maple, M.B. Enhancement of superconductivity in La1−xSmxO0.5F0.5BiS2. Phys. Rev. B 2015, 91, 064510. [Google Scholar] [CrossRef]
- Yazici, D.; Jeon, I.; White, B.D.; Maple, M.B. Superconductivity in layered BiS2-based compounds. Phys. C Supercond. Appl. 2015, 514, 218–236. [Google Scholar] [CrossRef]
- Fang, Y.; Wolowiec, C.T.; Yazici, D.; Maple, M.B. Chemical Substitution and High Pressure Effects on Superconductivity in the LnOBiS2(Ln = La-Nd) System. Nov. Supercond. Mater. 2015, 1, 79–94. [Google Scholar] [CrossRef]
- Demura, S.; Fujisawa, Y.; Otuski, S.; Ishio, R.; Takano, Y.; Sakata, H. Enhancement of Tc in BiS2-based superconductors NdO0.7F0.3BiS2 by substitution of Pb for Bi. Solid State Commun. 2015, 223, 40–44. [Google Scholar] [CrossRef]
- Demura, S. Evolution of superconductivity and magnetism in BiS2-based layered compounds. Nov. Supercond. Mater. 2016, 2, 1–15. [Google Scholar] [CrossRef]
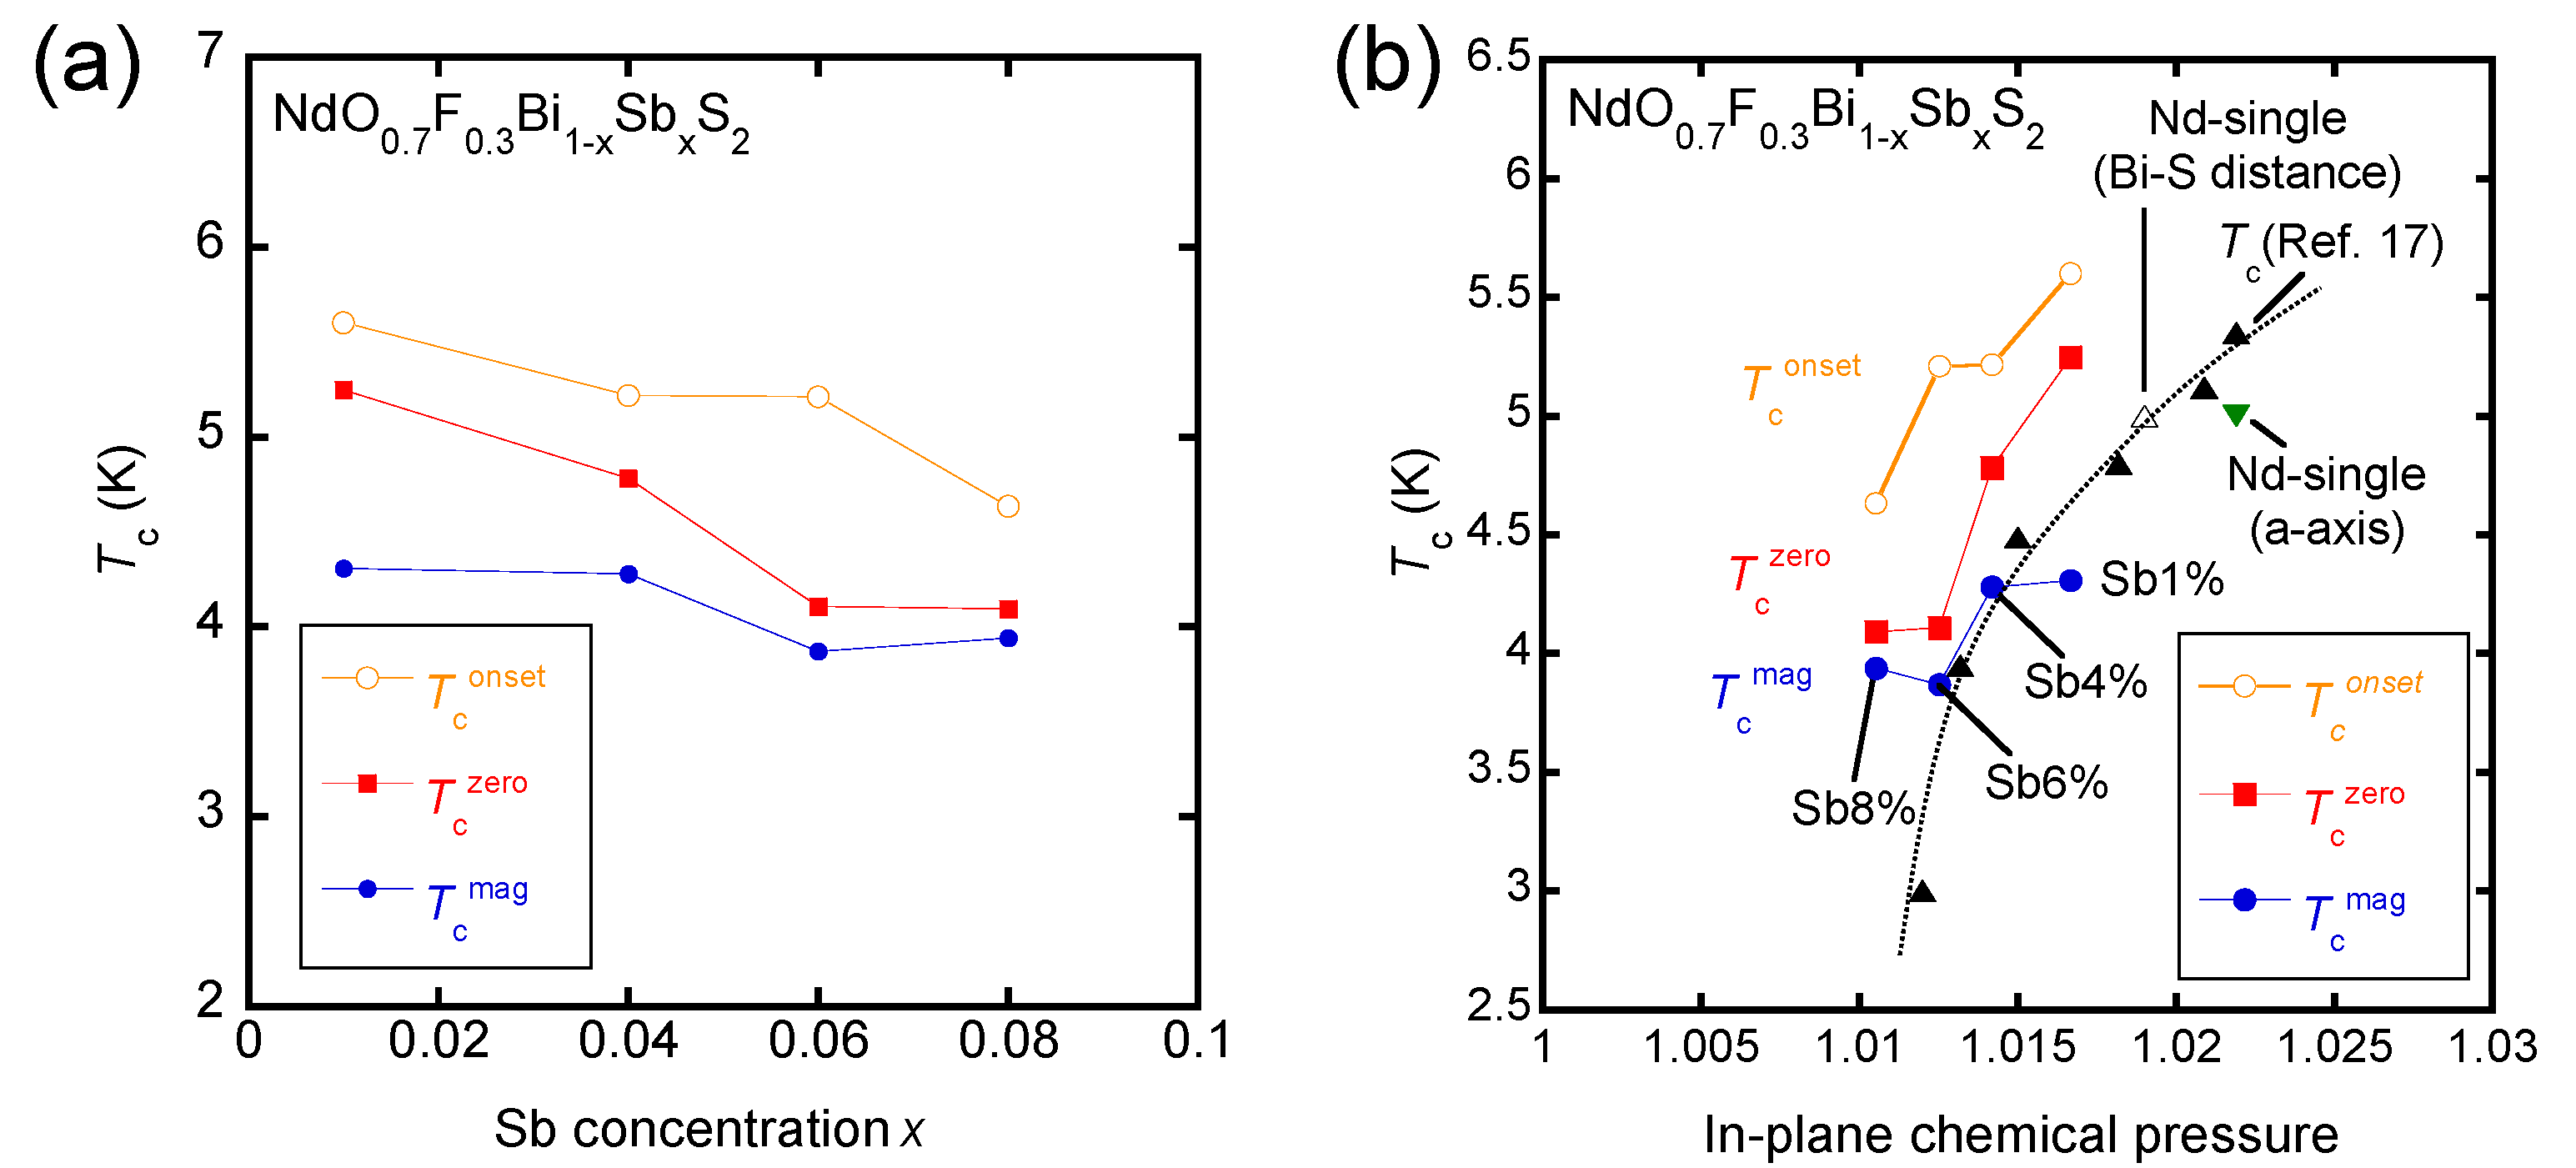
- Mizuguchi, Y.; Miura, A.; Kajitani, J.; Hiroi, T.; Miura, O.; Tadanaga, K.; Kumada, N.; Magome, E.; Miriyoshi, C.; Kuroiwa, Y. In-plane chemical pressure essential for superconductivity in BiCh2-based (Ch: S, Se) layered structure. Sci. Rep. 2015, 5, 14968. [Google Scholar] [CrossRef] [PubMed]
- Nagao, M.; Miura, A.; Demura, S.; Deguchi, K.; Watauchi, S.; Takei, T.; Takano, Y.; Kumada, N.; Tanaka, I. Growth and superconducting properties of F-substituted ROBiS2 (R = La, Ce, Nd) single crystals. Solid State Commun. 2014, 178, 33–36. [Google Scholar] [CrossRef]
- Nagao, M. Growth and characterization of R(O,F)BiS2 (R = La,Ce, Pr, Nd) superconducting single crystals. Nov. Supercond. Mater. 2015, 1, 64. [Google Scholar] [CrossRef]
- Otski, S.; Demura, S.; Sakai, Y.; Fujisawa, Y.; Sakata, H. Effect of Lead substitution on LaO0.5F0.5BiS2. Solid State Commun. 2017, 270, 17–21. [Google Scholar] [CrossRef]
- Miura, A.; Nagao, M.; Takei, T.; Watauchi, S.; Mizuguchi, Y.; Takano, Y.; Tanaka, I.; Kumada, N. Structure, Superconductivity, and Magnetism of Ce(O,F)BiS2 Single Crystals. Cryst. Growth Des. 2015, 15, 39–44. [Google Scholar] [CrossRef]
- Nagao, M.; Miura, A.; Watauchi, S.; Takano, Y.; Tanaka, I. C-axis electrical resistivity of PrO1−aFaBiS2 single crystals. Jpn. J. Appl. Phys. 2015, 54, 083101. [Google Scholar] [CrossRef]
- Nagao, M.; Demura, S.; Deguchi, K.; Miura, A.; Watauchi, S.; Takei, T.; Takano, Y.; Kumada, N.; Tanaka, I. Structural Analysis and Superconducting Properties of F-Substituted NdOBiS2 Single Crystals. J. Phys. Soc. Jpn. 2013, 82, 113701. [Google Scholar] [CrossRef]
- Tanaka, M.; Nagao, M.; Matsushita, Y.; Fujioka, M.; Denholme, S.J.; Yamaguchi, T.; Takeya, H.; Takano, Y. First single crystal growth and structural analysis of superconducting layered bismuth oxyselenide; La(O,F)BiSe2. J. Solid State Chem. 2014, 219, 168–172. [Google Scholar] [CrossRef]
- Miura, A.; Nagao, M.; Takei, T.; Watauchi, S.; Tanaka, I. Crystal structures of LaO1−xFxBiS2 (x~0.23, 0.46): Effect of F doping on distortion of Bi–S plane. J. Solid State Chem. 2014, 212, 213–217. [Google Scholar] [CrossRef]
- Jia, Y.Q. Crystal radii and effective ionic radii of the rare earth ions. J. Solid State Chem. 1991, 95, 184–187. [Google Scholar] [CrossRef]


© 2017 by the authors. Licensee MDPI, Basel, Switzerland. This article is an open access article distributed under the terms and conditions of the Creative Commons Attribution (CC BY) license (http://creativecommons.org/licenses/by/4.0/).
Share and Cite
Demura, S.; Otsuki, S.; Fujisawa, Y.; Takano, Y.; Sakata, H. Single Crystal Growth and Superconducting Properties of Antimony-Substituted NdO0.7F0.3BiS2. Condens. Matter 2018, 3, 1. https://doi.org/10.3390/condmat3010001
Demura S, Otsuki S, Fujisawa Y, Takano Y, Sakata H. Single Crystal Growth and Superconducting Properties of Antimony-Substituted NdO0.7F0.3BiS2. Condensed Matter. 2018; 3(1):1. https://doi.org/10.3390/condmat3010001
Chicago/Turabian StyleDemura, Satoshi, Satoshi Otsuki, Yuita Fujisawa, Yoshihiko Takano, and Hideaki Sakata. 2018. "Single Crystal Growth and Superconducting Properties of Antimony-Substituted NdO0.7F0.3BiS2" Condensed Matter 3, no. 1: 1. https://doi.org/10.3390/condmat3010001