1. Introduction
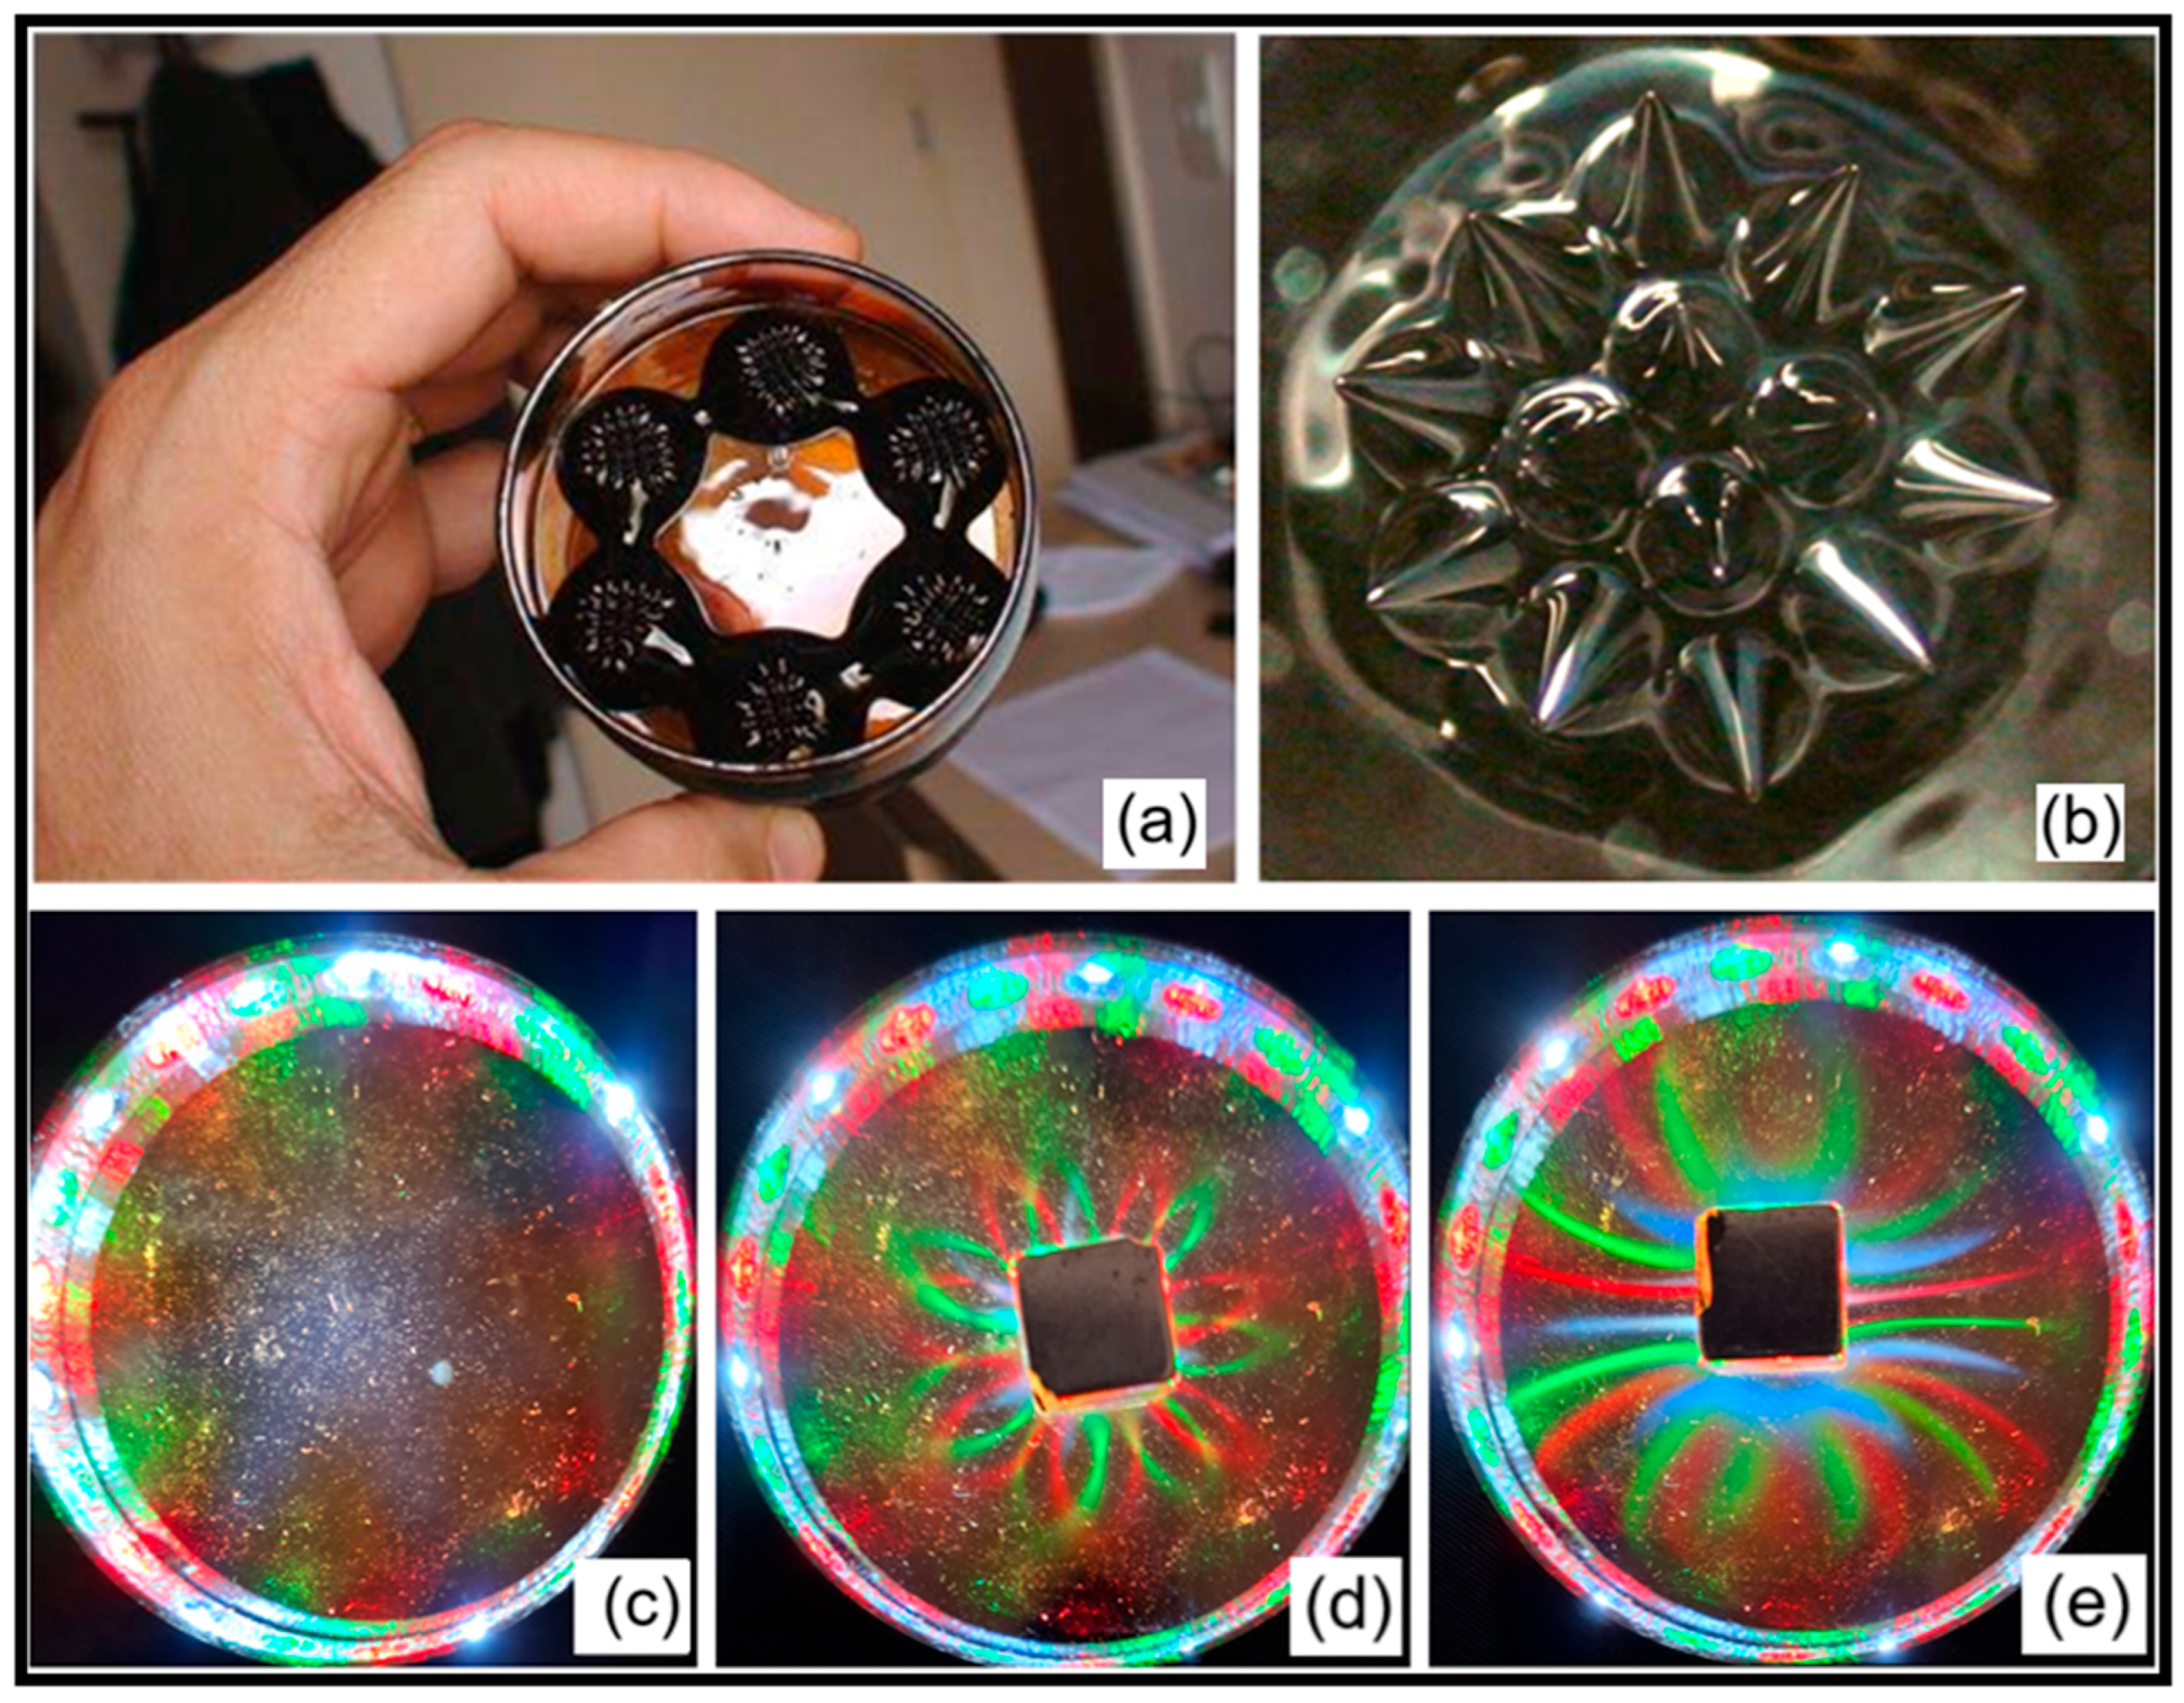
Ferrofluids are remarkable materials that uniquely combine the fluid characteristics of a liquid with the magnetic properties typically associated with solids. In their bulk condition, these suspensions exhibit fascinating magnetic behaviors, notably altering their macroscopic shape when subjected to external magnetic fields, as illustrated in
Figure 1. This plasticity arises from the presence of suspended iron oxide nanoparticles, which magnetically align with the applied field. For example, in
Figure 1a, we can see a magnetic field arrangement where alternating north and south poles create a closed magnetic structure, effectively anchoring the ferrofluid. In closer detail,
Figure 1b reveals the classic formation of “spikes” over a magnetic pole, where the ferrofluid dramatically erects, as if the magnetic field provides an invisible scaffold. Intrinsic liquid properties, such as viscosity and surface tension, play a crucial role in the formation and stabilization of these macroscopic structures.
However, a more intriguing phenomenon emerges when ferrofluids are confined to a thin film, creating a device commercially known as a Ferrocell [
1,
2,
3]. By entrapping the ferrofluid between two glass plates to form a slender layer, and subsequently illuminating this film appropriately while subjecting the assembly to a magnetic field, we observe the emergence of complex luminous patterns in a device known as Ferrocell, as demonstrated in
Figure 1c–e. This device reveals that at the thin-film scale, ferrofluids transcend their impressive bulk magnetic properties to exhibit equally remarkable and controllable optical properties.
Illumination for these experiments using thin films of ferrofluid is typically conducted in a darkened environment, employing LED light sources arranged in a circular array around the magnetic field. A critical observation, expanding upon previous understandings, is the wavelength-dependent nature of these patterns. It has been discerned that the illuminated lines formed by different monochromatic LED sources (e.g., red, green, and blue) exhibit subtle yet distinct variations. Prior research primarily focused on optical mechanisms that described the ferrofluid’s interaction in the Ferrocell with light without implying an alteration in the light’s intrinsic color, treating the observed patterns essentially as a monochromatic response. However, the empirically observed chromatic variations in
Figure 1d,e strongly indicate the presence of optical mechanisms within this system that facilitate color separation effects or enable differential interaction with specific wavelengths. This realization marks a significant shift, prompting further investigation into how ferrofluids dynamically modulate light based on its spectral components, moving beyond explanations solely based on geometric light redirection.
The objective of this paper is to elucidate the fundamental mechanisms driving the wavelength-dependent luminous patterns observed in ferrofluid thin films (Ferrocell devices) under magnetic fields, thereby advancing beyond traditional geometric optics to comprehensively explain their structural coloration and spectral modulation capabilities. This research combines two concepts: the initial geometric modeling of luminous horocycle patterns in ferrofluids and the subsequent discovery that these horocycles exhibit structural coloration, confirming that the material behaves like a photonic glass due to magnetically induced nanoparticle assemblies. This work utilizes these horocycles for the first time as an essential experimental tool to specifically investigate and quantify the physical existence and properties of photonic glasses in ferrofluid systems.
In the next section, we present details regarding the experimental apparatus, materials, and methods. Subsequently, we discuss the role of dilution in pattern formation. Following this, we present the results of the Ferrocell’s optical response as a function of wavelength dependence. We then provide a comparison between experimental observations and simulations of luminous horocycles. Finally, we discuss experiments involving laser diffraction at specific points within the horocycle before concluding our work.
2. Materials and Methods
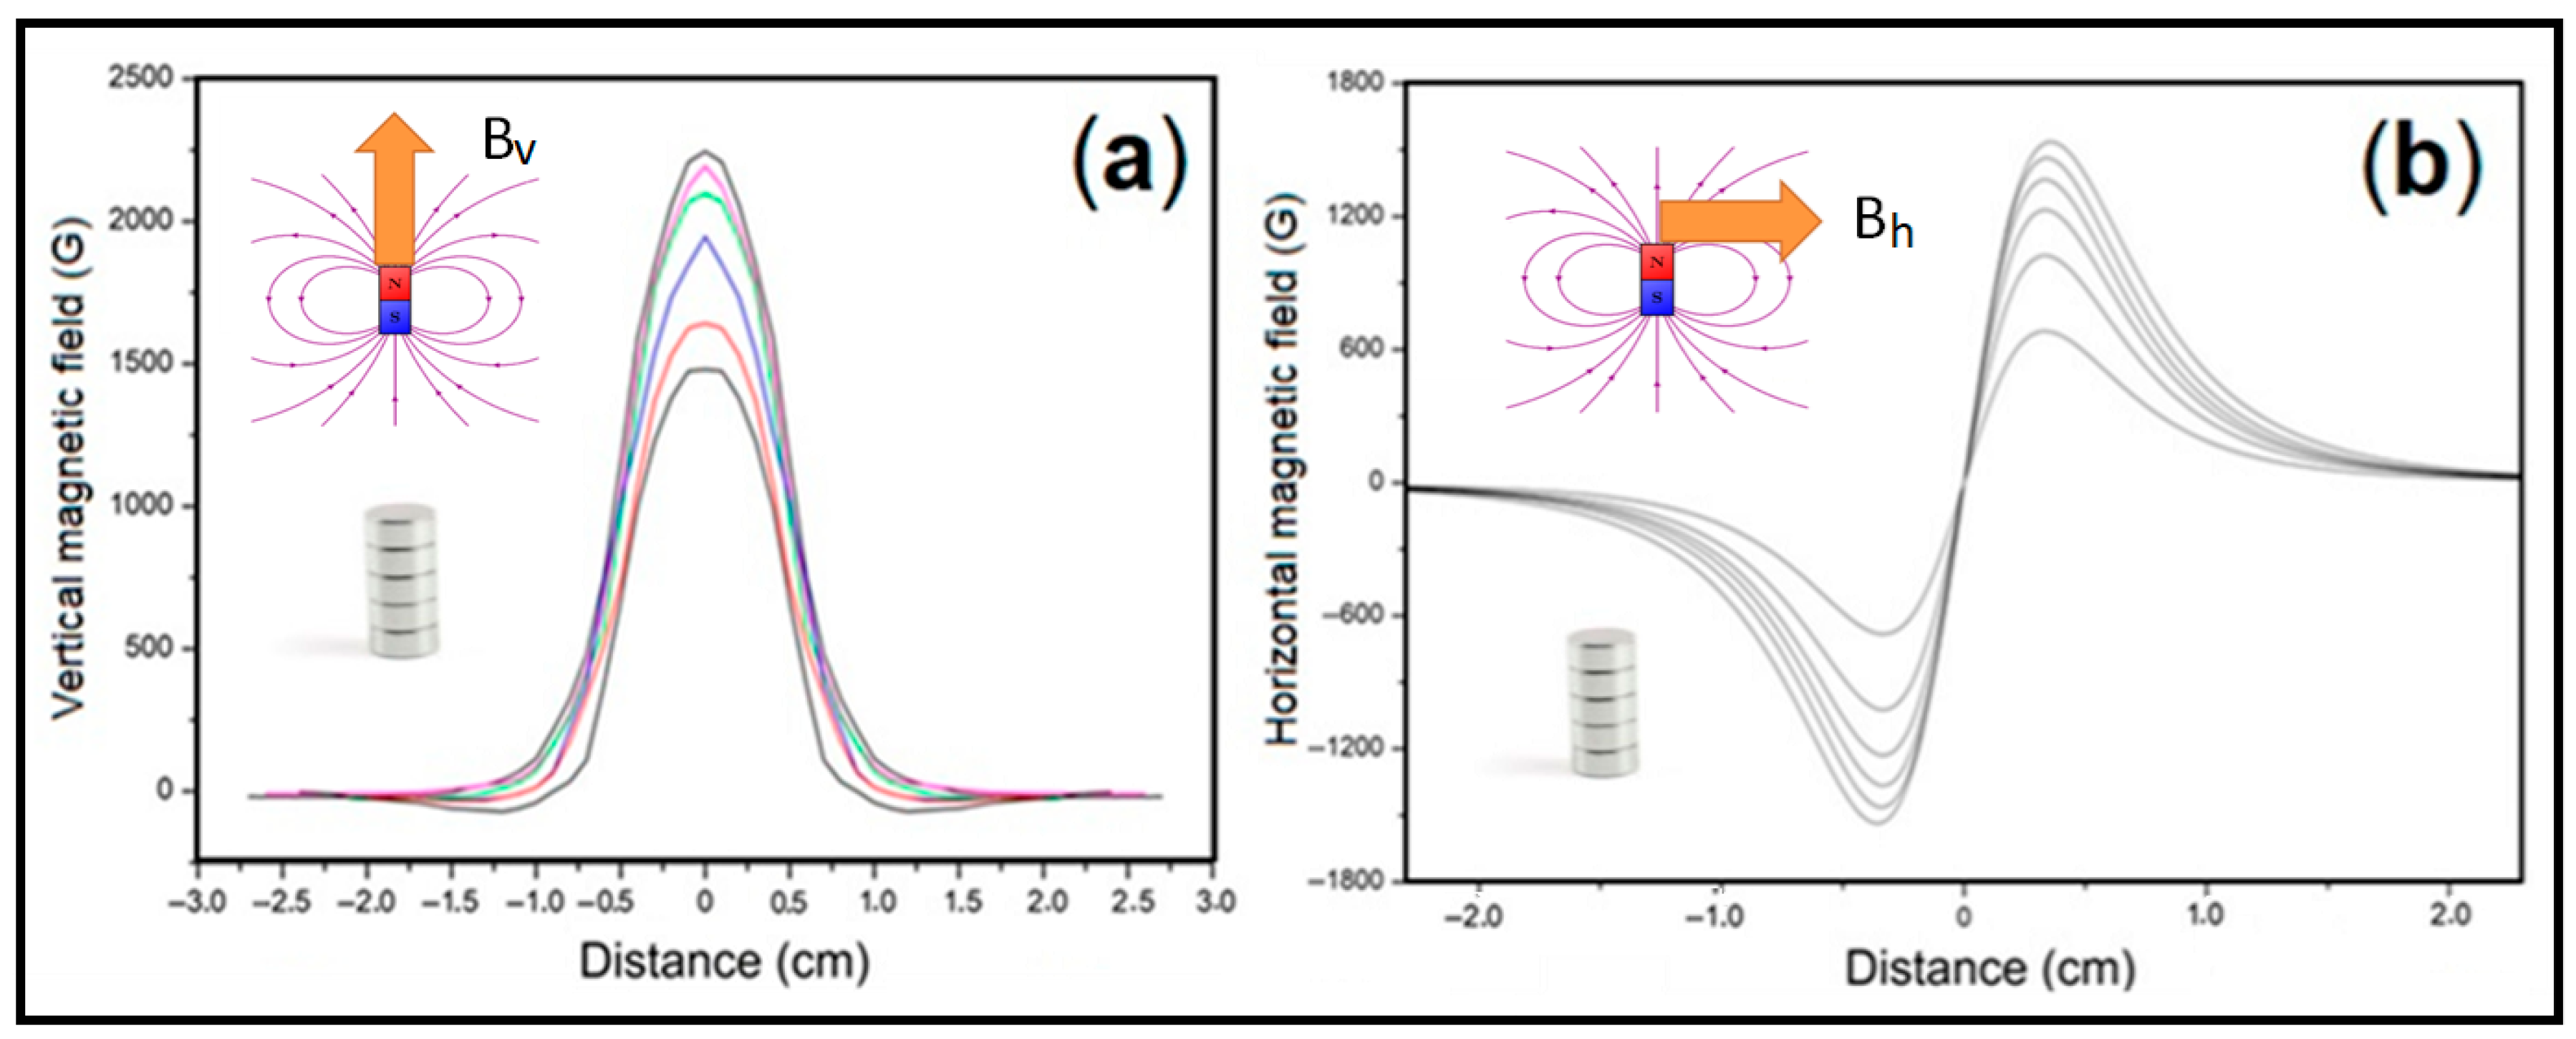
In this work, permanent magnets served as the source of the external magnetic fields applied to the Ferrocell. The ferrofluid within the Ferrocell defines a specific plane, and understanding the magnetic field’s orientation within this plane is crucial. For instance,
Figure 2 illustrates the vertical and horizontal components of the magnetic field in the Ferrocell plane generated by a stacked column of cylindrical magnets.
The magnetic field was established by positioning the arranged cylindrical rare-earth magnets over the Ferrocell, as described previous experiments [
4]. To systematically vary the magnetic field strength, additional identical magnets were precisely stacked upon the initial one. This stacking configuration allowed us to use the magnetic field strength as an independent variable in our experiments, readily achieving fields on the order of 0.3 T (3000 G). Magnetic field components were quantitatively measured using a Hall sensor. Measurements were taken linearly across the surface where the Ferrocell was placed, originating from the central point on one of the cylindrical magnet’s faces. This setup primarily exposed the Ferrocell to the influence of a single magnetic pole, establishing a “monopolar” field configuration of
Figure 2a. Changing the position of the magnet we have the dipolar configuration of
Figure 2b.
The Ferrocell itself consisted of a thin film of ferrofluid encapsulated between two flat glass plates. Specifically, the ferrofluid used was EFH1 (Ferrotec), characterized by a saturation magnetization of 440 G and composed of single-domain iron oxide nanoparticles with an average diameter of 10 nm. The precise thickness of the ferrofluid thin film, critical for optical effects, was controlled to approximately 10 µm, with a thickness variation of around 1 µm across the film. To investigate how the ferrofluid in the Ferrocellinteracts, a systematic study was conducted using a white light and RGB sources, and the concentration of nanoparticles in the ferrofluid was variedby adding mineral oil, using EFH1 ferrofluid as a base.
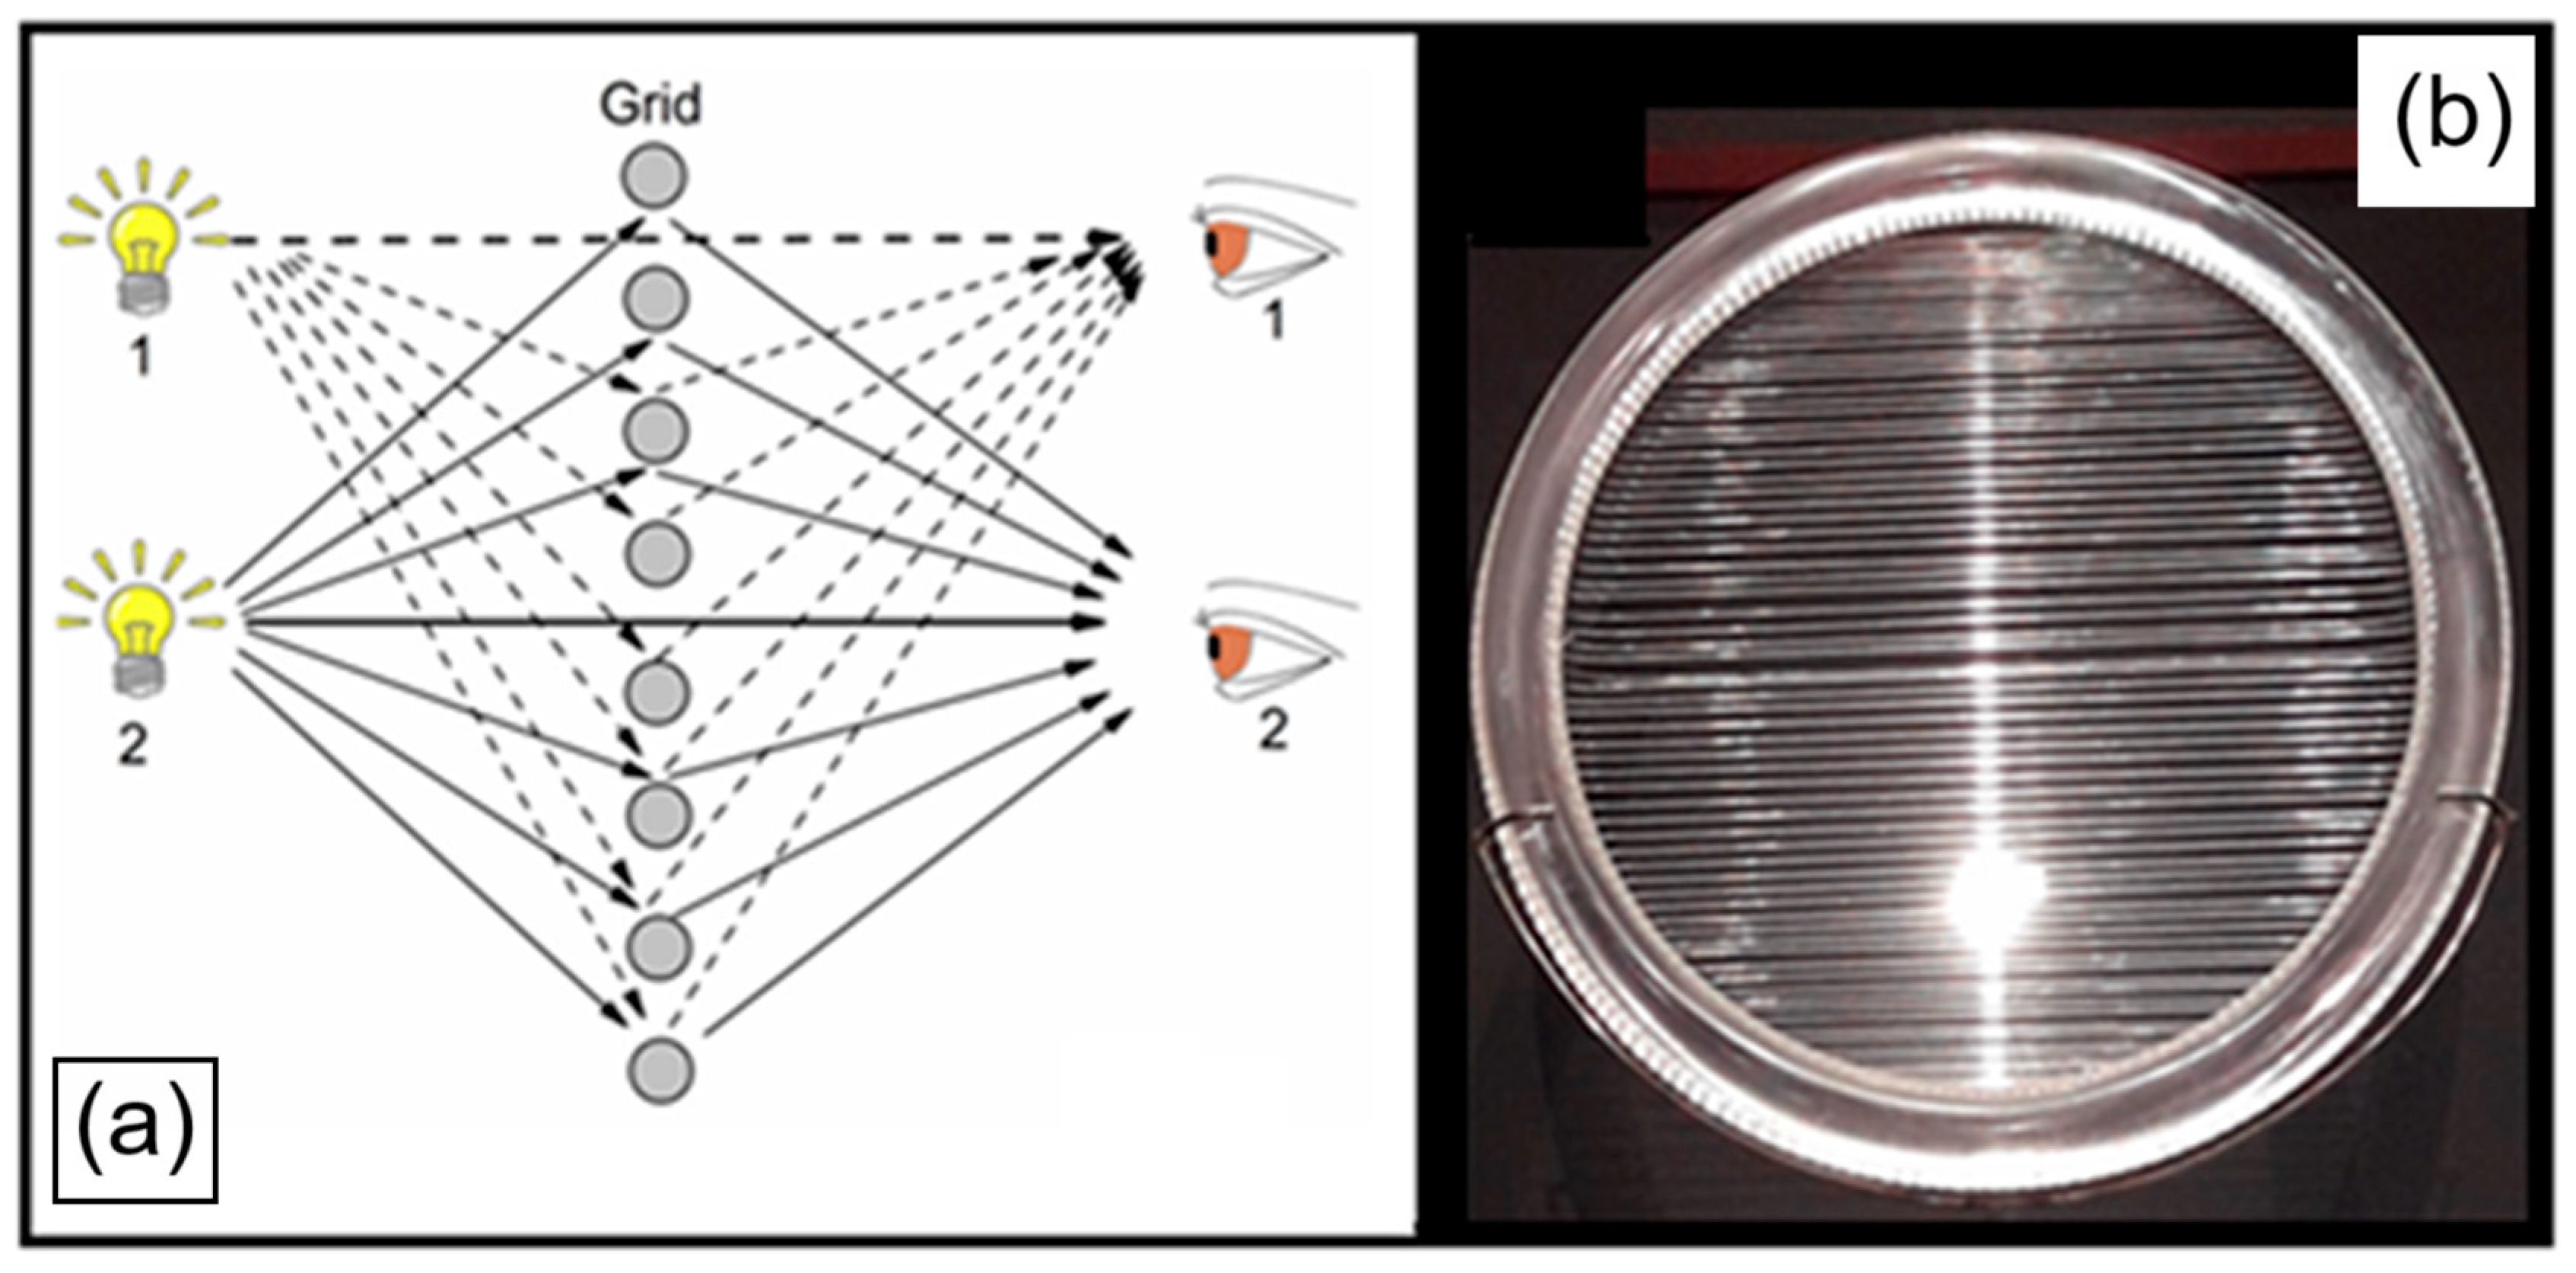
We propose a simplified model for the light patterns in the Ferrocell based on geometric optics, specifically employing the concept of effective refraction [
1]. From this perspective, the formation of light patterns is explained by the law of reflection occurring at each individual rod-like structure within the ferrofluid, as illustrated in
Figure 3. Given that the light source and the observer are positioned on opposite sides of the Ferrocell, the observed phenomenon is best described as an effective refraction. In this model, from an observer’s viewpoint, the image of the light source will consistently appear along the direction of the luminous streak, provided the internal grid of ferrofluid structures is oriented normally to the light’s propagation. In this way, the illumination setup uses a transmissive geometry, meaning the light source illuminates the Ferrocell from the side opposite the camera. In
Figure 3, we illustrate the transmissive setup, where light passes through an arrangement of nylon lines. From the observer’s perspective, this creates a linear light pattern that is perfectly perpendicular to the orientation of the nylon lines, crossing directly over the position of the light source. For the case of the ferrofluid, the light source is positioned at a fixed distance, typically above the magnet stack, and is directed straight onto the ferrofluid film. The light scatters in the plane of the ferrofluid. The patterns are formed from the light that passes through the ferrofluid film. In images, the very bright white spot at the center or top of the halo is the direct, unscattered light from the source. The surrounding luminous halo (the horocycle) is the actual magneto-optical pattern, the light scattered by the self-assembled nanoparticle structures. Thus, the bright white dot is the visual representation of the light source’s central position relative to the scattering plane.
A computer simulation, employing numerical methods and the law of reflection, as presented in
Figure 3, was subsequently developed to model the Ferrocell patterns. This simulation is based on a model provided to us through private communication with Michael Snyder, and for more information see references [
4,
5,
6].
The color changes observed in our experiments lead us to study the properties of two-dimensional photonic crystals [
7] in ferrofluids, in which we start with Maxwell’s equations for obtaining the dispersion curves of the frequencies of the light:
From this wave equation, we obtain the dispersion curves (which relate
ω and
k). For example, the expressions for the frequencies with second-order approximations in
h for the upper (
ω+) and lower (
ω−) modes are given by:
The model uses coefficients b0, b1, and b2, which are dependent on the material properties, and a geometric parameter a, which represents the lattice constant. This crystal is defined as a square lattice of cylinders separated by a distance dc. The permittivity (ϵ) of each cylinder is ϵ = 2.25, while the permittivity of the surrounding medium is ϵ = 1.0.
The experiment was conducted inside a light-tight enclosure (or “dark box”) to ensure that ambient lighting did not interfere with the measurements. The Ferrocell was illuminated by a single, controlled monochromatic or white light source, which provided a consistent flux across the sample plane. The resulting magneto-optical pattern was then captured using a digital camera. The camera settings were fixed and held constant for all images used in the analysis. This guarantees that the recorded pixel intensity values are directly proportional to the light intensity emitted by the Ferrocell, allowing for direct comparison between different regions of the pattern. The captured digital image was imported into image analysis software (e.g., Origin). The process involved Grayscale Conversion and Intensity Profile Extraction: The RGB image was converted to grayscale, yielding a single numerical intensity value for every pixel. The values presented in figures are relative light intensities, reported in Arbitrary Units (a.u.). This designation is used because we are not measuring the absolute physical irradiance (e.g., W/m2). Instead, the data represents the normalized pixel intensity. The intensity scale is typically normalized such that the maximum brightness observed in the specific image or a designated reference area corresponds to the maximum arbitrary unit value, allowing for a clear and quantitative comparison of the relative brightness across the different structural features.
3. Impact of Dilution on Pattern Formation
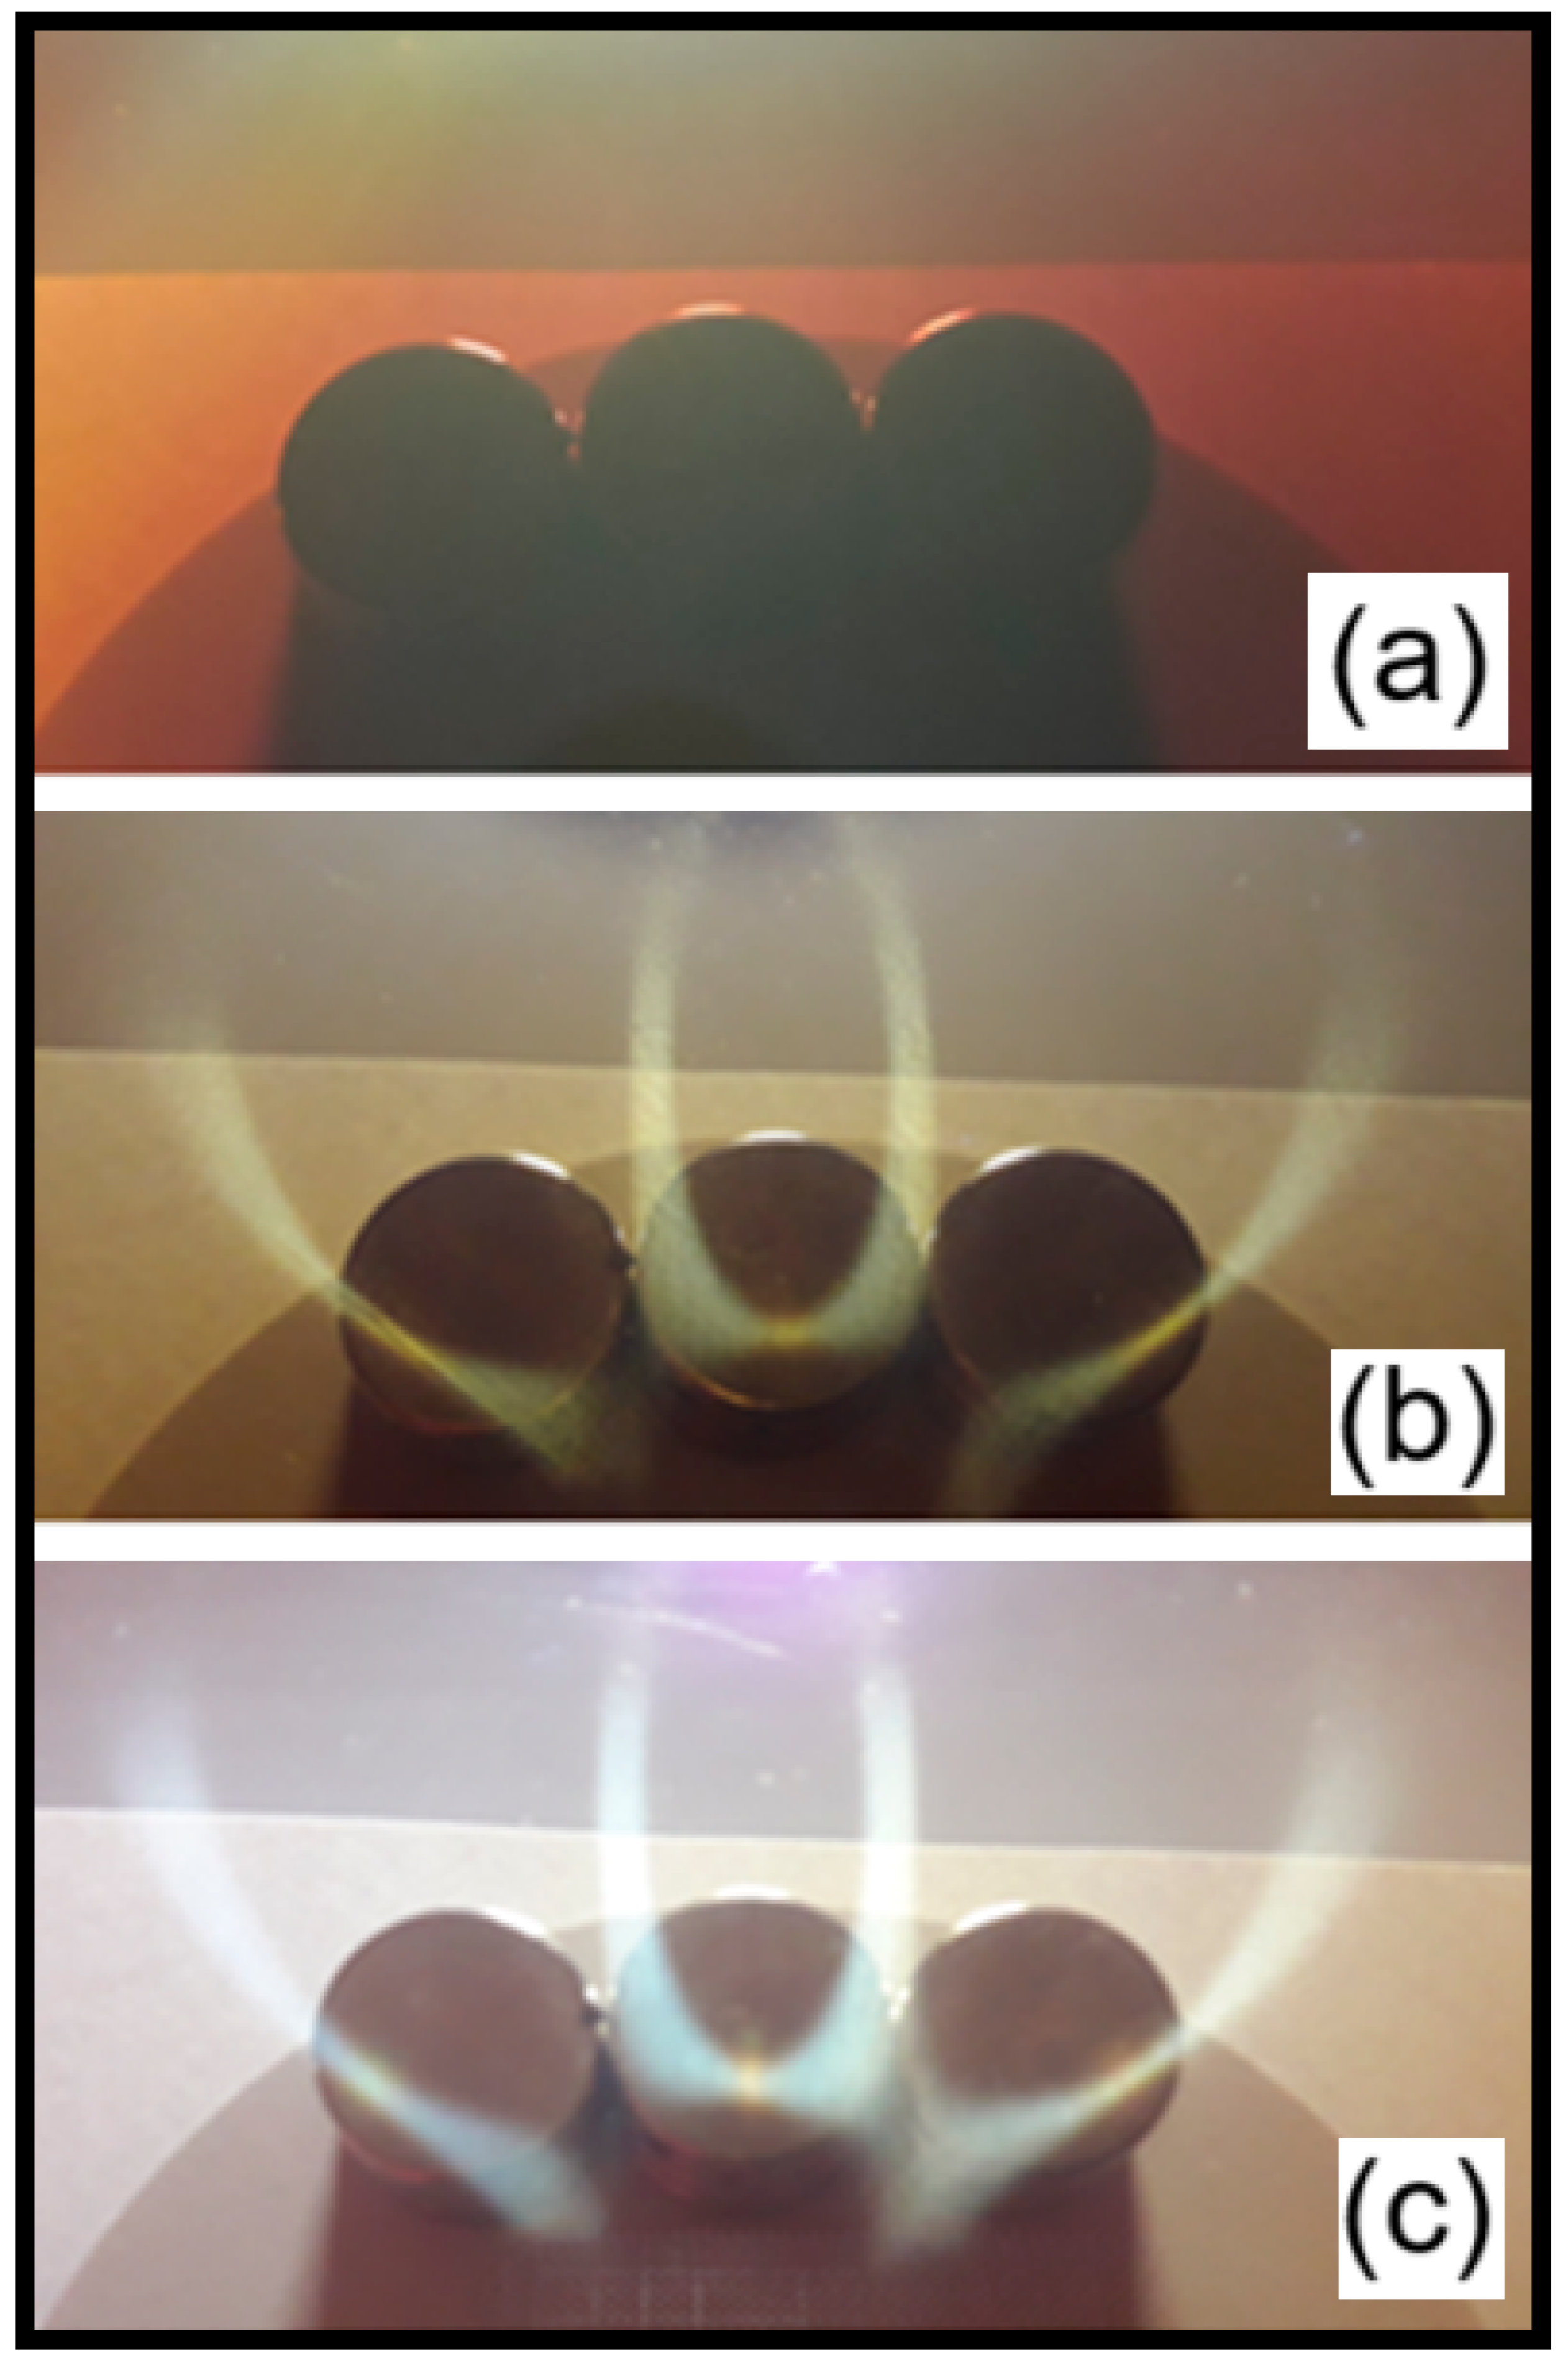
Initial results, shown in
Figure 4, reveal the profound influence of the dilution ratio on the formation of luminous patterns in the Ferrocell using white light. Three distinct scenarios were observed in
Figure 4, as we have explored in ref [
8], resembling the scenario of smart window systems [
9,
10,
11,
12].
Applying a magnetic field using three magnets, we obtain
Figure 5, which will be explained below. First scenario happens with the condition of undiluted Ferrofluid (1:0) with no luminous patterns observed, andthe Ferrocell presented a uniform reddish-brown appearance. This suggests that the extremely high concentration of magnetic nanoparticles leads to intense multiple scattering and strong absorption of incident white light, preventing the manifestation of visible interference or diffraction effects. The saturation value for particle aggregation in the presence of a magnetic field is likely too high, resulting in a dense, uniform medium. Second scenario is related todiluted Ferrofluid (1:1), with one part ferrofluid to one part mineral oil, a luminous pattern with clear branches was noted. These branches appeared in regions where the magnetic field was closer to the magnets. The overall plate, in this scenario, took on a beige hue, suggesting greater light interaction with the now-diluted particles, allowing some light to pass through and form patterns. The last case is diluted Ferrofluid (2:5), in which we are using a dilution ratio of two parts ferrofluid to five parts mineral oil, the Ferrocell became highly transparent, displaying a very clear and white luminous pattern. Most notably, in areas of maximum magnetic field intensity, colored spots with a rust-like hue were observed within the luminous pattern. This appearance of specific colors in regions of high magnetic intensity reinforces the idea that the ferrofluid’s dynamically formed structure, influenced by dilution and the magnetic field, acts similarly to natural structural colors, selectively interacting with white light to produce distinct chromatic effects.
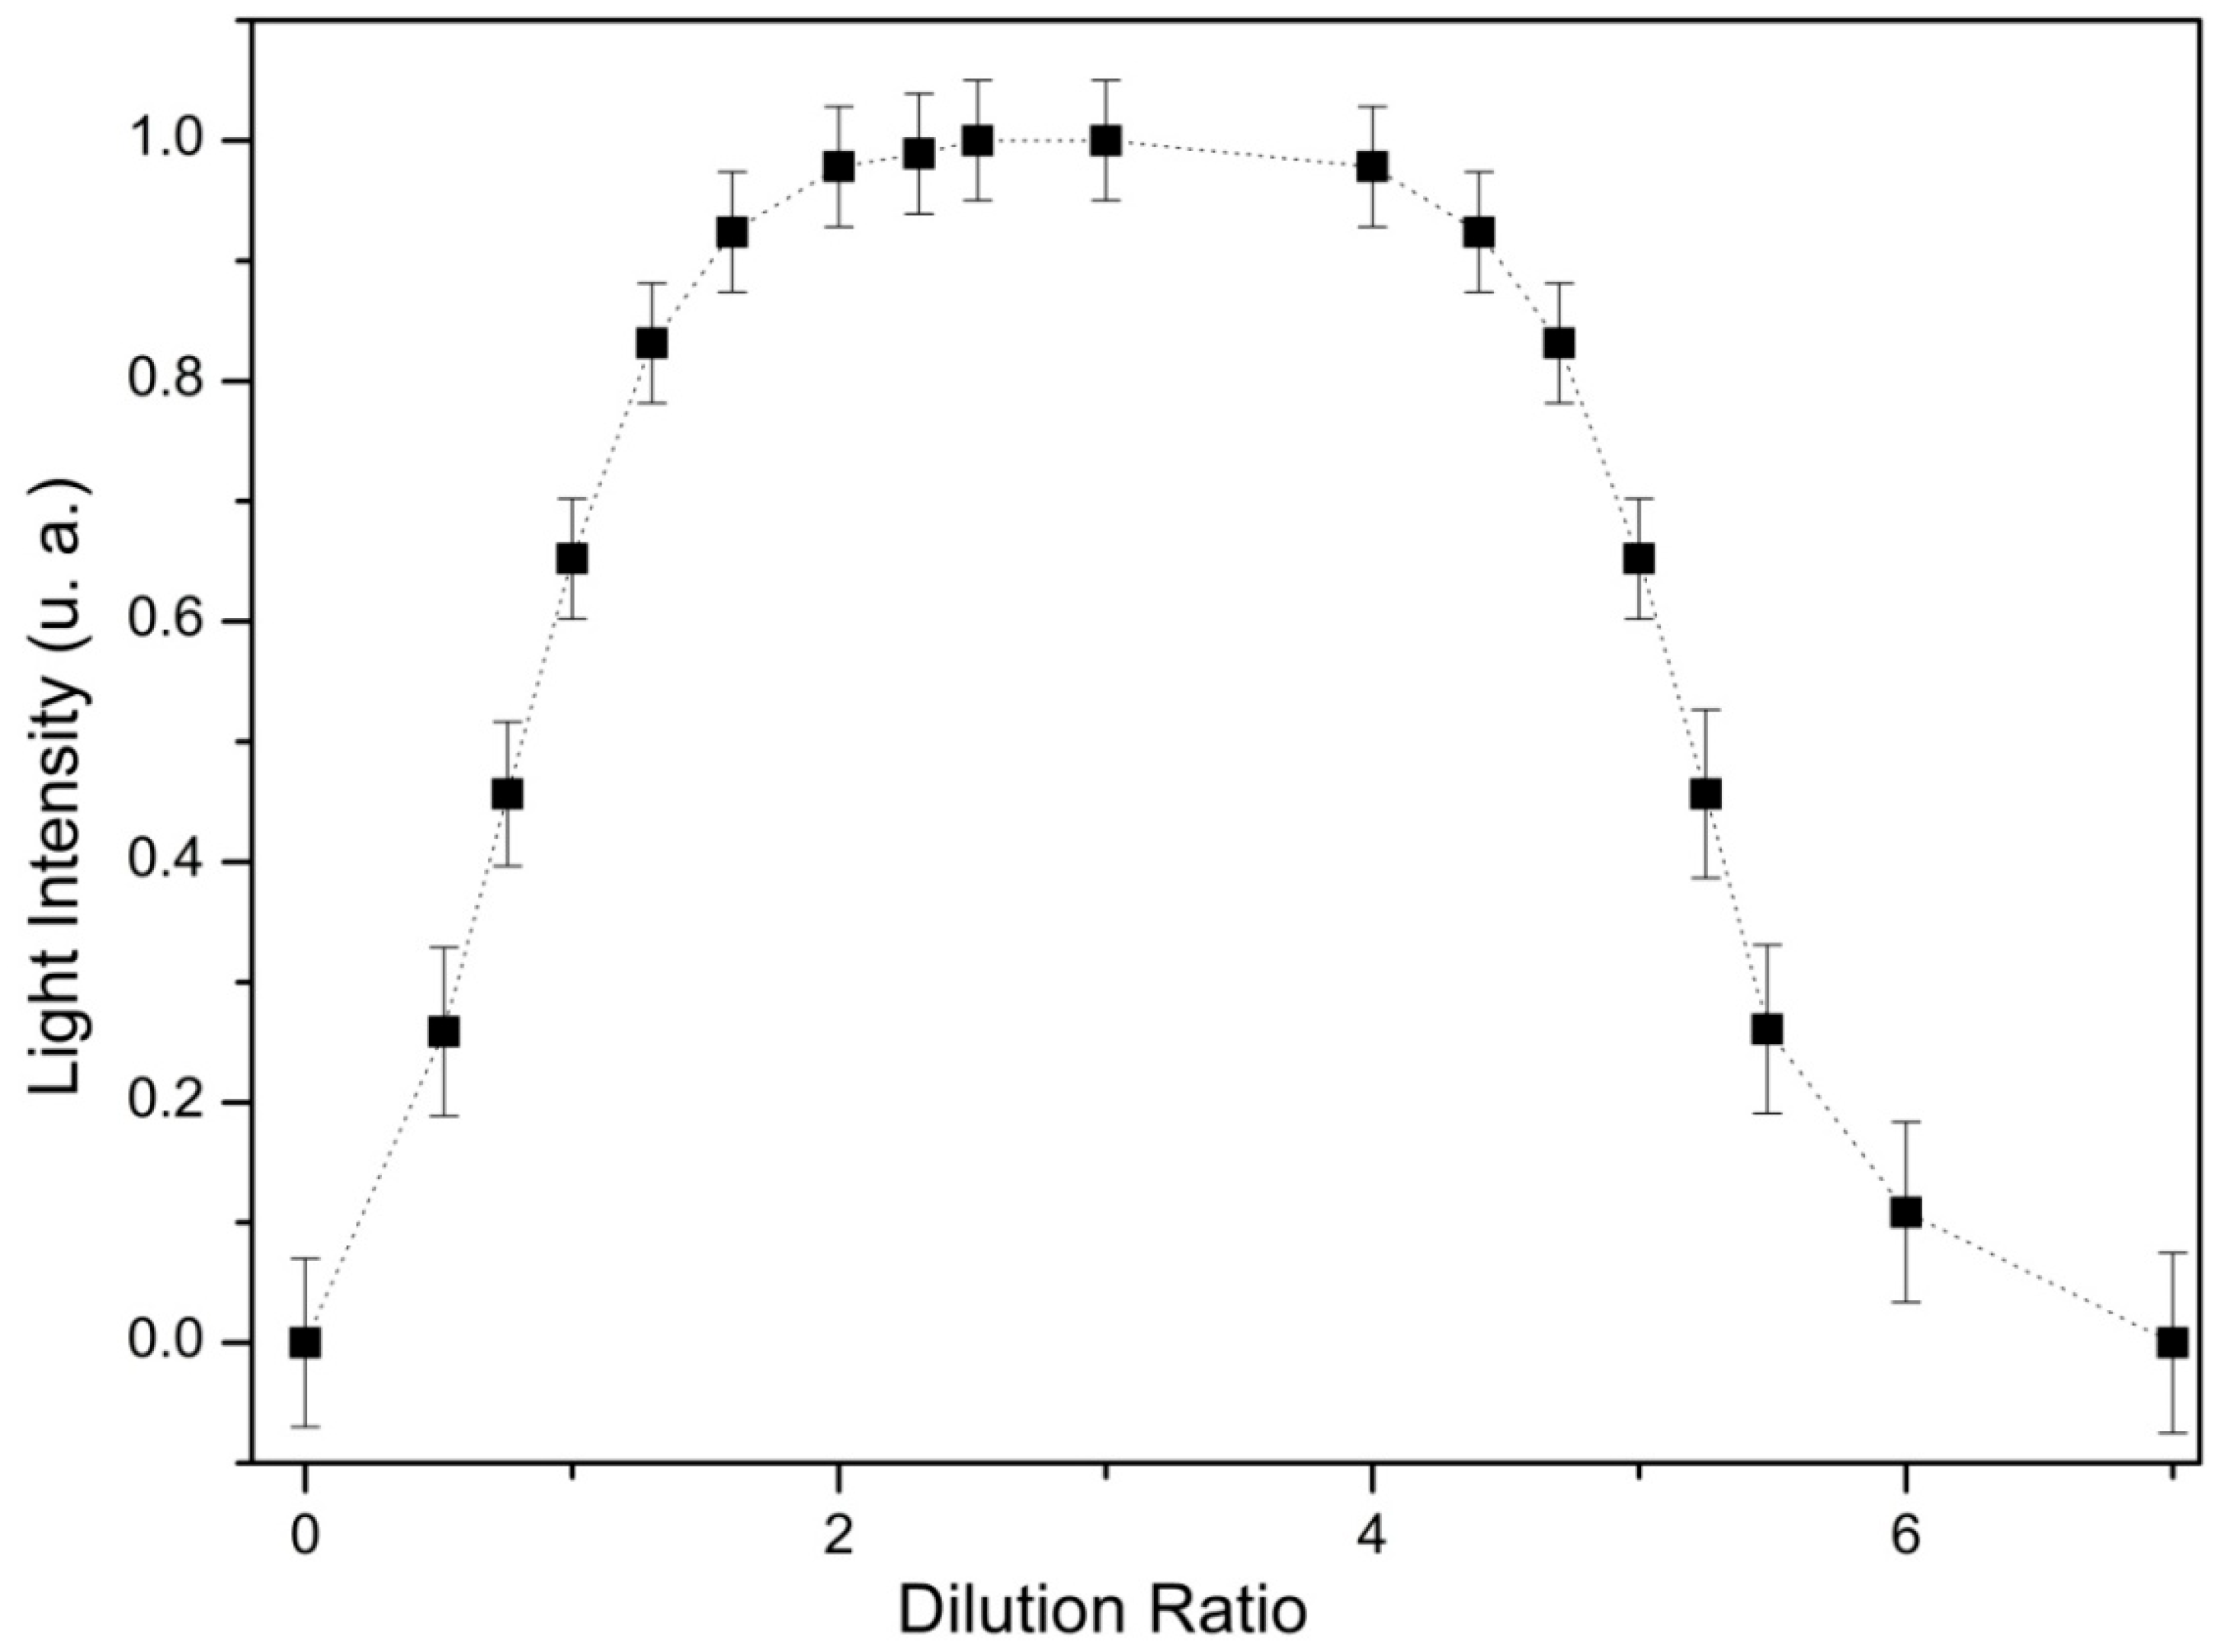
We can see in
Figure 5 the relationship between light intensity and dilution ratio, revealing why dilution is crucial for pattern formation. At standard factory concentration, the high nanoparticle density creates strong saturation magnetization, with ubiquitous attractive forces between particles forming a dense, opaque network. This causes excessive light scattering and absorption, preventing organized pattern formation—analogous to light being blocked by muddy water. As dilution increases, reduced nanoparticle concentration lowers saturation magnetization, weakening interparticle forces. Optimal dilution (from 2:1 to 4:1 mineral oil to ferrofluid) balances magnetic and thermal forces, allowing nanoparticles to organize into discrete structures (chains, columns) that act as diffraction gratings with specific refractive indices. These ordered structures enable diffraction and interference while reducing absorption, maximizing pattern brightness. However, excessive dilution (4:1 to 7:1 and beyond) reduces magnetization too severely, leaving particles too dispersed to form stable structures. The medium becomes overly transparent, lacking sufficient scattering centers, which rapidly diminishes light pattern intensity.
4. Optical Response in Ferrocells for Red, Green and Blue Colors
To systematically investigate the magneto-optical effects in the Ferrocell, we utilized the distinctive optical pattern known as the Luminous Horocycle [
2,
13]. This horocycle pattern is observed within the thin ferrofluid film when illuminated by a point light source emitting a spherical wavefront positioned behind the Ferrocell plate, relative to the observer, and a single magnetic pole is present.
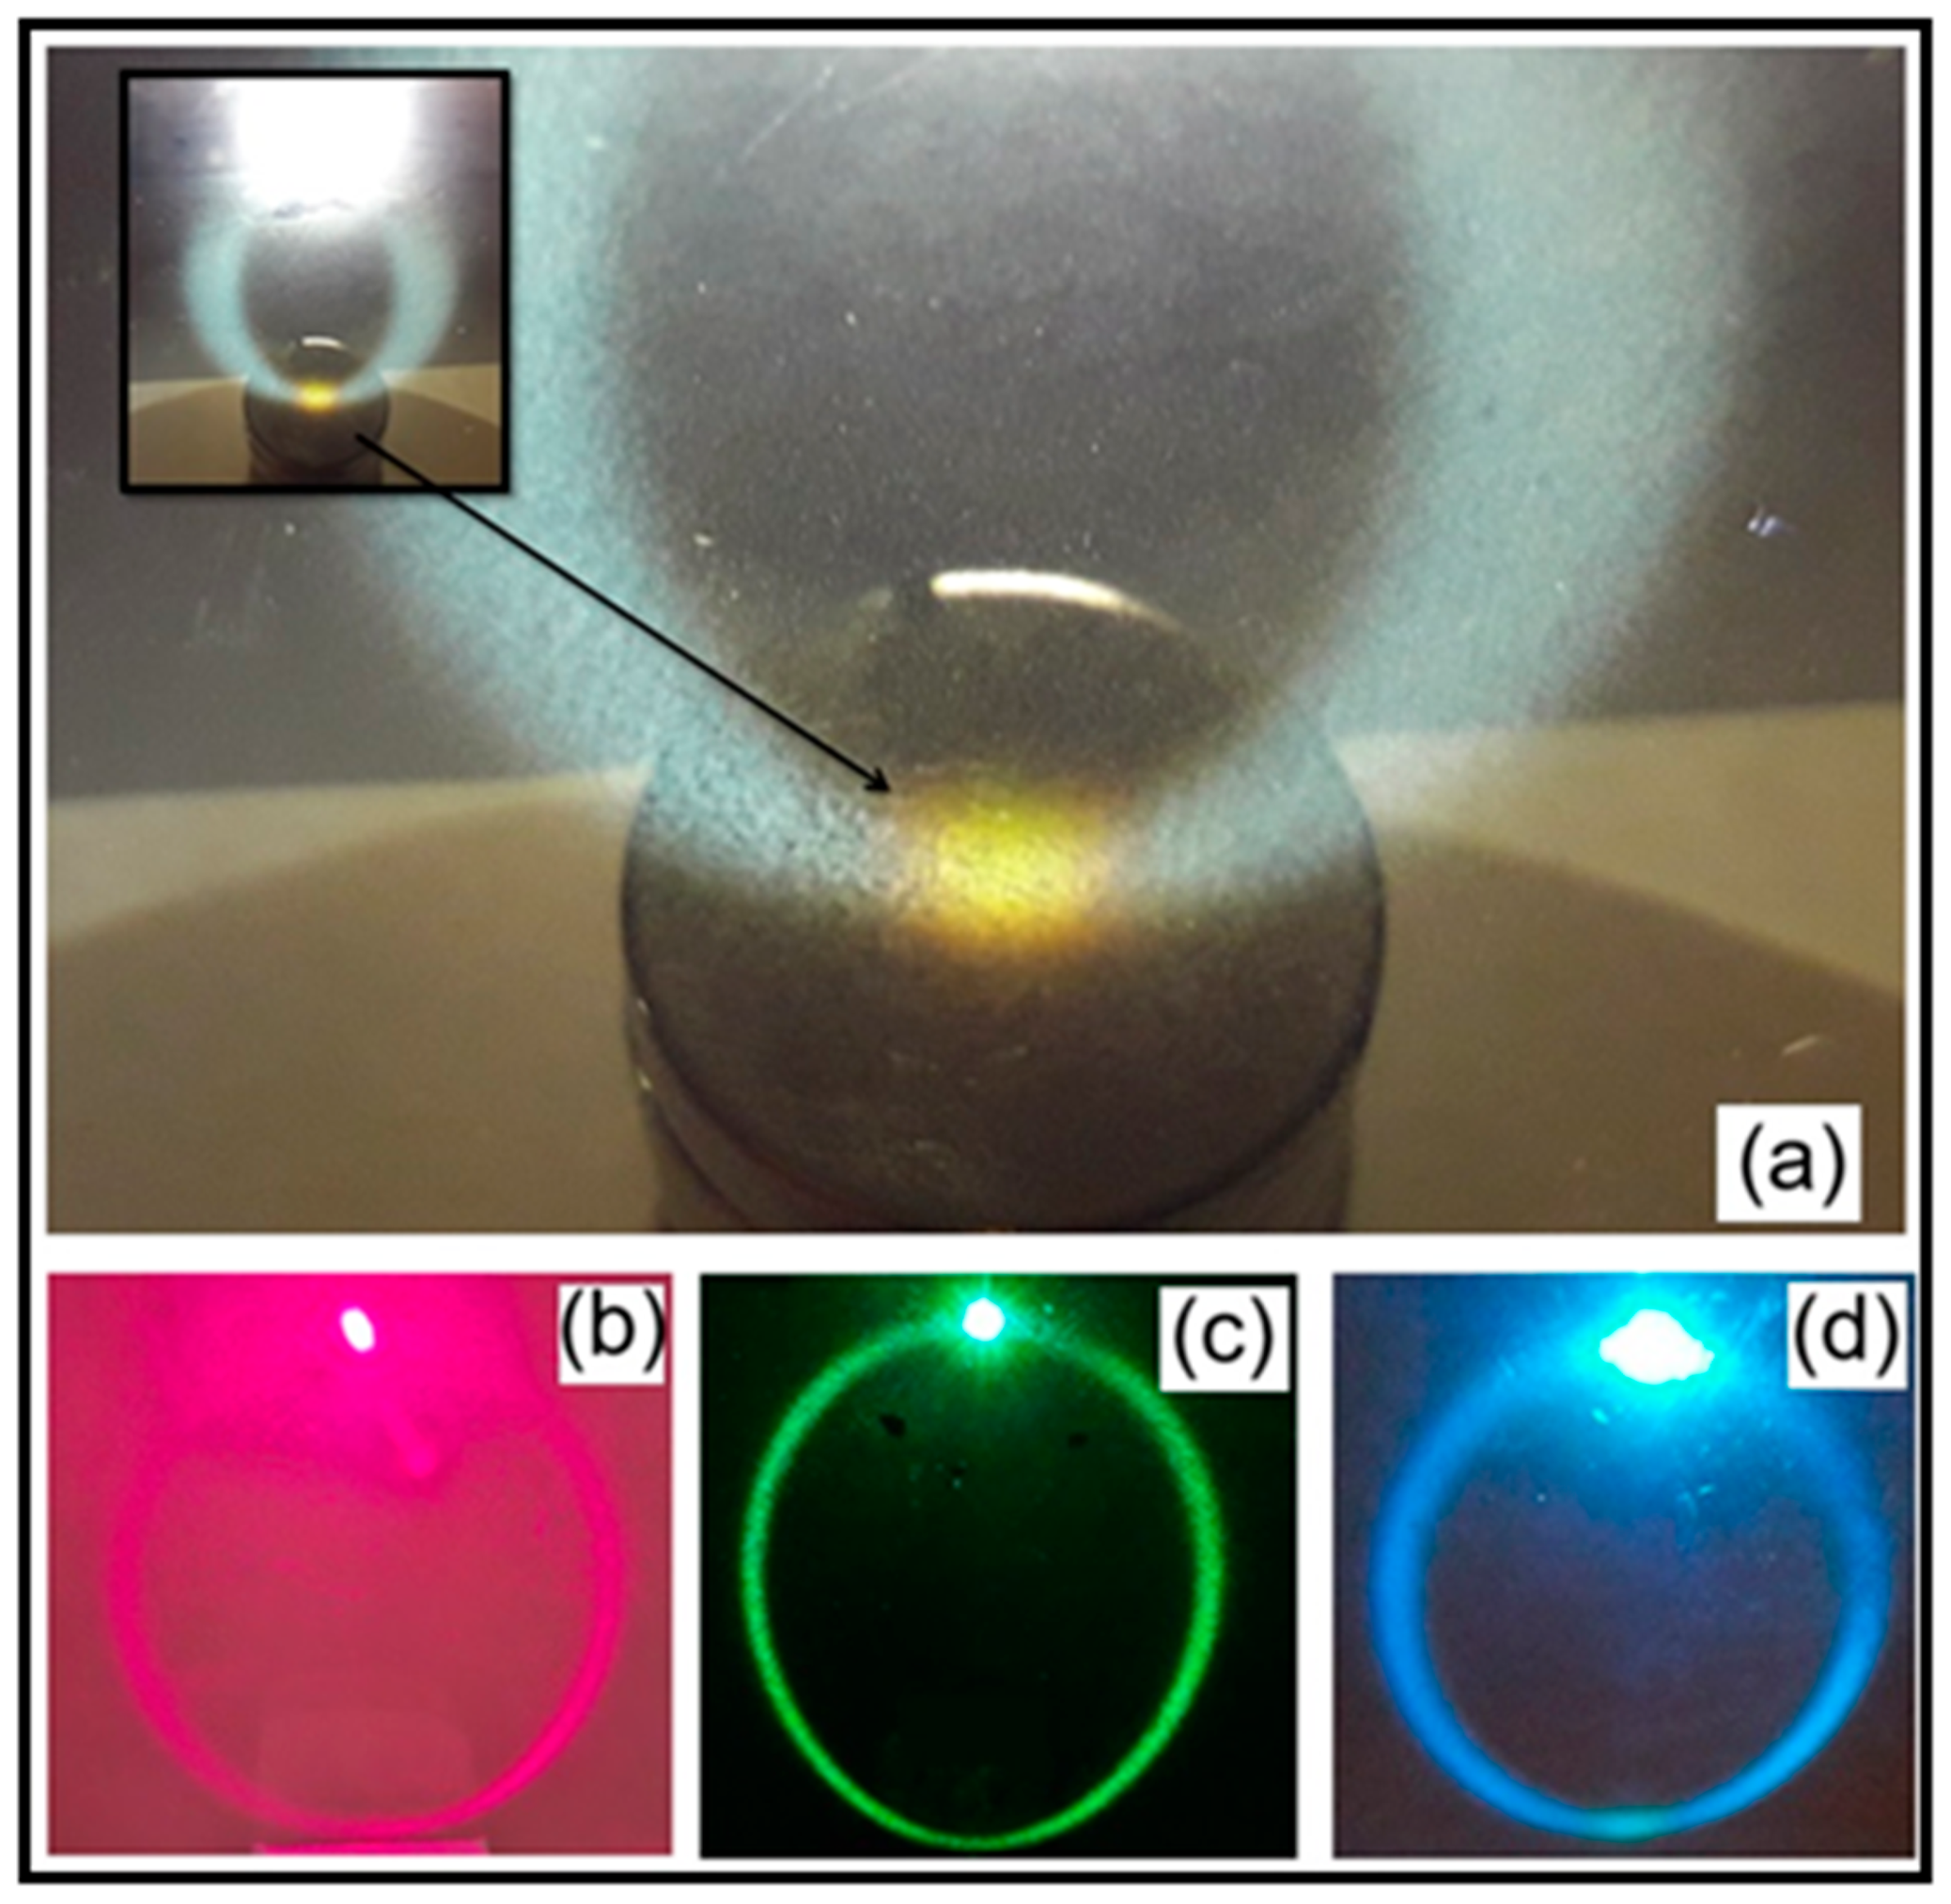
Figure 6 further illustrates the phenomena observed with multiple superimposed horocycles generated using white light, obtained at an optimal dilution ratio best suited to luminous pattern formation. In
Figure 6a, with one of the magnet’s poles positioned directly against the glass plate and illuminated by a white light source, several overlapping horocycles converge to form two prominent white branches. These branches distinctly converge towards a small region of maximal magnetic field intensity, as further detailed in the inset of
Figure 6a, with a yellowish color. In order to observe the magneto-optical effects across different wavelengths, we have obtained three Luminous Horocycles, as depicted in
Figure 6 for red (
Figure 6b), green (
Figure 6c), and blue light in
Figure 6d.
Based on thisevidence, colloidal crystals are a prime example of such nanometer-scale structures that produce structural colors. These periodic arrays of monodisperse microparticles are a prime example of three-dimensional (3D) photonic crystals [
14]. Their defining characteristic is the presence of photonic bandgaps within their dispersion spectrum. These photonic bandgaps represent forbidden regions for photons, arising from the spatial periodicity of the refractive indices between the colloidal microparticles and their surrounding dispersion medium. A crucial property of colloidal crystals, directly responsible for their structural colors, is their ability to exhibit visible light selection when composed of microparticles with diameters in the hundreds of nanometers. The wavelength (
λ) of this prominent reflection peak, which corresponds to the observed structural color, can be precisely calculated using Bragg’s equation:
where
n is the effective refractive index of the composite materials (microparticles and medium), d is the interparticle spacing of the colloidal crystal, and
θ is the angle of the incident light, also known as the Bragg angle.
To investigate the effects of an applied magnetic field on the photonic bandgaps for the transverse magnetic (TM) mode in photonic crystals [
15,
16,
17,
18], a simplified approach based on the plane wave method was employed [
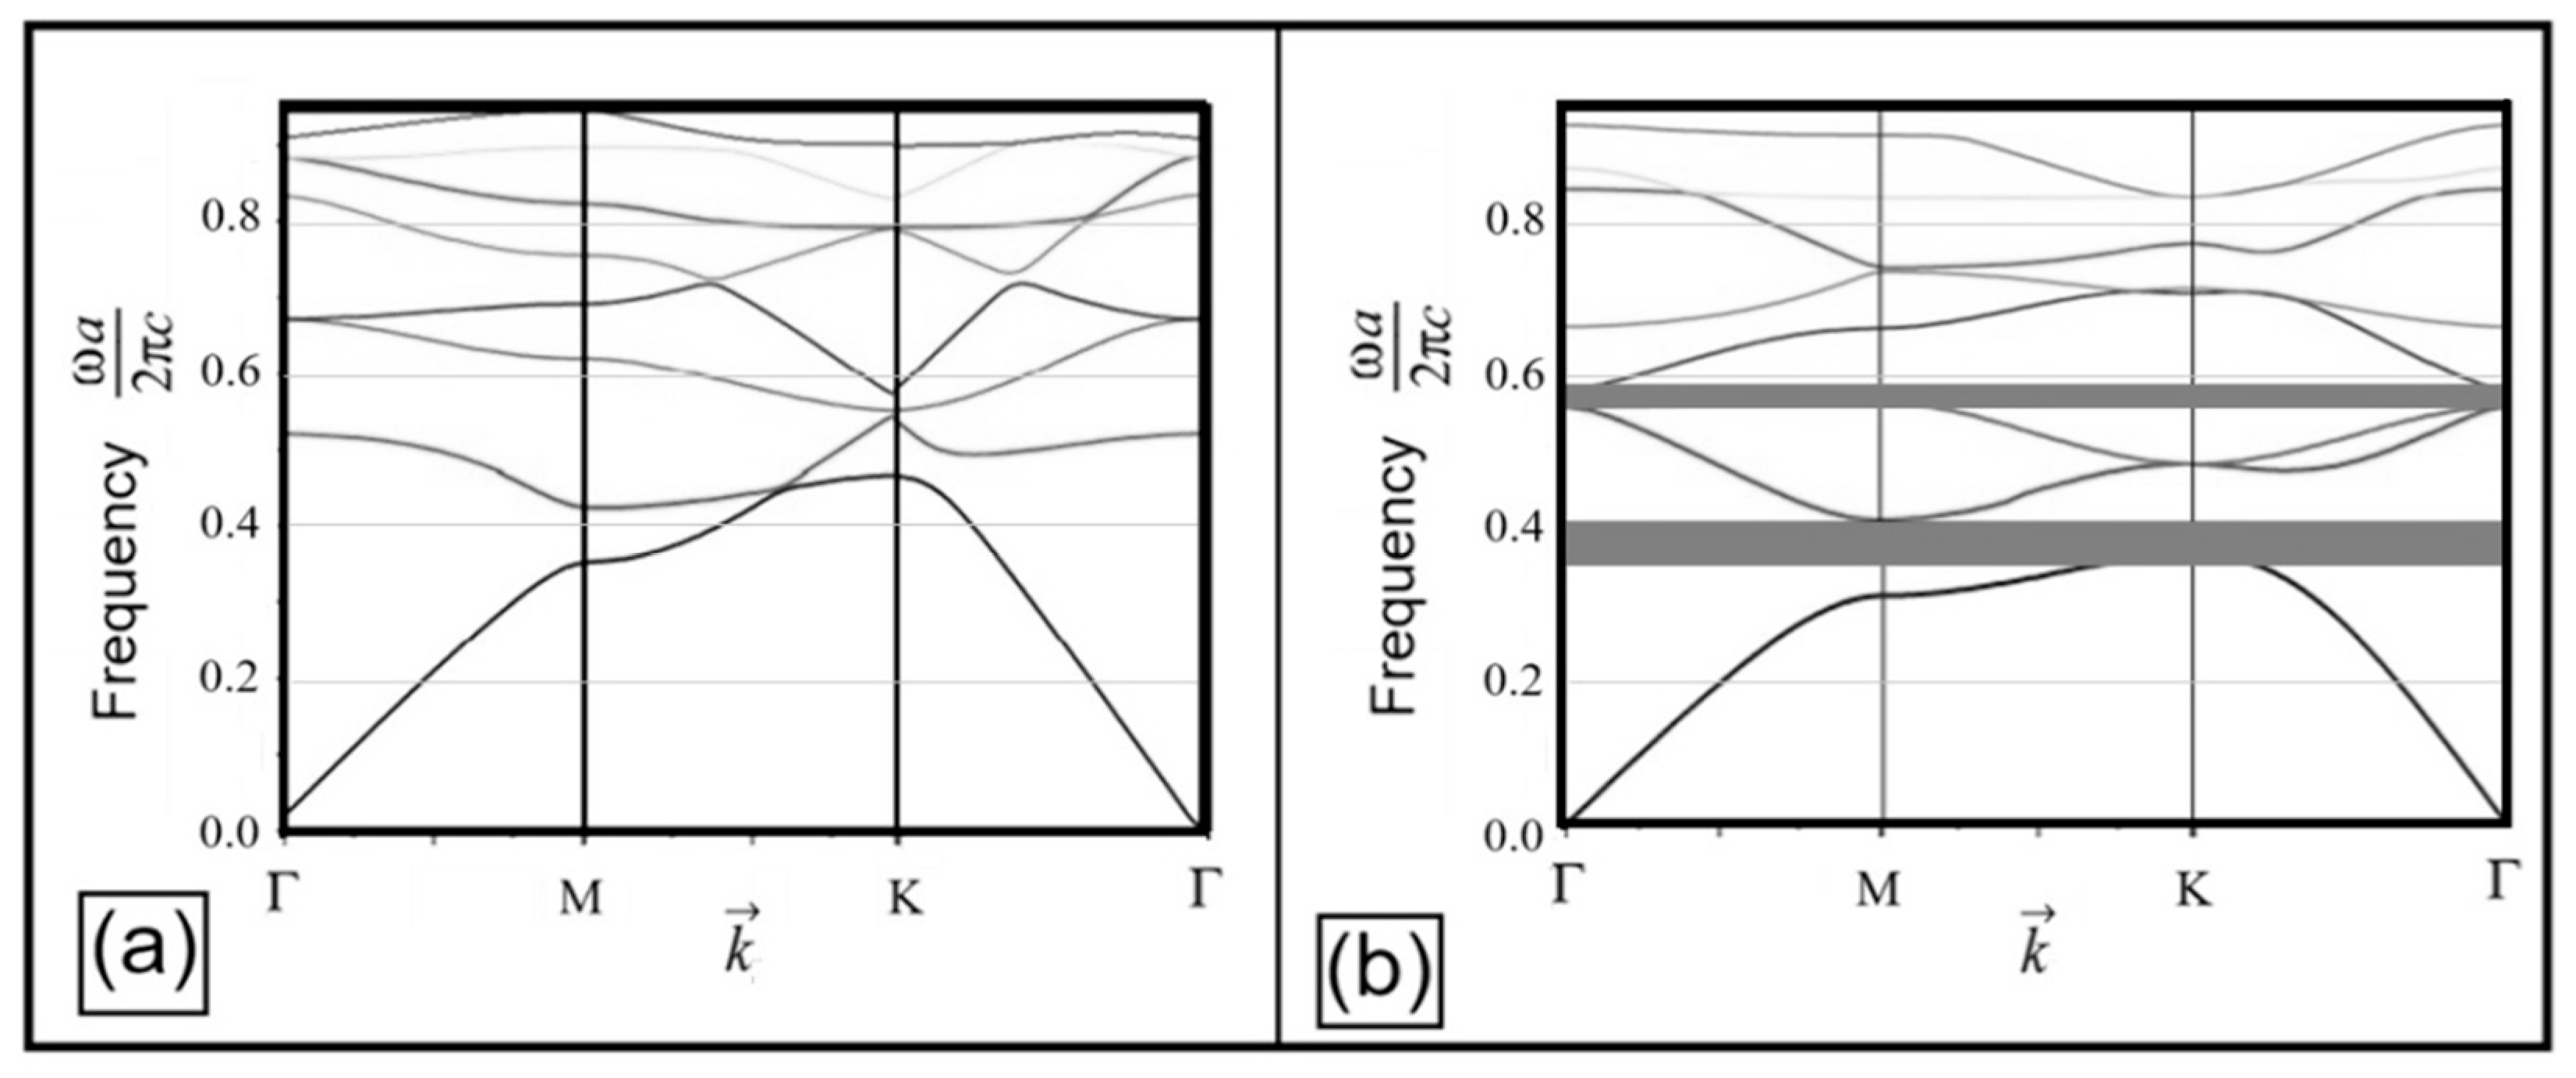
19]. This model considers a two-dimensional (2D) hexagonal lattice structure, and basically it considers a dependence of effective permittivity the liquid phase (mineral oil) and the effective permittivity of the needles of ferrofluid aligned with the magnetic field, creating the structure of the photonic crystal. The plot of the photonic bands is shown in
Figure 7. Frequencies were normalized as
ωa/(2
πc), where
ω is the angular frequency,
a is the lattice constant, and
c is the speed of light in vacuum. Our findings indicate the emergence of partial photonic bandgaps along the ΓM, MK, and KΓ directions within the Brillouin zone of this simplified photonic crystal, as the magnetic field intensity is increased from 0 to 0.3 T.
These results provide a computational link to understanding the observed structural colors and spectral modulation present in magneto-optical experiments using ferrofluids, as these colors arise from the interaction of light with such field-induced periodic structures, because the nanoparticle assemblies, when aligned by the magnetic field, form photonic structures that exhibit well-defined bandgaps, with specific wavelength ranges where light cannot propagate. With this simplified model, these bandgap features grow progressively more distinct as we increase the external magnetic field intensity.
5. Experiment and Simulation of Luminous Horocycles
To model the formation of the horocycle, a simulation was developed based on the premise that light primarily undergoes reflection and refraction within the thin ferrofluid film.
Figure 8a presents the pattern predicted by this simulation.
Figure 8b displays the experimental result for the same conditions as the simulation, using blue light for direct comparison.
Figure 8c provides a magnified view of the specific region within the experimental blue horoscope, where the magnetic field is perpendicular to the thin ferrofluid film. In this magnified view, the horocycle clearly alters its color from the original blue of the light source, further emphasizing the complex optical phenomena occurring.
A comparative analysis between the simulated horocycle pattern (
Figure 8a) and its experimental counterpart (
Figure 8b) reveals both notable similarities and significant discrepancies. The primary similarity lies in the overall geometric design of the luminous pattern, particularly the consistent positioning of the light source relative to the halo’s overall closed figure. The light source consistently appears at the superior position of the luminous halo in both simulated and experimental results, establishing a fundamental agreement in the gross morphology.
However, some crucial differences highlight limitations in the current simulation model of pure reflection mode. Firstly, the simulation in
Figure 8a predicts a thinning, or a decrease in the thickness, of each luminous branch in the region immediately adjacent to the light source. Conversely, the experiment in
Figure 8b shows the opposite effect, where the luminous branches are broader around the light source. Secondly, while the simulation depicts a largely uniform intensity across the luminous branches, the experimental results demonstrate a pronounced variation in light intensity, as it is shown in
Figure 8c. This intensity variation is particularly evident in the region of maximal magnetic field, where the observed color also shifts, as qualitatively illustrated in
Figure 9. Lastly, the simulation predicts a uniform halo in the area of highest magnetic field intensity of
Figure 9b. In sharp contrast, the plot in
Figure 9a obtained from the experiment reveals a distinct thinning of the luminous halo in this region, strongly suggesting the presence of two interference minima that are not accounted for by the current simulation’s model of light interaction. These discrepancies indicate that the simulation, which primarily considers simple reflection and refraction, does not fully capture the complex wave optics phenomena, such as wavelength-dependent interference and scattering, which govern the detailed optical properties of the ferrofluid in thin films for the region of maximum magnetic field intensity, where the magnetic field is perpendicular to the plane of the Ferrocell.
While the simulation’s simplified reflection model approximates the general shape of a horocycle, it cannot reproduce the intricate intensity variations and fine structural details resulting from precise wavefront manipulation through diffraction. This limitation becomes evident when comparing the simulation’s uniform intensity predictions with the experimentally observed patterns, which exhibit distinct bright peaks and dark troughs due to constructive and destructive interference phenomena that a basic ray-tracing approach inherently misses.
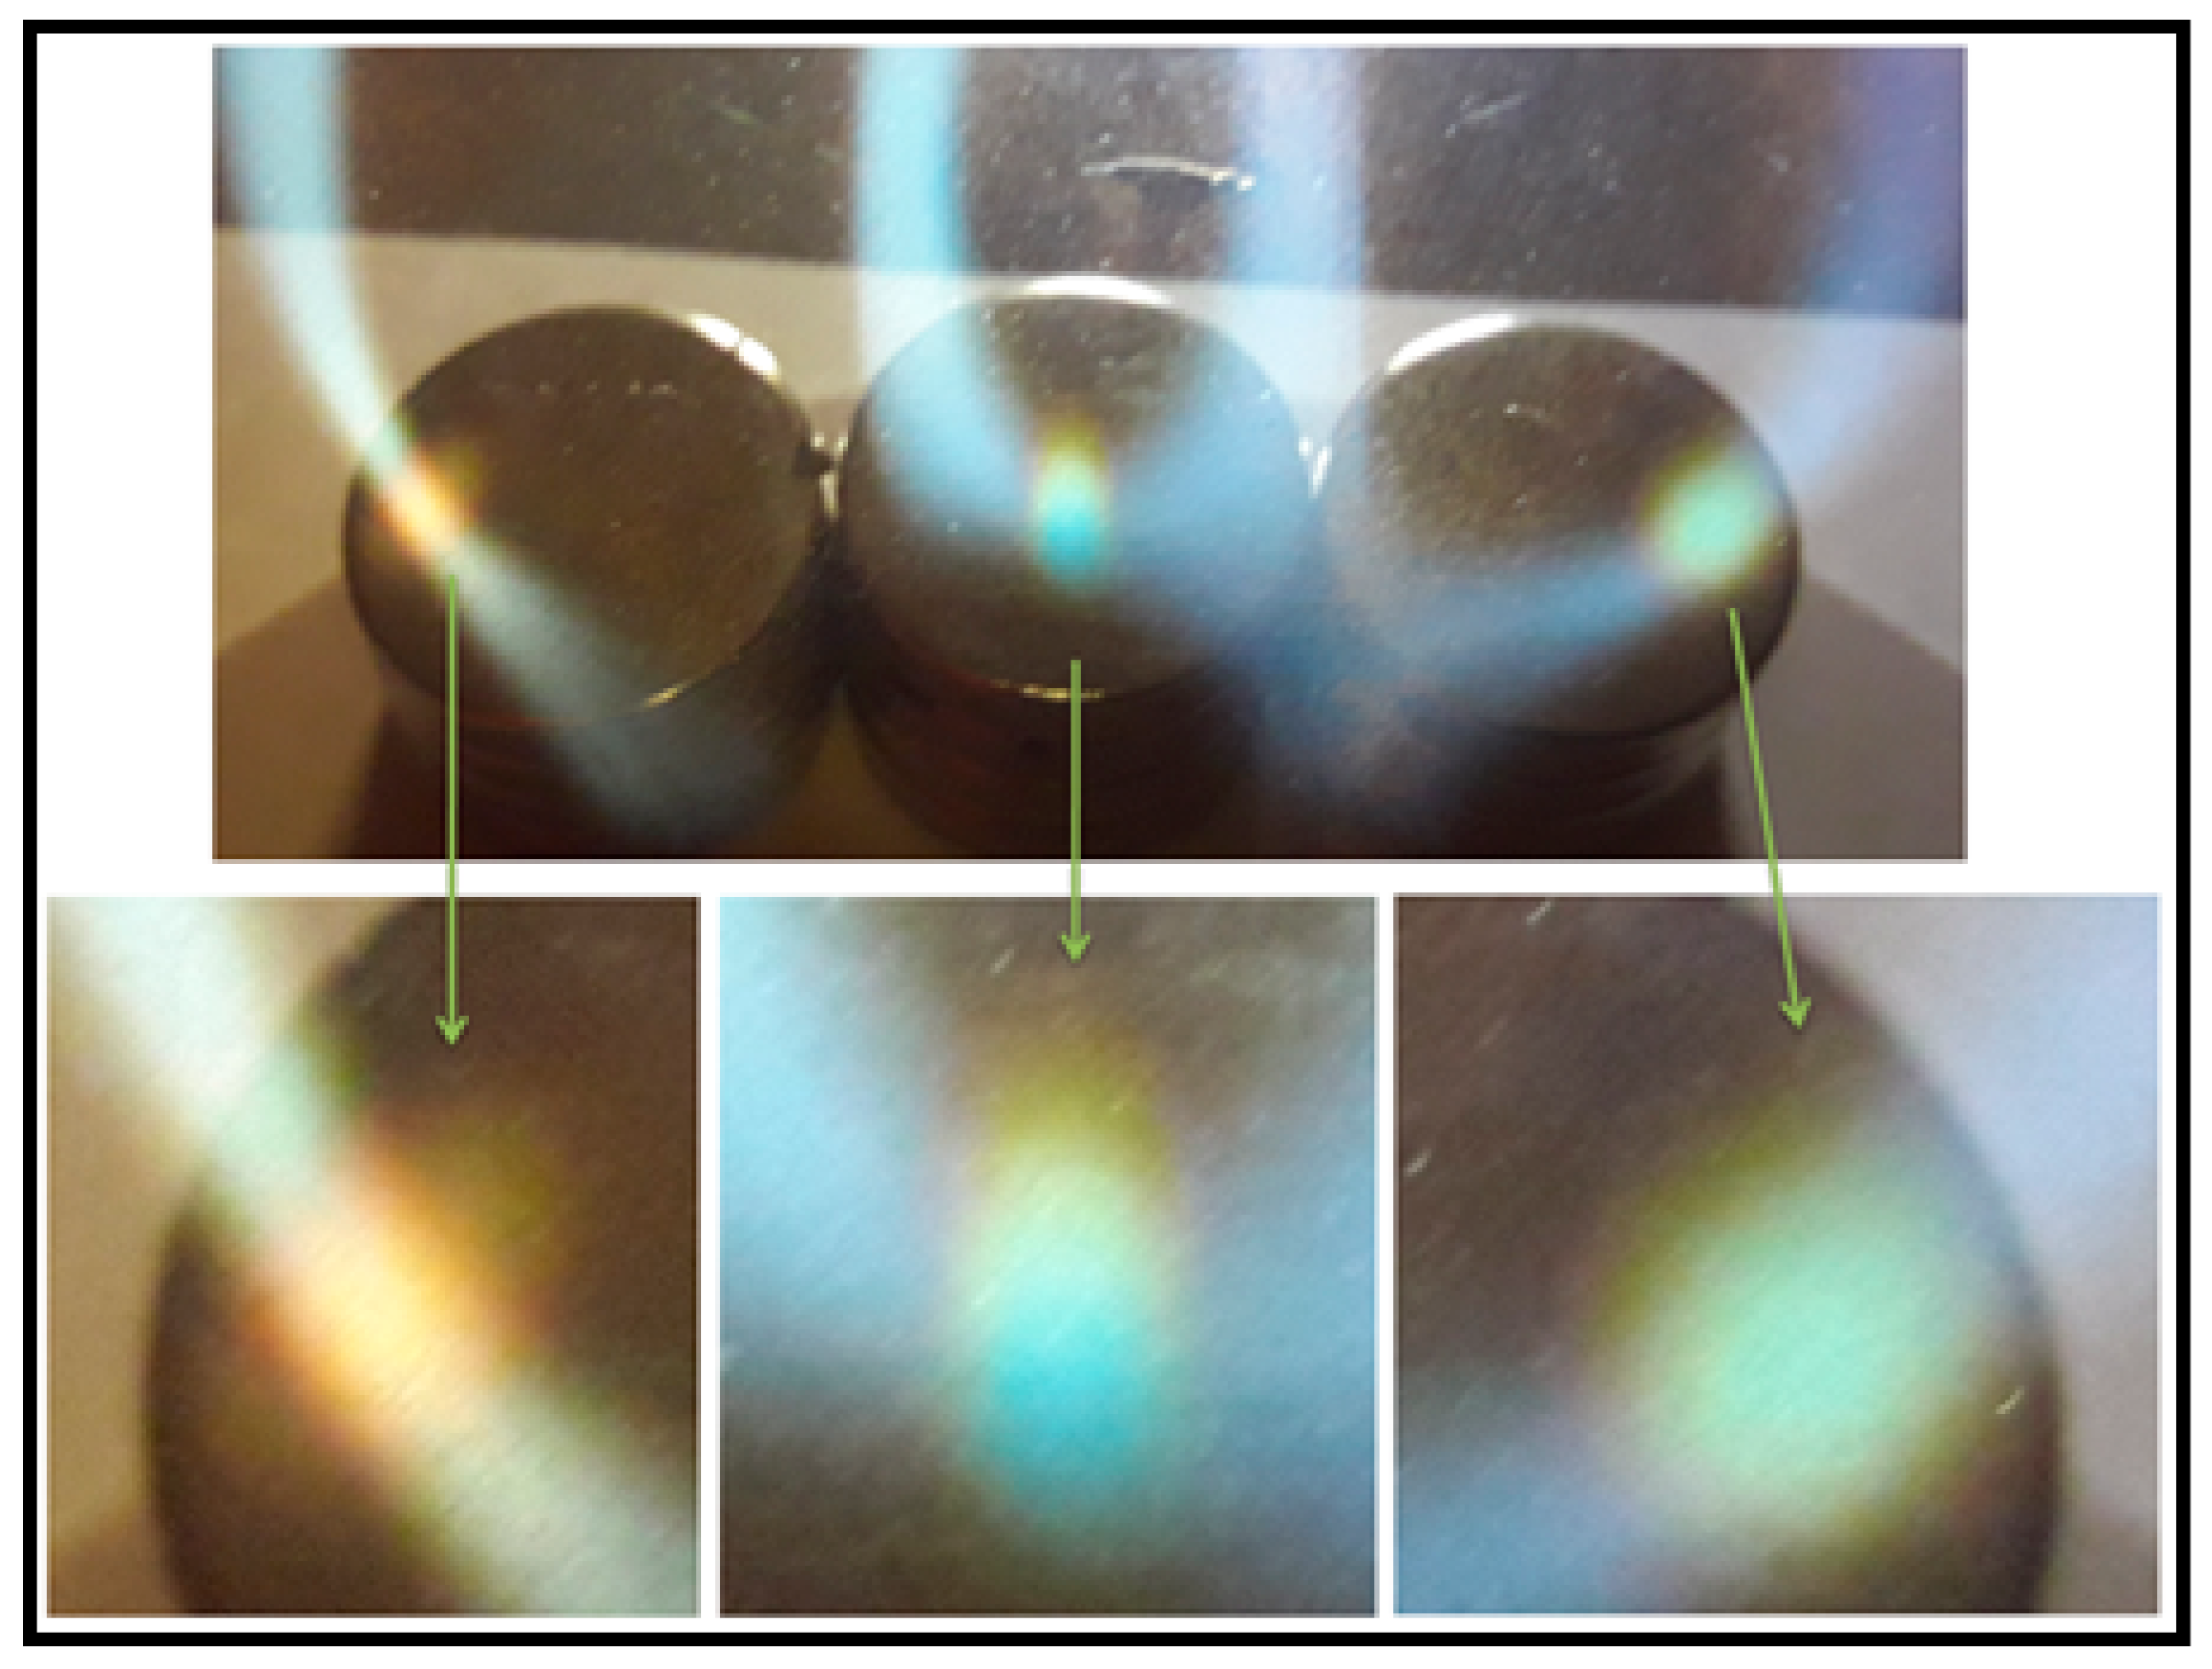
To conclude this topic and prepare our analysis for the next section, we present
Figure 10, with the same configuration as
Figure 4 but enlarging the colored points with their structural colors [
14] visibly highlighted in the zoom of each point.
6. Probing Diffraction Minima
To further verify the structural characteristics within different regions of the observed horocycle pattern, a comprehensive series of experiments was meticulously conducted. In this methodology, a highly collimated laser beam was precisely directed to various distinct points across the horocycle, allowing for the localized interrogation of the ferrofluid’s microstructure. The resultant diffraction patterns, arising from the interaction and scattering of light off the intricate arrangement of ferrofluid particles, were subsequently projected onto a screen, enabling both qualitative observation and quantitative analysis. An important observation, for instance, occurred in the specific region corresponding to the point of maximal magnetic field intensity within the ferrofluid, observed in previous experiments. Here, the two-dimensional diffraction pattern consistently exhibited a prominent, bright central spot. This central spot is unequivocally attributed to the direct, undiffracted incidence of the laser beam, serving as a critical reference point for all subsequent angular measurements. This central undiffracted spot was invariably surrounded by a distinct circular halo, a phenomenon observed consistently across various monochromatic laser sources, including red (650 nm), green (532 nm) lasers, and blue (400 nm). In
Figure 11a,b, we present the case for the color green. In
Figure 11c,d, the obtained diffraction pattern distinctly displayed a hyperbola featuring two minima at its center.
Using the Bragg’s equation (Equation(4)), we have measured the angle
θ:
where
λ is the wavelength of laser and
davg is the average distance between the randomly points. We have obtained
davg = 4.3 µm. We observed that halos are more prominent with blue and green light compared to red light, as illustrated in
Figure 12 for three different laser colors. This finding suggests that the red laser’s longer wavelength diminishes its ability to effectively resolve the 4.3 µm average particle spacing. Specifically, the
λ/
davg ratio is too large for the red laser to produce a distinct and intensely bright diffraction halo, unlike those formed by the green and blue lasers. The laser scattering experiment at the point of maximal magnetic field intensity (where the field is likely perpendicular to the film) provides direct evidence that the diffraction from the magnetically induced microstructures behaves differently for each wavelength, with their optical properties governed by magneto-optical effects.
From these results, the iridescent points in some horocycle patterns and for the case of
Figure 10 emerge due to selective diffraction, where different wavelengths are scattered at distinct angles, almost like a narrow band filter [
20,
21]. This phenomenon occurs exclusively in regions with carefully controlled magnetic fields, while areas with weaker or differently oriented fields show no structural color. This spatial variation confirms that magnetic fields can induce specific nanoparticle assemblies with precise optical properties, transitioning from disordered scattering states to organized structures capable of wavelength-selective interference. However, based on the results of
Figure 11, these structures are not true photonic crystals, which require perfect long-range periodicity, but rather resemble a photonic glass [
22,
23,
24], where short-range order manipulates light, just as other optical effects are observed in magneto-optical systems of the same nature [
25,
26,
27,
28,
29,
30,
31,
32,
33,
34,
35].
7. Conclusions
Our findings reveal that magnetized ferrofluids function as highly dynamic magneto-optical media, where incident light interacts with self-assembled, anisotropic nanoparticle structures. The observed chromatic shifts, particularly pronounced in regions exposed to strong perpendicular magnetic fields, are compelling evidence of structural coloration. This phenomenon arises from wavelength-selective interference and diffraction, echoing behaviors found in photonic crystals, though without their strict long-range periodicity. Here, the magnetic field precisely induces specific, optically active self-assemblies in the ferrofluid particles, transitioning them from a more amorphous scattering state to one capable of generating vivid structural colors. This induced quasi-order, while demonstrating remarkable optical properties, does not constitute a true photonic crystal, instead, it is more akin to a photonic glass or a disordered photonic material, leveraging short-range order to manipulate light.
Furthermore, monochromatic laser experiments were fundamental in confirming the direct correlation between laser color and diffracted light color, and in probing anisotropic diffraction features like hyperbolas, offering direct insights into the orientation and morphology of the underlying ferrofluid aggregates. These experiments highlight the profound ability of precisely controlled magnetic fields to dynamically manipulate light scattering and color generation. The differences between our simulations using the pure reflection model and experimental observations underscore the necessity for more advanced wave-optics models. For future studies, we propose developing comprehensive optical models that incorporate wave optics phenomena and dynamic microstructural reorganization under magnetic fields. Such advanced modeling will bridge current theoretical limitations and enable the precise control of magneto-optical responses for applications in tunable photonic devices.
