Article

Terahertz Time-Domain Spectroscopy of Substituted Gadolinium Gallium Garnet

1
Institute of Laser Engineering, Osaka University, 2-6 Yamadaoka, Suita, Osaka 565-0871, Japan
2
Department of Electrical Engineering and Information Systems, Graduate School of Engineering, The University of Tokyo, 7-3-1 Hongo, Bunkyo-ku, Tokyo 113-8656, Japan
*
Author to whom correspondence should be addressed.
Condens. Matter 2025, 10(1), 1; https://doi.org/10.3390/condmat10010001
Submission received: 10 September 2024 / Revised: 17 December 2024 / Accepted: 19 December 2024 / Published: 25 December 2024

Abstract

:
Temperature dependence of the lowest frequency transverse optical phonon (TO1) in a single crystal Substituted Gadolinium Gallium Garnet (SGGG, (001)) was studied using terahertz time-domain spectroscopy at temperatures between 80 K and 500 K. The complex dielectric constants were calculated from the optical constants fitting with the Lorentz oscillator model. The results show that the TO1 phonon of SGGG is at 2.5 THz at room temperature, the frequency of the TO1 phonon slightly decreases, and the dumping factor clearly increases with increasing temperature. Additionally, our results demonstrate that even a small substitution can induce a phonon shift, leading to higher absorption and causing a slight degradation in thermal stability. Our work is expected to support the development of magneto-optical and spintronic devices.

1. Introduction

Gadolinium Gallium Garnet ( G d 3 G a 5 O 12 , GGG) has attracted considerable research interest due to its unique crystalline structure, chemical stability, and excellent electrical/optical properties, leading to numerous studies focused on its applications in spintronic/optical devices and scintillators [1,2,3,4,5]. GGG has also become important as a substrate for various thin film growths [6,7]. Some of these films can transport spin waves, suggesting potential applications in low-power-consumption spintronic devices for next-generation data processing [8]. The quality and functionality of the films strongly depend on the mismatch between the films and substrates; thus, the substitution of host elements into GGG, known as Substituted Gadolinium Gallium Garnet (SGGG), has garnered significant attention [9]. For example, Calcium substitutes a dodecahedral cation site, while Magnesium and Zirconium substitute octahedral and tetrahedral cation sites, respectively. A recent study evaluated the effects of substitution concentrations on the lattice constants, growth difficulty, and thermal expansion coefficients [9]. By aligning the properties of SGGG to the film materials, the mismatch of the crystal lattice can be minimized, and the performance of the devices based on this technique can be improved. Another recent research study reports the magneto-optical response of SGGG and its giant Faraday rotation effect at low temperatures [10]. This significant Faraday rotation can be applied in magneto-optical devices that cover the broad frequency band, from the THz to visible regimes. It is thus indispensable to the study of low-frequency phonons, such as transverse optical (TO) phonons, for future spintronic device applications [8,11,12]. The frequency of the lowest TO phonon (TO1) is generally located at the THz frequency region. Although the dielectric properties and phonon response of GGG have been well studied in the infrared regimes by many methods, the TO1 phonons in SGGG have not yet been studied as much.
In the present work, we study the temperature dependence of the TO1 phonon in (001) SGGG by means of an air-plasma-based terahertz time-domain spectroscopy (THz-TDS). The complex dielectric constants were calculated from 80 K to 500 K, and their temperature dependence was discussed by fitting the complex dielectric constants with the Lorentz oscillator model. The data at room temperature were validated using a high-resolution commercial THz-TDS system. Due to the limited studies on SGGG, an approximation was made to discuss the contributions from thermal expansion and phonon anharmonicity with increasing temperature. Our THz-TDS study is expected to support the development of spintronic devices and also address gaps in the THz regime research.

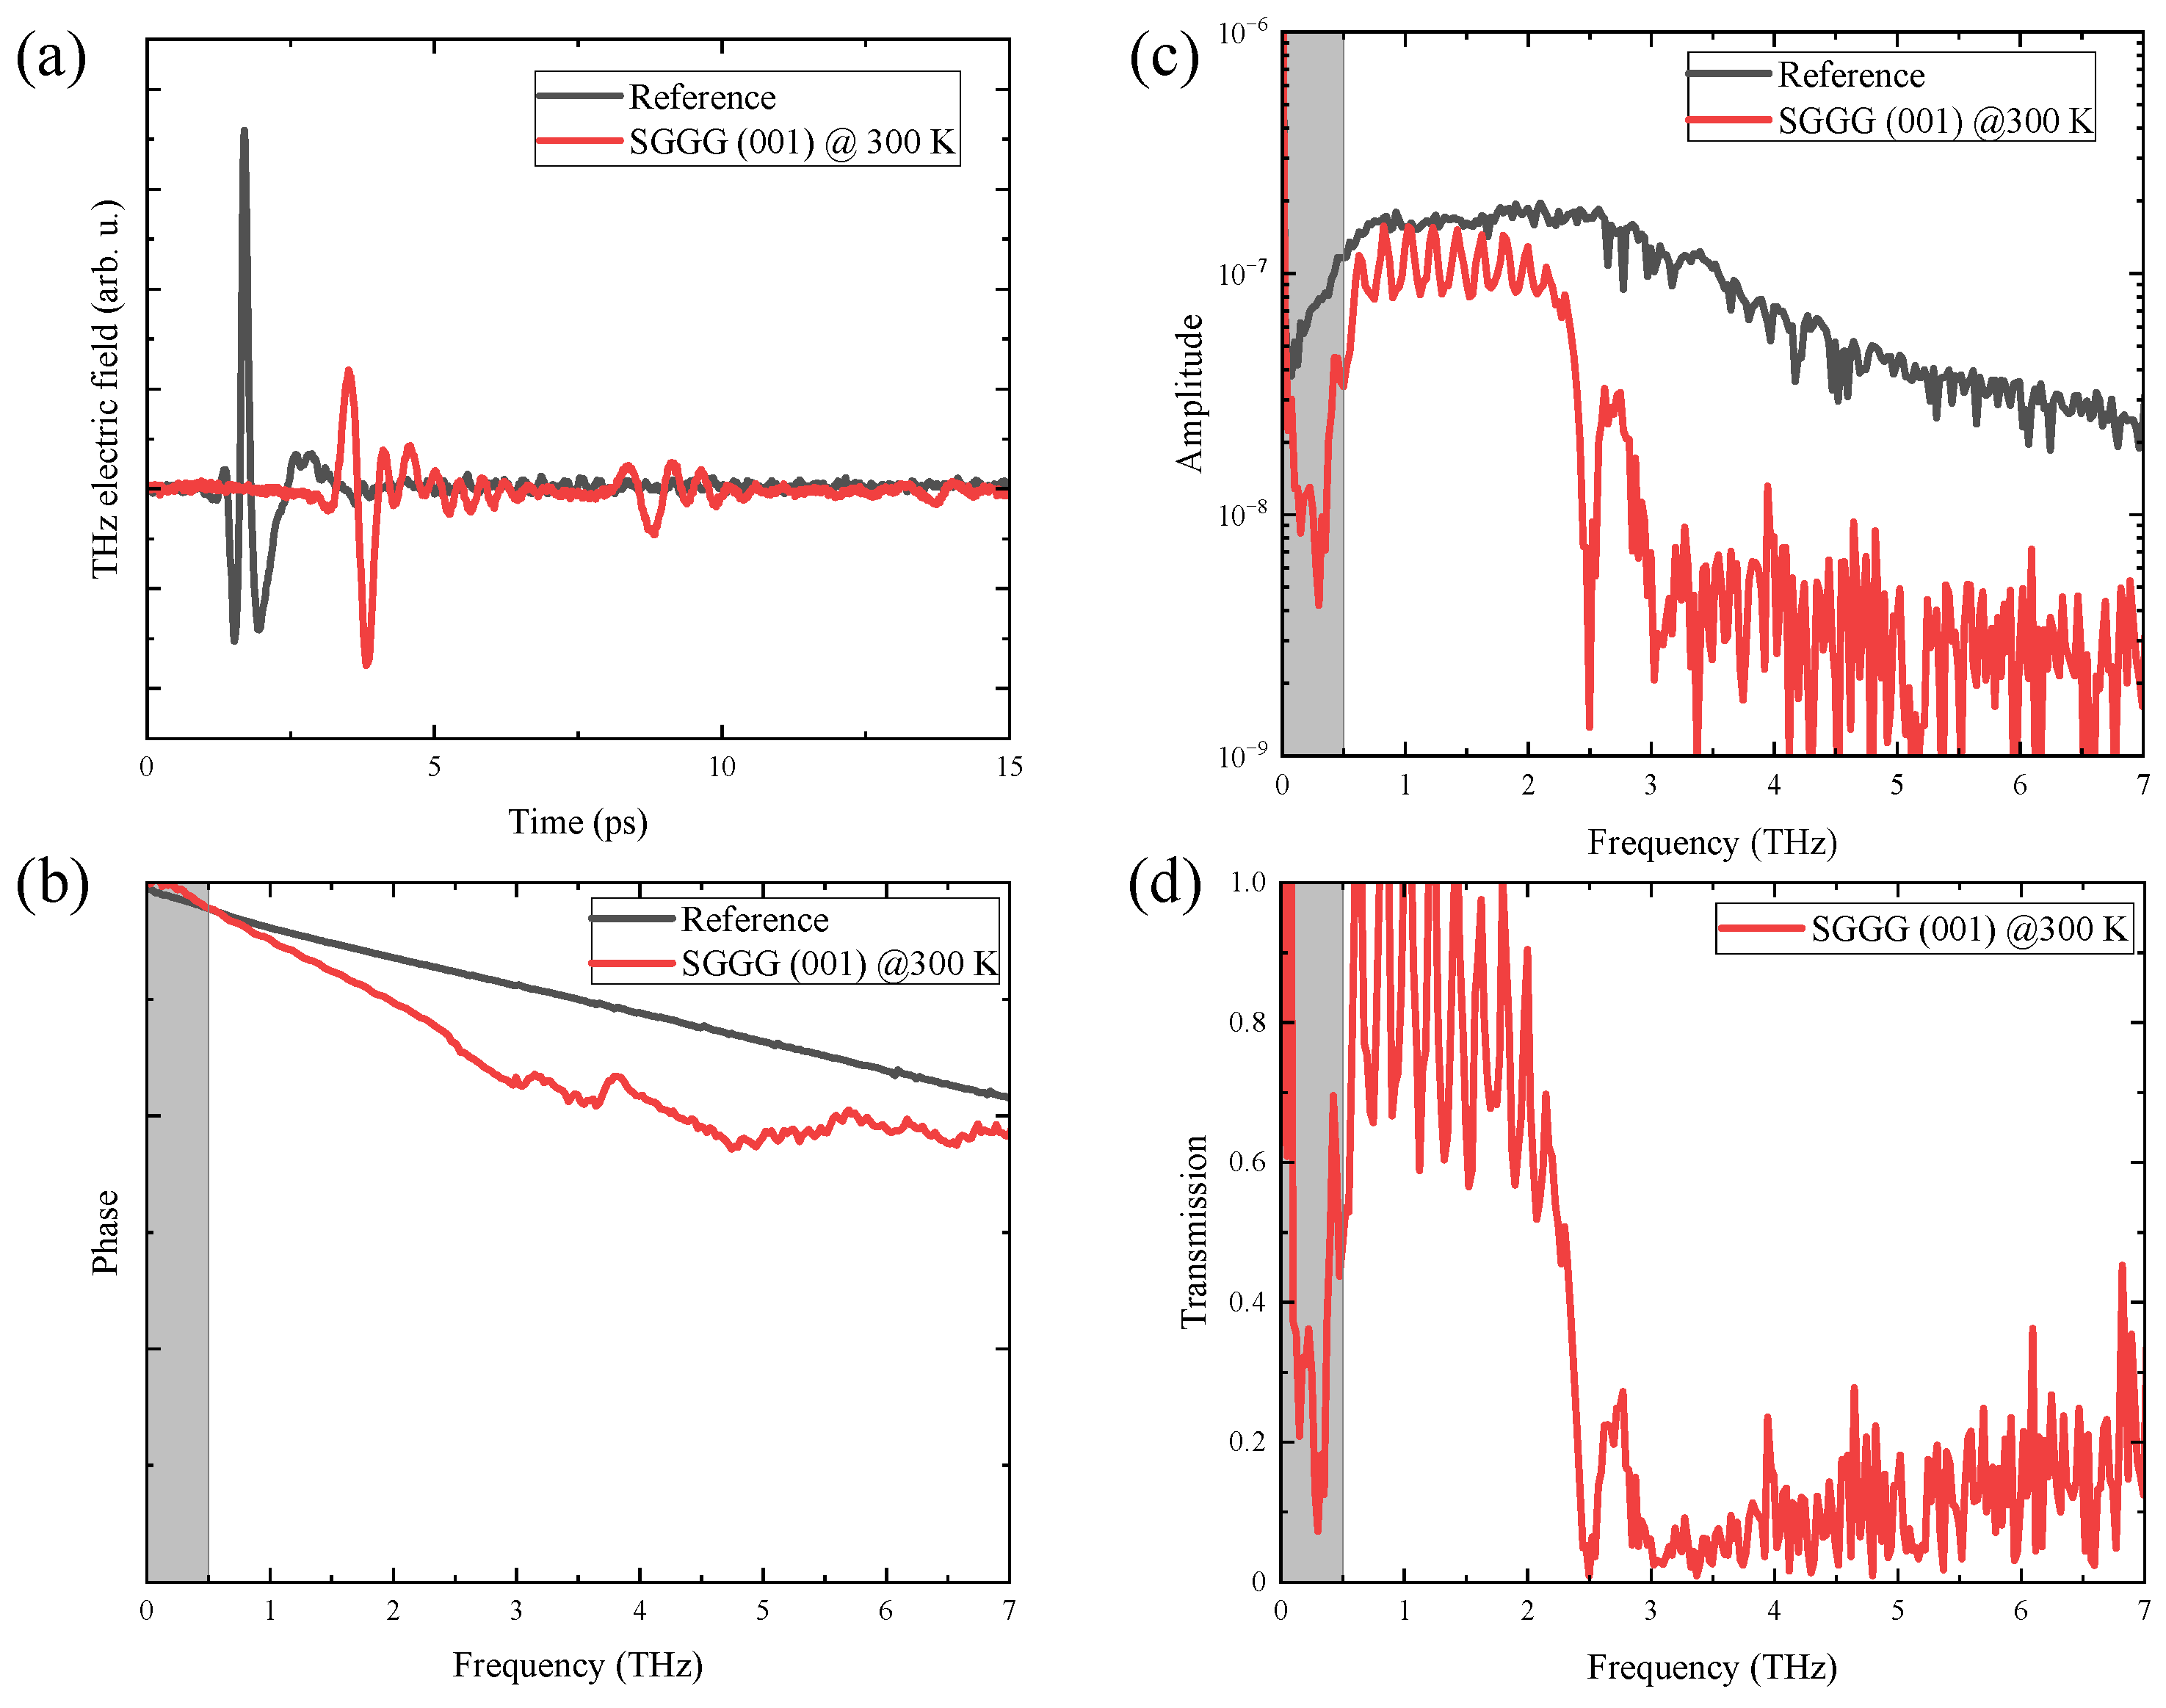
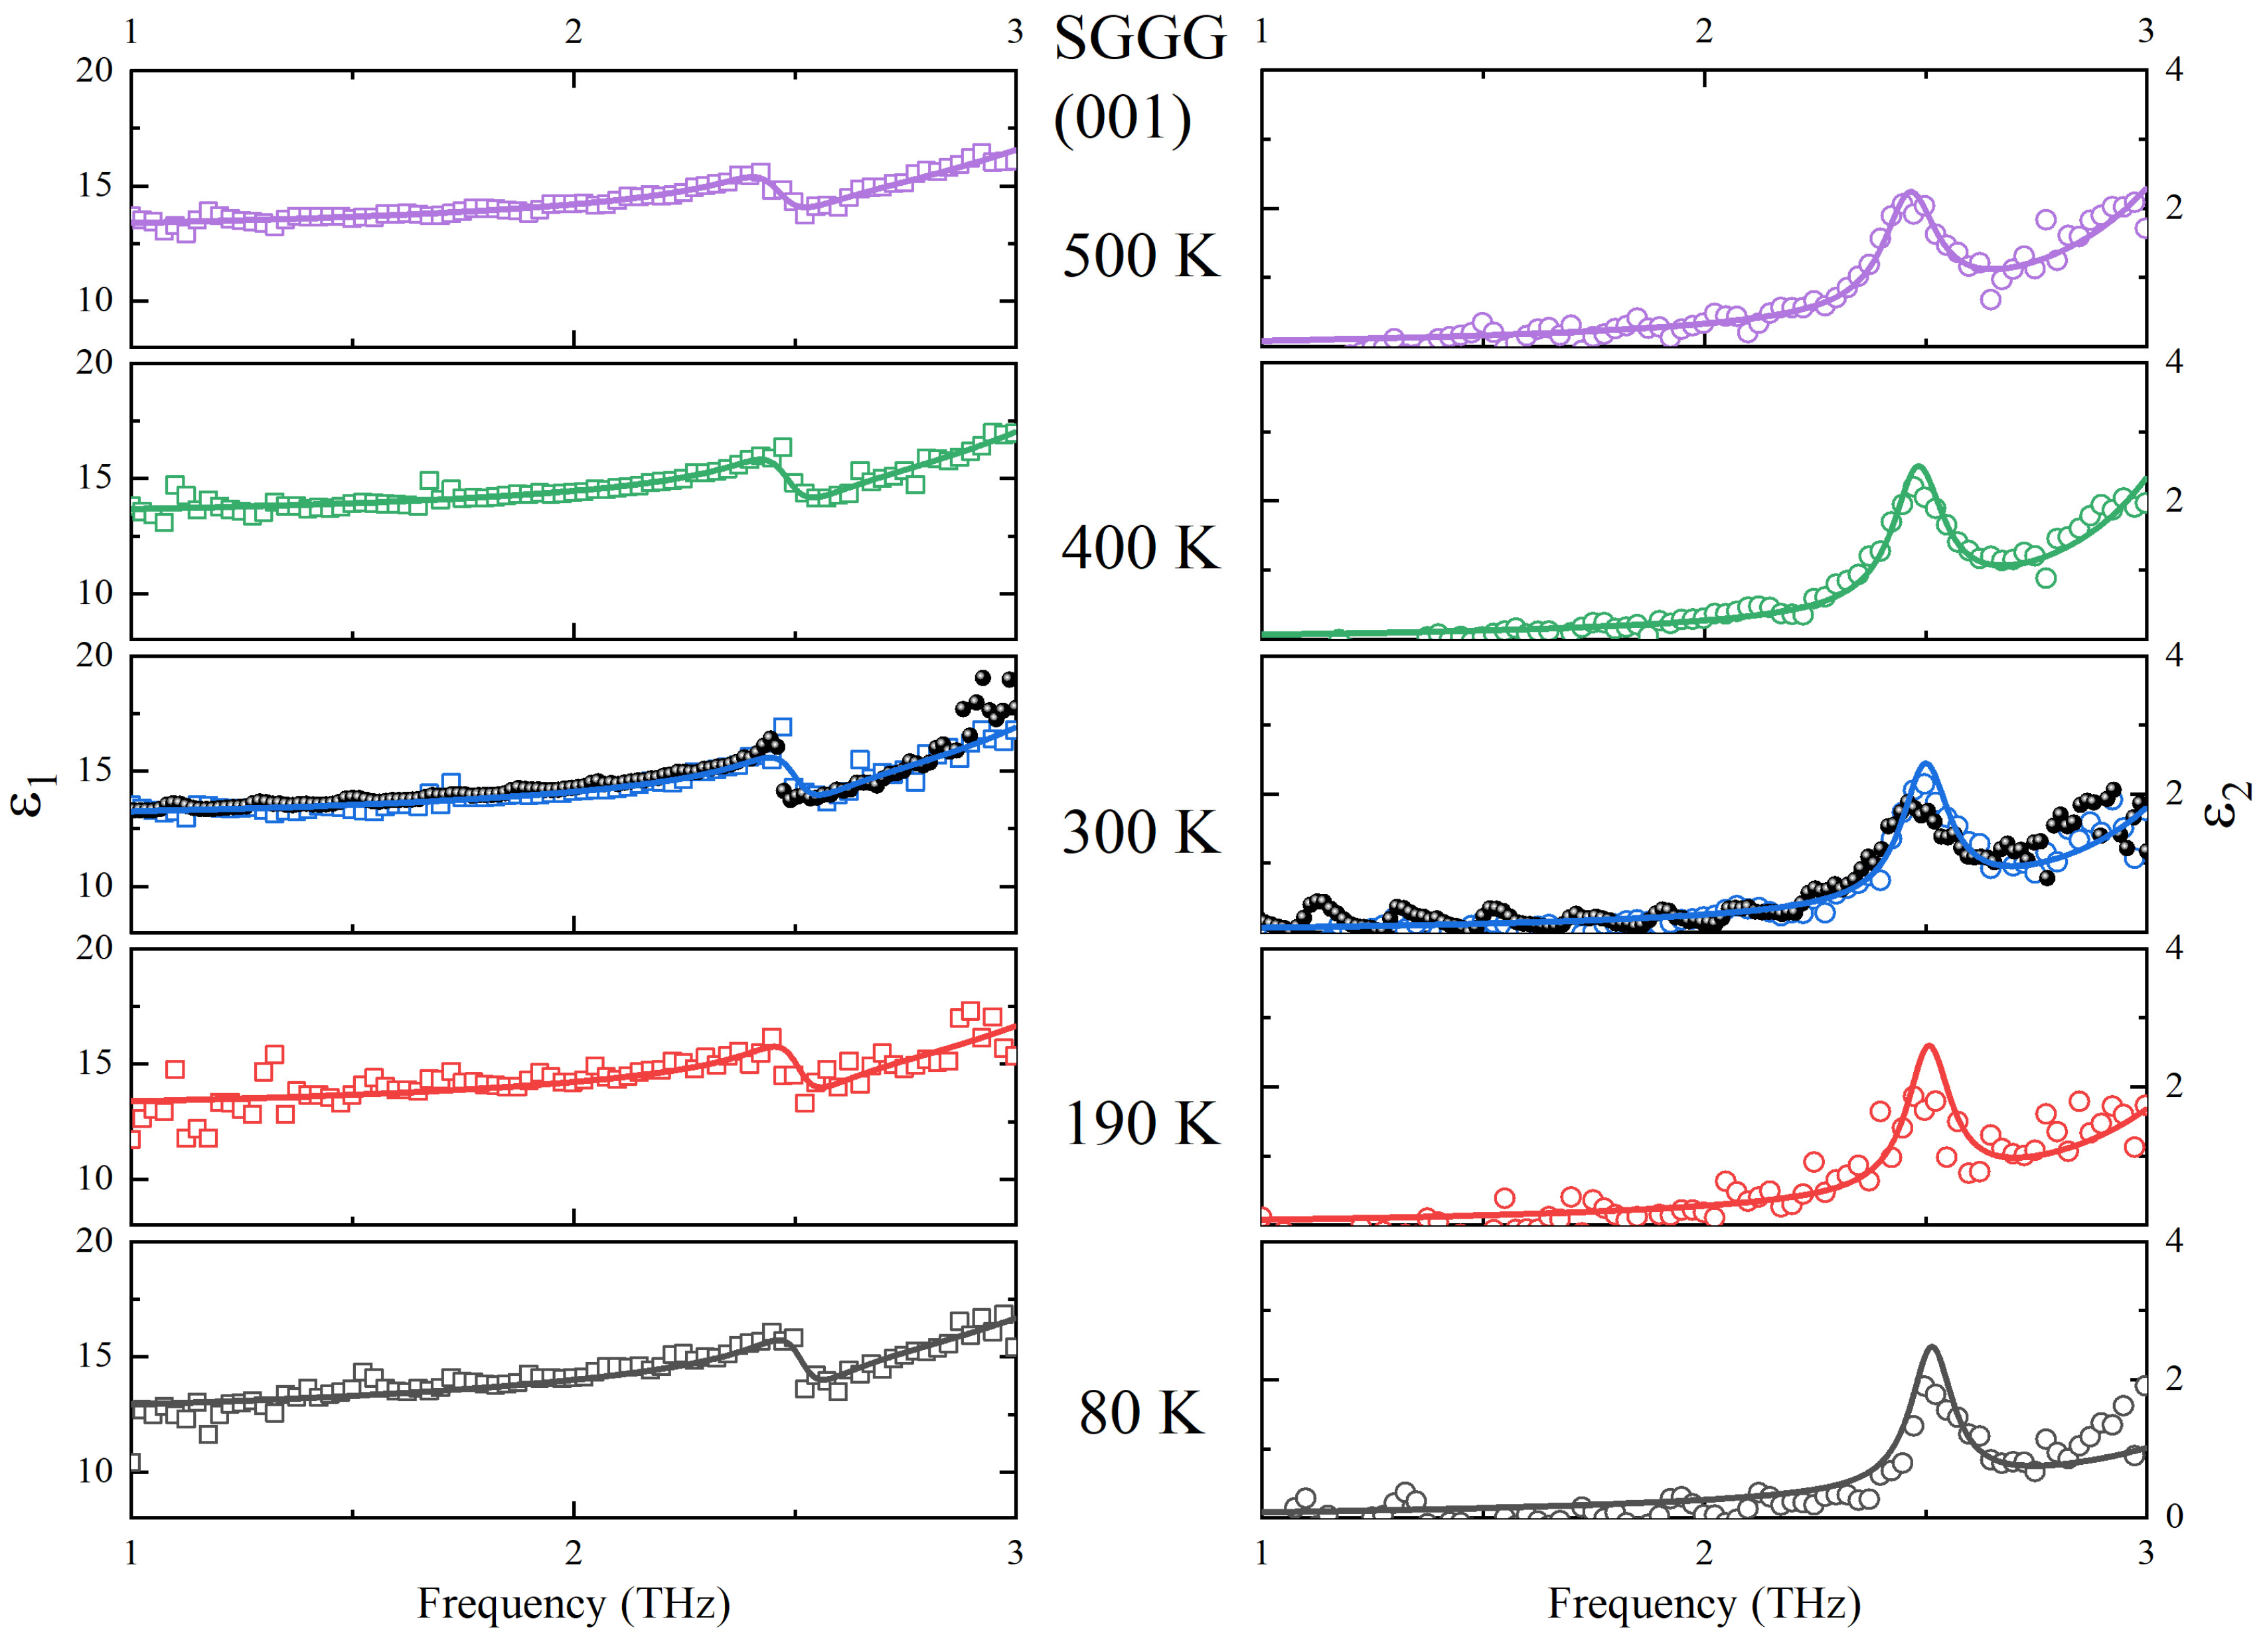
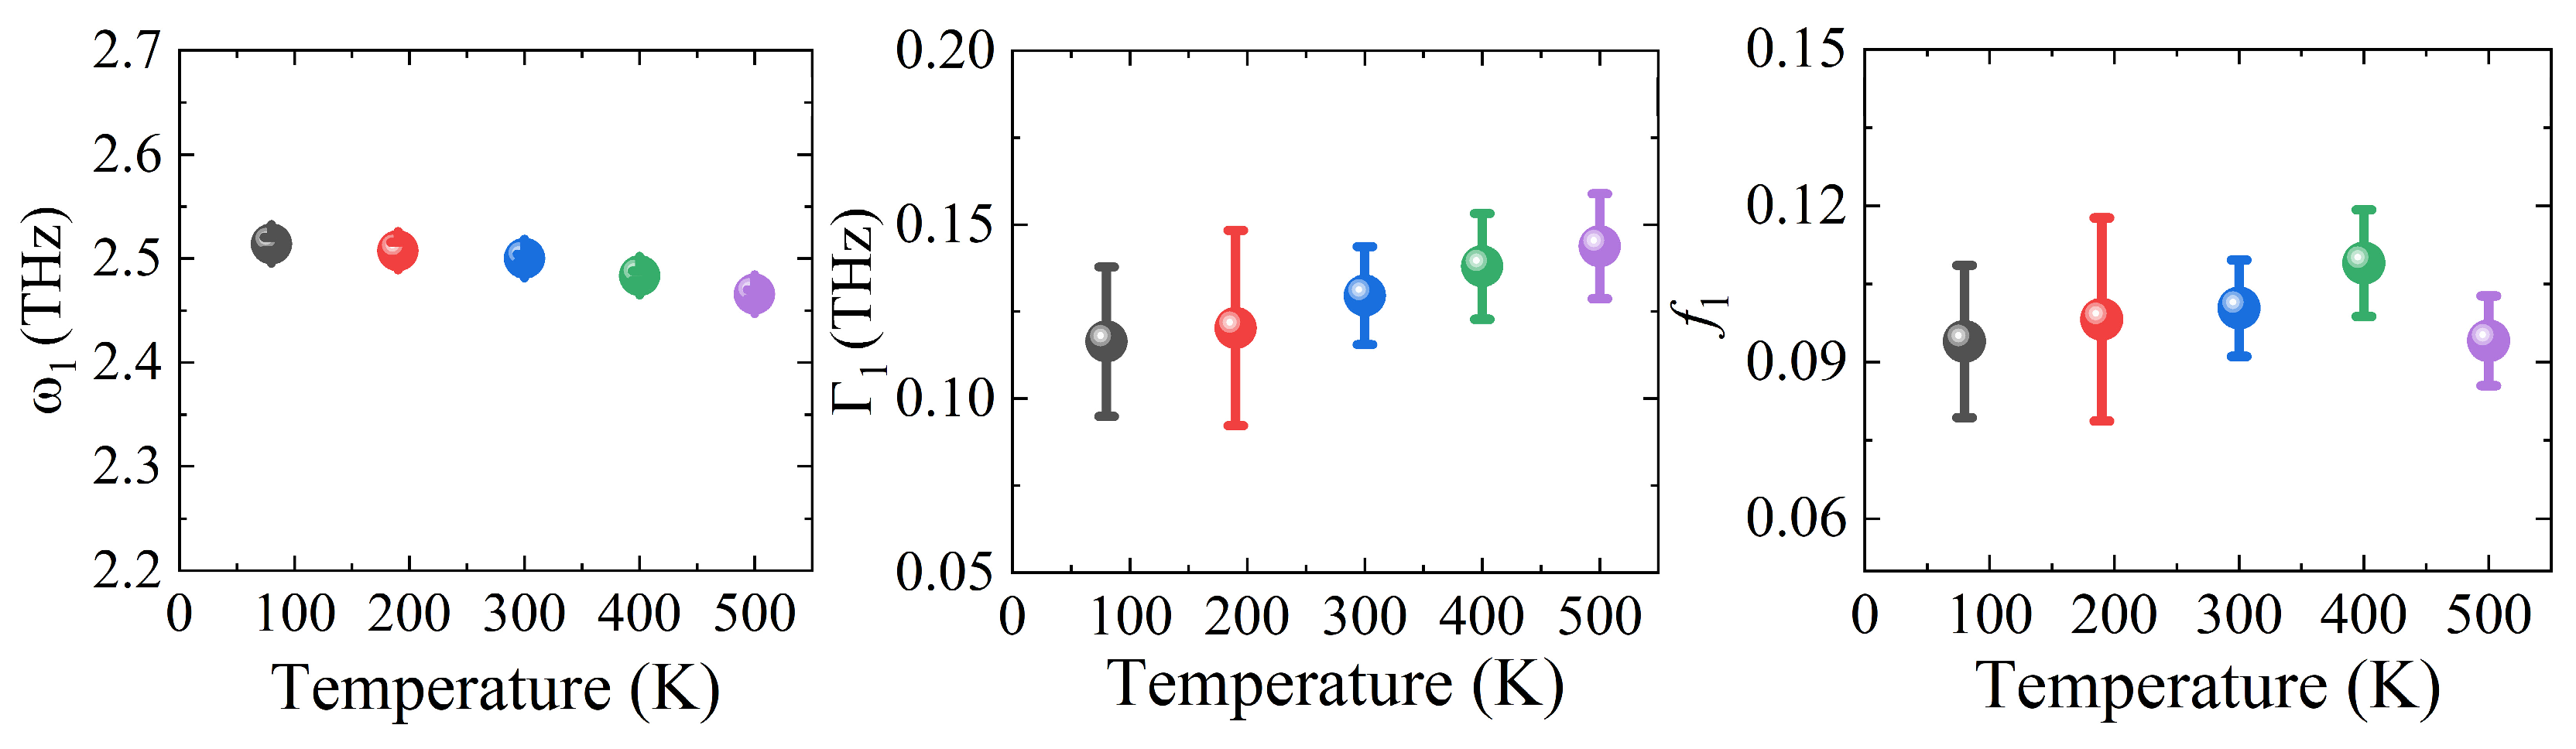
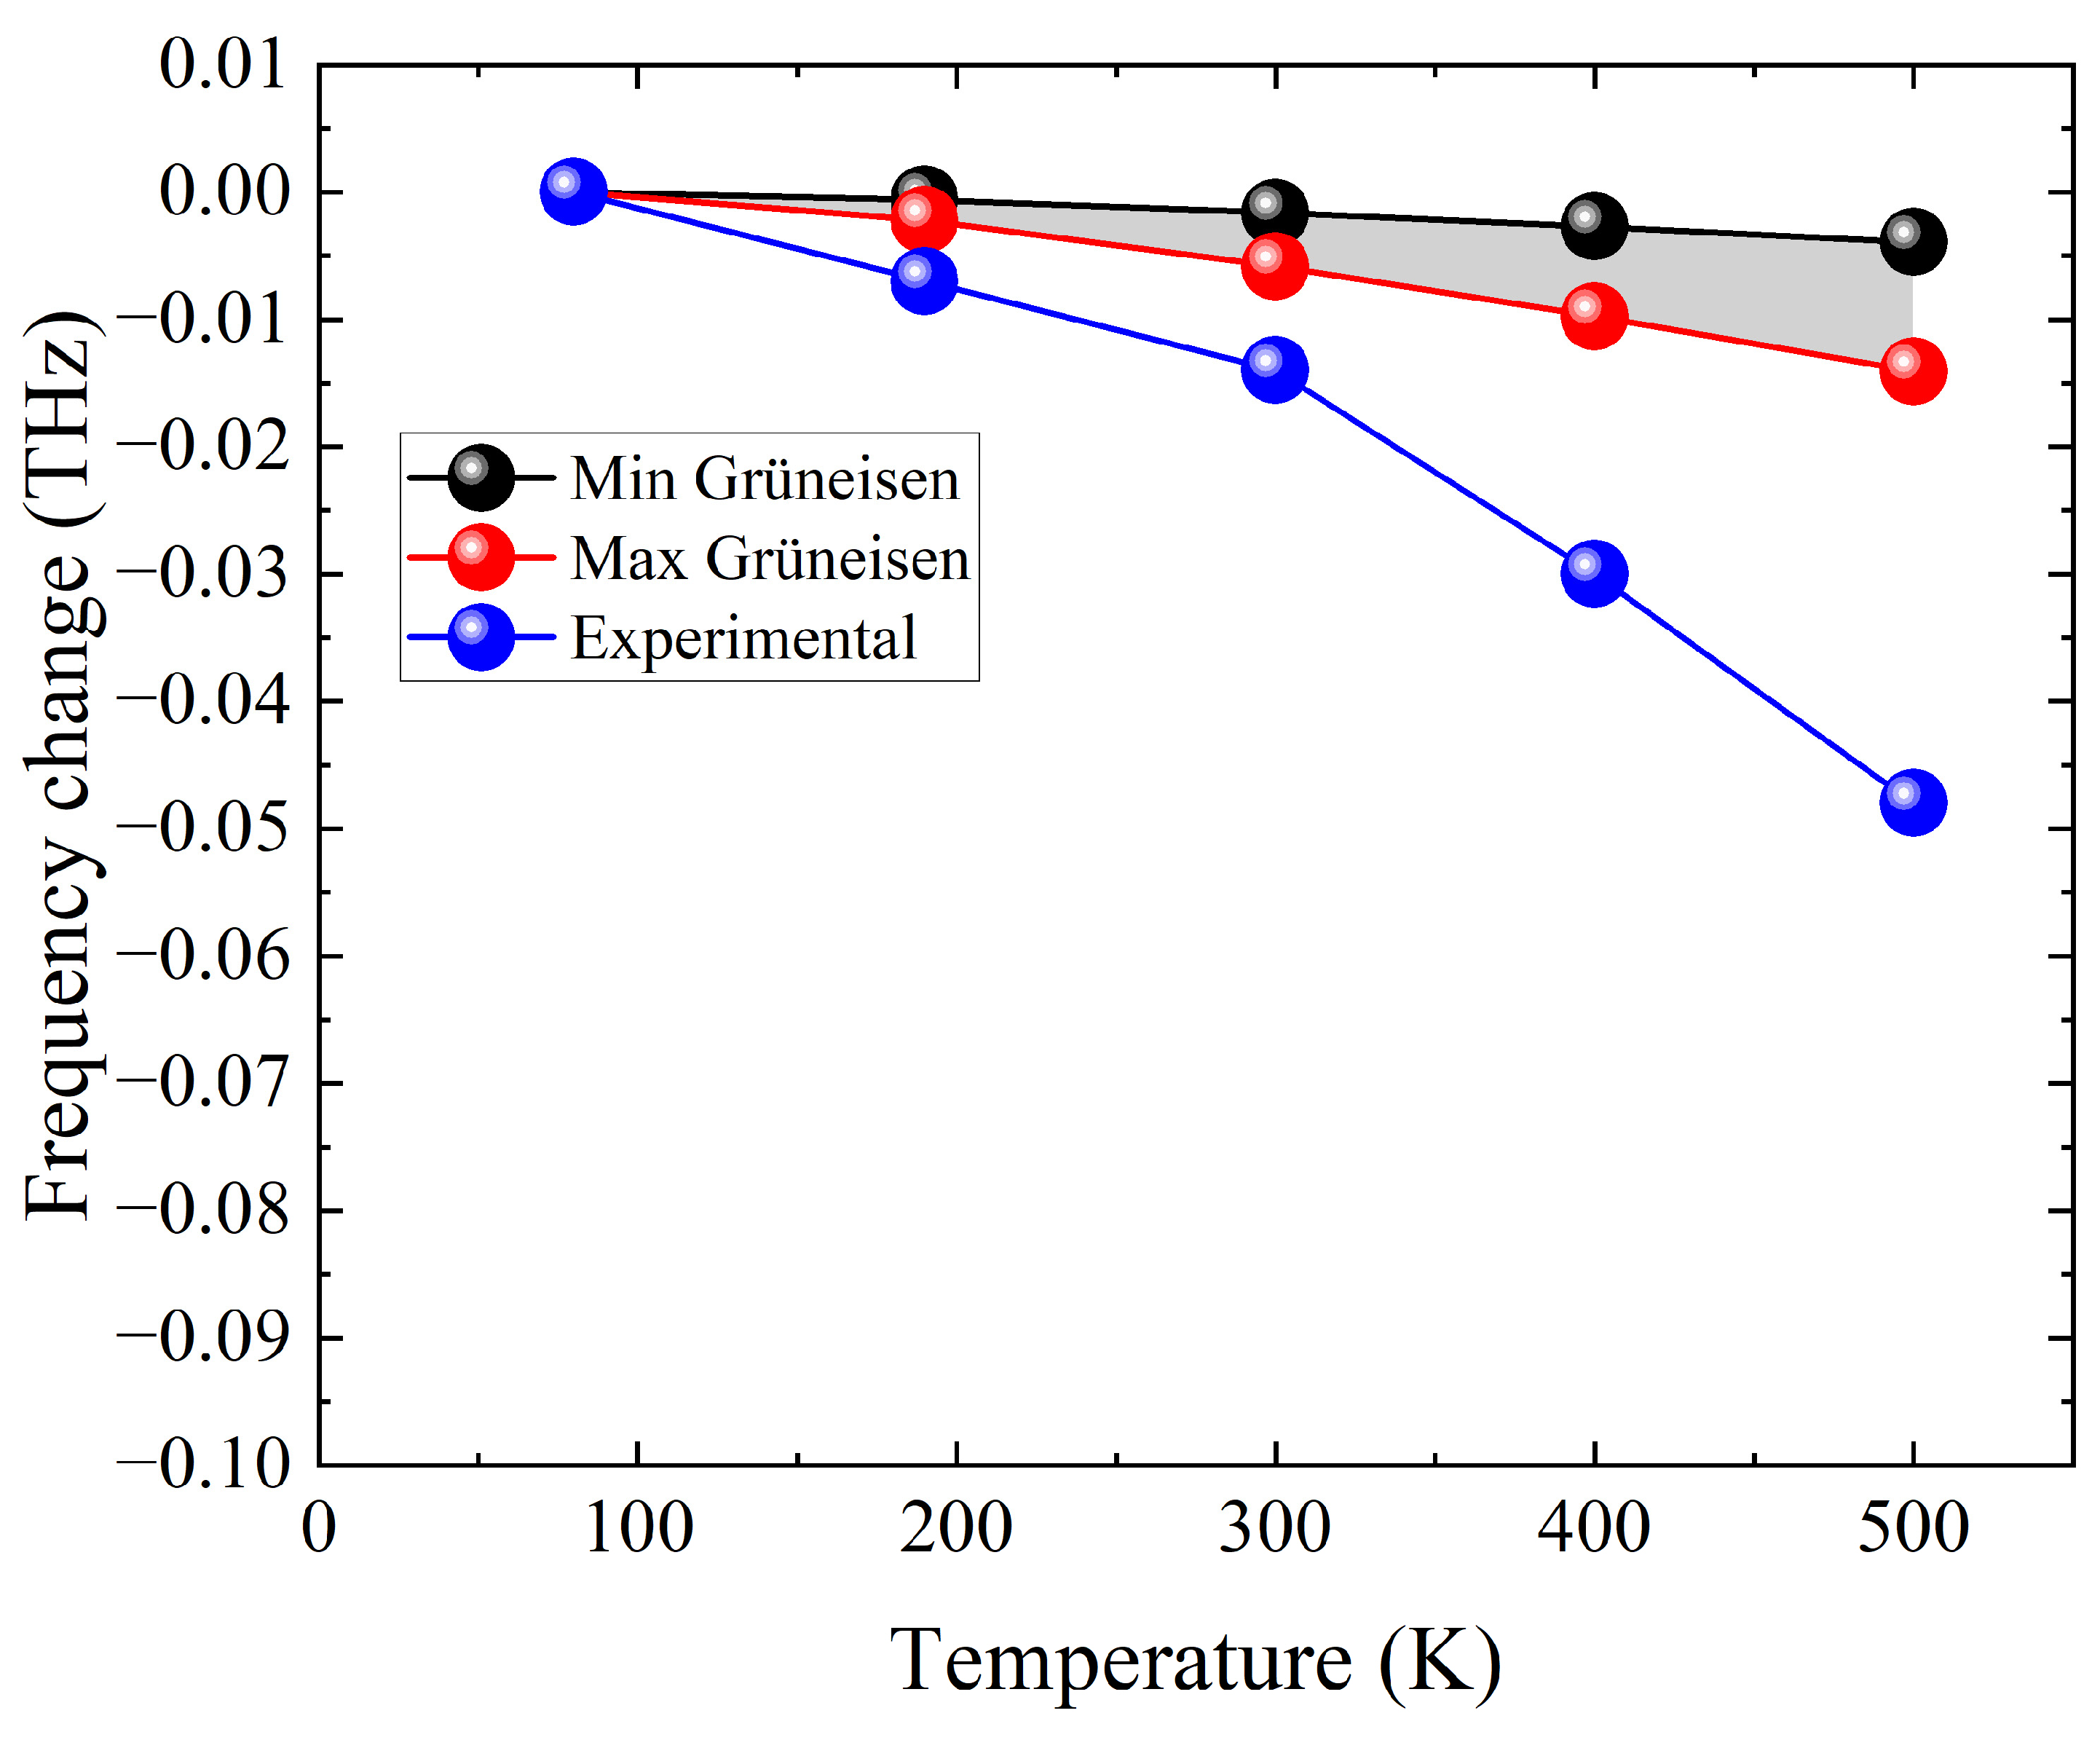
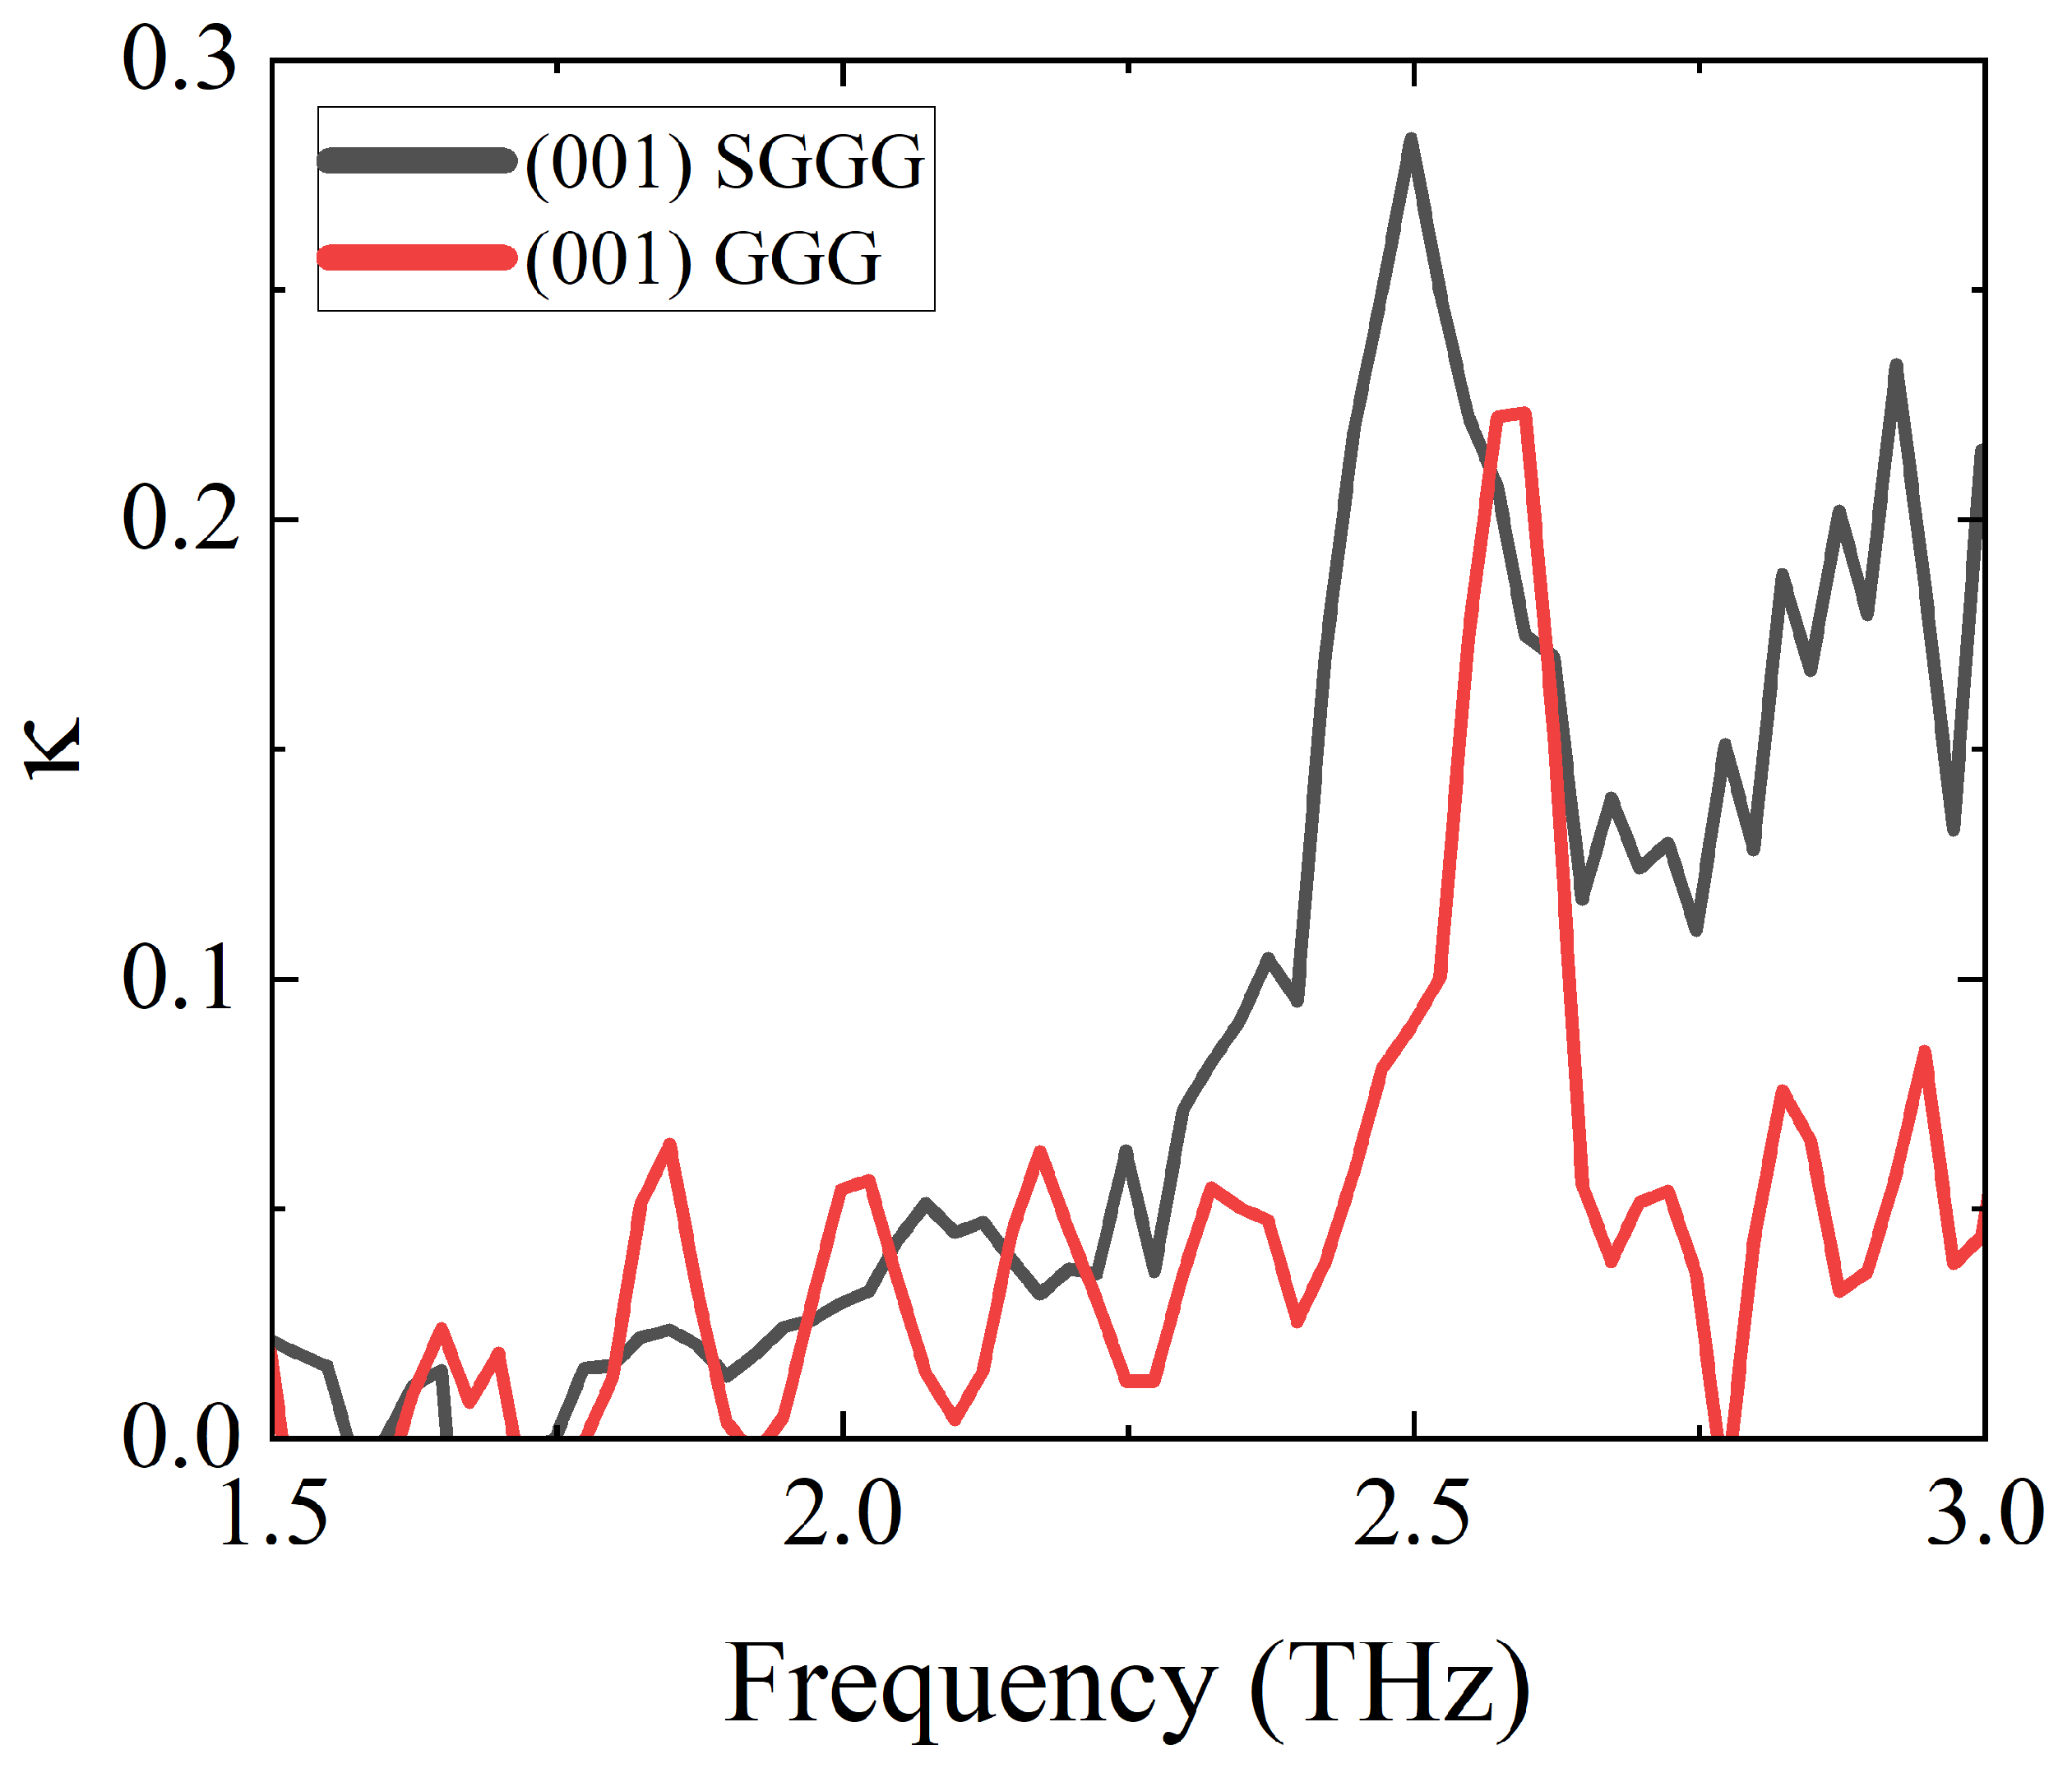
2. Results and Discussion

The THz-TDS results of SGGG at room temperature are shown in Figure 1, including the time-domain amplitude waveforms, the phase, frequency-domain spectra, and the transmission spectra.
The multiple peaks in the waveforms indicate the reflections in SGGG, resulting in oscillations in the frequency spectra. The clear absorptions at 2.5 THz in the amplitude and transmission spectra originate from the TO1 phonon excitation. The absorption-peak-like response around 0.3 THz in Figure 1 c, d is attributed to random noise. In general, the THz-TDS shows a ghost signal at low frequencies, such as <0.5 THz in our measurements, because the wavelength of the THz beam becomes comparable to the beam diameter and detector cover region. Furthermore, the center frequency of our system is approximately 1.5–2 THz. As the frequency deviates further from this range, the spectrum intensity decreases, leading to a substantial increase in noise at both high and low frequencies. This noise becomes dominant in the spectral display, significantly reducing the reliability of the low-frequency range. Consequently, in THz spectral analysis, as well as in other THz studies, data in this range are typically regarded as noise and disregarded. The lowest phonon mode of GGG is 86.1 cm−1 (2.583 THz) [13], and since the substituted elements are lighter than Gd atoms, the phonon mode frequencies introduced by substitution are supposed to be higher than 2.5 THz [11]. The phonon responses of SGGG are anticipated to appear above 3 THz; however, the high absorption interferes with those observations. As shown in Figure S1, the response above 3 THz can be observed in GGG, but in SGGG, the substituted elements introduce additional phonon modes and absorption, eliminating the phonon response signal in our measurements.
The complex optical constants are calculated from the data shown above. The calculation process of optical constants from the raw data of THz-TDS is described as follows [14]. The THz beam that propagates through the ambient atmosphere (as the reference) and a bulk material (as the sample) were measured and the transfer function H ω can be obtained:
H ω = E s a m ω E r e f ω = 4 n ~ s a m ( n ~ s a m + n ~ a i r ) 2 exp i n ~ s a m n ~ a i r c ω d 1 + 1 m r s a 2 · exp i 2 n ~ s a m ω d c m
where c is the speed of light, d is the thickness of the sample, ω = 2 π f is the frequency, n ~ a i r and n ~ s a m are the complex refractive indices of air and the sample, respectively, t a s = 2 n ~ a i r n ~ a i r + n ~ s a m and t s a = 2 n ~ s a m n ~ a i r + n ~ s a m are the transmission coefficients derived from Fresnel’s equations being used, and m is the number of echoes, with the part in the square bracket describing multiple echoes, also known as the Fabry–Pérot effect. Here, a and s stand for air and sample, respectively, with a s representing the interface of the air and sample, and s a representing the interface of the sample and air for the THz wave propagation. n ~ s a m is calculated numerically, and the complex refractive index is roughly determined by n = c t d + 1 , where t is the time difference between the reference peak and sample peak in the time-domain waveforms; while κ can be set as 0 for most materials due to their low absorption in the low-frequency range (<3 THz). The difference (or error) between the experimental data and calculated data of the amplitude and phase can be described as: H e x p e r i m e n t ω H m o d e l e d ω and H e x p e r i m e n t ω H m o d e l e d ω . H m o d e l e d ω is the result obtained by substituting the roughly determined initial values into the equation of transfer function. These errors can be minimized by an iteration program, where in each iteration the values of n and κ change for 1% or less. Subsequently, reasonable values of the refractive index are obtained as well as the complex dielectric constant, by the equations: ε 1 = n 2 κ 2 (the real part) and ε 2 = 2 n κ (the imaginary part). Note that multiple reflections cause fluctuations in the curve of the frequency-dependent optical constants, and this can be minimized by applying an appropriate thickness of the sample. The total variation method was one of the methods used to determine the thickness of the sample [15]. The algorithm counts the variations between every two consecutive data points in a selected frequency range, described as:
T V = n j n j + 1 + κ j κ j + 1
The values of TV should exhibit a local minimum around the thickness provided by the manufacturer, which is closer to the correct value.
The complex dielectric constants are plotted in Figure 2.
The experimental results were fitted by the Lorentz oscillator model and the best fitting results are also shown as the solid lines in Figure 2. The Lorentz oscillator model is described as follows [16]:
ε = ε h i g h + Ω j 2 ω j 2 ω 2 i Γ j ω ,
where ε h i g h is the high-frequency dielectric constant, Ω j 2 = ω j 2 f j is relative to oscillator strength, ω j is phonon frequency, and Γ j is the damping parameter. The ε h i g h decides the general values’ height in the y-axis, the oscillator strength decides the peak-to-peak value of an oscillator, and the Γ j decides the width of an oscillator response. Note that our THz-TDS measurement is limited to below ~10 THz, and thus, the high-frequency dielectric constant should be different from the infinite dielectric constant.
The fitting was done simultaneously with the real part and the imaginary part. Both the R-square (coefficient of determination, COD) and the adjusted R-square of the fitting curves exceed 0.99, indicating a high-quality fit. These coefficients range from zero to one, and the higher values reflect a vigorous correspondence between the model and the data. The current fitting results are, therefore, accurate enough. The fitting criteria coefficients are listed in Table S1. The detectable frequency range only covers the TO1 phonon response, but for the fitting, converging the TO2 phonon has been taken into consideration by the reference [13]. The dielectric constants measured by the air-plasma-based THz-TDS system at 300 K are consistent with those obtained from the Otsuka system, as shown in Figure 2. The blue symbols represent the dielectric constants measured by the air-plasma-based THz-TDS system, the blue lines indicate the fitting results, and the black 3D spheres represent the measurements from the Otsuka system used for validation. The dielectric constants show a value range of 12~17 for the real part and a peak value around 2 at the phonon absorption peak for the imaginary part. The fitting curves allow us to estimate physical parameters in Equation (3), and are summarized in Table 1 and plotted in Figure 3.
ω 1 Γ 1 f 1
With increasing temperature, the fitting parameters change as follows: (1) the phonon frequency decreases; (2) the damping parameter increases; and (3) the oscillator strength shows no obvious change. The contributions to phonon shift are attributed to thermal expansion, phonon anharmonicity, and/or substrate effect [17]. Our sample is a single crystal, so the substrate effect can be ignored. To discuss the contribution of thermal expansion, a key parameter, the Grüneisen parameter γ = d l n ω d l n V , is required [17]. Here, ω is the phonon frequency, and V is the volume of the cell. This parameter describes the phonon shift caused by lattice constant change. By using this parameter, the discussion of thermal expansion and phonon anharmonicity can be divided. Due to the lack of research on SGGG, the temperature-dependent lattice constants and the Grüneisen parameter are still unknown. However, an approximation can be proposed for discussion under the following conditions:
(i)
Temperature-dependent Lattice Constants: Take the GGG temperature-dependent lattice constant change for SGGG discussion. The lattice constants of GGG at various temperatures refer to several previous studies [18,19]. Because the doping percentages of other elements are less than 1% each, the lattice constants of SGGG at various temperatures can refer to GGG for the approximation.
(ii)
Grüneisen parameter: Take the Grüneisen parameter in the range from 0.5 to 1.8 for the TO1 phonon for SGGG. This is the range for the Grüneisen parameter of the TO1 phonon of Yttrium Aluminum Garnet (YAG) [20]. The best approximation for SGGG is GGG, but there was no report that provides its Grüneisen parameter and pressure-dependent phonon behaviors. Moreover, since the phonon change caused by the lattice constant change is proportional to the cell volume change and the rate, the Grüneisen parameter, primarily affects the relative shift of the phonon frequency with respect to a reference point.
The calculation results are shown in Figure 4 with a comparison to experimental data. In the figure, the difference between the experimental data and the calculated data becomes larger when temperature increases, which indicates the contribution to phonon shift from phonon anharmonicity becomes larger and dominant.
The phenomenon (2) might explain that the lattice vibration is located on a certain frequency at low temperatures, and with increasing temperature, the thermal energy introduces some random vibrations to the mode. This causes the absorption peak at the imaginary part of the dielectric constant to broaden, as shown in Figure 2. However, the discussion on the contribution of thermal expansion and anharmonicity needs other studies, and we will leave it for future work.
The TO1 phonon frequency in GGG has been proven to be around 86 cm−1 (2.58 THz) theoretically by Papagelis [13] and experimentally by Adachi [11]. The present case at room temperature appears at 2.5 THz, and the value is close to the one of GGG, showing a small difference of Δ = 0.08 THz. The damping parameter Γ of the TO1 phonon in GGG is also at the level of 3.7–5.7 cm−1 (0.111–0.171 THz), and our fitting result at room temperature agrees with the previous study. In GGG, the TO1 phonon around 2.58 THz originates in the vibration mode of the Gd atoms [11]. According to the elementary theories stated by Adachi [11] and Papagelis [13], heavier atoms contribute more to lower-frequency phonons. Since Gd atoms are significantly heavier than the substituting elements, the lowest TO1 phonon at 2.5 THz can be attributed to the vibrations of Gd atoms. The phonon shift, where the frequency in SGGG is lower than that in GGG, arises from the substitution-induced asymmetry in the crystal lattice. This asymmetry disrupts the periodicity of the lattice, hindering the effective transmission of light through the material.
To study the difference, we have examined the THz transmission properties. Figure 5 shows the comparison of κ, the imaginary part of the complex refractive index, for SGGG and GGG at 300 K over a frequency range of 1.5 to 3 THz. Below 2.25 THz, the κ of SGGG and GGG is at the same level. However, as the frequency approaches the TO1 phonon oscillation range, SGGG exhibits significantly higher κ values than GGG, and above the TO1 phonon frequency in SGGG, distinct enhancement has been observed. This suggests that the substitution of the elements introduces higher absorption compared to GGG as the THz wave interacts with their vibrational modes.
To make the difference clear, the temperature dependence of the loss tangent, t a n δ = ε 2 / ε 1 , was calculated. The comparison of the loss tangent of SGGG and GGG is shown in Figure 6 by averaging the data in the frequency range from 2.7 to 2.8 THz after the TO1 phonon oscillation of both the SGGG and GGG. The loss tangents of SGGG and GGG are both less than 0.2 in the range of 1 to 3 THz. At frequencies below 2.25 THz, where the phonon oscillation has minor influences, the values are generally less than 0.04, with a slightly higher value for SGGG. In this frequency range, the loss tangents of SGGG and GGG showed the same level compared to Titanium dioxide, Zirconium–Tin–Titanate, and Alumina, showing less dispersion [21]. As shown in Figure 6, SGGG exhibits significantly higher loss than GGG near 3 THz. At room temperature, the difference near 3 THz in the loss tangent is approximately 0.04, corresponding to a difference of around 1.34 in the imaginary part of the dielectric constant. The overall values of the loss tangent for SGGG slightly increase with rising temperatures, whereas GGG shows no significant changes across various temperatures. This indicates that although both SGGG and GGG are thermally stable, the substitution in SGGG affects the absorbance of the THz waves, and its thermal stability is slightly degraded.
Below the phonon frequency, the real part of the dielectric constant has negligible changes from 80 K to 500 K. The oscillation behavior on the real part curves and the absorption peak on the imaginary parts become sharper when temperature decreases, while the absorption peak has minor changes in the amplitude. Given the insignificant changes observed at various temperatures, the SGGG sample demonstrates excellent thermal stability. The substitution can effectively minimize distortion between the substrate and the film material; however, even a small substitution can lead to the TO1 phonon shifting to a lower frequency, with increased absorption at higher frequencies of lattice vibrations and a slight degradation in thermal stability. For device design, this substitution introduces a trade-off that engineers must carefully evaluate.

3. Materials and Methods

The (001) oriented 200-μm-thick SGGG substrates were provided by SurfaceNet GmbH, with the thickness re-estimated by an iteration program with the Total Variation method [15]. The real thickness was determined to be 200 μm. The chemical formula can be described as (Gd2.995Ca0.005)(Ga4.985Mg0.005Zr0.01)O12, i.e., the amounts of Ca, Mg, and Zr were 0.5%, 0.5%, and 1.0%, respectively. The crystal structure of SGGG was plotted by VESTA [22] and is shown in Figure 7. For a clear view, one Ca atom, one Mg atom, and two Zr atoms were inserted into the GGG crystal structure [23], and these three kinds of atoms can be observed in the vertical middle of Figure 7.
Two terahertz time-domain spectroscopy (THz-TDS) systems were utilized to measure the complex optical constants. The first one was an air-plasma-based THz-TDS system based on a regenerative laser (spitfire Pro) and an air-biased coherent detection (ABCD) module, whose details are illustrated elsewhere [24]. The laser duration was 100 fs, and its repetition frequency was 1000 Hz. The average pump power for plasma was 3.4 W, and the probe power for the detection was 80 mW. The THz path was sealed in an acrylic box, and the humidity rate was maintained at less than 5% by purging with nitrogen gas to minimize the influence of moisture. Its spectrum expands up to 10 THz. The optical constants at room temperature were validated using a commercial THz-TDS model (TR-1000) provided by Otsuka Electronics Co. LTD (described as the Otsuka system below). The THz emitter and detector were photoconductive antennas based on low-temperature-grown GaAs. Its spectrum can extend up to 4 THz, and the signal-to-noise ratio can reach a thousand in amplitude.

4. Conclusions

The lowest frequency TO1 phonon in the single crystal (001) SGGG has been evaluated by an air-plasma-based THz-TDS method at temperatures ranging from 80 K to 500 K. The TO1 phonon, observed at 2.5 THz at room temperature, was identified. The parameters, such as the TO1 phonon frequency and dielectric constant, were calculated based on an iteration program. With increasing temperature, the frequency of the TO1 phonon decreases, the damping parameter increases, and the oscillator strength shows no obvious change. By making an approximation, the contributions to phonon frequency shift by thermal expansion and phonon anharmonicity were discussed. With temperature increases, the phonon anharmonicity becomes larger. We can conclude that the lowest frequency phonon behavior of (001) SGGG is similar to that of GGG because the TO1 phonon originates from Gd atoms. Furthermore, the substitution can effectively minimize distortion between the substrate and the film material. Nevertheless, even a small substitution can lead to the TO1 phonon shifting to a lower frequency and demonstrating increased absorption at higher frequencies of lattice vibrations. Our work is expected to support the development of magneto-optical and spintronic devices, and for device design, this substitution may present a trade-off that engineers must carefully evaluate.

Supplementary Materials

The following supporting information can be downloaded at: https://www.mdpi.com/article/10.3390/condmat10010001/s1, Figure S1: Transmission spectra of GGG with thickness dependence; Table S1: The R-square (coefficient of determination, COD) and adjusted R-square (Adj. R-square) for the fitting results of the TO1 phonon in SGGG.

Author Contributions

H.Y., M.S., M.T. and H.T. conceived the idea and proposed the research. K.W., J.X. and H.Y. performed the measurements and data analyses with support from H.M. and M.S. K.W. and M.T. wrote the original draft of the manuscript. Others reviewed and edited, and all authors contributed feedback and comments. M.T. directed and supervised the research. All authors have read and agreed to the published version of the manuscript.

Funding

This work is supported by JST, CREST Grant Number JPMJCR22O2. M.T. acknowledges the support by JSPS KAKENHI Grant No. JP 23H00184.

Data Availability Statement

The raw data supporting the conclusions of this article will be made available by the authors on request.

Acknowledgments

K.W. acknowledges the support given by JST, the establishment of university fellowships towards the creation of science technology innovation, Grant Number JPMJFS2125.

Conflicts of Interest

The authors declare no conflicts of interest.

References

  1. Ueda, J.; Tanabe, S. Review of Luminescent Properties of Ce3+-Doped Garnet Phosphors: New Insight into the Effect of Crystal and Electronic Structure. Opt. Mater. X 2019, 1, 100018. [Google Scholar] [CrossRef]
  2. Karipbayev, Z.T.; Kumarbekov, K.; Manika, I.; Dauletbekova, A.; Kozlovskiy, A.L.; Sugak, D.; Ubizskii, S.B.; Akilbekov, A.; Suchikova, Y.; Popov, A.I. Optical, Structural, and Mechanical Properties of Gd3Ga5O12 Single Crystals Irradiated with 84Kr+ Ions. Phys. Status Solidi B Basic. Res. 2022, 259, 202100415. [Google Scholar] [CrossRef]
  3. Sokolov, N.S.; Fedorov, V.V.; Korovin, A.M.; Suturin, S.M.; Baranov, D.A.; Gastev, S.V.; Krichevtsov, B.B.; Maksimova, K.Y.; Grunin, A.I.; Bursian, V.E.; et al. Thin Yttrium Iron Garnet Films Grown by Pulsed Laser Deposition: Crystal Structure, Static, and Dynamic Magnetic Properties. J. Appl. Phys. 2016, 119, 023903. [Google Scholar] [CrossRef]
  4. Jin, C.; Li, R.; Liu, Y.; Zhang, L.; Zhang, J.; Sun, P.; Luo, Z.; Jiang, J. Efficient and Stable Gd3Ga5O12:Cr3+ Phosphors for High-Performance NIR LEDs. Adv. Opt. Mater. 2023, 11, 2300772. [Google Scholar] [CrossRef]
  5. Martinazzoli, L.; Kratochwil, N.; Gundacker, S.; Auffray, E. Scintillation Properties and Timing Performance of State-of-the-Art Gd3Al2Ga3O12 Single Crystals. Nucl. Instrum. Methods Phys. Res. A 2021, 1000, 165231. [Google Scholar] [CrossRef]
  6. Du, S.; Yang, Q.; Fan, X.; Wang, M.; Zhang, H. A Compact and Low-Loss Tunable Bandpass Filter Using YIG/GGG Film Structures. IEEE Microw. Wirel. Compon. Lett. 2022, 33, 259–262. [Google Scholar] [CrossRef]
  7. Holzmann, C.; Ullrich, A.; Ciubotariu, O.T.; Albrecht, M. Stress-Induced Magnetic Properties of Gadolinium Iron Garnet Nanoscale-Thin Films: Implications for Spintronic Devices. ACS Appl. Nano Mater. 2022, 5, 1023–1033. [Google Scholar] [CrossRef]
  8. Sarker, M.S.; Nakamura, S.; Yamahara, H.; Seki, M.; Tabata, H. Multifrequency Spin-Wave Propagation for Parallel Data Processing Using Microstructured Yttrium Iron Garnet Thin Films. IEEE Trans. Magn. 2022, 58, 4300706. [Google Scholar] [CrossRef]
  9. Li, H.; Sun, D.; Zhang, H.; Luo, J.; Quan, C.; Han, Z.; Qiao, Y.; Chen, Y.; Wang, Z.; Cheng, M.; et al. Effect of Ca2+/Mg2+/Zr4+ Concentrations on the Characteristics of Substituted Gadolinium Gallium Garnet Single Crystals with Large Lattice Parameter. J. Alloys Compd. 2023, 965, 171467. [Google Scholar] [CrossRef]
  10. Sabbaghi, M.; Hanson, G.W.; Weinert, M.; Shi, F.; Cen, C. Terahertz Response of Gadolinium Gallium Garnet (GGG) and Gadolinium Scandium Gallium Garnet (SGGG). J. Appl. Phys. 2020, 127, 025104. [Google Scholar] [CrossRef]
  11. Adachi, M.; Yamahara, H.; Kawabe, S.; Matsui, H.; Tabata, H. Strong Optical Reflection of Rare-Earth Garnets in the Terahertz Regime by Reststrahlen Bands. Phys. Rev. B Condens. Matter Mater. Phys. 2014, 89, 205124. [Google Scholar] [CrossRef]
  12. Adachi, M.; Matsui, H.; Seki, M.; Yamahara, H.; Tabata, H. High-Temperature Terahertz Absorption Band in Rare-Earth Gallium Garnet. Phys. Rev. B Condens. Matter Mater. Phys. 2015, 91, 085118. [Google Scholar] [CrossRef]
  13. Papagelis, K.; Arvanitidis, J.; Vinga, E.; Christofilos, D.; Kourouklis, G.A.; Kimura, H.; Ves, S. Vibrational Properties of (Gd1-xYx) 3Ga5O12 Solid Solutions. J. Appl. Phys. 2010, 107, 113504. [Google Scholar] [CrossRef]
  14. Neu, J.; Schmuttenmaer, C.A. Tutorial: An Introduction to Terahertz Time Domain Spectroscopy (THz-TDS). J. Appl. Phys. 2018, 124, 231101. [Google Scholar] [CrossRef]
  15. Dorney, T.D.; Baraniuk, R.G.; Mittleman, D.M. Material Parameter Estimation with Terahertz Time-Domain Spectroscopy. J. Opt. Soc. Am. A 2001, 18, 1562–1571. [Google Scholar] [CrossRef]
  16. Helal, M.A.; Mori, T.; Kojima, S. Terahertz Time-Domain Spectroscopy and Raman Scattering Studies of Incipient Ferroelectric BaZrO3. Ferroelectrics 2016, 499, 107–114. [Google Scholar] [CrossRef]
  17. Zhu, S.; Zheng, W. Temperature-Dependent Phonon Shifts in van Der Waals Crystals. J. Phys. Chem. Lett. 2021, 12, 5261–5270. [Google Scholar] [CrossRef] [PubMed]
  18. Kolmakova, N.P.; Levitin, R.Z.; Orlov, V.N.; Vedernikov, N.F. Magnetoelastic properties of rare-earth paramagnetic garnets: Magnetostriction and thermal expansion. J. Magn. Magn. Mater. 1990, 87, 218–228. [Google Scholar] [CrossRef]
  19. Nakajima, K.; Machida, K. Thermal expansion of gallium garnets and Bi-substituted iron garnet epitaxial thick films. J. Cryst. Growth 1988, 92, 23–25. [Google Scholar] [CrossRef]
  20. Monteseguro, V.; Rodríguez-Hernández, P.; Muñoz, A. Yttrium Aluminium Garnet under Pressure: Structural, Elastic, and Vibrational Properties from Ab Initio Studies. J. Appl. Phys. 2015, 118, 245902. [Google Scholar] [CrossRef]
  21. Berdel, K.; Rivas, J.G.; Bolívar, P.H.; De Maagt, P.; Kurz, H. Temperature Dependence of the Permittivity and Loss Tangent of High-Permittivity Materials at Terahertz Frequencies. IEEE Trans. Microw. Theory Tech. 2005, 53, 1266–1271. [Google Scholar] [CrossRef]
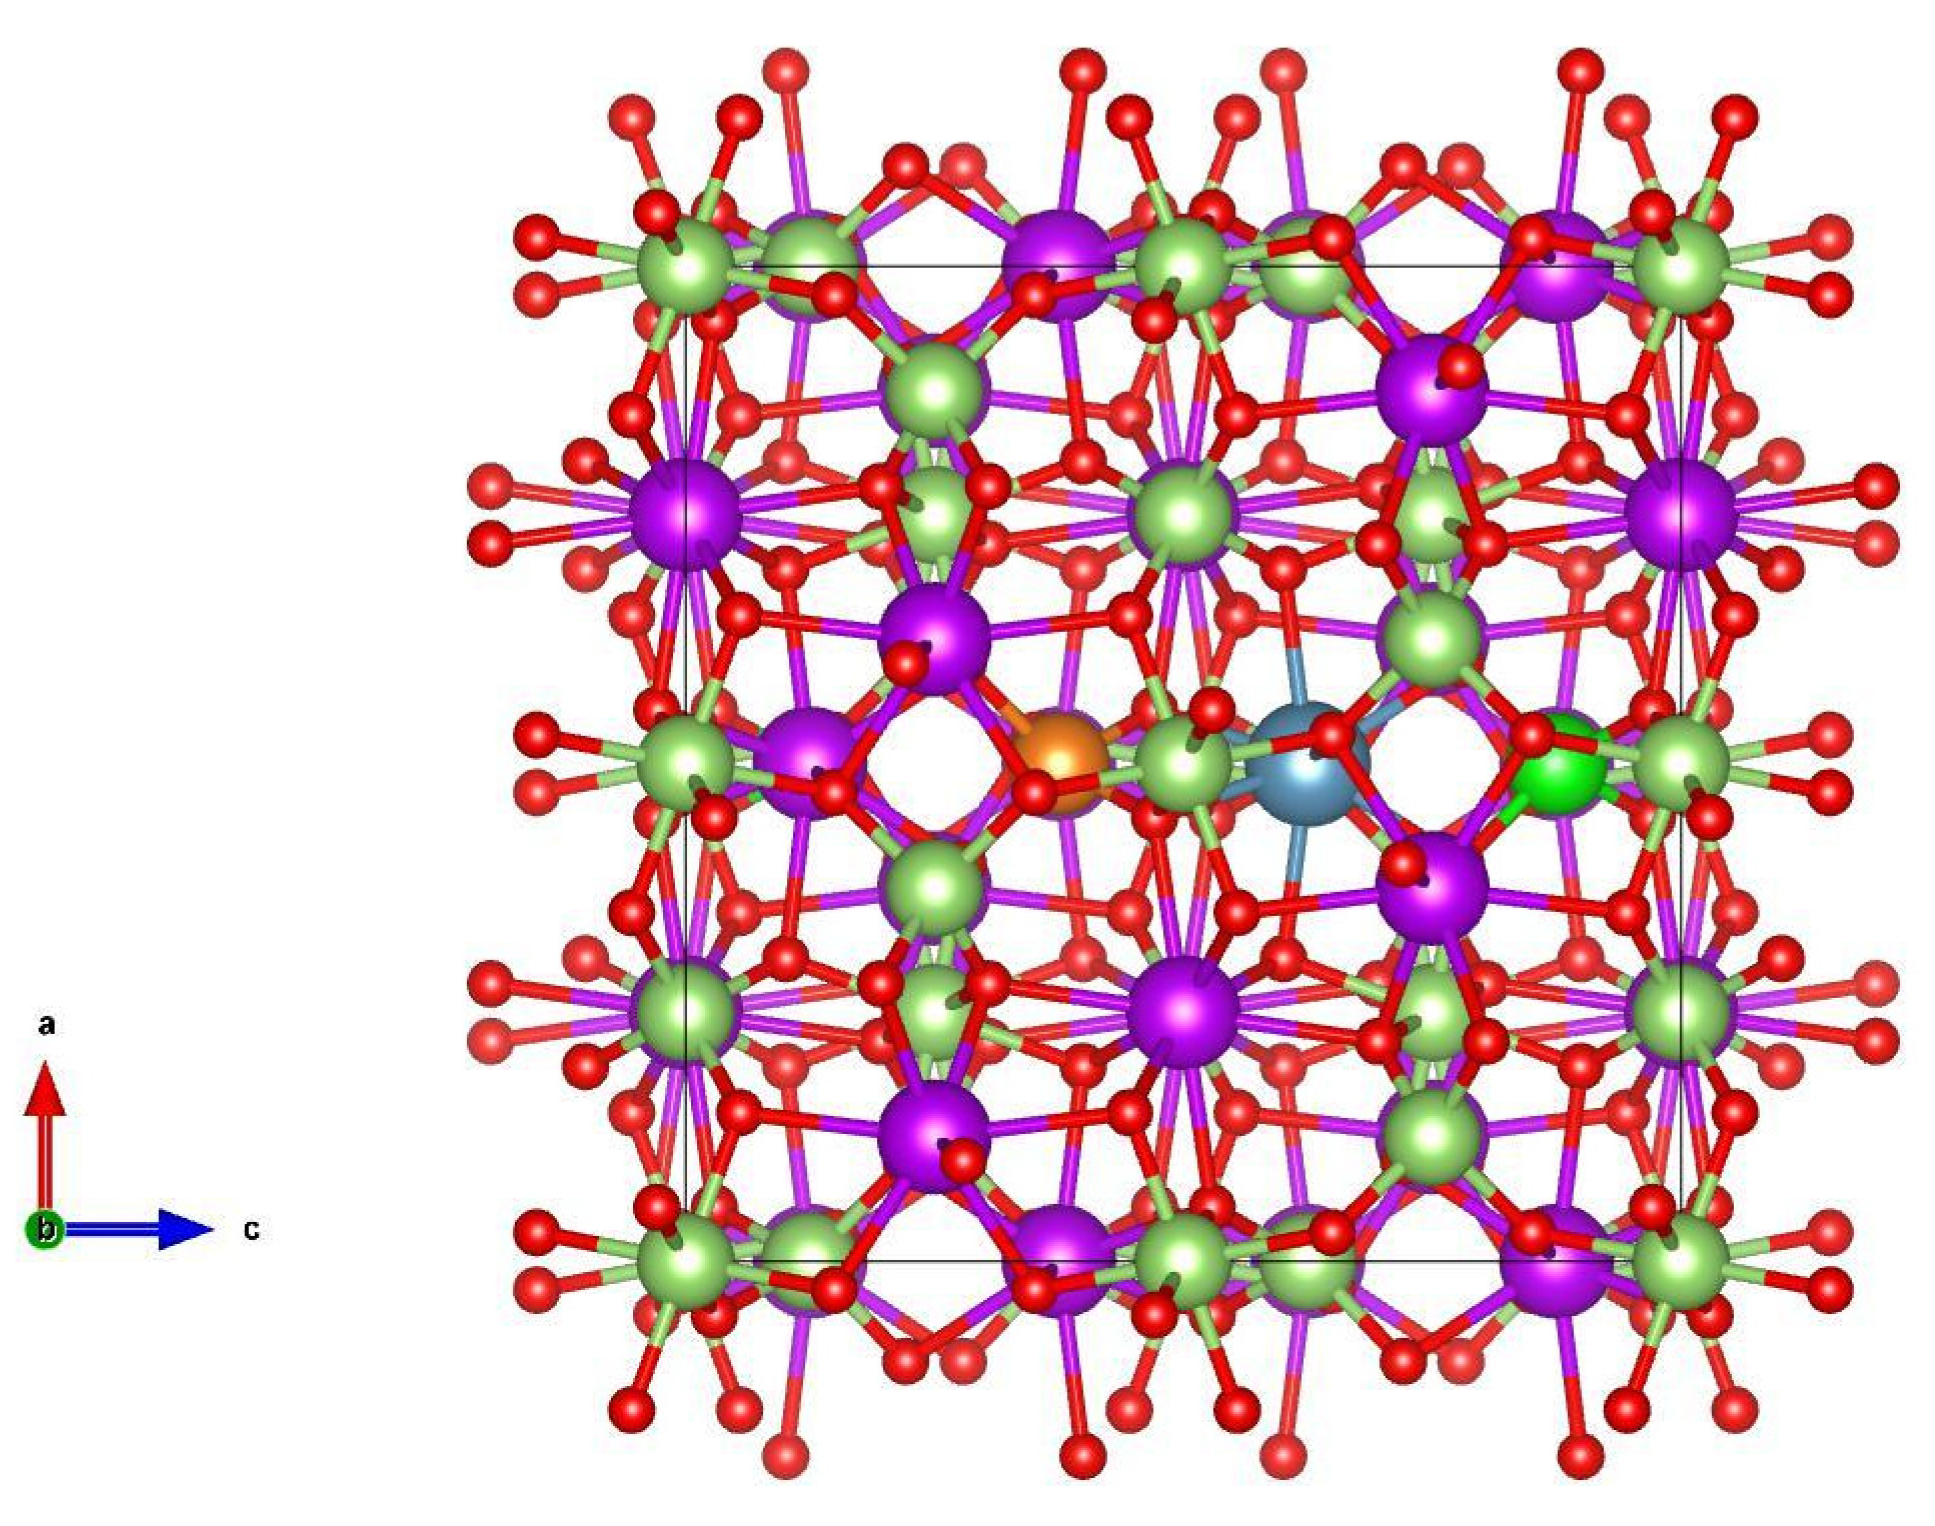
  22. Momma, K.; Izumi, F. VESTA 3 for Three-Dimensional Visualization of Crystal, Volumetric and Morphology Data. J. Appl. Crystallogr. 2011, 44, 1272–1276. [Google Scholar] [CrossRef]
  23. Sawada, H. Electron Density Study of Garnets: Z3Ga5O12; Z=Nd, Sm, Gd, Tb. J. Solid State Chem. 1997, 132, 300–307. [Google Scholar] [CrossRef]
  24. Gong, C.; Kawayama, I.; Murakami, H.; Teramoto, T.; Tonouchi, M. Intensity-Dependent Self-Induced Dual-Color Laser Phase Modulation and Its Effect on Terahertz Generation. Sci. Rep. 2021, 11, 498. [Google Scholar] [CrossRef] [PubMed]
Figure 1. THz-TDS results of SGGG at room temperature by using the air-plasma-based THz-TDS system. (a) time-domain waveforms; (b) phase spectra; (c) frequency-domain spectra, by applying FFT on time-domain data; and (d) the transmission spectrum. The shadowed areas represent unreliable regions.
Condensedmatter 10 00001 g001
Figure 2. Temperature-dependent complex dielectric constants from 80 to 500 K of SGGG. Figures on the left and right represent the real part and the imaginary part, respectively. Solid lines: fitting results; open squares: the real part; and open circles: the imaginary part. Black 3D spheres in the figures at 300 K represent the data measured with the Otsuka system for validating air-plasma-based system results.
Condensedmatter 10 00001 g002
Figure 3. Fitting parameters of the TO1 phonon of SGGG. The colors represent different temperatures, and they correspond to Figure 2.
Condensedmatter 10 00001 g003
Figure 4. Temperature dependence of the phonon frequencies. Differences are displayed in comparison with those at 80 K. Black: calculated with the minimum Grüneisen parameter of 0.5; red: calculation results with Grüneisen parameters with a maximum Grüneisen parameter of 1.8; and blue: experimental data.
Condensedmatter 10 00001 g004
Figure 5. The comparison of the imaginary part of complex refractive index κ of SGGG and GGG at 300 K, from 1.5 to 3 THz. The black line: (001) SGGG; the red line: (001) GGG.
Condensedmatter 10 00001 g005
Figure 6. The comparison of the loss tangents of SGGG and GGG at 300 K by averaging the data in the frequency range from 2.7 to 2.8 THz. Black symbols: (001) SGGG; red symbols: (001) GGG. The colors represent different temperatures, and they correspond to Figure 2.
Condensedmatter 10 00001 g006
Figure 7. Crystal structure of SGGG. Different atoms are displayed in different colors. Red: O; purple: Gd; dark green: Ga; orange: Mg; cyan: Ca; and neon green: Zr.
Condensedmatter 10 00001 g007
Table 1. The fitting parameters of the TO1 phonon of SGGG.
80 K190 K300 K400 K500 K
SGGG (001)
ω 1 (THz)2.5142.5072.5002.4842.466
Γ 1 (THz)0.1100.1200.1300.1380.144
f 1 0.0950.0980.1000.1090.094
Disclaimer/Publisher’s Note: The statements, opinions and data contained in all publications are solely those of the individual author(s) and contributor(s) and not of MDPI and/or the editor(s). MDPI and/or the editor(s) disclaim responsibility for any injury to people or property resulting from any ideas, methods, instructions or products referred to in the content.

