1. Introduction
Fisheries are an indispensable element in global food security, nutrition, and economic development, supporting the livelihoods of millions worldwide. According to recent data from the Food and Agriculture Organization (FAO), global production from fisheries and aquaculture reached 177.8 million tonnes in 2022, demonstrating the significant contribution of the fishing industry to the world’s food supply [
1,
2]. However, as we enter the 21st century, global fishery resources are being rapidly depleted due to increasing demand, overfishing, and environmental degradation. This situation not only threatens the livelihoods of those in the fishing industry but also poses a risk to global food security, necessitating effective management strategies for sustainable fisheries.
To address these challenges, many countries have implemented the Total Allowable Catch (TAC) system [
3,
4,
5]. The TAC system, which limits the annual catch for individual species, is considered a more efficient resource management strategy compared to traditional fishing management methods [
6]. In South Korea, the TAC system was introduced in 1999 and currently manages 16 species as of 2024 [
7,
8]. However, the effective operation of the TAC system requires accurate species recognition and precise measurements of length, height, and weight by fishery resource inspectors. The current manual survey process faces several issues, including measurement errors, data omissions during manual recording, difficulties in identifying similar species, and inconsistent monitoring due to uneven distribution of inspectors across regions [
9]. These limitations hinder the effective operation of the TAC system.
Previous studies on species recognition and measurement have attempted various methods to address these issues. Research on image recognition through applications has focused primarily on general species recognition [
10,
11,
12], but has limitations in direct application to specific management systems such as the TAC system. Studies on length measurement [
13,
14,
15] have proposed accurate measurement methods but lacked applicability in real-world settings such as fish markets. Moreover, these studies did not comprehensively address both species recognition and length measurement, failing to provide an integrated solution necessary for TAC system operation.
The main objective of this study is to develop an innovative system that can significantly improve the efficiency and accuracy of fishery resource surveys to address these issues. Specifically, we aim to construct an automated system that accurately recognizes 11 major TAC target species, automatically measures their length and height, estimates their weight, and stores this data in a database using the latest object recognition model, RT-DETR (Real-Time Detection Transformer) [
16,
17], and ARCore technology [
18]. Through this, we aim to support the effective operation of the TAC system and contribute to the sustainable management of fishery resources.
The system proposed in this study has the following key differentiating factors. Firstly, it provides a solution directly applicable to fishery resource management by developing a system specialized for the 11 main species managed under the TAC system. Secondly, it implements a system immediately usable in real fish market environments using smartphone-based applications and ARCore technology. Thirdly, it improves work efficiency and ensures data consistency by performing species recognition, length and height measurement, and weight estimation within a single system. Fourthly, it minimizes human error and improves data consistency and reliability by automating the entire process. Lastly, it achieves high-accuracy species recognition and precise length and height measurement capabilities by combining the RT-DETR model and ARCore technology.
Through this innovative system, this study is expected to significantly improve the accuracy and efficiency of fishery resource surveys. Real-time data collection and analysis will enhance TAC management, and the automation of labor-intensive manual measurements will reduce human error. Consequently, this is expected to prevent the depletion of fishery resources due to increasing demand and overfishing, and strengthen the sustainability of fishing activities.
The structure of this paper is as follows:
Section 2 provides a detailed explanation of the proposed system’s structure and components.
Section 3 describes the implementation results and performance evaluation of the system.
Section 4 discusses the significance of the research results, limitations, and future research directions. Finally,
Section 5 presents the conclusions of this study.
2. Proposed AI-Based Observer System
2.1. Architecture of the AI-Based Observer System
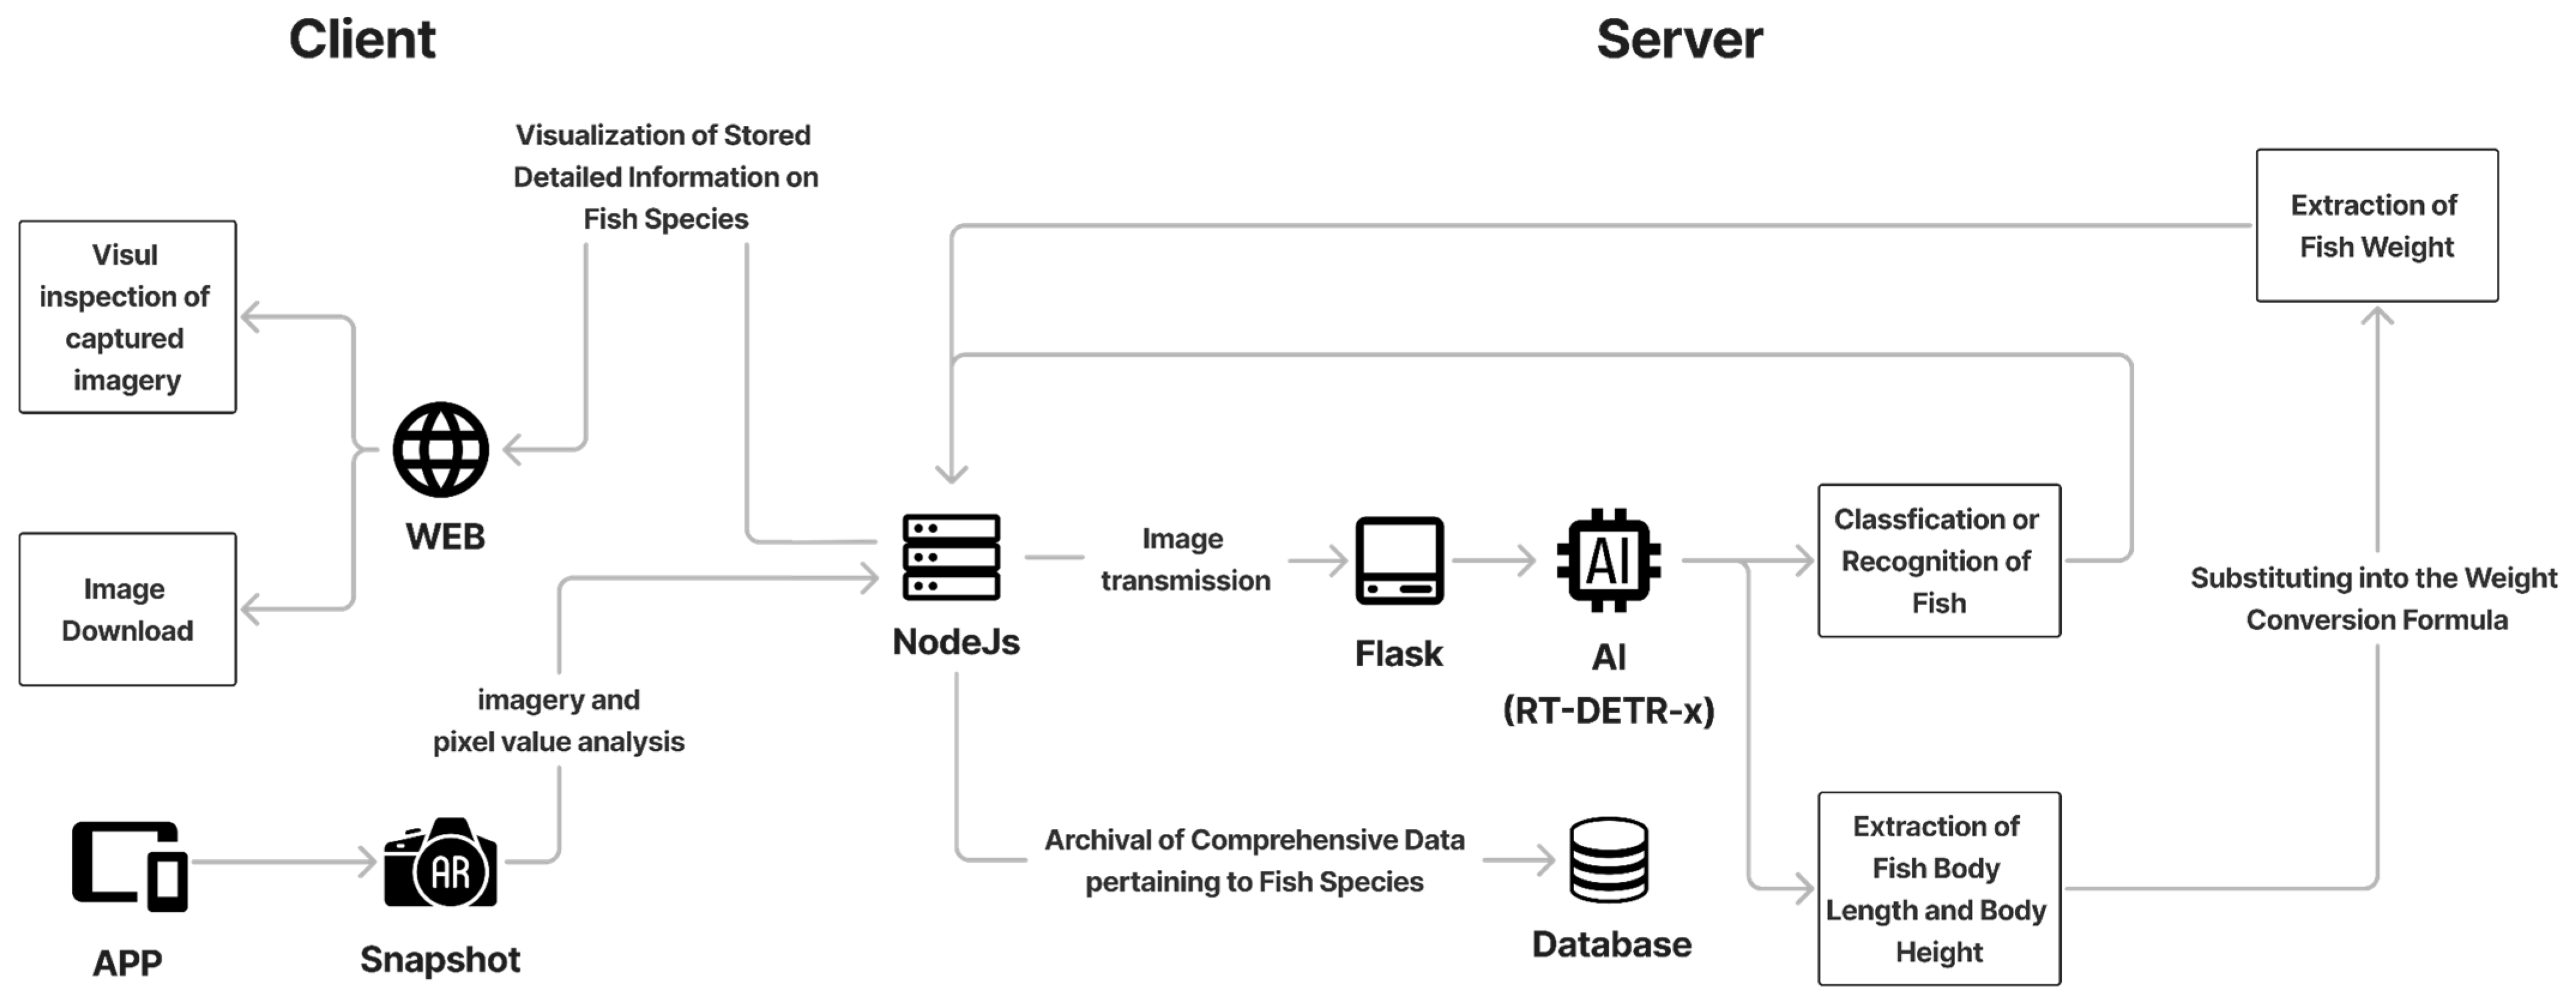
The overall structure of the proposed automated fish species recognition and body measurement system is shown in
Figure 1, comprising two main components: client and server.
Figure 1 visually illustrates the system’s complete architecture. The left side represents the Client portion, depicting the user interface, while the right side shows the Server portion, representing backend processing. Arrows indicate data flow, expressing interactions between components. The Client section consists of interfaces directly used by fishery resource inspectors, including a mobile application (app) and web interface. The mobile application utilizes ARCore technology [
18,
19,
20,
21,
22] to capture images of fish species and calculate the pixel-to-real-distance ratio. ARCore, an augmented reality platform developed by Google, enables accurate measurements through 3D spatial recognition. The web interface visualizes images captured via the app and analyzed result information, including fish market, time, date, distance between camera and fish, pixel value, length, height, and weight.
The Server section comprises a Node.js-based API server and a Flask-based image analysis server. The API server manages and stores images transmitted from the mobile app and handles communication with clients. The image analysis server uses the RT-DETR model, an object recognition algorithm, to identify and classify fish species and measure body length and height. RT-DETR combines the real-time processing capability of YOLO (You Only Look Once) [
23,
24,
25] with the high accuracy of DETR (Detection Transformer) [
26,
27], offering both speed and precision. The extracted body length and height are used to calculate weight, and all results are stored in the database.
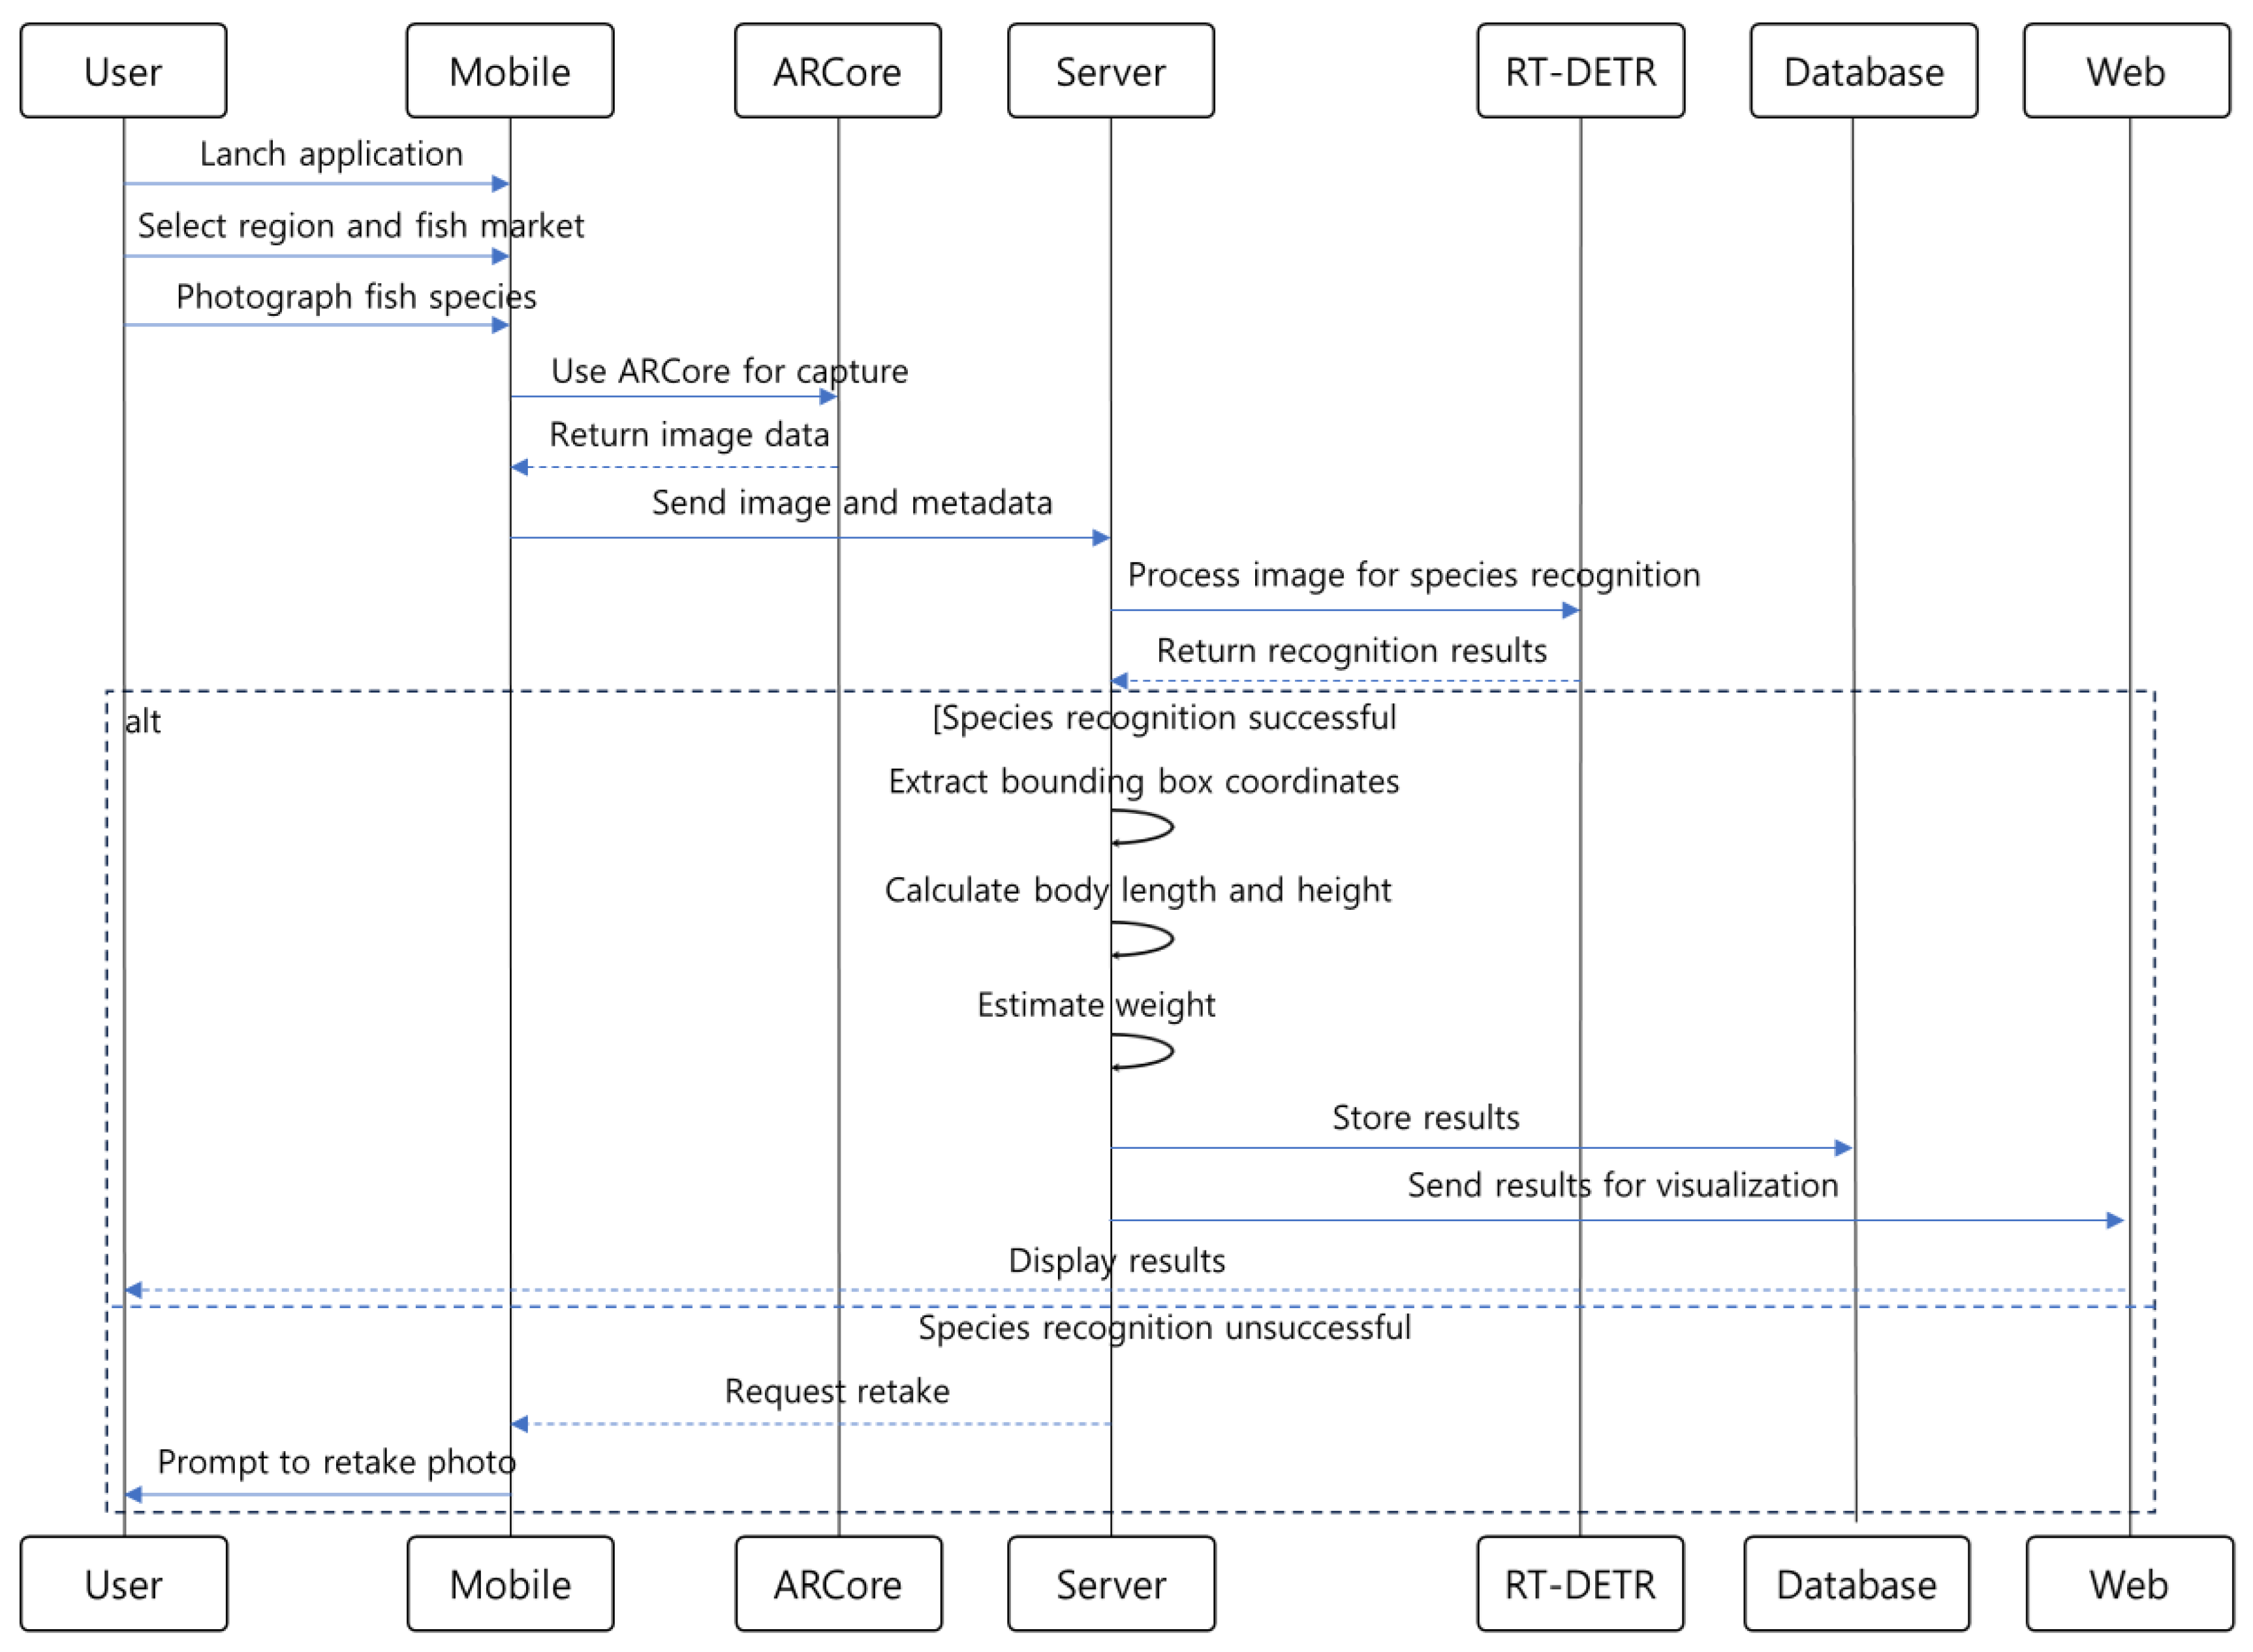
Figure 2 presents a detailed flowchart of the proposed system’s algorithm, showing the fish species recognition and body measurement process step by step. The process begins with the user launching the application and selecting the region and fish market. After selection, fish species are photographed using ARCore technology. The captured images are sent to the server along with relevant metadata, during which the system confirms successful transmission in the image list.
On the server side, received images are processed through the RT-DETR model for species recognition. The success of species recognition is verified at this stage, and if unsuccessful, the user is prompted to retake the photo. Upon successful recognition, the bounding box coordinates of the identified species are extracted to measure body length and height. Weight is calculated based on these measurements, results are stored in the database, and visualized for the user through the web interface.
Key features of this system include the development of a smartphone-based application utilizing ToF sensors and AR cameras, accurate fish species recognition using the RT-DETR model, precise body length and height measurements using ARCore technology, and automatic storage of measured data in the database, all integrated into a comprehensive solution.
By combining these features, this system enables accurate monitoring of TAC depletion rates, thereby preventing the exhaustion of fishery resources due to increased demand and overfishing, and enhancing the sustainability of fishing activities. Additionally, it is expected to complement the ability of fishery resource inspectors to identify similar species and facilitate systematic management of fishery resources.
2.2. Application Structure and Algorithm
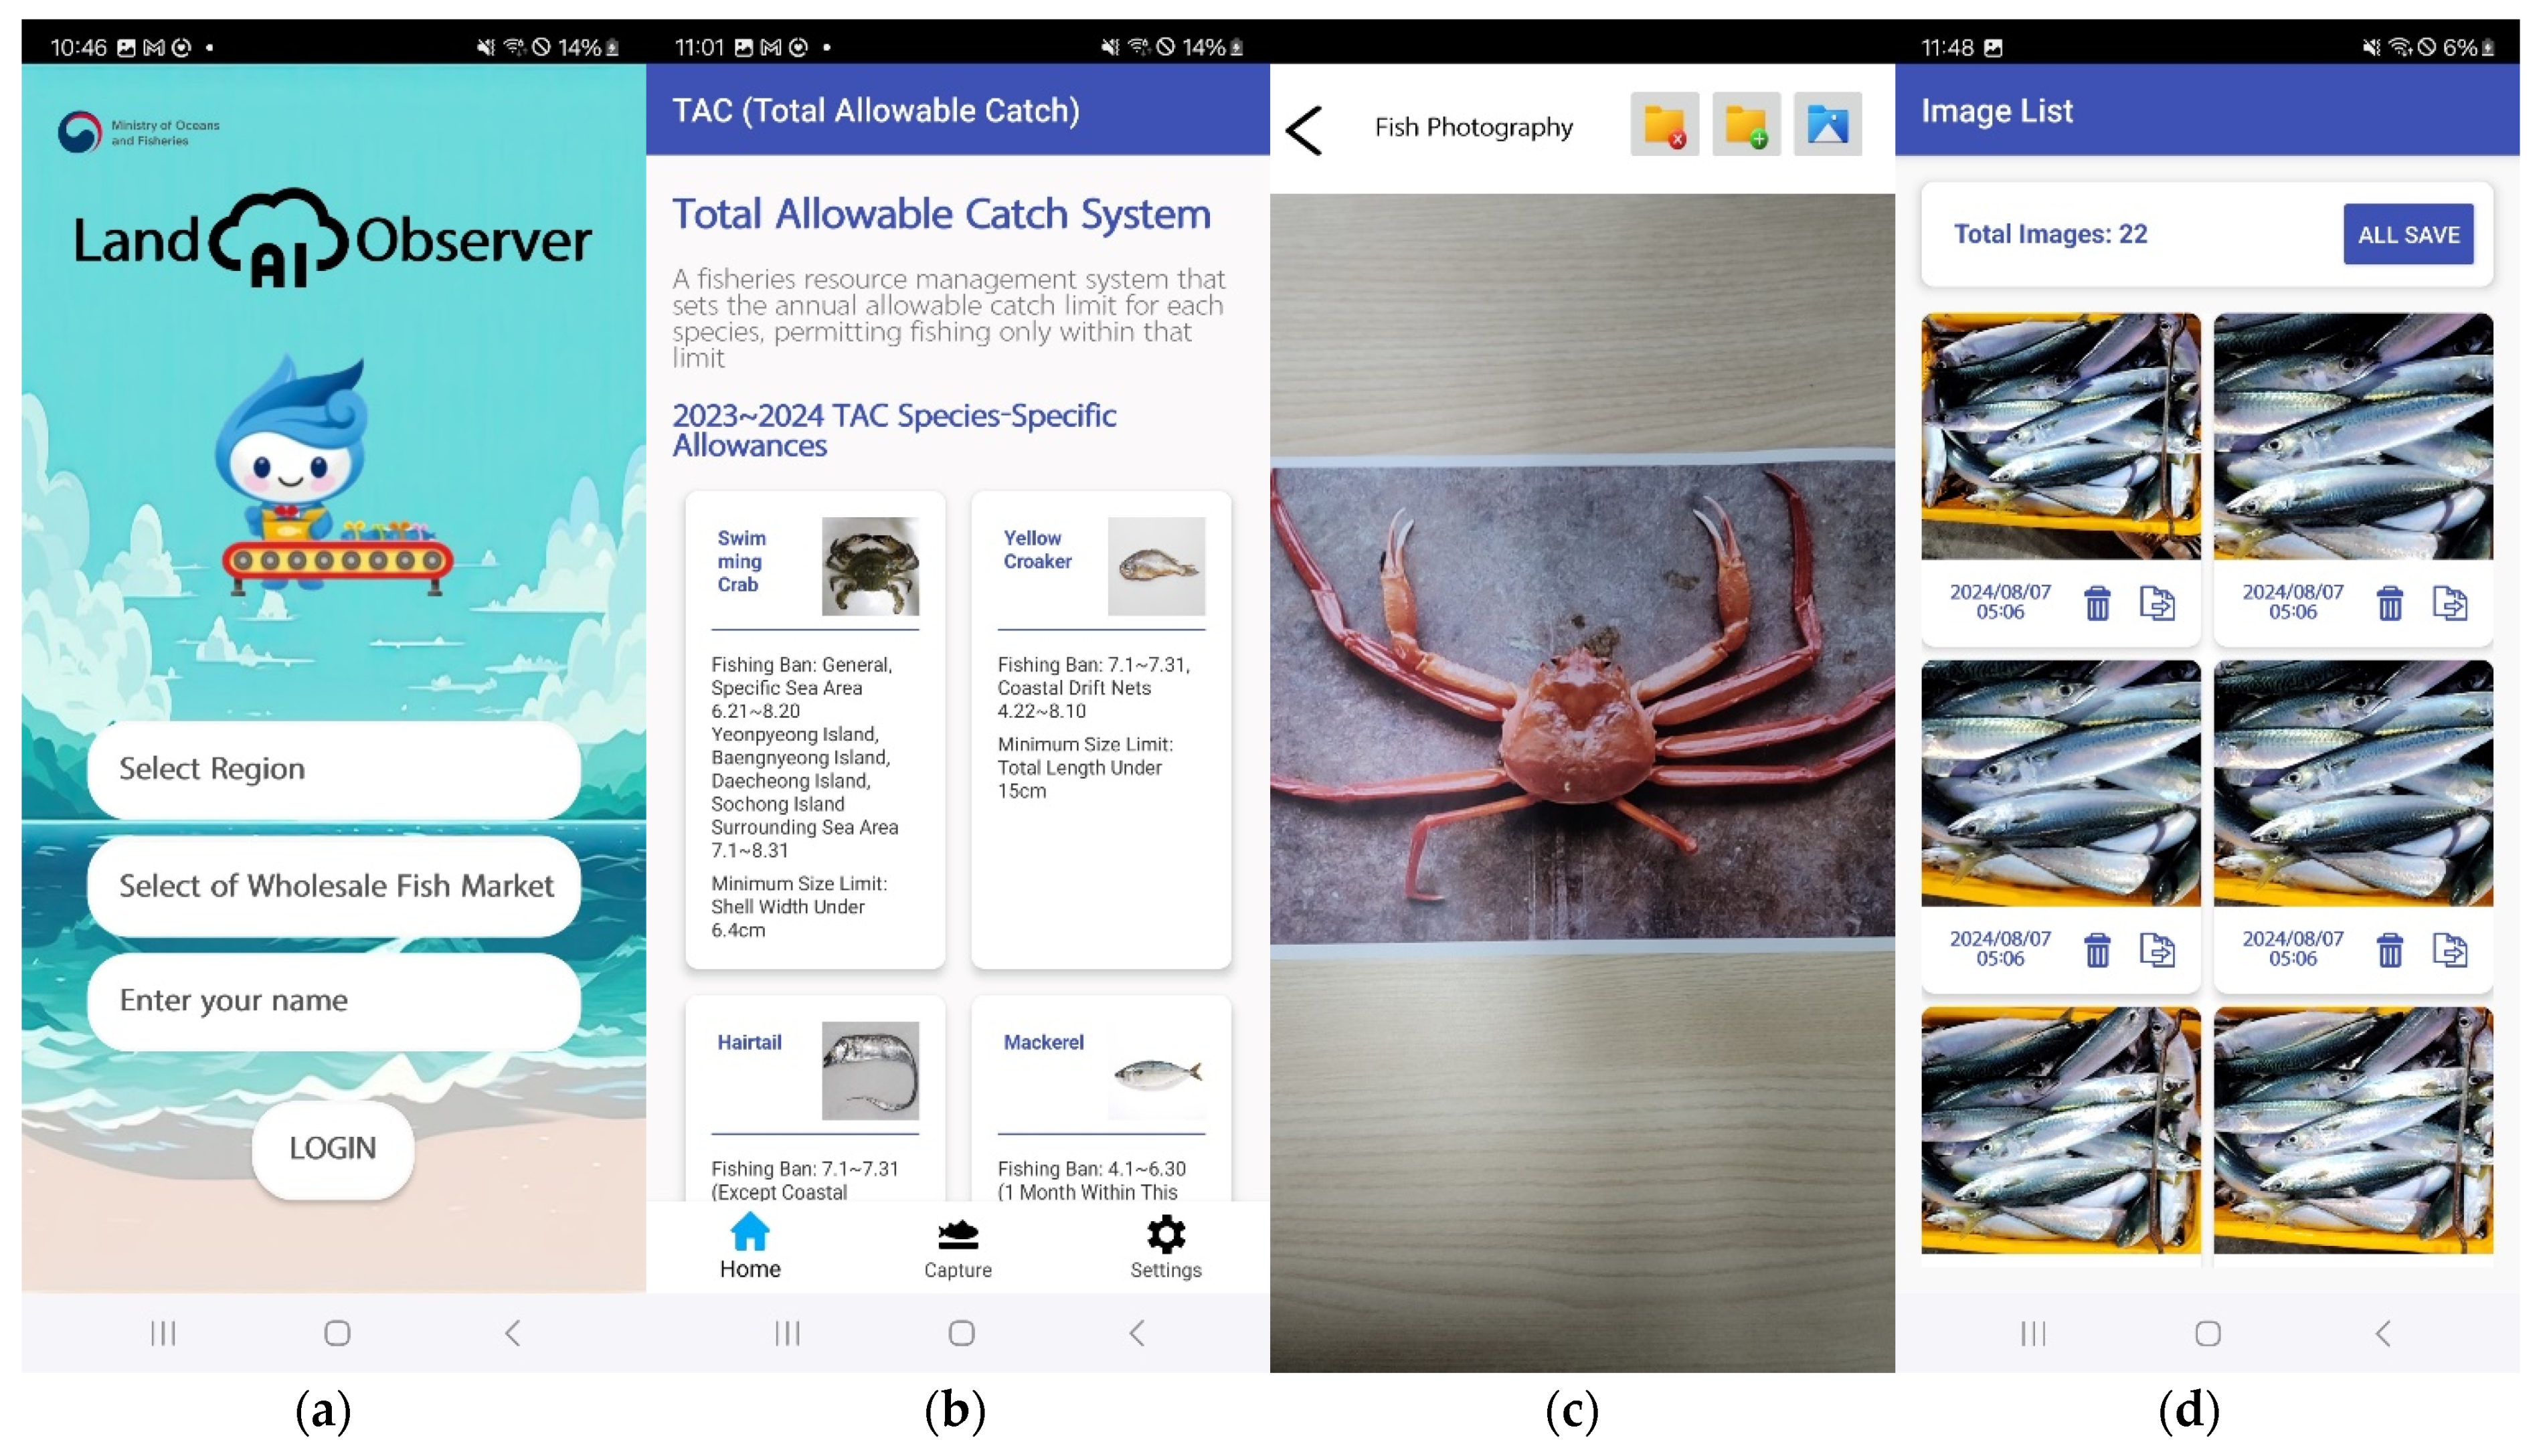
The application developed in this study provides an efficient fish species recognition and body measurement system by combining a user-friendly interface with ARCore technology. The application’s structure is designed to optimize user workflow and consists of four main screens, as illustrated in
Figure 3.
Figure 3 shows the key screens of the application: the initial screen, the home screen, the species photography screen, and the image list screen. On the initial screen (
Figure 3a), which serves as the application’s starting point, users can select the fish market and region. After logging in, the home screen (
Figure 3b) displays important information such as Korean TAC species, fishing bans, and size restrictions. The species photography screen (
Figure 3c), which is the core screen of the application, provides a photographing function utilizing ARCore technology [
18,
19,
20,
21,
22]. A one-touch photographing method improves the convenience and speed of capture for inspectors. Captured images are automatically saved to the image list screen (
Figure 3d). On this screen, users can transmit or delete individual images, and a feature to transmit all images at once is also implemented.
Saved images are stored with names including the current date and time, and when transmitted to the server, metadata such as fish market, current date, time, distance between camera and species, single pixel value, x, y coordinates of the touched area, and image type are sent together. This transmitted data is used to measure the body length and height of the species.
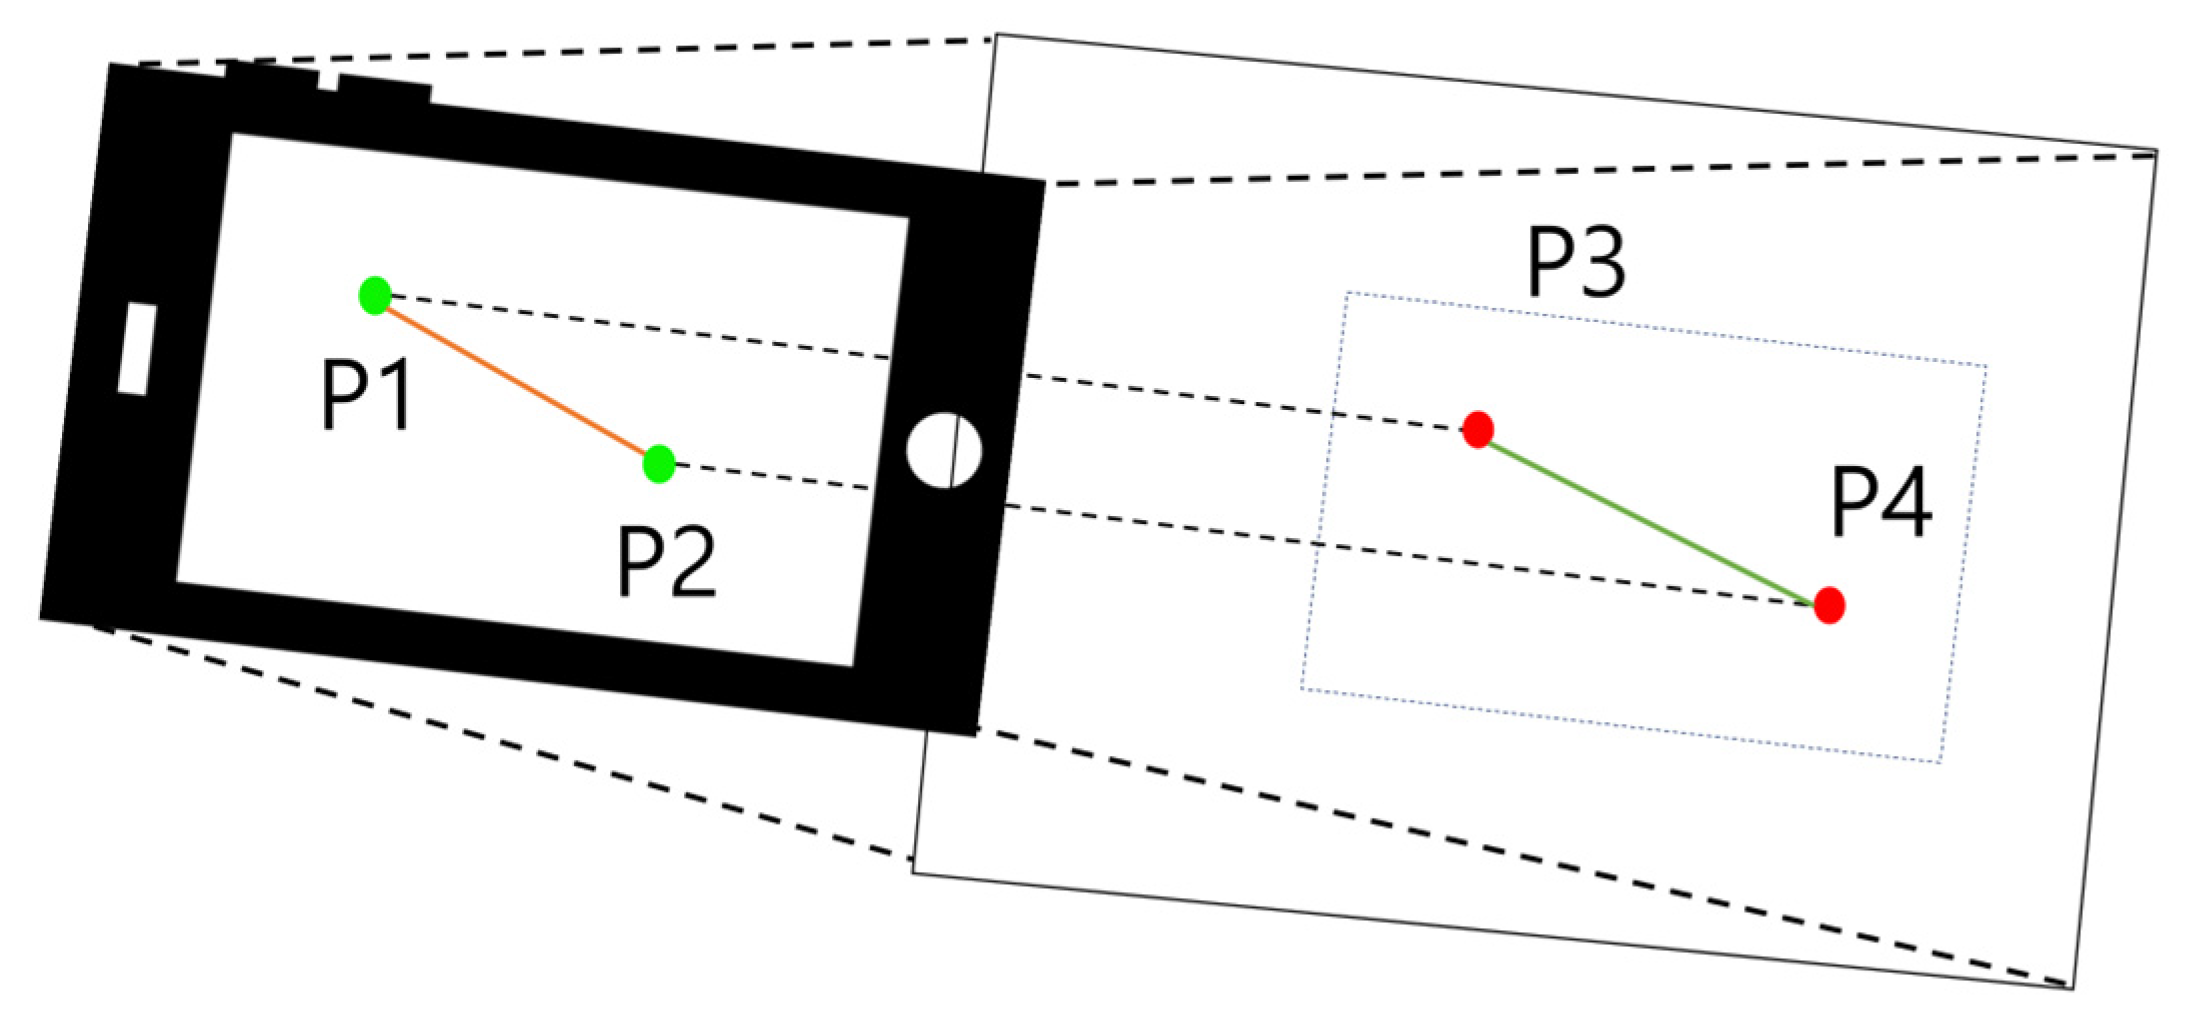
ARCore technology plays a crucial role in this system. This technology enables accurate body length and height measurements by measuring the distance between the camera and objects and extracting real-world 3D coordinates. Through this, the algorithm developed in this study estimates the actual size of fish species using the relationship between smartphone screen coordinates and real-world coordinates, and consists of 16 steps in total.
Figure 4 visualizes this process, where green points p1 and p2 represent arbitrary coordinates on the smartphone screen, and red points p3 and p4 represent the corresponding real-world coordinates.
Algorithm 1 illustrates the core structure of the AR-based distance measurement algorithm proposed in this study. This algorithm utilizes ARCore technology to derive a precise relationship between real physical distances and pixels in digital images.
The algorithm initializes the AR environment by extracting the current AR frame and screen dimensions. Subsequently, two 2D reference points, P1 and P2, are established on the screen. P1 is positioned at the x-coordinate of 1/3 of the screen width and the y-coordinate of 1/2 of the screen height, while P2 is generated a specific pixel distance (200 pixels in this study) to the right of P1. This relative positioning method ensures the algorithm’s adaptability across devices with varying screen sizes.
The ARCore hit test function is then employed to extract the corresponding 3D real-world coordinates, p3 and p4, from these 2D points. This process establishes a reliable measurement baseline by providing an accurate mapping between the AR and real environments. The distance D between the extracted 3D coordinates p3 (x3,y3,z3) and p4 (x4,y4,z4) is calculated using the Euclidean distance formula:
where D represents the actual physical distance between the two points. This distance is then divided by the pixel distance between the two points on the screen to derive the real-world distance ratio per pixel.
Each step of this algorithm plays a crucial role in enhancing the overall accuracy and efficiency of the system. The utilization of a 3D coordinate system enables precise measurements independent of camera angle or distance to the target, significantly increasing the algorithm’s applicability across diverse fishing field environments.
| Algorithm 1 AR-based Distance Measurement |
INPUT: arFragment, screenWidth, screenHeight
OUTPUT: pixelToRealWorldRatio
1. arFrame ← arFragment.arSceneView.arFrame
2. centerX ← screenWidth/3
3. centerY ← screenHeight/2
4. hitResult1 ← arFrame.hitTest(centerX, centerY)
5. hitResult2 ← arFrame.hitTest(centerX + 200, centerY)
6. IF hitResult1 IS NOT EMPTY AND hitResult2 IS NOT EMPTY THEN
7. anchor1 ← hitResult1[0].createAnchor()
8. anchorNode1 ← NEW AnchorNode(anchor1)
9. anchor2 ← hitResult2[0].createAnchor()
10. anchorNode2 ← NEW AnchorNode(anchor2)
11. realWorldDistance←calculateDistance(anchorNode1.worldPosition,anchorNode2.worldPosition)
12. pixelToRealWorldRatio ← realWorldDistance/200
13. RETURN pixelToRealWorldRatio
14. ELSE
15. RETURN NULL
16. END IF
FUNCTION calculateDistance(position1, position2)
RETURN SQRT((position1.x − position2.x)^2 + (position1.y − position2.y)^2 + (position1.z − position2.z)^2)
END FUNCTION |
The extracted pixel-to-real-distance ratio and metadata are transmitted to the Flask server along with the captured image. The server uses the RT-DETR model to recognize and classify the fish species, then extracts the bounding box coordinates of the recognized species. The body length and height of the species are calculated by multiplying the pixel-to-real-distance ratio. Body length is calculated by multiplying the number of pixels corresponding to the width of the bounding box by the real distance per pixel (Equation (2)), and body height is calculated using the same method (Equation (3)). Here, BL represents Body Length, BH represents Body Height,
and
are the x-coordinates of the left and right boundaries of the bounding box,
and
are the y-coordinates of the top and bottom boundaries, and P is the real distance ratio per pixel. This method allows for accurate measurement of the body length and height of fish species. Consequently, it is expected to have a significant impact on the efficient operation of the TAC system by enabling weight conversion through body length and height measurements.
2.3. RT-DETR Model Overview
In this study, we adopted the RT-DETR model to enhance the accuracy and speed of fish species recognition. RT-DETR is a state-of-the-art object detection model that combines YOLO’s real-time processing capability and fast speed with DETR’s high accuracy. This model enables end-to-end learning and provides high computational efficiency without the need for Non-Maximum Suppression (NMS) post-processing.
Key features of the RT-DETR model include an efficient hybrid encoder that rapidly processes multi-scale features, an uncertainty minimization query selection method that improves accuracy by providing high-quality initial queries to the decoder, and flexible speed adjustment capability that adapts to various scenarios without retraining by adjusting the number of decoder layers.
The structure of this model consists of a backbone, an efficient hybrid encoder, and a transformer decoder with auxiliary prediction heads. The encoder extracts features from the input image, and the decoder predicts the position and class of objects based on these features. This structure is an improvement on DETR’s basic architecture, optimized for real-time processing.
Compared to the YOLO series [
23,
24,
25], RT-DETR improved inference speed by eliminating the NMS process and enhanced the efficiency of multi-scale feature processing by expanding on the concept of Deformable DETR. As a result, RT-DETR achieved 54.8% mAP on the COCO Dataset and demonstrated an inference speed of about 74 FPS (Frames per second) on GPU, making it more suitable for our system than the YOLO series models (
Table 1).
These characteristics of the RT-DETR model make it optimal for the rapid and accurate fish species recognition targeted in this study. Its real-time processing capability and high accuracy enable immediate species recognition and classification in the field.
2.4. Dataset Construction and Training Process
In this study, we developed a unique dataset comprising 11 species that are part of the Total Allowable Catch (TAC) system. The target species included Scomber japonicus, Trichiurus lepturus, Trachurus japonicus, Portunus trituberculatus, Chionoecetes opilio, Chionoecetes japonicus, Larimichthys polyactis, Decapodiformes, Scomberomorus niphonius, Arctoscopus japonicus, and Raja pulchra. Our research team filmed approximately 5000 images per species directly from the field, resulting in a large-scale dataset of 55,000 images.
To ensure the robustness and generalization capabilities of the model, we collected data under diverse environmental conditions and applied various preprocessing techniques. Images were captured at multiple fish markets and auction houses, considering a wide range of lighting scenarios including natural light conditions (clear days, overcast weather, dawn, and dusk) and artificial lighting (fluorescent and LED illumination). This diversity in lighting conditions significantly contributed to the model’s ability to perform consistently across different environments. All collected images were resized to 640 × 640 pixels to maintain consistency and quality across the dataset. Furthermore, we enhanced the dataset’s variability through data augmentation techniques, including random horizontal flips and rotations (±15 degrees). These preprocessing steps, combined with the diverse data collection approach, were crucial in improving the model’s adaptability to various real-world scenarios and its overall performance in fish species recognition tasks.
A key feature of the system proposed in this study is the application of various body length measurement criteria tailored to the characteristics of each species [
28,
29]. These diverse body length measurement criteria were reflected in the annotation of each image during the dataset construction process. For instance, fork length was used for
Scomber japonicus, anal length for
Trichiurus lepturus, and carapace width for
Portunus trituberculatus. This method enables the model to more accurately recognize the distinctive forms of each species during the learning process.
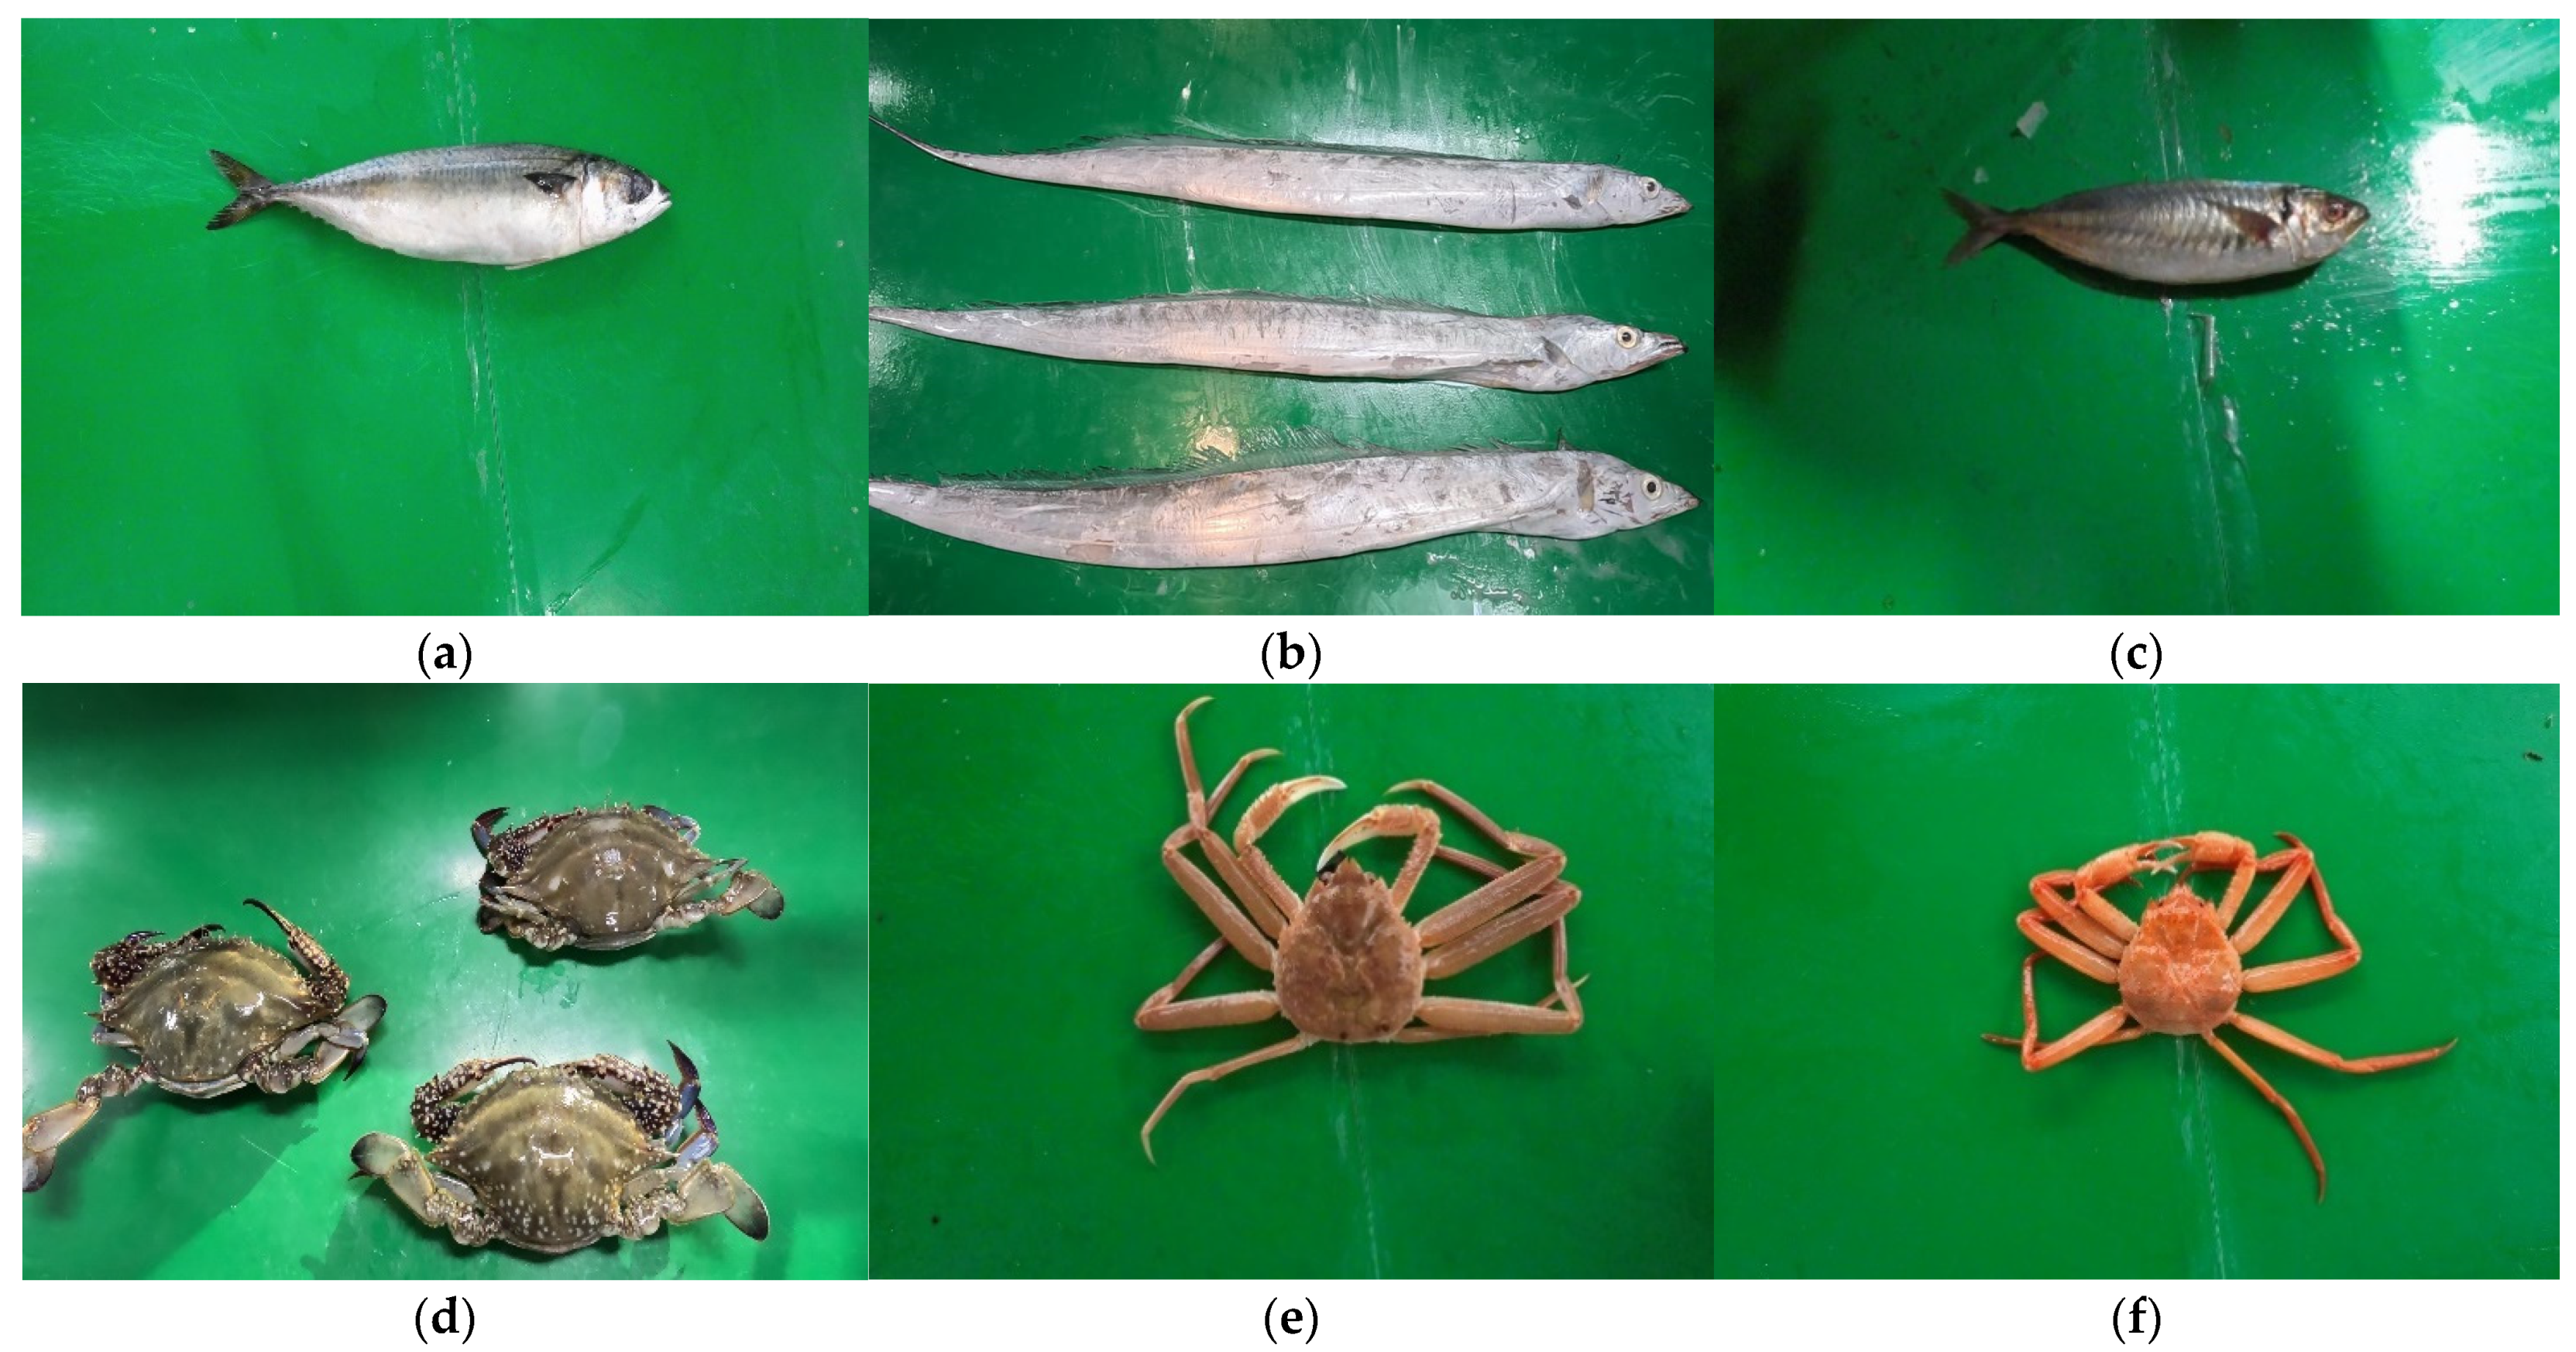
Figure 5a–f presents representative images of the major species in the dataset:
Scomber japonicus,
Trichiurus lepturus,
Trachurus japonicus,
Portunus trituberculatus,
Chionoecetes opilio, and
Chionoecetes japonicus. These images were filmed from various angles and under different lighting conditions, reflecting real field environments. This consideration ensures that the model maintains high accuracy in diverse settings.
The dataset was classified into Train, Valid, and Test sets, with a ratio of 7:2:1. This classification method was designed to systematically perform the learning, validation, and evaluation processes of the model. The Train dataset is directly used for model learning, the Validation dataset is used to periodically evaluate the model’s performance during learning and adjust hyperparameters, and finally, the Test dataset is used to evaluate the model’s final performance after learning is completed.
As shown in
Table 2, a balanced data distribution is maintained for each species. This is designed to allow the model to learn various species evenly without bias towards specific species. This dataset construction method, applying species-specific customized body length measurement criteria, significantly contributed to improving the accuracy of species recognition by enabling the model to more accurately recognize the characteristics of each species during the learning process.
The balanced distribution and species-specific criteria ensure that the model performs consistently across all target species, which is crucial for the system’s practical application in current fishery management practices. This approach enhances the model’s ability to accurately identify and measure diverse fish species in real-world scenarios.
For the ARCore-based measurements and field testing, we used a Samsung Galaxy S22 Ultra smartphone. This device was selected for its advanced hardware specifications, which are crucial for accurate AR-based measurements. The Galaxy S22 Ultra features a powerful Exynos 2200 processor, 12 GB of RAM, and a high-resolution camera system including a 108 MP main camera and a dedicated depth sensor. These specifications ensure smooth operation of the ARCore technology and precise depth perception, which are essential for accurate fish length measurements.
The device was chosen specifically for its high-resolution camera for detailed image capture, depth sensor for precise AR measurements, and powerful processor for smooth real-time processing of AR applications in the field. This hardware setup allowed us to achieve consistent and accurate measurements across various fish species and environmental conditions.
2.5. Experimental Setup
This study, we configured the experimental environment and hyperparameters as shown in
Table 3 to optimize the performance of the RT-DETR model. The operating system used for training was Ubuntu, with CUDA version 12.4 supporting GPU acceleration, and high-performance computations were performed using an NVIDIA RTX A6000 GPU (NVIDIA Corporation, Santa Clara, CA, USA). For the software environment, we used Python 3.8.19 and PyTorch 2.2.2. PyTorch is a widely used framework for deep learning model development, offering both performance and flexibility.
The main hyperparameter settings for model training were as follows: training was conducted over 300 epochs with a batch size of 32. We used Stochastic Gradient Descent (SGD) as the optimization algorithm, with a learning rate of 0.01 and 8 workers. The choice of 300 epochs was determined through extensive experimentation and analysis. Initial tests with various epoch values between 200 and 400 showed that model performance converged optimally at 300 epochs. Beyond this point, no significant decrease in validation loss was observed, and signs of overfitting began to appear.
To address the overfitting problem, we applied several strategies in combination. We introduced an early stopping technique, halting training if the validation loss did not improve for 10 consecutive epochs. Data augmentation techniques, including random horizontal flips and rotations (±15 degrees), were applied to enhance the model’s generalization ability. For learning rate adjustment, we employed a cosine annealing schedule to gradually decrease the learning rate during the training process.
Throughout the training process, we used TensorBoard version 2.14.0. (PyTorch 2.2.2 setup) to monitor metrics such as training and validation loss and accuracy in real-time. This allowed us to continuously observe changes in model performance and detect signs of overfitting early. We observed that the validation loss stabilized after approximately 250 epochs, supporting the validity of our 300-epoch selection.
There are two versions of the RT-DETR model: RT-DETR-X and RT-DETR-L. In this study, we chose the RT-DETR-X model for training, as it demonstrates higher accuracy compared to RT-DETR-L [
30,
31]. Through these environment settings and model selection, we optimized the performance of the RT-DETR model, consequently improving the overall performance of the automated fish species recognition and body measurement system proposed in this paper.
3. Results
3.1. Model Performance Evaluation
We custom-trained both YOLOv8x and RT-DETR-x models for the 11 TAC target species. To objectively evaluate and compare the performance of each model, we utilized standard performance metrics widely used in object detection, including precision, recall, F1 score, and mAP50. These metrics allowed us to analyze the model’s performance from multiple angles and comprehensively assess the expected effects when applied to actual fish species recognition and systems.
Precision represents the proportion of correctly identified objects among those predicted by the model for a specific class, indicating how accurately the model identified relevant objects. It is calculated as shown in Equation (4), where TP (True Positives) is the number of correctly detected objects, and FP (False Positives) is the number of incorrectly detected objects.
Recall signifies the proportion of objects correctly predicted by the model among those actually belonging to a specific class, indicating how completely the model found relevant objects. Recall is calculated as shown in Equation (5), where TP is the same as in precision, and FN (False Negatives) represents the number of actual objects the model failed to detect.
The F1 Score balances precision and recall. It is calculated as their harmonic mean. It is particularly useful for evaluating model performance in datasets with class imbalance problems, as it represents balanced performance without leaning towards either precision or recall. The F1 Score ranges from 0 to 1, with values closer to 1 indicating better model performance. As seen in Equation (6), it expresses the overall performance of the model as a single number, considering both metrics, allowing for a comprehensive evaluation of how accurately and completely the model detects relevant objects.
Table 4 shows the mAP50 for each species of the two models. Overall, the RT-DETR-x model showed higher mAP50 values for most species compared to the YOLOv8x model. Particularly improved performance was observed for species such as
Trachurus japonicus and
Arctoscopus japonicus. The average mAP50 of the two models was 96.2% for YOLOv8x and 98.5% for RT-DETR-x, with the RT-DETR-x model showing 2.3% better performance. This indicates that the RT-DETR-x model demonstrates more stable and accurate recognition performance for various species.
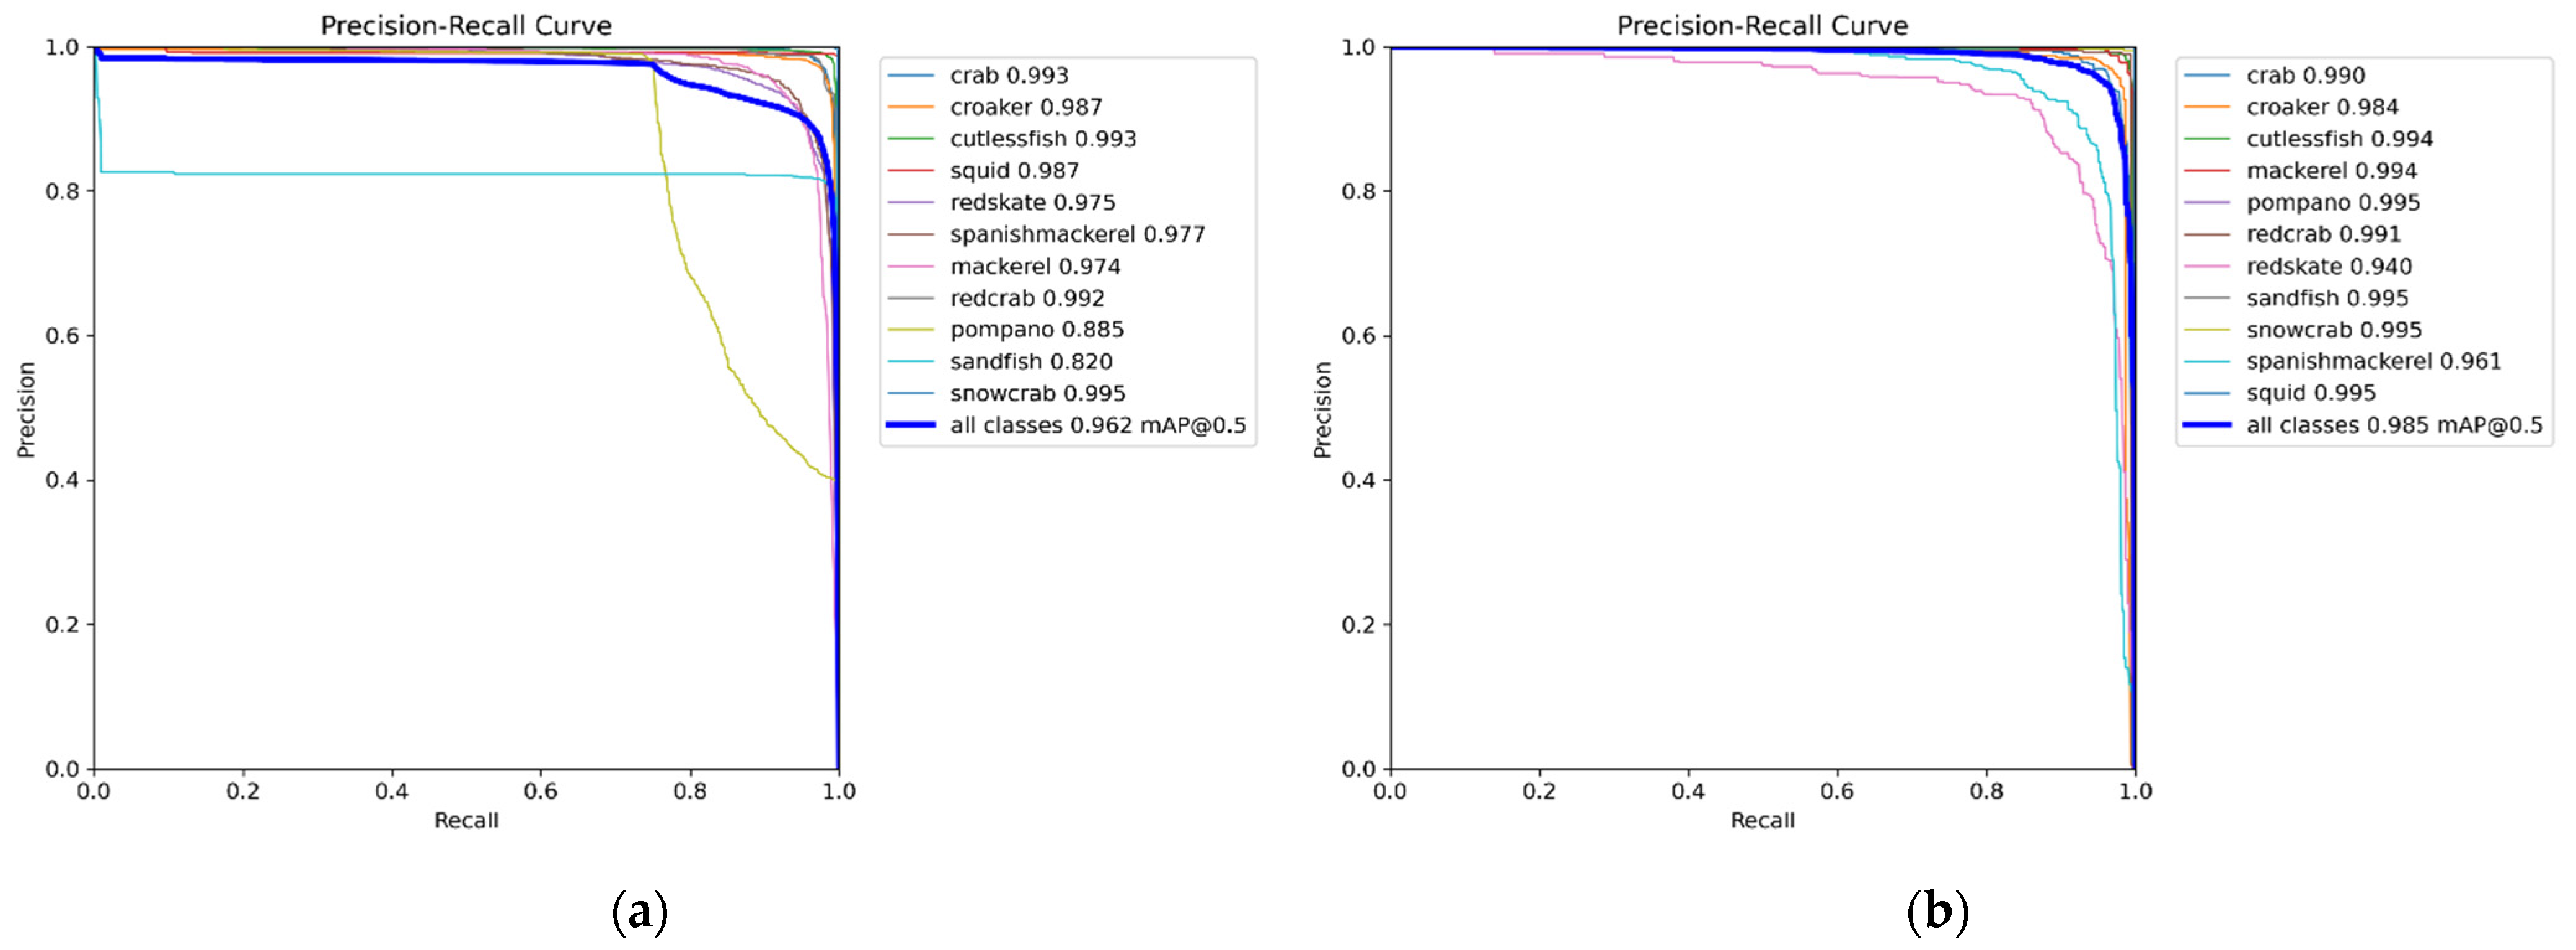
Figure 6 represents the Precision-Recall Curves of the two models. The PR curve visualizes the trade-off between precision and recall, with curves closer to the upper right corner indicating better performance. As shown in
Figure 6, the curve for the RT-DETR-x model (b) is generally positioned more towards the upper right compared to the YOLOv8x model (a), demonstrating higher overall performance.
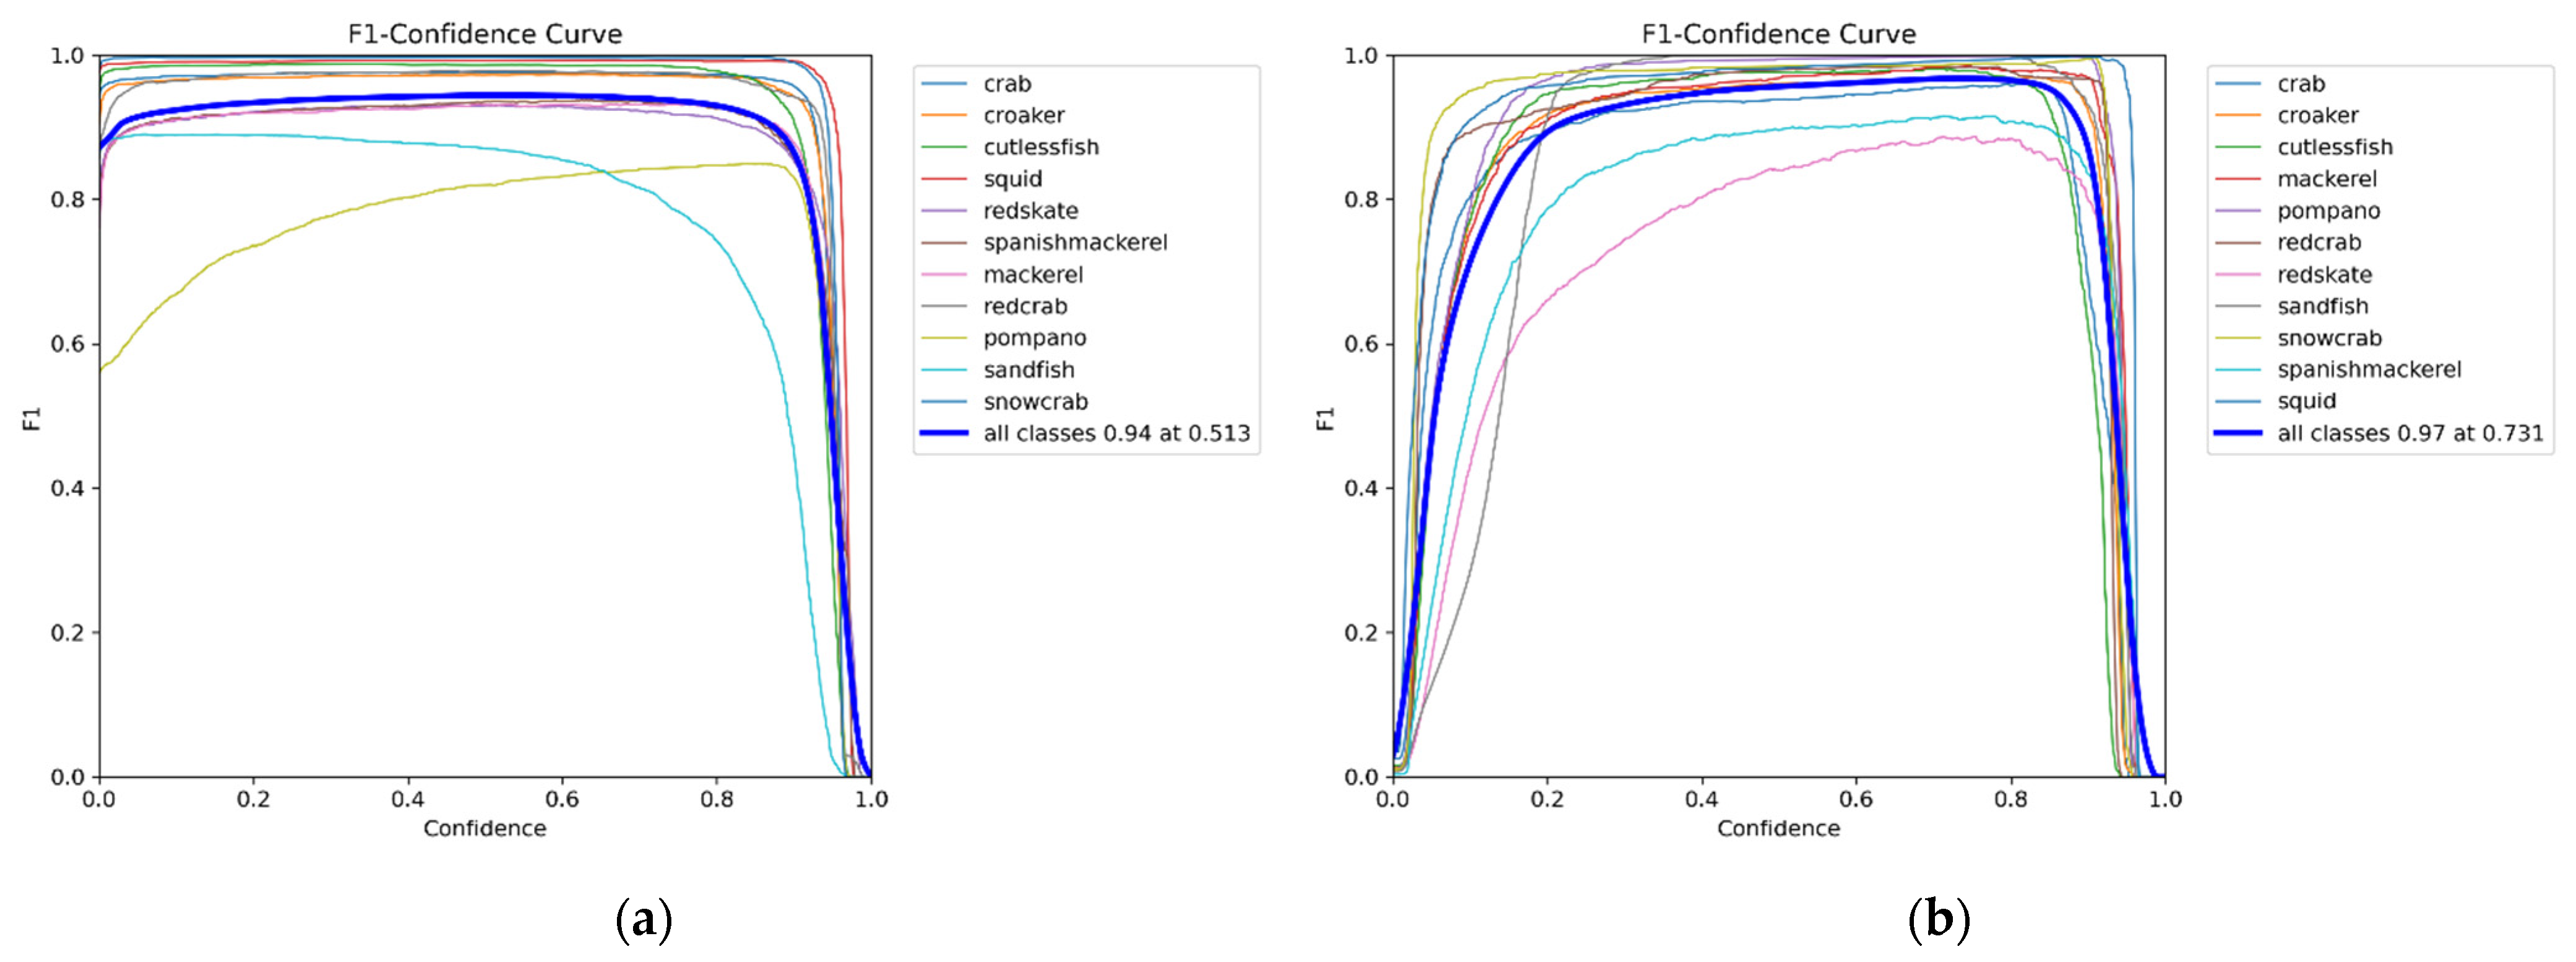
Figure 7 illustrates the F1-Confidence curves of both models. The RT-DETR-x model maintains relatively high F1 scores even in low confidence intervals, indicating more stable performance. This suggests that the RT-DETR-x model can make accurate predictions even in uncertain situations. These performance indicators suggest that the RT-DETR model is expected to provide more reliable species recognition results in actual fishery resource survey fields.
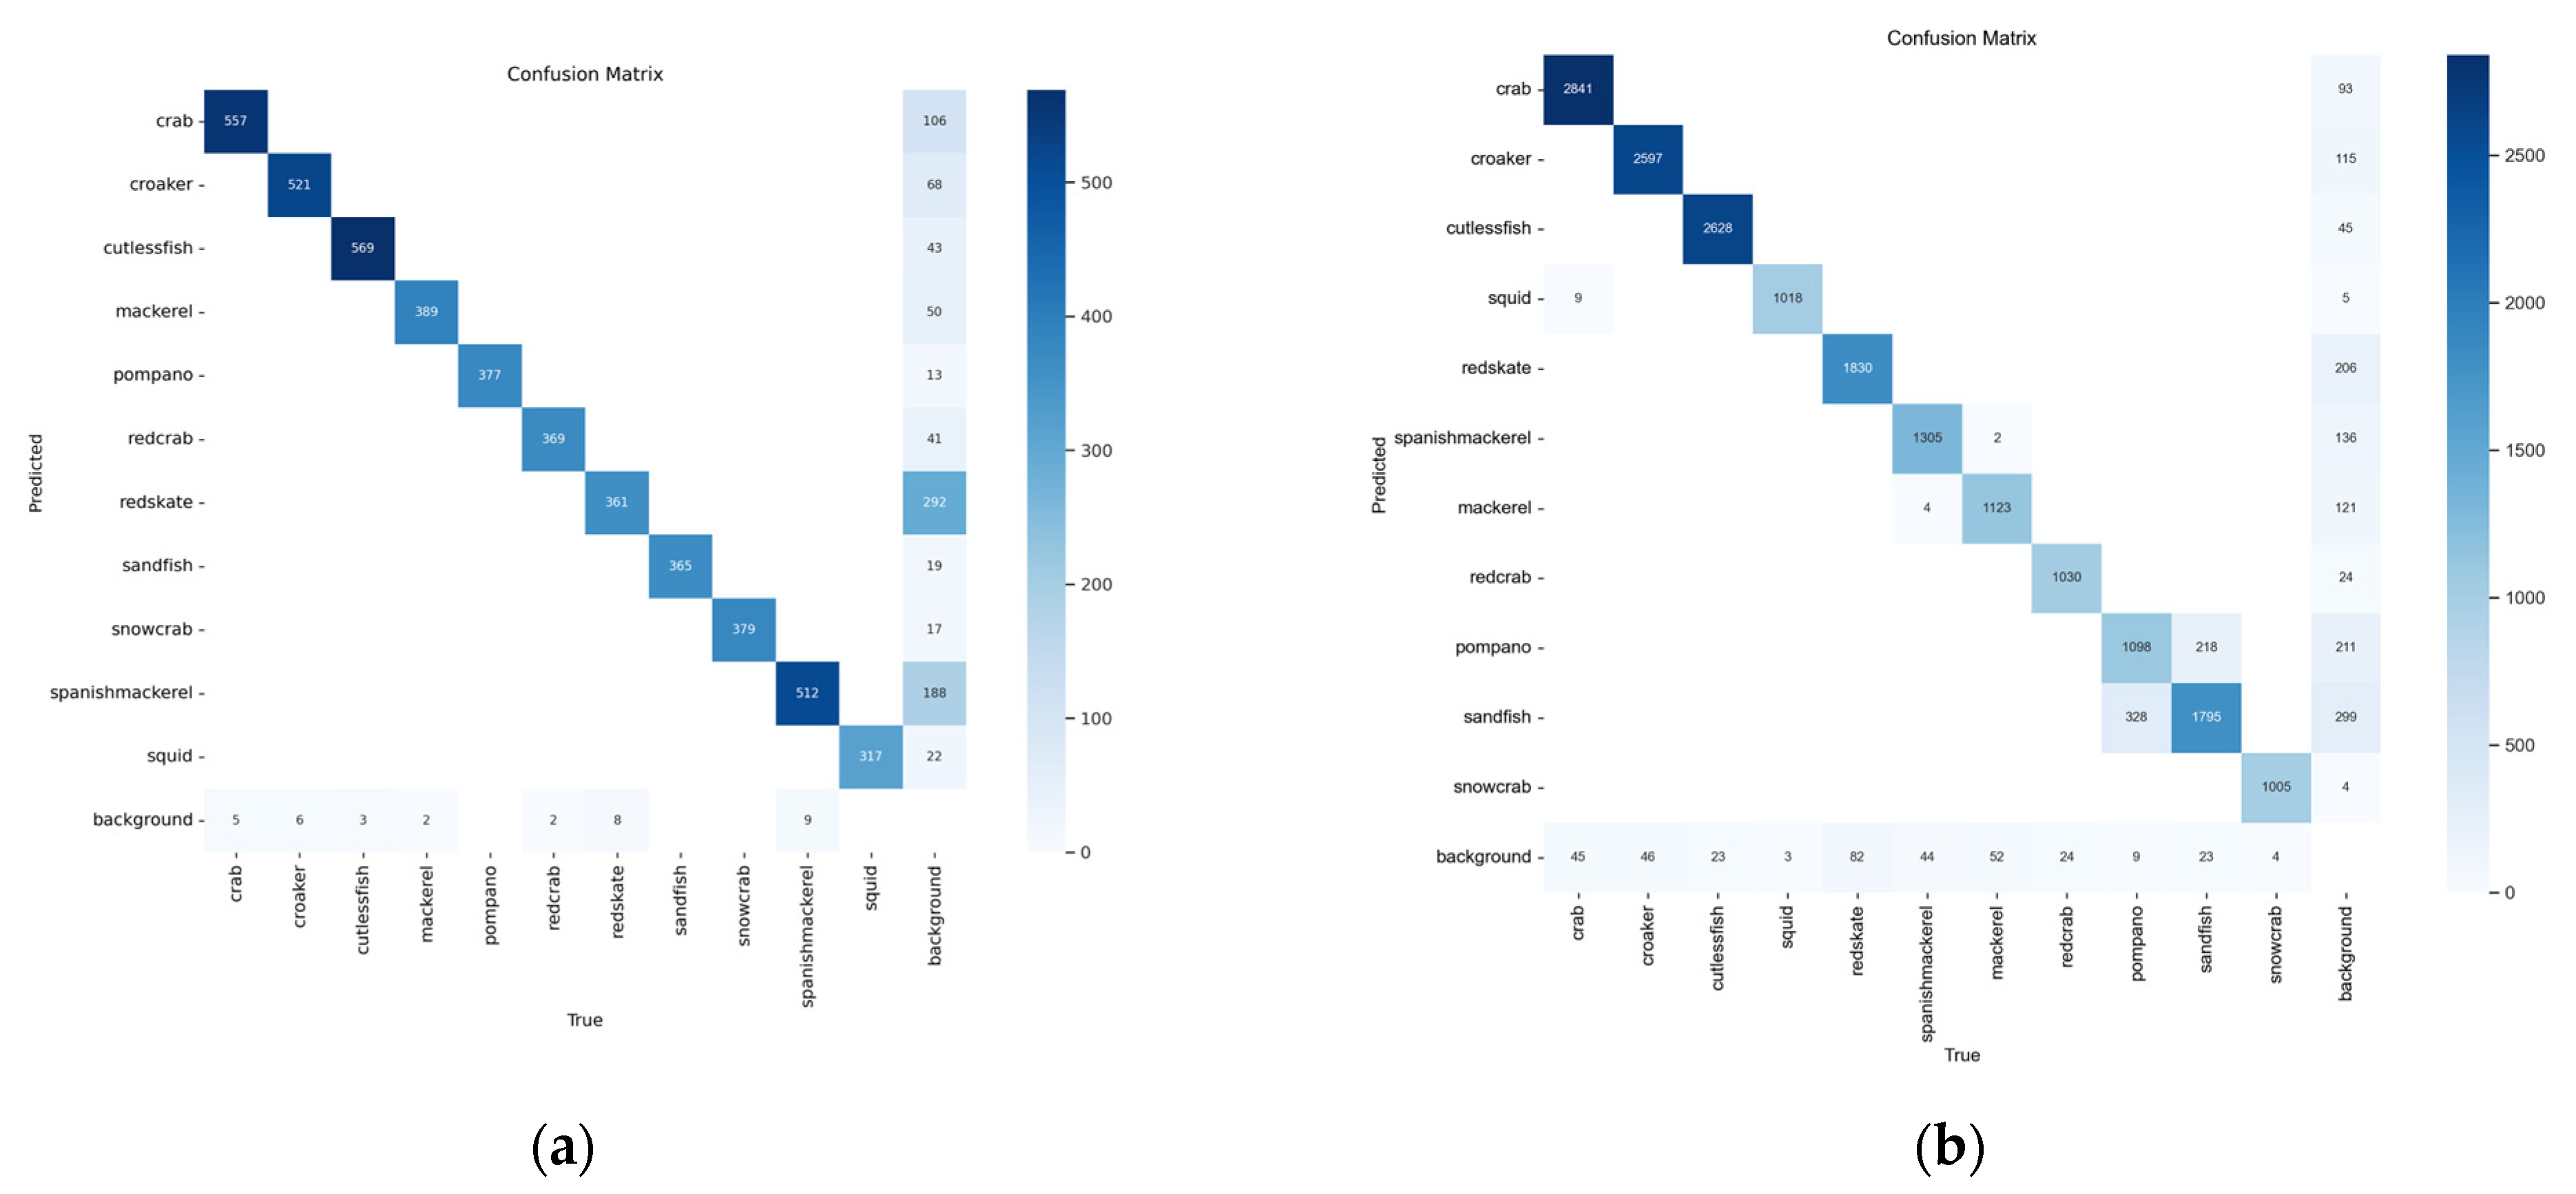
To conduct a more comprehensive performance analysis of the RT-DETR-x and YOLOv8x models, confusion matrices were implemented for each model. These matrices provide a visual representation of the relationship between model predictions and actual classes, offering critical insights into species-specific recognition accuracy, inter-species misclassification patterns, model vulnerabilities, and overall performance equilibrium.
Figure 8 illustrates the confusion matrices for both models: (a) RT-DETR-x and (b) YOLOv8x. Examination of the RT-DETR-x model’s confusion matrix indicates high accuracy across the majority of species. However, notable misclassifications were observed between
Scomber japonicus and
Trachurus japonicus, as well as between
Chionoecetes opilio and
Chionoecetes japonicus. These misclassifications are hypothesized to stem from morphological similarities between the respective species pairs.
In contrast, the YOLOv8x model’s confusion matrix exhibits a higher frequency of off-diagonal values compared to the RT-DETR-x model, suggesting a comparatively elevated misclassification rate. While similar misclassification patterns were observed between the aforementioned species pairs, these occurred with greater frequency in the YOLOv8x model. Furthermore, the YOLOv8x model demonstrated particularly diminished performance in the recognition of Trichiurus lepturus.
This comparative analysis of confusion matrices corroborates the superior stability and accuracy of the RT-DETR-x model in the context of this study’s specific fish species recognition task.
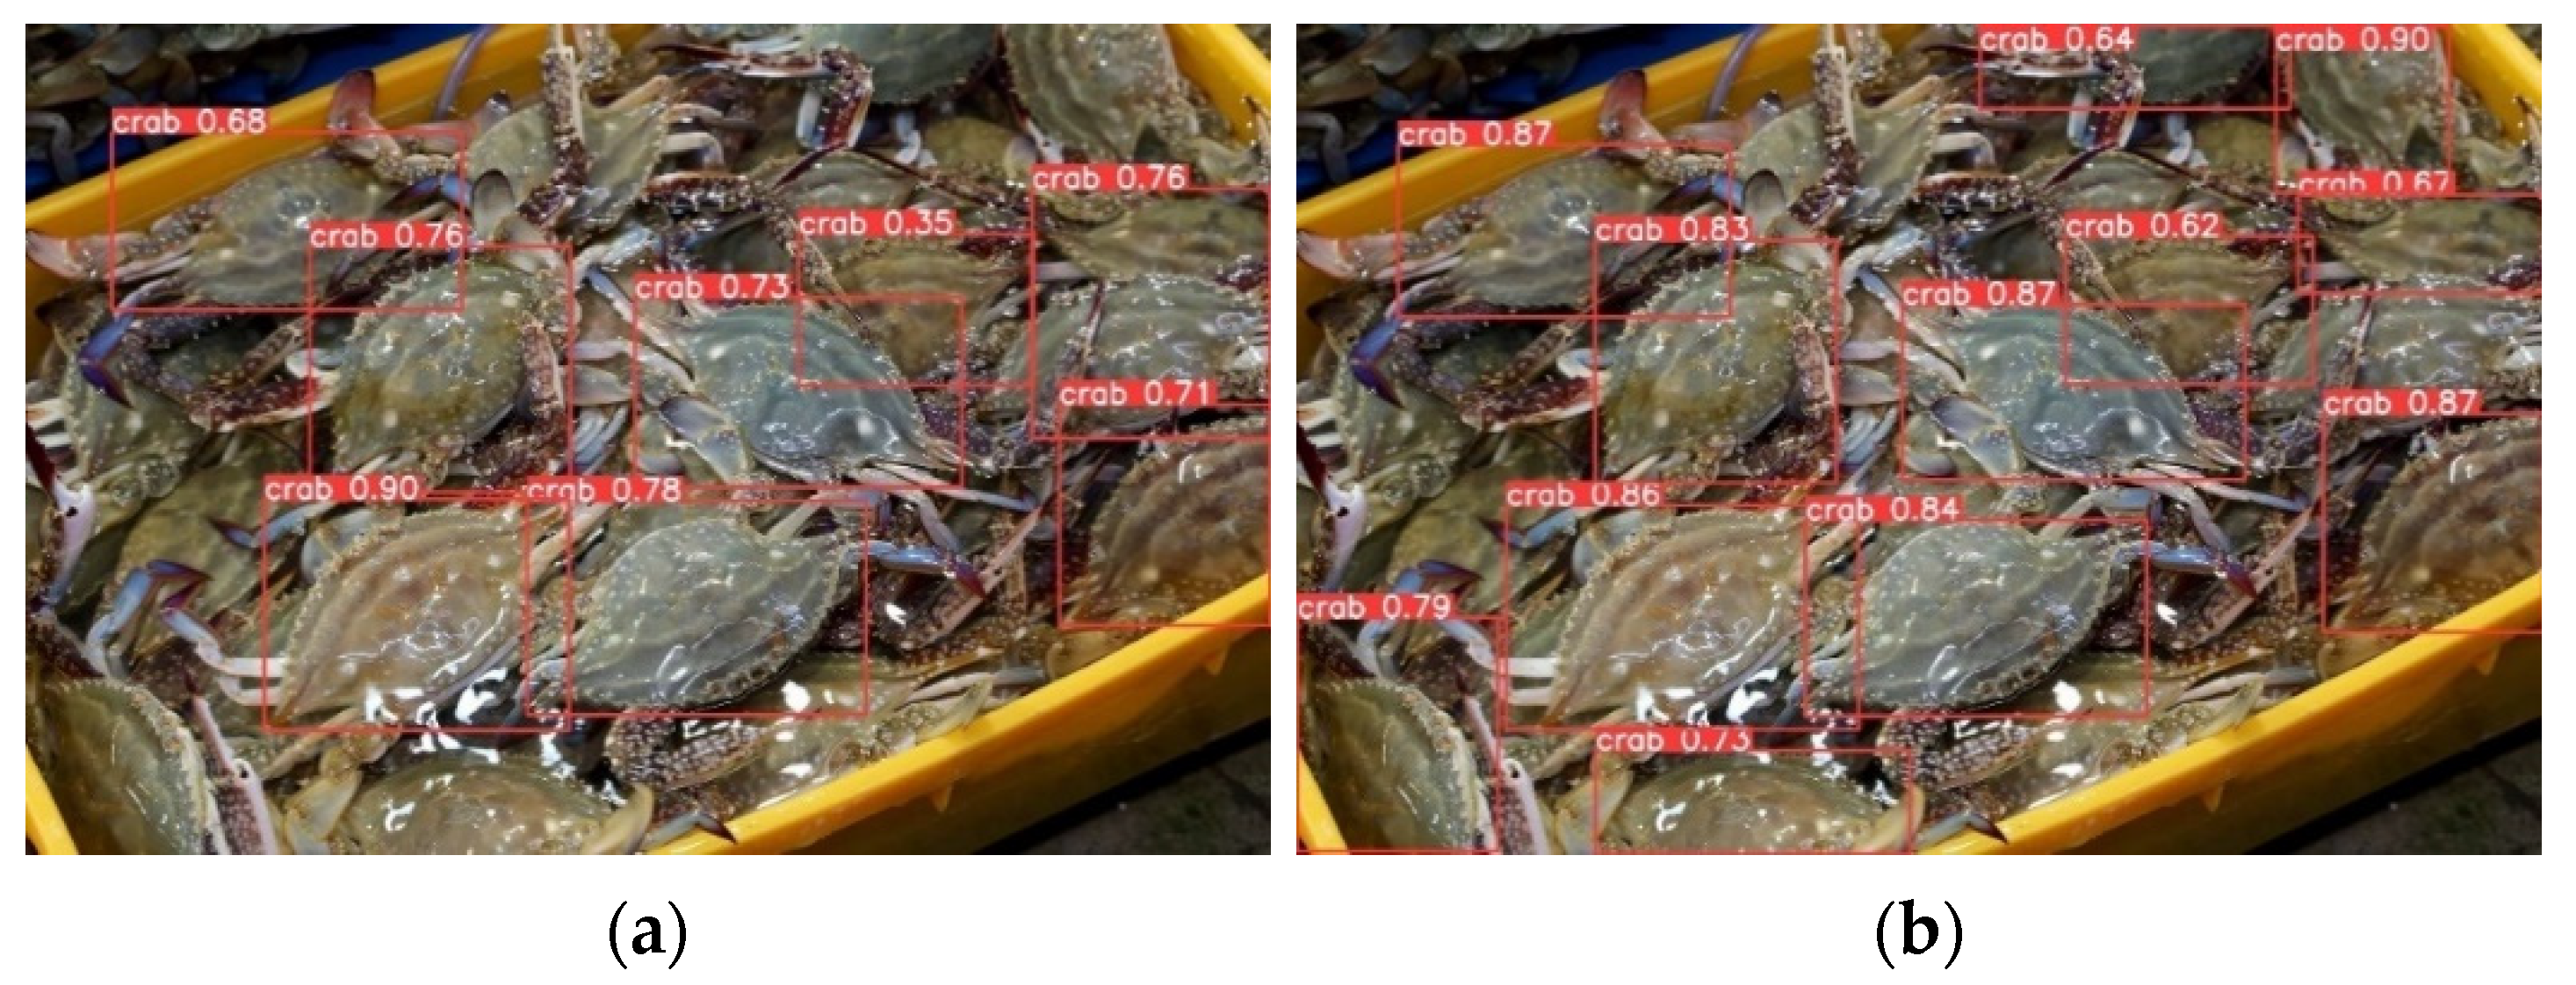
Figure 9 presents a visual comparison of the species recognition performance of YOLOv8x and RT-DETR-x models, demonstrating results consistent with the aforementioned performance indicators. In
Figure 9a, YOLOv8x recognized only 8 swimming crabs, while in
Figure 9b, the RT-DETR-x model recognized 12 swimming crabs in the same image. This suggests that the RT-DETR-x model is capable of recognizing more objects even in complex environments. Such results enable accurate recognition of individual counts in the field.
In conclusion, these performance evaluation results demonstrate that the RT-DETR-x model possesses superior fish species recognition capabilities compared to the YOLOv8x model. Particularly, the improved object recognition capabilities in complex environments are expected to provide significant advantages in accurately counting individuals in real-world settings. This is anticipated to make a substantial contribution to the efficient operation of the TAC system and sustainable management of fishery resources.
3.2. Fish Species Recognition Accuracy
In this study, we conducted three experiments to evaluate the performance of the RT-DETR-x model. The performance evaluation consisted of species recognition accuracy, body length measurement accuracy, and species recognition accuracy comparison between two models. We first performed the species recognition accuracy experiment. To assess the species recognition accuracy, we used a test dataset comprising 100 images for each of the 11 TAC target species. The formula for species recognition accuracy is given in Equation (7), where A represents the number of images used for each species in the experiment, and B is the number of images accurately recognized by the RT-DETR model.
Table 5 demonstrates that the species recognition accuracy experiment showed an overall recognition accuracy of 96.5%. Notably,
Trachurus japonicus exhibited the highest recognition accuracy at 98.5%, with all species showing accuracies above 90%.
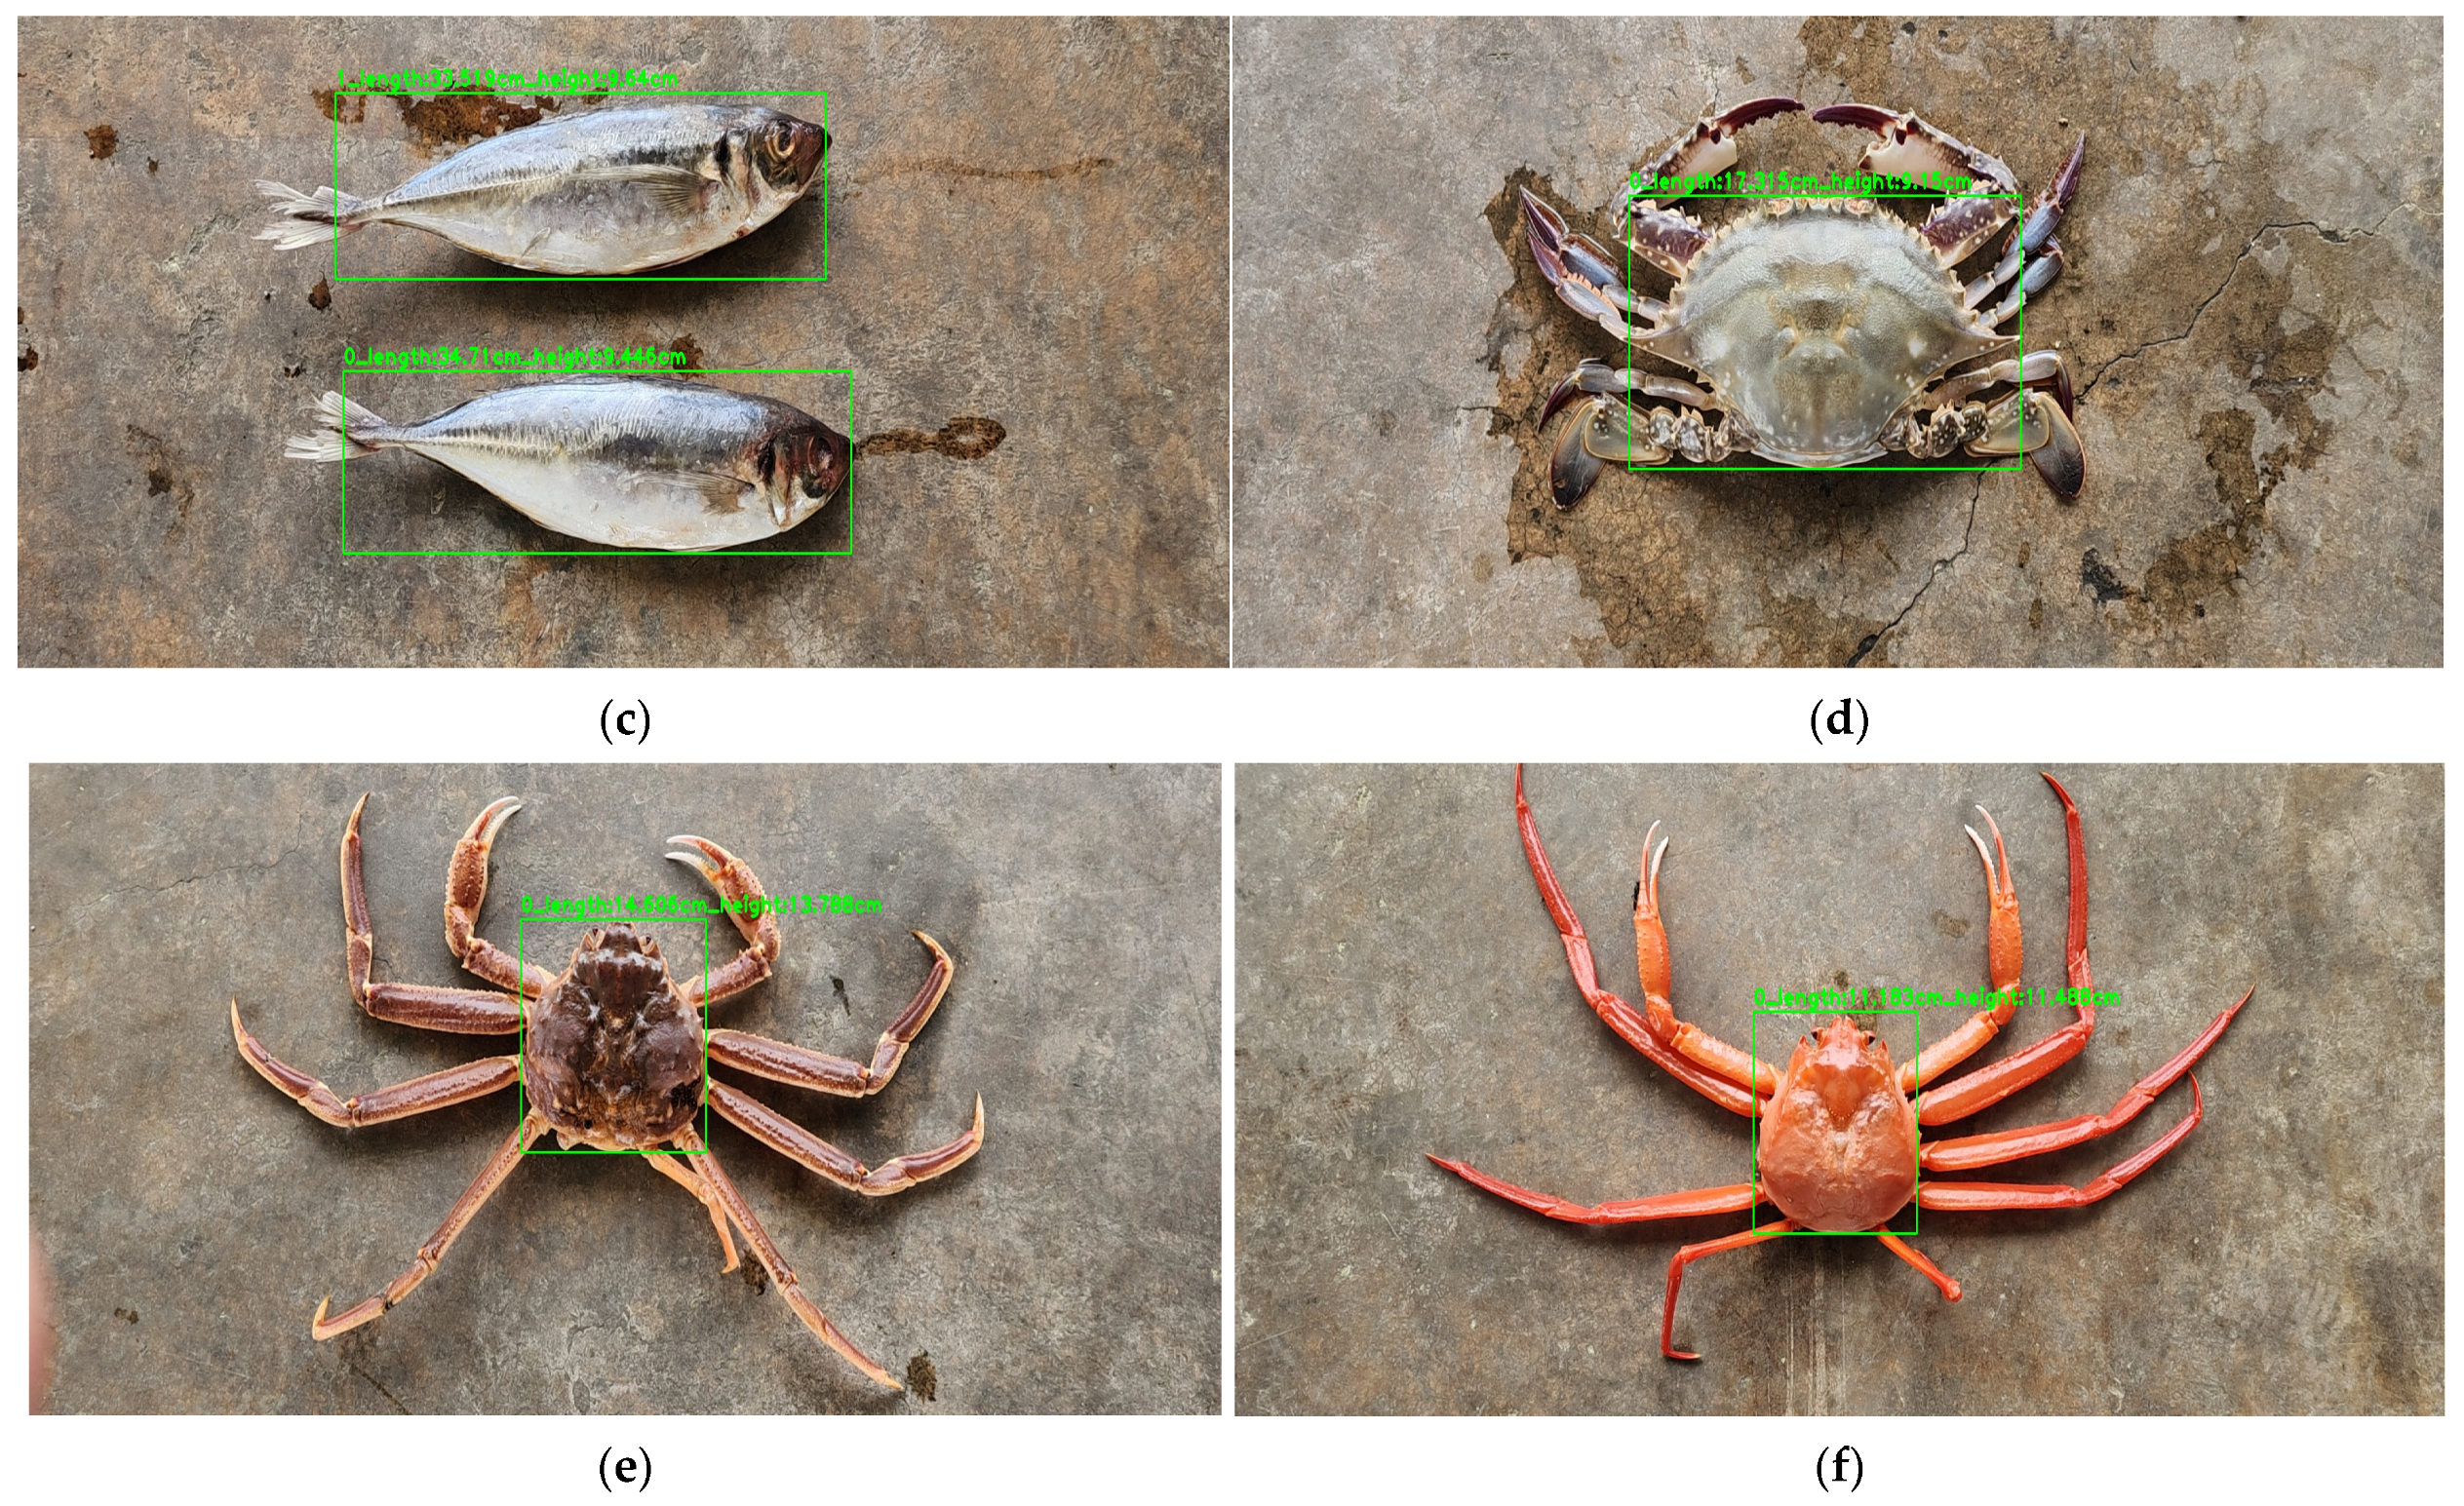
Figure 10a–f presents representative recognition result images for
Scomber japonicus,
Trichiurus lepturus,
Trachurus japonicus,
Portunus trituberculatus,
Chionoecetes opilio, and
Chionoecetes japonicus. These figures clearly illustrate how the customized body length measurement criteria applied to each species are reflected in the bounding boxes. For instance, in
Figure 10a, the
Scomber japonicus bounding box is set based on fork length, in
Figure 10b the
Trichiurus lepturus is based on anal length, and in
Figure 10d the
Portunus trituberculatus is based on carapace width. The application of these species-specific customized measurement criteria significantly contributed to the model’s accurate species recognition and body length measurement.
These results validate the effectiveness of the dataset construction method that applied species-specific customized body length measurement criteria, as proposed in this study. By applying measurement criteria tailored to the characteristics of each species, the model became capable of more accurately learning and recognizing subtle differences between species. This is expected to be of great assistance in accurately identifying and measuring various species in actual fishery resource survey fields.
3.3. Fish Species Length Measurement Accuracy
The accuracy of body length measurement is as crucial as species recognition accuracy in evaluating the performance of the proposed system. Accurate length measurement directly impacts the effective management of fishery resources and the sustainability of fishing activities. To objectively assess the body length measurement accuracy, we compared the actual measured values with the system’s measurements. We used the RT-DETR model’s measurements and compared them with actual measured values, calculated using Equation (8). X represents the actual measured value, and Y is the measurement value obtained through the RT-DETR model.
This experiment used a total of 1100 images, with 100 individuals for each species. For each image, a fishery resource inspector manually measured the body length to provide the actual measured value (X), while the proposed system in this study was used to measure the body length to extract the measured value (Y). To account for potential measurement errors, all measurements were conducted under standardized conditions. The results obtained through these experiments are shown in
Table 6. The highest accuracy was achieved by yellow croaker at 98%, with all 11 species showing accuracies above 90%. The body lengths obtained through this method can be used to calculate weight through weight conversion formulas [
15,
28,
29,
32], ultimately contributing to the estimation of TAC depletion rates.
4. Discussion
In this study, we developed an automated fish species recognition and body length measurement system utilizing the RT-DETR-x model and ARCore technology. This system was designed for the efficient operation of the TAC system, and the results are as follows.
4.1. Research Outcomes, Significance, and Practical Applications
The RT-DETR-x model showed higher mAP compared to the YOLOv8x model, recording an average mAP50 value 2.3% higher in learning for 11 species. This result demonstrates that the RT-DETR model is more suitable for fish species recognition, with improved object recognition capabilities in complex environments, which is expected to provide significant advantages in accurately counting individuals in real-world settings.
The custom-trained RT-DETR-x model achieved a high average recognition accuracy of 96.5% for the 11 TAC target species. This shows that it can greatly improve the accuracy and efficiency of fishery resource surveys. It demonstrated high accuracy even in distinguishing between similar species, suggesting the possibility of reliable data collection without expert intervention.
The body length measurement method using ARCore technology showed over 95% accuracy for all species. This indicates that it can provide faster and more accurate data compared to traditional manual measurement methods. This high accuracy and efficiency are expected to significantly improve the work efficiency of fishery resource inspectors, addressing issues such as manpower shortages and measurement errors in the survey process.
This system is expected to improve TAC operations. It automates data collection, allowing for quick and accurate large-scale data gathering. This enables precise tracking of TAC depletion rates and efficient resource management. While these qualitative improvements are significant, it is also crucial to quantify the system’s performance relative to traditional methods.
To quantify the improvements of the proposed system over traditional manual survey methods, a comparative analysis was conducted, drawing insights from previous studies on image-based detection in adverse environments and abnormal behavior detection [
33]. Although these studies focused on aquaculture species like shrimp, the principles are applicable to fish species under the TAC system. Our analysis revealed that the proposed system demonstrates a significant increase in efficiency, processing approximately 100 fish in the time it takes a human inspector to manually measure and identify 10–15 fish, representing a substantial improvement in throughput. In terms of accuracy, the system’s 96.5% average recognition accuracy for the 11 TAC target species surpasses typical manual identification rates, which can vary widely depending on inspector experience and environmental conditions.
These quantitative results further underscore the potential of our system to revolutionize fishery resource management practices, offering substantial improvements in both speed and accuracy over traditional methods.
4.2. Study Limitations and Future Research Directions
One limitation of this study is the restricted number of species. The current system focuses on 11 TAC target species, but future research needs to expand the system to include more species, developing it into a more comprehensive marine resource management tool. Additionally, the current system calculates weight by measuring the body length and height of individual species. However, in actual fish markets, sales are often made in box units, necessitating a response to this.
To overcome these limitations, future research efforts should focus on expanding the system to include more species and developing methods for estimating weight in box units, enabling rapid assessment of large catches. Through these research directions, the system can evolve into a more comprehensive and effective fishery resource management tool.
Furthermore, this study identified difficulties in distinguishing closely related species within the same genus. For example, species such as Chionoecetes opilio and Chionoecetes japonicus are morphologically very similar, causing the system to struggle in distinguishing them, sometimes misclassifying at a rate of 3–5%. This finding emphasizes the need for more sophisticated models capable of capturing subtle differences between morphologically similar species.
Future research aimed at overcoming these limitations and pursuing the proposed research directions will allow the system to develop into a more effective and comprehensive tool in marine resource management.
5. Conclusions
This study developed an automated system for fish species recognition and body length measurement to enhance the efficient operation of the TAC system. The results demonstrated that in the specific fish species recognition task employed in this study, the RT-DETR-x model outperformed the YOLOv8x model, achieving an average mAP50 value 2.3% higher and an impressive mean recognition accuracy of 96.5% across 11 TAC target species. These findings suggest the possibility of accurate species recognition even in complex real-world fish market environments. Furthermore, the body length measurement method utilizing ARCore technology exhibited over 95% average accuracy for all species, indicating the potential for faster and more accurate data collection compared to traditional manual measurement methods.
The developed system has shown significant potential to improve the work efficiency of fishery resource inspectors and address issues such as manpower shortages and measurement errors. The real-time data collection and analysis capabilities enable effective operation of the TAC system, which is expected to contribute to the sustainable management of fishery resources.
This research was conducted using RT-DETR-x and YOLOv8x models, which were state-of-the-art technologies at the time of the study. Given the rapid advancements in object detection technology, future research should focus on continuous evaluation and improvement of the system’s performance through comparative studies with emerging models such as YOLOv10. This approach will further enhance the practicality and effectiveness of the system developed in this study.
The current system is limited to 11 TAC target species and employs an individual species measurement method. To overcome these limitations, future research should focus on the following directions: First, the system’s scalability should be enhanced by including a wider range of species. Second, to increase applicability in real fish market environments, techniques for estimating weight in box units need to be developed.
In conclusion, the automated fish species recognition and body length measurement system developed in this study is expected to make a significant contribution to the efficient operation of the TAC system and sustainable management of fishery resources. This system can greatly improve the accuracy and efficiency of fishery resource surveys and help prevent the depletion of fishery resources due to increasing demand and overfishing. As the proposed future research directions enhance the system’s scalability and field applicability, this system is expected to be more widely utilized in the field of fishery resource management.


