Article

Reducing Total Dissolved Gas and Gas Bubble Trauma in a Regulated River

Avista Corporation, Spokane, WA 99252, USA
Fishes 2024, 9(11), 427; https://doi.org/10.3390/fishes9110427
Submission received: 19 September 2024 / Revised: 16 October 2024 / Accepted: 23 October 2024 / Published: 24 October 2024
(This article belongs to the Section Fishery Facilities, Equipment, and Information Technology)

Abstract

When water is spilled over dams, atmospheric gases can become entrained, resulting in supersaturated water. Total dissolved gas (TDG) > 110% saturation can cause gas bubble trauma (GBT) in fish. The negative effects of GBT include increased buoyancy, decreased swimming performance, and possible mortality. The lower Clark Fork River (LCFR) in Idaho frequently has TDG > 110% saturation due to the spill at Cabinet Gorge Dam as well as from upstream facilities. Spillway crests on Cabinet Gorge Dam were modified to reduce TDG production and the potential harm from GBT. To evaluate the effectiveness of spillway crest modifications, relationships between river discharge and measured TDG were developed pre- and post-modification and used to calculate the predicted TDG in the LCFR pre- and post-modification under two spill season discharge scenarios. The predicted TDG for the scenarios was used with an established TDG-GBT relationship for the LCFR to estimate the expected GBT incidence. Generally, TDG was lower post-modification, and the discharge at which 110% and 120% saturation were exceeded increased by about 198 m3/s. Modification also reduced the number of days with elevated TDG. The lower TDG post-modification resulted in significant (p < 0.05) reductions in the probability of observing GBT. The modification of Cabinet Gorge Dam spillway crests reduced TDG production over a range of discharges and has resulted in improved conditions for fish downstream of the dam.
Key Contribution: This work demonstrates how modifying spillways on dams can reduce total dissolved gas production and anticipated rates of gas bubble trauma in fish. Work such as this can provide dam operators and fisheries managers with important information for evaluating the success of total dissolved gas reduction projects.

1. Introduction

When water is spilled over dams, atmospheric gases (i.e., nitrogen and oxygen) can become entrained. When enough gas is entrained, the water becomes supersaturated. Total dissolved gas (TDG) levels > 110% saturation can cause gas bubble trauma (GBT) in fish and other aquatic organisms with the potential for negative effects [1,2]. In fish, external indications of GBT include gas bubble formation in the gills, fins, eyes, lateral line, and mouth, as well as distended eyes [3,4]. Gas bubble trauma has been well studied for a variety of fish under controlled conditions [5] and can cause sublethal effects such as increased buoyancy [6] and decreased swimming performance [7]. Mortality can occur when tissue damage is severe [8,9]. Although fish can avoid the effects of elevated TDG by seeking depths that collapse internal bubbles [10,11], the literature is mixed as to whether fish sense elevated TDG and actively seek compensatory depths (e.g., [12,13]). Regardless, substantial fish kills due to elevated TDG have been observed below multiple dams [14,15,16].
Many rivers experience elevated TDG due to dam operations, including the Columbia River in the United States, the Yangtze River in China, and the Otra River in Norway [17]. The lower Clark Fork River (LCFR) in Idaho, seasonally experiences elevated TDG from spill at Cabinet Gorge Dam and upstream hydroelectric facilities [18]. Total dissolved gas below the dam can be > 110% saturation, with values > 140% saturation recorded in some years [19,20]. Because these TDG levels can be harmful to fishes [9,21,22], the Federal Energy Regulatory Commission license for Cabinet Gorge Dam stipulated that Avista address the high TDG levels through a protection, mitigation, and enhancement measure (i.e., Appendix F5; [23]). The specific requirements of Appendix F5 included minimizing TDG production through selective spill gate use, developing a TDG monitoring program, studying TDG impacts on aquatic organisms, evaluating the feasibility of structural dam alterations to reduce TDG, and implementing a plan to design TDG control measures and reduce TDG downstream of Cabinet Gorge Dam [23].
The total dissolved gas produced from spill at dams can be reduced in many ways, including the strategic operation of spillways and upstream dams, maximizing water passed through turbines, and modifying spillways through the addition of deflectors and roughness elements (i.e., baffle blocks) [17,24,25,26]. Many modification designs involve the placement of roughness elements downstream of a spillway deflector or in the stilling basin downstream of the dam to dissipate energy (e.g., [27,28]). However, the configuration of some dams (like Cabinet Gorge Dam) results in freely plunging spillway jets, and the addition of roughness elements occurs directly on the spillway [29]. Regardless of the design used, modifying spillways to reduce TDG relies on site-specific mathematical and physical modeling to understand how TDG is produced and transported as well as to demonstrate how TDG reductions may occur (e.g., [30,31,32,33]).
The LCFR contains a diverse fish community consisting of both native and non-native species, with at least 24 species and two hybrids documented [19,20]. Some of the species, like Gerrard Rainbow trout (Oncorhychus mykiss) and Kokanee (O. nerka), support popular recreational fisheries on the river or downstream on Lake Pend Oreille. Westslope cutthroat trout (O. lewisi) and Endangered Species Act-listed Bull trout (Salvelinus confluentus) represent members of the native fish community that exhibit an adfluvial life history and are the focus of fish passage programs on the LCFR and its tributaries [34,35,36]. Finally, the LCFR contains native species, such as Peamouth (Mylocheilus caurinus), Northern pikeminnow (Ptychocheilus oregonensis), Longnose sucker (Catostomus catostomus), and Largescale sucker (C. macrocheilus), that have declining populations in upstream-impounded portions of the river [37]. Conserving the native fish community and the migratory life history of Bull trout and Westslope cutthroat trout present within the LCFR is a particular focus of the Federal Energy Regulatory Commission license for Cabinet Gorge Dam [23].
Through the implementation of the Appendix F5 protection, mitigation, and enhancement measure, spill operations at Cabinet Gorge Dam and the upstream Noxon Rapids Dam were modified to minimize TDG production [24]. In addition, spillway crests were modified on Cabinet Gorge Dam to further reduce TDG production [38]. The goal of this analysis was to evaluate the effectiveness of the physical modifications at Cabinet Gorge Dam to reduce TDG during spill and place this in the context of dose (i.e., TDG magnitude) and duration (i.e., days of exposure). In addition, the TDG produced pre- and post-modification was related to a GBT model for the LCFR to demonstrate how the probability of observing GBT has changed due to dam modifications.

2. Materials and Methods
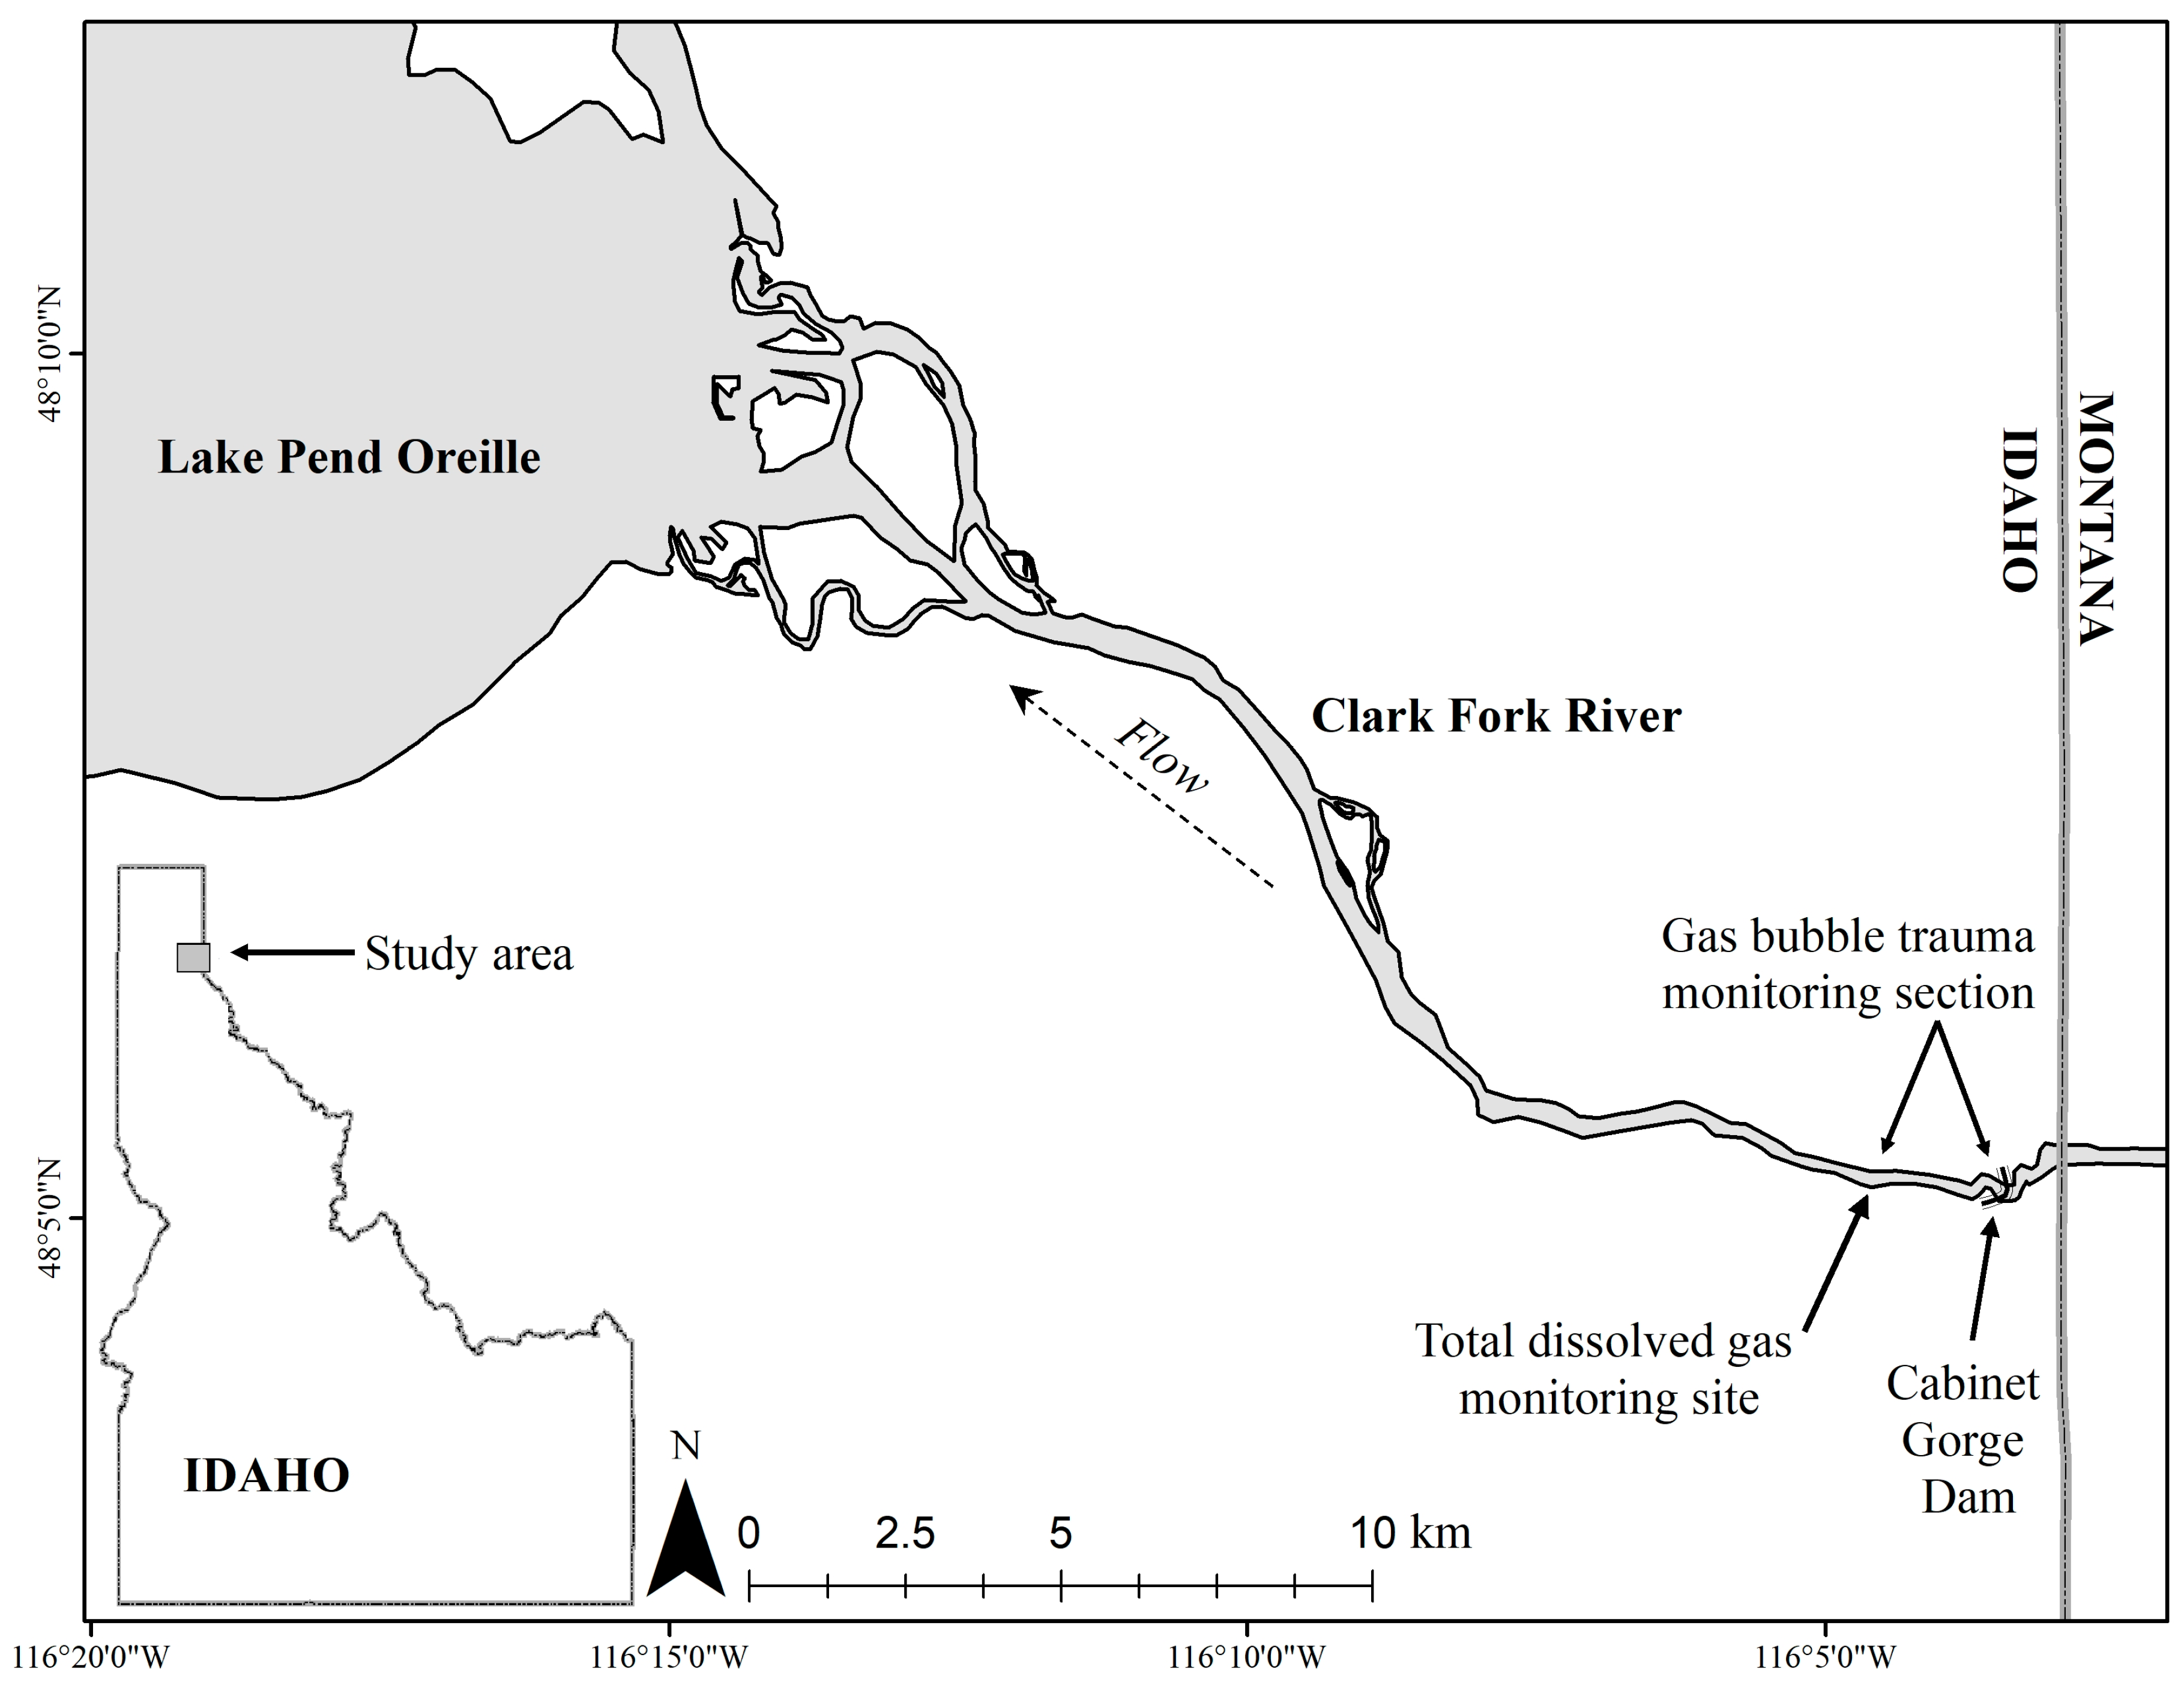
2.1. Study Area

The LCFR is located in northern Idaho, downstream of the border with Montana (Figure 1). The mean discharge in this section of the river (1996–2023) is about 600 m3/s, with a peak mean discharge of 2364 m3/s typically occurring in May or June ([39]; site 12391950). Minimum discharge on this section of the Clark Fork River varies seasonally between about 85 m3/s and 142 m3/s. When inflow to Cabinet Gorge Dam exceeds the powerhouse capacity of 1104 m3/s, spill occurs. As the spill increases, TDG also increases, with TDG > 110% saturation being observed in most years [20]. There is a water quality criterion of 110% saturation for TDG on the LCFR (IDAPA58.01.02§250.01.b). However, the state of Idaho has established an interim TDG target of 120% saturation downstream of Cabinet Gorge Dam when spill occurs [24].

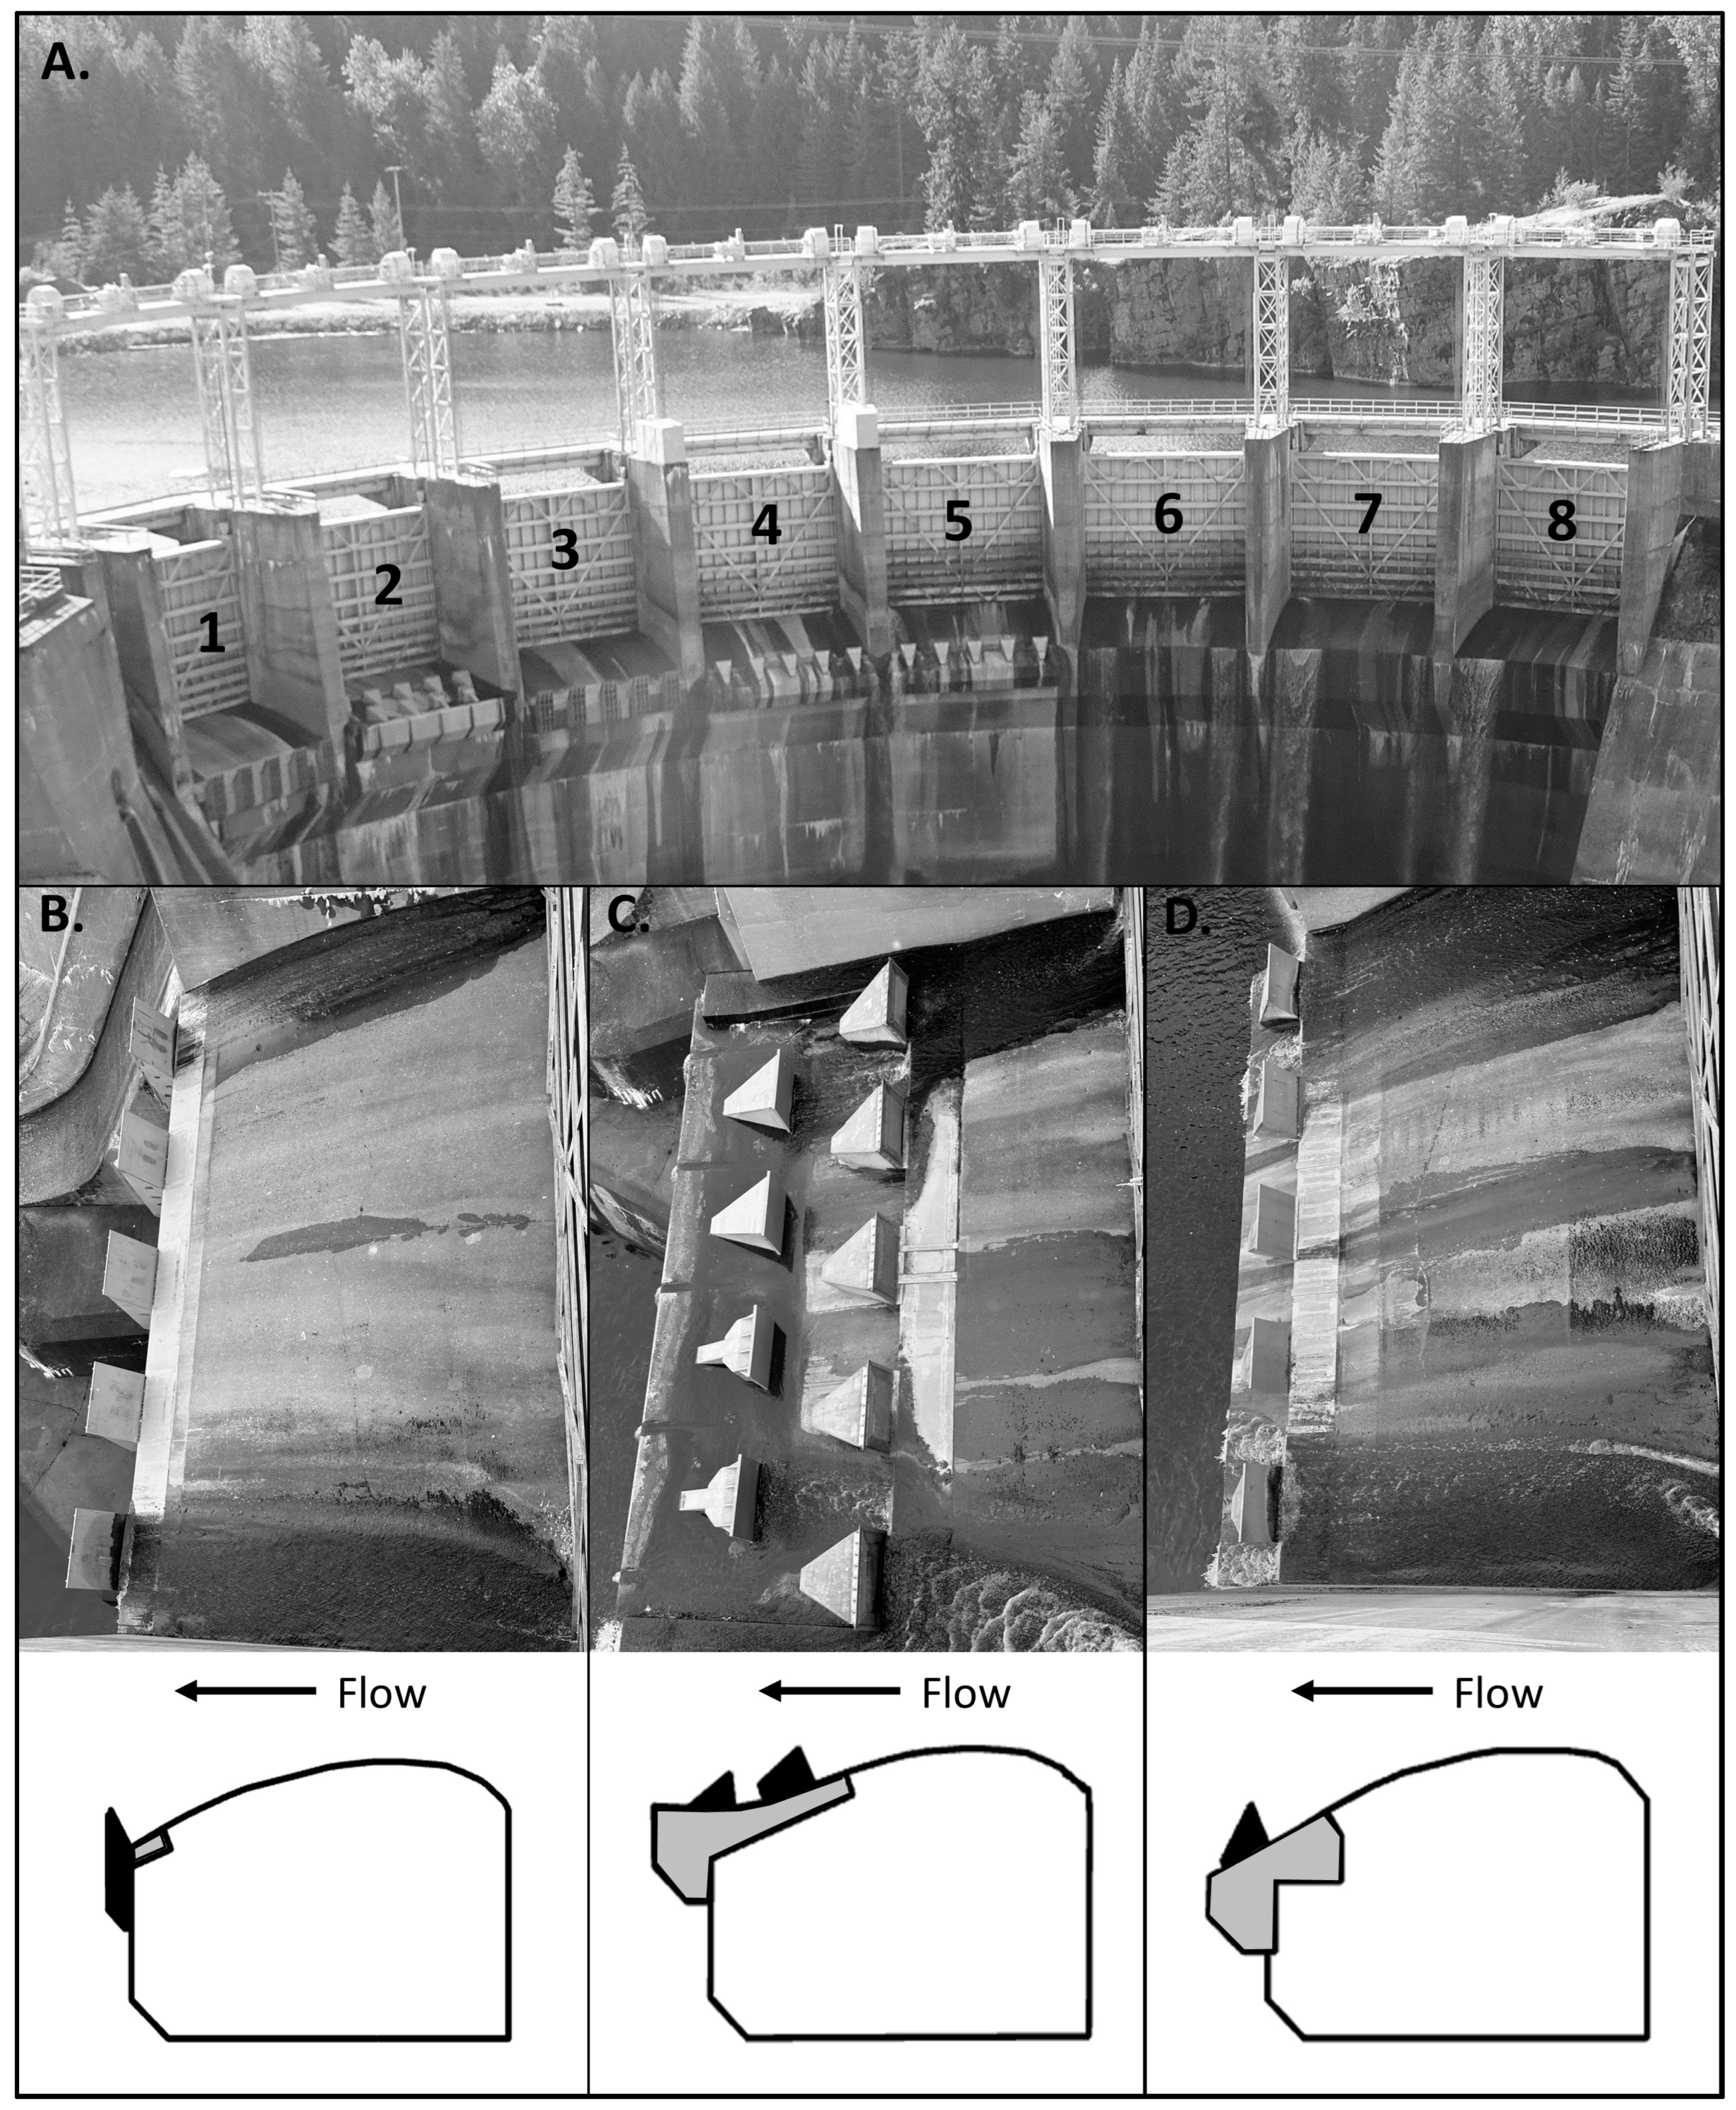
2.2. Spill Bay Modifications

In recognition of the potentially harmful effects of excess TDG on aquatic biota and the need to reduce TDG production in the LCFR, spillway crests on Cabinet Gorge Dam were modified with the addition of roughness elements. The selection of roughness elements and placement within individual spill bays was based on the spillway producing jets that fall freely into the tailrace. The roughness elements decrease TDG production by breaking up the spillway jet and reducing the depth at which water can plunge into the tailrace. Considered at the time to be a new method to reduce TDG caused by freely plunging spillway jets, Cabinet Gorge Dam spill bays were modified in a stepwise process [29,40]. First, spill bay 2 was modified based on studies for other facilities. It served as a prototype and after collecting post-modification data, further modification, and performing numerical modeling, the designs for spill bays 4 and 5 were developed. Additional post-modification data and modeling for spill bays 4 and 5 were used to develop the designs for spill bays 1 and 3.
Spill bays 1–5 were modified from post-spill 2012 to 2017 using three designs anticipated to have similar performance (Figure 2; Table 1). Spill bays 6–8 were not modified because their location on the shallow side of the tailrace resulted in similar TDG production as modified spill bays 1–5 [38]. In addition, they spill water without producing excessive spray, which can inhibit construction and maintenance activities at Cabinet Gorge Dam. Gate-specific testing indicated that the modifications resulted in less TDG production from each modified spill bay [38].

2.3. Data Collection

Historical discharge data for the period March 1996 through July 2023 was collected from the U.S. Geological Survey stream gauge located about 1.3 km downstream of Cabinet Gorge Dam ([39]; site 12391950). The daily median and daily 75th percentile values for each day from April 1 to July 31 were extracted to provide two spring spill discharge scenarios (Figure 3). Because hydrographs can differ substantially from year to year, these two scenarios were used to illustrate the differences in the magnitude and duration of TDG and GBT under the same discharge conditions pre- and post-modification. In addition, 15 min increment data from the stream gauge were converted to mean daily values to be paired with collected TDG data.
Total dissolved gas data were autonomously collected every 15 min at a monitoring location about 1.7 km downstream from Cabinet Gorge Dam during the typical spill period (March 18–July 31). Data were collected during periods of active discharge from Cabinet Gorge Dam using pressure sensors suspended about 3 m underneath a boat that was permanently moored at the sampling location. When data accuracy was questionable, sensors were cleaned or replaced and calibrated before redeployment. The TDG data were stored on dataloggers and downloaded about once per week. Total dissolved gas was calculated as follows:
TDG = (TP/BP) × 100,
where TDG = total dissolved gas in % saturation; TP = total water pressure in mm Hg; and BP = barometric pressure in mm Hg.
To evaluate the relationship between TDG and spill at Cabinet Gorge Dam, data collected three years pre-modification (2010–2012) and three years post-modification (2018, 2019, and 2021) were selected. Data from these specific years was selected based on (1) they were after the establishment of spill protocols that minimize incoming TDG to Cabinet Gorge Dam and TDG produced by spill at Cabinet Gorge Dam [24]; (2) they were the closest in time to the construction of modifications; and (3) they had data representative of normal operations (i.e., all turbines were available for use during spill). The 15 min increment TDG data were converted to mean daily values for TDG analysis to represent the chronic TDG exposure fish experience in the LCFR and to be consistent with the daily historical discharge data used in the two scenarios. These mean daily values were regressed with paired discharge values to predict the TDG for each scenario. Consistent with [20], predicted mean daily TDG data for the two scenarios were converted to 7-day mean values for GBT analysis.
Fish GBT data were collected from a 1.7 km section of the Clark Fork River from Cabinet Gorge Dam downstream to the TDG monitoring location. Fish were collected by nighttime boat electrofishing in 2000, 2006, 2008, and 2017–2021, with the sampling typically occurring two to three times each week from April to July. Electrofishing consisted of one to two passes on each side of the river along the shoreline, and the first 10 of each fish species encountered were captured and examined for GBT presence on unpaired fins and eyes using U.S. Geological Survey [41] protocols. These GBT data and associated TDG data from those same years were used by [20] to develop a logistic regression model that provided the probability of observing GBT on a fish captured in the LCFR based on the 7-day mean TDG. The equation was as follows:
ProbGBT = e(−22.6324 + 0.1604 × TDG7-d)/(1 + e(−22.6324 + 0.1604 × TDG7-d)),
where ProbGBT = probability of observing GBT; TDG7-d = 7-day mean TDG in mm Hg. The logistic model provided an estimate of the likelihood that GBT will be observed given the TDG conditions leading up to the capture of an individual fish. Although [20] also developed models that accounted for water temperature and species captured, the selected model (i.e., ProbGBT versus 7-day mean TDG) was used to provide a general indication of spillway modification effectiveness. Additional details about TDG and GBT data collection, as well as the development of the logistic regression model, can be found in [20].

2.4. Data Analysis

Statistical analysis was performed using R statistical software (version 4.3.2). To evaluate whether the continuous distributions of empirical TDG data differed between pre- and post-modification, the Kolmogorov–Smirnov test (R package “dgof” [42]) was used. The Wilcoxon test (R package “rcmdr” [43]) was used to evaluate whether TDG and GBT values were lower post-modification under the two discharge scenarios. A significance level of α = 0.05 was used in all statistical analyses. In addition, the number of days when TDG exceeds 110, 120, and 130% saturation and when the probability of observing GBT exceeds 0.01, 0.02, 0.04, and 0.08 are presented for the two scenarios pre- and post-modification. These GBT probability values are associated with TDG in the LCFR at about 113, 117, 121, and 126% saturation, respectively [20].

3. Results

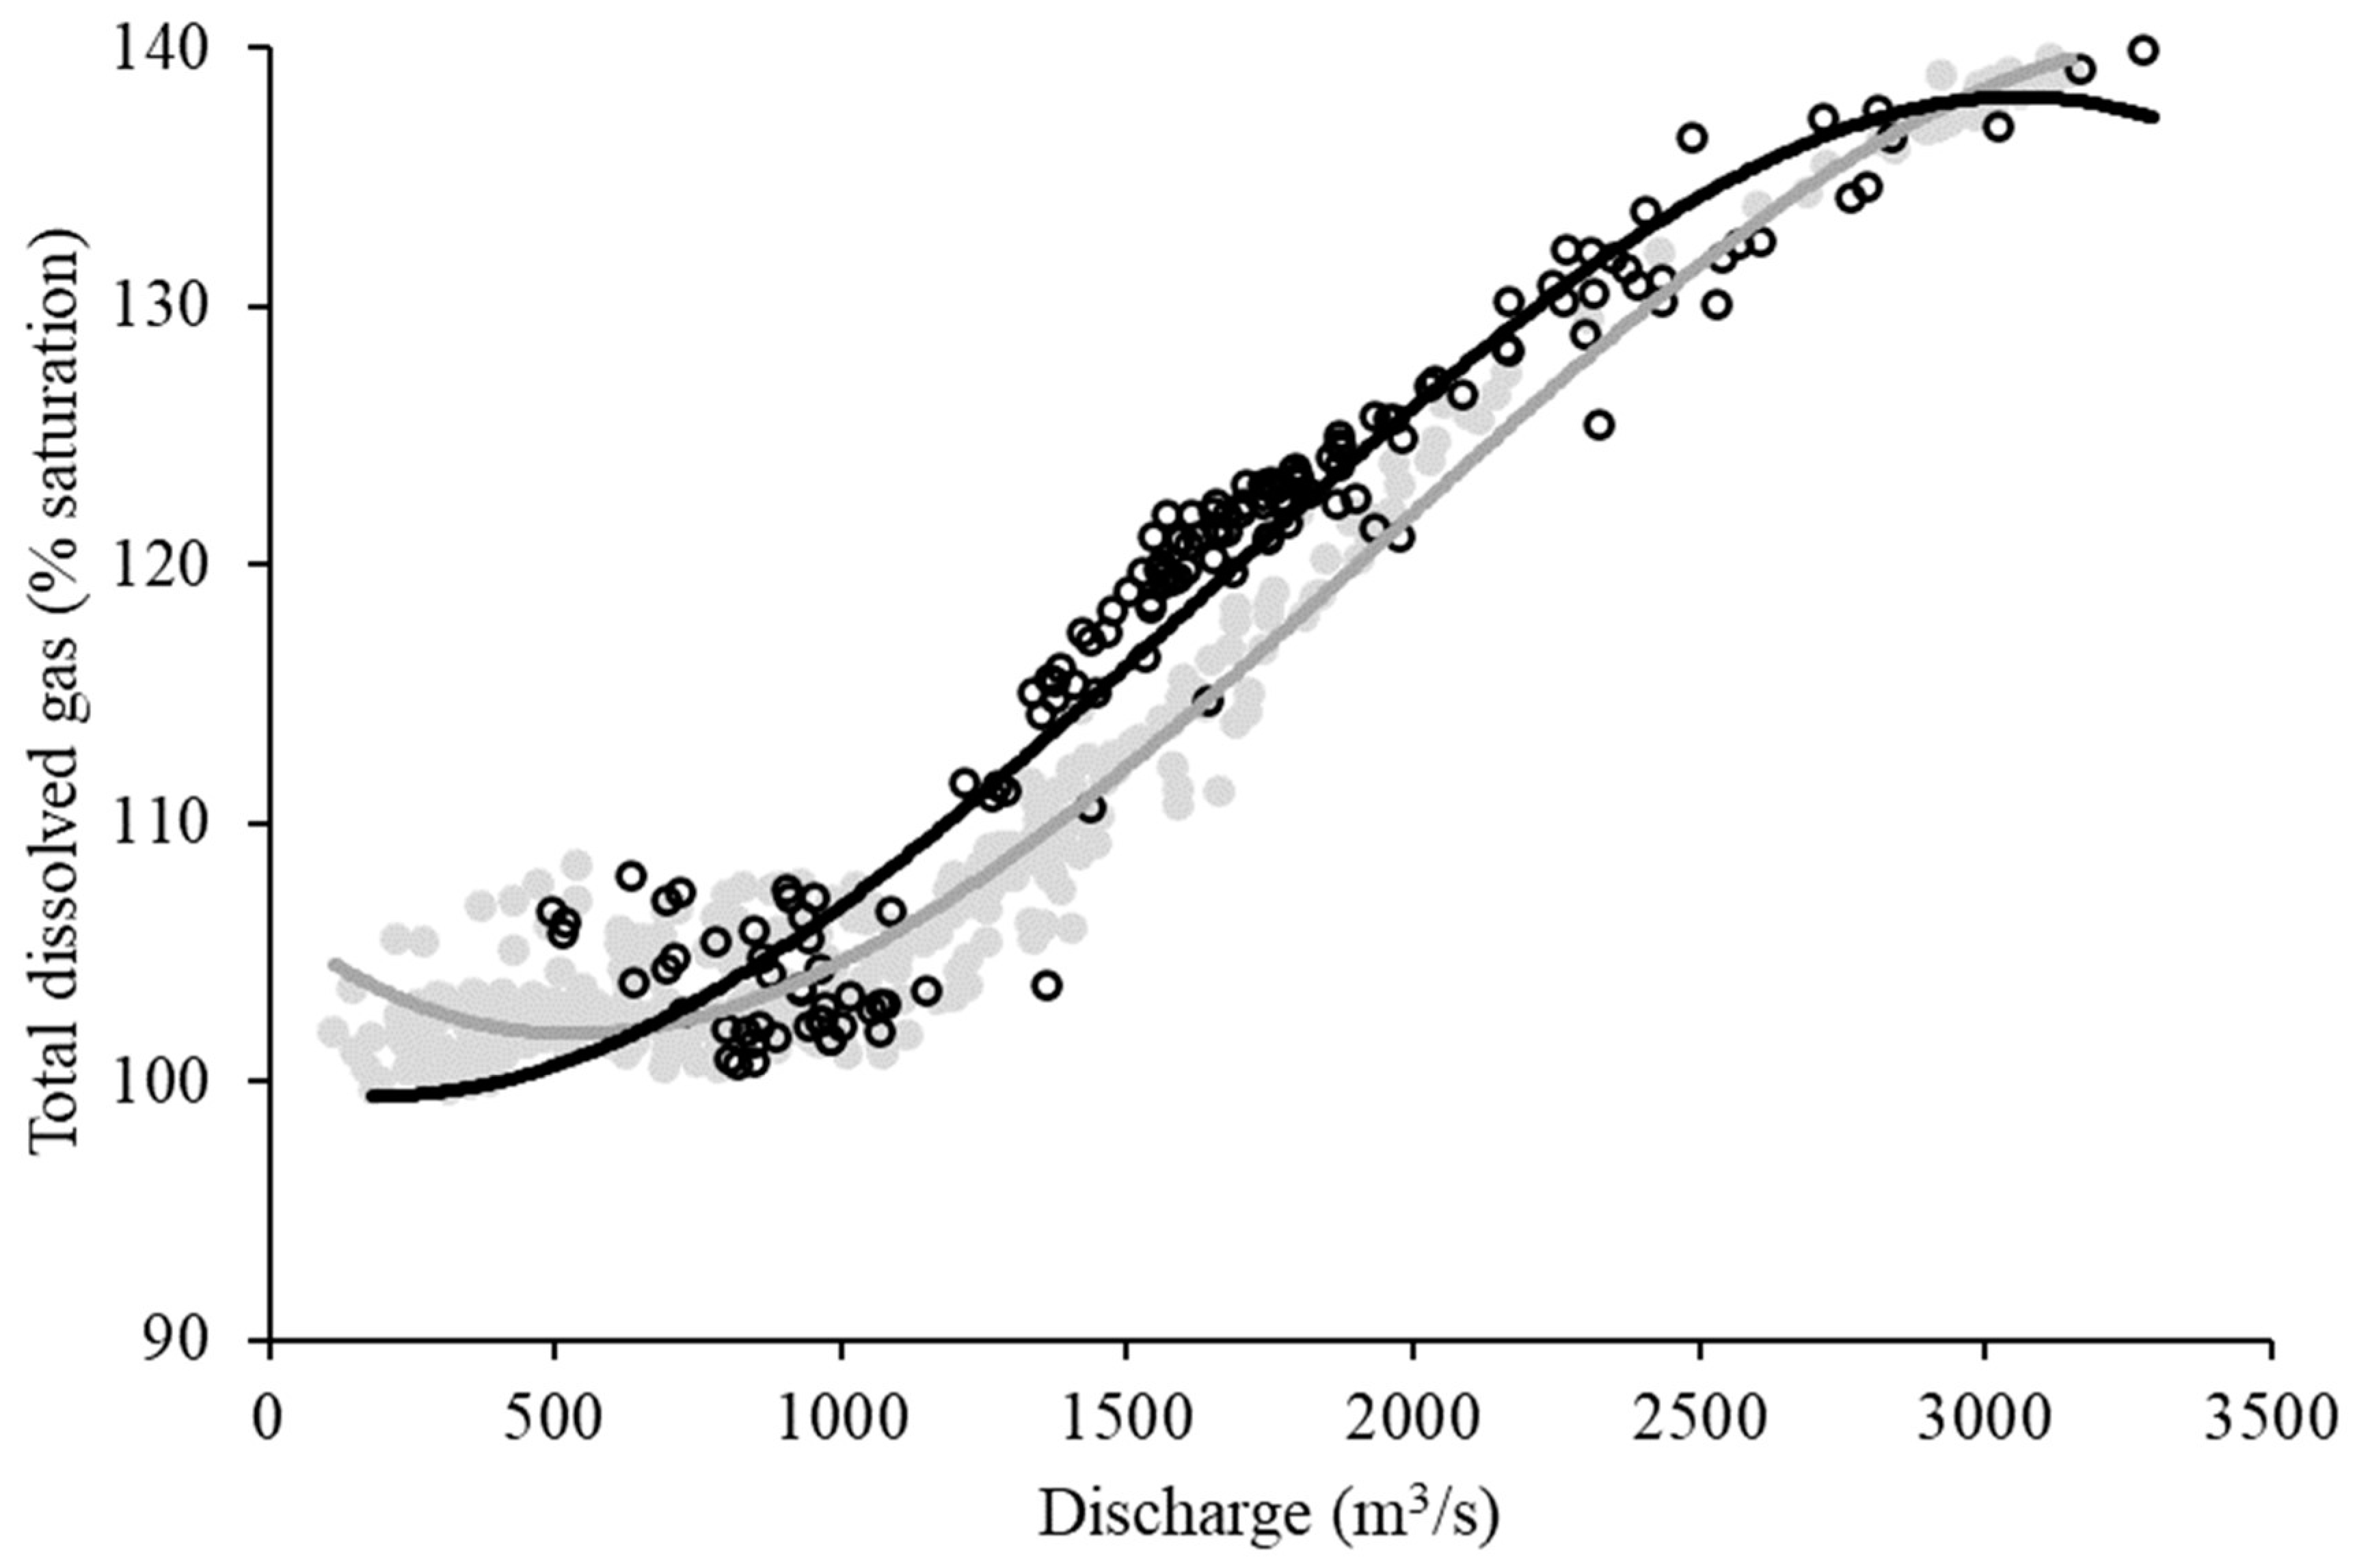
3.1. Total Dissolved Gas Relationship to Discharge

Cubic function (i.e., third-order polynomial) relationships were identified for both the pre- and post-modification time periods (Table 2; Figure 4). The cubic function was selected to predict the relationship between TDG and discharge because it provided the best balance for r2 and visual fit for both time periods. The equations for the pre- and post-modification cubic function relationships were used to estimate TDG for the two discharge scenarios. The continuous distributions of TDG data collected pre- and post-modification differed (D = 0.50; p < 0.001), with the post-modification values being less for a given discharge over much of the distribution (about 699–2945 m3/s; Figure 4). This shift in the relationship between TDG and discharge means that 110% saturation was exceeded at about 1388 m3/s post-modification versus 1189 m3/s pre-modification and 120% saturation was exceeded at about 1897 m3/s post-modification versus 1699 m3/s pre-modification.

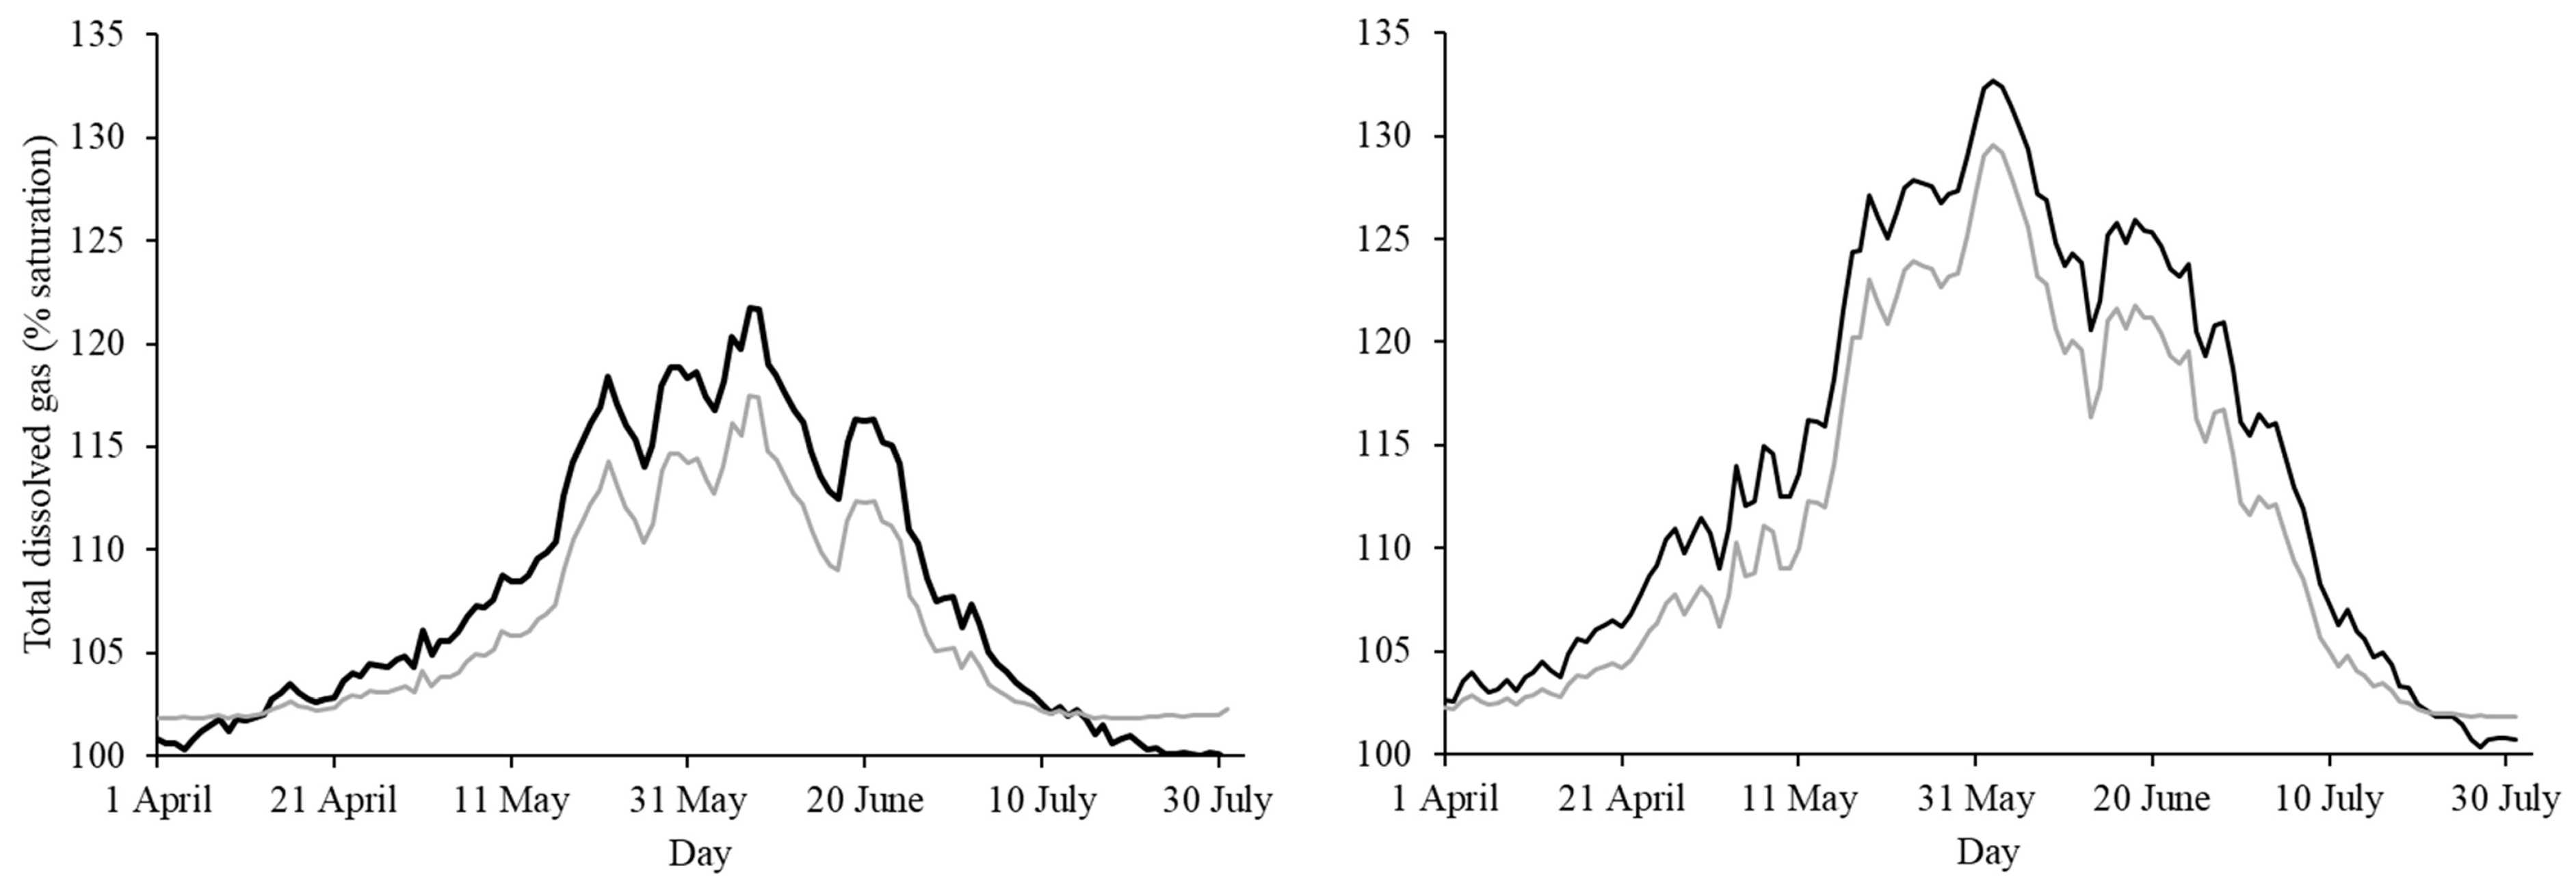
3.2. Total Dissolved Gas

Total dissolved gas levels for both discharge scenarios pre- and post-modification (Figure 5) closely paralleled the hydrographs for each scenario (Figure 3). For the median discharge scenario, TDG post-modification (range = 101.8–117.5% saturation) was not significantly less than pre-modification (range = 99.8–121.7% saturation) (W = 6717; p = 0.09). Pre-modification, TDG exceeded 110% saturation in mid-May and continued to on most days until the end of June. Total dissolved gas exceeded 120% saturation on three days in early June and did not exceed 130% saturation. Post-modification TDG exceeded 110% saturation in mid-May and continued to do so on most days until the end of June but did not exceed 120% saturation. The TDG values in the median discharge scenario indicated seven fewer days with TDG > 110% saturation and three fewer days with TDG > 120% saturation after spillway crest modification (Table 3).
For the 75th percentile discharge scenario, TDG post-modification (range = 101.8–129.5% saturation) was significantly less than pre-modification (range = 100.4–132.7% saturation) (W = 6191; p = 0.01). Pre-modification TDG exceeded 110% saturation in late April and continued to do so on most days until early July. Total dissolved gas exceeded 120% saturation in mid-May and continued to do so on most days until late June. Total dissolved gas exceeded 130% saturation on six days around early June. Post-modification, TDG exceeded 110% saturation in early May and continued to do so on most days until early July. Total dissolved gas exceeded 120% saturation in mid-May and continued to do so on most days until mid-to-late June. Total dissolved gas did not exceed 130% saturation post-modification. The TDG values in the 75th percentile discharge scenario indicated 14 fewer days with TDG > 110% saturation, 11 fewer days with TDG > 120% saturation, and six fewer days with TDG > 130% saturation after spillway crest modification (Table 3).

3.3. Gas Bubble Trauma

For the median discharge scenario (Figure 6), the probability of observing GBT was significantly less post-modification (range = 0.002–0.017) than it was pre-modification (range = 0.001–0.032) (W = 5780; p = 0.03). The pre-modification probability of observing GBT exceeded 0.01 from mid-May to the end of June and exceeded 0.02 from late May to mid-June. The probability of observing GBT did not exceed 0.04 pre-modification. Post-modification, the probability of observing GBT exceeded 0.01 in late May and continued to do so on most days through mid-June; it did not exceed 0.02. The probability of observing GBT values in the median discharge scenario indicated 21 fewer days > 0.01 and 15 fewer days > 0.02 after spillway crest modification (Table 4).
For the 75th percentile discharge scenario (Figure 6), the probability of observing GBT was significantly less post-modification (range = 0.002–0.107) than it was pre-modification (range = 0.002–0.172; W = 5452; p = 0.01). The pre-modification probability of observing GBT exceeded 0.01 from early May to early July and exceeded 0.02 from mid-May to early July. The probability of observing GBT exceeded 0.04 from mid-May to late June and exceeded 0.08 from late May to mid-June. Post-modification, the probability of observing GBT exceeded 0.01 from mid-May to early July and exceeded 0.02 from mid-May to late June. The probability of observing GBT exceeded 0.04 from late May to mid-June and exceeded 0.08 for six days in early June. The probability of observing GBT values in the 75th percentile discharge scenario indicated 14 fewer days > 0.01, eight fewer days > 0.02, 19 fewer days > 0.04, and 13 fewer days > 0.08 after spillway crest modification (Table 4).

4. Discussion

The modifications to Cabinet Gorge Dam spillway crests have resulted in reduced TDG production, both in magnitude and duration. Both scenarios exhibited at least seven fewer days with TDG > 110% saturation, and the 75th percentile scenario showed 11 fewer days with TDG > 120% saturation post-modification. This TDG reduction has also resulted in lower anticipated rates of GBT in fishes within the LCFR. The TDG produced at Cabinet Gorge Dam is longitudinally stable throughout the LCFR, and elevated TDG extends downstream into Lake Pend Oreille [44,45]. As a result, the TDG reductions are anticipated to benefit fish throughout these waterbodies.
While TDG post-modification is generally less than it was pre-modification, there was a failure to detect a significant difference in the median discharge scenario. It seems likely that this failure to detect a significant difference was the result of differences in the distribution of data (i.e., much more data) and the higher TDG values during times of non-spill discharge (i.e., <1104 m3/s) post-modification. Although turbines can remove gas from supersaturated water [46], depending on how they are operated (e.g., how much water is passed through), air can be entrained, and TDG saturation increased above incoming values [47,48,49,50]. River discharge on either side of the spring hydrograph peak is representative of times when turbines can be operated in multiple combinations, and it is possible that turbine operations post-modification are the cause for these higher TDG values. Regardless of the cause, the TDG values observed during lower discharge (about 102% saturation) are well below what would be of concern for fish to develop GBT.
The fishes that are the most likely to benefit from the TDG reductions include Brown trout, Peamouth, Smallmouth bass (Micropterus dolomieu), Westslope cutthroat trout, and Rainbow trout, as these species have among the highest rates of GBT across a range of TDG values [20]. However, the exact effects are unknown and are likely controlled by interspecies interactions. For example, both Brown trout [51] and Smallmouth bass [52] can be highly piscivorous, and any benefits the lower TDG conveys to these two species may have consequences for forage species like Peamouth, suckers (Catostomus spp.) and Kokanee.
Peamouth [53], Rainbow trout, and Westslope cutthroat trout [54] migrate into and may attempt to spawn when TDG is elevated in the LCFR. The reduced TDG due to spillway crest modifications may afford some benefit to reproductive success for these species because of the reduced stress they experience [55]. The greatest benefit would likely be for Westslope cutthroat trout that are captured and passed upstream of Cabinet Gorge Dam to spawn in tributaries [36] as they may be more fit for their migration. Potential reproductive benefits are unknown for Peamouth, whose demographics have not been studied in the LCFR.

5. Conclusions

Although the long-term effects of the spillway crest modifications and associated reductions in TDG are still unknown, the modifications were effective at reducing potential harm to the fish community downstream of Cabinet Gorge Dam. The validation of TDG prediction and dam modification design models (e.g., [56,57]) and the post-modification monitoring of TDG levels are relatively common (e.g., [58]). Evaluations of the biological effects post-modification with field data are lacking in the literature (see [59]); however, it is no less important for documenting effectiveness. This evaluation used pre- and post-modification TDG data as well as an established LCFR-specific relationship between measured TDG and GBT to evaluate TDG reduction and the potential for reduced harm to fish. Additional studies such as this one can help those looking to reduce TDG during spill understand the magnitude and duration of reductions given different structural (e.g., spillway type, dam orientation, tailrace elevation, stilling basin depth) limitations. Pairing TDG and biological data will further strengthen our understanding of project effectiveness and verify improved conditions for fish.

Funding

This project was funded by Avista Corporation through the Clark Fork Settlement Agreement associated with Federal Energy Regulatory Commission Project No. 2058.

Institutional Review Board Statement

Not applicable.

Informed Consent Statement

Not applicable.

Data Availability Statement

The raw data supporting the conclusions of this article will be made available by the author upon reasonable request.

Acknowledgments

The author would like to thank past and present Avista biologists and technicians including Shana Bernall, Kevin Duffy, Jacob Johnson, Josh Storaasli, Dylan Gollen, Davina Brown, Jeremy Stover, Rob Jakubowski, Wes Baker, and Tim Tholl for coordinating and assisting with the collection and organization of GBT data. Also, thanks to the Idaho Department of Fish and Game for their collaboration. The reviews of Sean Moran, Shana Bernall, Eric Oldenburg, Ken Bouwens, and three reviewers helped to improve this manuscript.

Conflicts of Interest

Author Paul C. Kusnierz was employed by the company Avista Corporation. The author declares no conflicts of interest.

References

  1. Bouck, G.R. Etiology of gas bubble disease. Trans. Am. Fish. Soc. 1980, 109, 703–707. [Google Scholar] [CrossRef]
  2. Weitkamp, D.E.; Katz, M. A review of dissolved gas supersaturation literature. Trans. Am. Fish. Soc. 1980, 109, 659–702. [Google Scholar] [CrossRef]
  3. Bouck, G.R.; Chapman, G.A.; Schneider Jr, P.W.; Stevens, G. Observations on gas bubble disease among wild adult Columbia River fishes. Trans. Am. Fish. Soc. 1976, 105, 114–115. [Google Scholar] [CrossRef]
  4. Backman, T.W.; Evans, A.F. Gas bubble trauma incidence in adult salmonids in the Columbia River Basin. N. Am. J. Fish. Manag. 2002, 22, 579–584. [Google Scholar] [CrossRef]
  5. Pleizier, N.K.; Algera, D.; Cooke, S.J.; Brauner, C.J. A meta-analysis of gas bubble trauma in fish. Fish Fish. 2020, 21, 1175–1194. [Google Scholar] [CrossRef]
  6. Counihan, T.D.; Miller, A.I.; Mesa, M.G.; Parsley, M.J. The effects of dissolved gas supersaturation on White Sturgeon larvae. Trans. Am. Fish. Soc. 1998, 127, 316–322. [Google Scholar] [CrossRef]
  7. Schiewe, M.H. Influence of dissolved atmospheric gas on swimming performance of juvenile Chinook Salmon. Trans. Am. Fish. Soc. 1974, 103, 717–721. [Google Scholar] [CrossRef]
  8. Dawley, E.M.; Ebel, W.J. Effects of various concentrations of dissolved atmospheric gas on juvenile Chinook Salmon and steelhead trout. U.S. Nat. Mar. Fish. Serv. Fish. Bull. 1975, 73, 777–796. [Google Scholar]
  9. Fickeisen, D.H.; Montgomery, J.C. Tolerances of fishes to dissolved gas supersaturation in deep tank bioassays. Trans. Am. Fish. Soc. 1978, 107, 376–381. [Google Scholar] [CrossRef]
  10. Dawley, E.M.; Schiewe, M.; Monk, B. Effects of long-term exposure to supersaturation of dissolved atmospheric gases on juvenile chinook salmon and steelhead trout in deep and shallow test tanks. In Gas Bubble Disease; Fickeisen, D.H., Schneider, M.J., Eds.; Energy Research and Development Administration, Technical Information Center: Richland, WA, USA, 1976; pp. 1–10. [Google Scholar]
  11. Shrimpton, J.M.; Randall, D.J.; Fidler, L.E. Assessing the effects of positive buoyancy on rainbow trout (Oncorhynchus mykiss) held in gas supersaturated water. Can. J. Zool. 1990, 68, 969–973. [Google Scholar] [CrossRef]
  12. Pleizier, N.K.; Rost-Komiya, B.; Cooke, S.J.; Brauner, C.J. The lack of avoidance of total dissolved gas supersaturation in juvenile rainbow trout. Hydrobiologia 2021, 848, 4837–4850. [Google Scholar] [CrossRef]
  13. Ji, Q.; Li, K.; Wang, Y.; Liang, R.; Feng, J.; Yuan, Q.; Zhang, P.; Zhu, D.Z. Total dissolved gases induced tolerance and avoidance behaviors in pelagic fish in the Yangtze River, China. Ecotoxicol. Environ. Saf. 2021, 216, 112218. [Google Scholar] [CrossRef] [PubMed]
  14. Crunkilton, R.L.; Czarnezki, J.M.; Trial, L. Severe gas bubble disease in a warmwater fishery in the midwestern United States. Trans. Am. Fish. Soc. 1980, 109, 725–733. [Google Scholar] [CrossRef]
  15. Lutz, D.S. Gas supersaturation and gas bubble trauma in fish downstream from a Midwestern reservoir. Trans. Am. Fish. Soc. 1995, 124, 423–436. [Google Scholar] [CrossRef]
  16. Ji, Q.; Xue, S.; Yuan, Q.; Yuan, Y.; Wang, Y.; Liang, R.; Feng, J.; Li, K.; Li, R. The tolerance characteristics of resident fish in the upper Yangtze River under varying gas supersaturation. Int. J. Environ. Res. Public Health 2019, 16, 2021. [Google Scholar] [CrossRef] [PubMed]
  17. Li, P.; Zhu, D.Z.; Li, R.; Wang, Y.; Crossman, J.A.; Kuhn, W.L. Production of total dissolved gas supersaturation at hydropower facilities and its transport: A review. Water Res. 2022, 223, 119012. [Google Scholar] [CrossRef]
  18. Latona (Latona Consulting Services, LLC). Final Report Total Dissolved Gas Monitoring 2014 Cabinet Gorge and Noxon Rapids Dams; Latona Consulting Services, LLC: Seattle, WA, USA, 2014. [Google Scholar]
  19. Weitkamp, D.E.; Sullivan, R.D.; Swant, T.; DosSantos, J. Gas bubble disease in resident fish of the lower Clark Fork River. Trans. Am. Fish. Soc. 2003, 132, 865–876. [Google Scholar] [CrossRef]
  20. Kusnierz, P.C.; Bouwens, K.A.; Ransom, A.L. Predicting the likelihood of gas bubble trauma in fishes exposed to elevated total dissolved gas in the lower Clark Fork River, Idaho. Trans. Am. Fish. Soc. 2024, 153, 39–54. [Google Scholar] [CrossRef]
  21. Nebeker, A.V.; Brett, J.R. Effects of air-supersaturated water on survival of Pacific salmon and steelhead smolts. Trans. Am. Fish. Soc. 1976, 105, 338–342. [Google Scholar] [CrossRef]
  22. Nebeker, A.V.; Hauck, A.K.; Baker, F.D.; Weitz, S.L. Comparative responses of speckled dace and cutthroat trout to air-supersaturated water. Trans. Am. Fish. Soc. 1980, 109, 760–764. [Google Scholar] [CrossRef]
  23. Avista (Avista Corporation). Application for New License, Volume III Settlement Agreement; Avista Corporation: Spokane, WA, USA, 1999. [Google Scholar]
  24. Avista (Avista Corporation). Addendum Final GAS Supersaturation Control Program for the Clark Fork Project; Avista Corporation: Spokane, WA, USA, 2009. [Google Scholar]
  25. Li, P.; Zhu, D.Z.; Crossman, J.; Cheng, X. Spillway deflector designs for mitigating supersaturated total dissolved gases. J. Clean. Prod. 2023, 426, 139027. [Google Scholar] [CrossRef]
  26. Maatooq, J.; Taleb, E. The effects of baffle blocks locations and blockage ratio on the sequent depth and velocity distribution of forced hydraulic jump. In Proceedings of the 7th IAHR International Symposium on Hydraulic Structures, Aachen, Germany, 15–17 May 2018. [Google Scholar] [CrossRef]
  27. Huang, J.; Li, R.; Feng, J.; Li, Z.; Cheng, X.; Wang, Z. The application of baffle block in mitigating TDGS of dams with different discharge patterns. Ecol. Indic. 2021, 133, 108418. [Google Scholar] [CrossRef]
  28. Frizell, K.E. Cavitation Potential of the Folsom Auxiliary Spillway Basin Baffle Blocks; Hydraulic Laboratory Report No. HL-1009-06; U.S. Department of the Interior, Bureau of Reclamation: Denver, CO, USA, 2009.
  29. Dunlop, S.L.; Willig, I.A.; Paul, G. Cabinet Gorge Dam Spillway modifications for TDG abatement—Design evolution and field performance. In Hydraulic Structures and Water System Management, Proceedings of the 6th IAHR International Symposium on Hydraulic Structures, Portland, OR, USA, 27–30 June 2016; Crookston, B., Tullis, B., Eds.; 2016. [Google Scholar] [CrossRef]
  30. Weber, L.; Huang, H.; Lai, Y.; McCoy, A. Modeling total dissolved gas production and transport downstream of spillways: Three-dimensional development and applications. Int. J. River Basin Manag. 2004, 2, 157–167. [Google Scholar] [CrossRef]
  31. Politano, M.; Amado, A.A.; Bickford, S.; Murauskas, J.; Hay, D. Evaluation of operational strategies to minimize gas supersaturation downstream of a dam. Compt. Fluids 2012, 68, 168–185. [Google Scholar] [CrossRef]
  32. Zapel, E.; Nelson, H.; Hughes, B.; Fry, S. Options for reducing total dissolved gas at the Long Lake Hydroelectric Facility. In Proceedings of the HydroVision International 2014 Technical Paper, Nashville, TN, USA, 22–24 July 2014. [Google Scholar]
  33. Jalayeri, N.; Groeneveld, J.; Bearlin, A.; Gulliver, J. Boundary Dam TDG (total dissolved gas) analysis using a CFD Model. In Proceedings of the 23rd Canadian Hydrotechnical Conference, Held as Part of the Canadian Society for Civil Engineering Annual Conference and General Meeting, Vamcouver, BC, Canada, 31 May–3 June 2017; pp. 73–83. [Google Scholar]
  34. Oldenburg, E. Tributary Trapping and Downstream Juvenile Bull Trout Transport Program Annual Project Update—2017; Avista Corporation: Noxon, MT, USA, 2018. [Google Scholar]
  35. Bernall, S.; Duffy, K. Upstream Fish Passage Program—Bull Trout, Annual Project Update—2018; Avista Corporation: Noxon, MT, USA, 2019. [Google Scholar]
  36. Bernall, S.; Johnson, J.; Kusnierz, P. Clark Fork River Westslope Cutthroat Trout Experimental Transport Program Comprehensive Project Report 2015–2018; Avista Corporation: Noxon, MT, USA, 2021. [Google Scholar]
  37. Scarnecchia, D.L.; Lim, Y.; Moran, S.P.; Tholl, T.D.; Dos Santos, J.M.; Breidinger, K. Novel fish communities: Native and non-native species trends in two run-of-the-river reservoirs, Clark Fork River, Montana. Rev. Fish. Sci. Aquacult. 2014, 22, 97–111. [Google Scholar] [CrossRef]
  38. Kusnierz, P. Cabinet Gorge Dam Spillway Modifications to Reduce Total Dissolved Gas Summary Report; Avista Corporation: Noxon, MT, USA, 2019. [Google Scholar]
  39. USGS Water Data for the Nation. Available online: https://waterdata.usgs.gov/nwis (accessed on 19 September 2023).
  40. Dunlop, S.; Paul, G.; Pate, K. Partnering to mitigate TDG through spillway modifications. Hydro Rev. 2014, 33, 16–24. [Google Scholar]
  41. USGS (U.S. Geological Survey). Protocol for Determining Gas Bubble Trauma in Juvenile Salmonids; U.S. Geological Survey: Cook, MT, USA, 1997.
  42. Arnold, T.B.; Emerson, J.W. Nonparametric goodness-of-fit tests for discrete null distributions. R J. 2011, 3, 34–39. [Google Scholar] [CrossRef]
  43. Fox, J. The R Commander: A basic-statistics graphical user interface to R. J. Stat. Softw. 2005, 14, 1–42. [Google Scholar] [CrossRef]
  44. Parametrix. Characterization of Dissolved Gas Conditions at Cabinet Gorge and Noxon Rapids Hydroelectric Projects During Spill Periods; Parametrix, Inc.: Kirkland, WA, USA, 1996. [Google Scholar]
  45. Parametrix. Physical and Biological Evaluations of Total Dissolved Gas Conditions at Cabinet Gorge and Noxon Rapids Hydroelectric Projects—1997; Parametrix, Inc.: Kirkland, WA, USA, 1997. [Google Scholar]
  46. Vilberg, I.; Szabo-Meszaros, M.; Pulg, U.; Velle, G. Supersaturation in Hydropower Installations; Report No: 2023:01201; SINTEF Energy Research: Trondheim, Norway, 2023. [Google Scholar]
  47. Macdonald, J.R.; Hyatt, R.A. Supersaturation of nitrogen in water during passage through hydroelectric turbines at Mactaquac Dam. J. Fish. Res. Bd. Can. 1973, 30, 1392–1394. [Google Scholar] [CrossRef]
  48. Pulg, U.; Vollset, K.W.; Velle, G.; Stranzl, S. First observations of saturopeaking: Characteristics and implications. Sci. Total Environ. 2016, 573, 1615–1621. [Google Scholar] [CrossRef]
  49. Rognerud, M.E. How to Avoid Gas Supersaturation in the River Downstream a Hydropower Plant. Master’s Thesis, Norwegian University of Science and Technology, Trondheim, Norway, 2020. [Google Scholar]
  50. Kuhn, W.L.; Solemslie, B.W.; Hihn, J.-Y.; Dahlhaug, O.G. Evaluating natural degassing in a river to create a baseline for comparison to technical degassing methods. J. Phys. Conf. Ser. 2023, 2629, 012032. [Google Scholar] [CrossRef]
  51. Sanchez-Hernandez, J. Drivers of piscivory in a globally distributed aquatic predator (brown trout): A meta-analysis. Sci. Rep. 2020, 10, 11258. [Google Scholar] [CrossRef]
  52. Gard, M.F. Interactions between an introduced piscivore and a native piscivore in a California stream. Environ. Biol. Fishes 2004, 71, 287–295. [Google Scholar] [CrossRef]
  53. Hill, C.W. Observations on the life histories of the peamouth (Mylocheilus caurinus) and the northern squawfish (Ptychocheilus oregonensis) in Montana. Proc. Mont. Acad. Sci. 1962, 22, 27–44. [Google Scholar]
  54. Muhlfeld, C.C.; McMahon, T.E.; Belcer, D.; Kershner, J.L. Spatial and temporal spawning dynamics of native westslope cutthroat trout, Oncorhynchus clarkii lewisi, introduced rainbow trout, Oncorhynchus mykiss, and their hybrids. Can. J. Fish. Aquat. Sci. 2009, 66, 1153–1168. [Google Scholar] [CrossRef]
  55. Schreck, C.B.; Contreras-Sanchez, W.; Fitzpatrick, M.S. Effects of stress on fish reproduction, gamete quality, and progeny. In Reproductive Biotechnology in Finfish Aquaculture; Lee, C., Donaldson, E.M., Eds.; Elsevier Science: Amsterdam, The Netherlands, 2001; pp. 3–24. [Google Scholar]
  56. Witt, A.; Magee, T.; Stewart, K.; Hadjerioua, B.; Neumann, D.; Zagona, E.; Politano, M. Development and implementation of an optimization model for hydropower and total dissolved gas in the Mid-Columbia River system. J. Water Resour. Plan Manag. 2017, 143, 04017063. [Google Scholar] [CrossRef]
  57. Politano, M.; Arenas Amado, A.; Anderson, K. Validation of a numerical model to predict TDG in Hells Canyon Dam. Aust. J. Water Resour. 2014, 18, 162–179. [Google Scholar]
  58. Andriolo, M.V.; de Araújo, A.N.; Fontanelli, C.; Paranhos, C.S.A.; Politano, M.; Dettmer, P.H.C. Installation of deflector in Colider Dam to minimize the percentual of total dissolved gases. Braz. J. Water Resour. 2023, 28, e25. [Google Scholar] [CrossRef]
  59. Deng, Z.D.; Duncan, J.P.; Arnold, J.L.; Fu, T.; Martinez, J.; Lu, J.; Titzler, P.S.; Zhou, D.; Mueller, R.P. Evaluation of Boundary Dam spillway using an autonomous sensor fish device. J. Hydro-Environ. Res. 2017, 14, 85–92. [Google Scholar] [CrossRef]
Figure 1. The lower Clark Fork River from Cabinet Gorge Dam to Lake Pend Oreille, Idaho.
Fishes 09 00427 g001
Figure 2. View looking upstream at Cabinet Gorge Dam spillway (A). Spill bays are ordered from river right to river left. Roughness element modifications can be seen on spill bays 1–5. Overhead images and side profile diagrams of modifications made to spill bay 1 (and 3) (B), spill bay 2 (C), and spill bay 4 (and 5) (D). In the diagrams, white represents original concrete structure, gray represents demolished and new concrete, and black represents installed roughness elements. Before modification, spill bays 1–5 looked like spill bays 6–8 with side profiles similar to spill bay 1 without roughness elements.
Fishes 09 00427 g002
Figure 3. Daily discharge for the lower Clark Fork River during the spill season under median (solid line) and 75th percentile (dashed line) discharge scenarios.
Fishes 09 00427 g003
Figure 4. Relationships between mean dissolved gas and mean daily discharge for the lower Clark Fork River for the pre- (black line) and post-modification of spill bays (gray line). Pre-modification data points (n = 158) are shown in black, and post-modification data points (n = 364) are shown in gray.
Fishes 09 00427 g004
Figure 5. Predicted mean daily total dissolved gas (TDG) levels downstream of Cabinet Gorge Dam during the spill season under median (left graph) and 75th percentile (right graph) discharge scenarios. The black lines represent pre-modification TDG values, and the gray lines represent post-modification TDG values.
Fishes 09 00427 g005
Figure 6. The predicted probability of observing gas bubble trauma (GBT) during the spill season on fish downstream of Cabinet Gorge Dam under the median (left graph) and 75th percentile (right graph) discharge scenarios (note that the y-axis scale differs between graphs). The black lines represent pre-modification GBT probabilities, and the gray lines represent post-modification GBT probabilities.
Fishes 09 00427 g006
Table 1. Description and design capacity of spill bay modifications.
Spill BayModification DescriptionDesign Capacity
(m3/s per Spill Bay)
Year Completed
2Two offset rows of steel-covered roughness elements (five upstream and four downstream) with an extension flip lip at the downstream end of the spill bay ogee1702014
4 and 5Five steel-covered roughness elements at the downstream end of the spill bay ogee2042016
1 and 3Five steel plates affixed to the front of the spill bay2042017
Table 2. Summary values for cubic function relationships between total dissolved gas and discharge pre- and post-modification of spill bays.
Relationshipr2abcd
Pre-modification0.94−3.32 × 10−91.6253 × 10−5−6.2031 × 10−3100.0530
Post-modification0.96−3.34 × 10−91.9560 × 10−5−1.7936 × 10−2106.3337
Table 3. The number of days during the spill season downstream of Cabinet Gorge dam when mean daily total dissolved gas exceeded 110%, 120%, and 130% saturation under median and 75th percentile discharge scenarios.
ScenarioRelationshipDays When Total Dissolved Gas Exceeded
110% Saturation120% Saturation130% Saturation
MedianPre-modification4230
Post-modification3500
Difference−7−3NC
75th percentilePre-modification72436
Post-modification58320
Difference−14−11−6
NC = no change.
Table 4. The number of days during the spill season downstream of Cabinet Gorge Dam when the probability of observing gas bubble trauma on fish was > 1%, 2%, 4%, and 8% saturation under the median and 75th percentile discharge scenarios.
ScenarioRelationshipDays When the Probability of Observing Gas Bubble Trauma Is
>0.01>0.02>0.04>0.08
MedianPre-modification391500
Post-modification18000
Difference−21−15NANA
75th percentilePre-modification63494019
Post-modification4941216
Difference−14−8−19−13
NA = not applicable.
Disclaimer/Publisher’s Note: The statements, opinions and data contained in all publications are solely those of the individual author(s) and contributor(s) and not of MDPI and/or the editor(s). MDPI and/or the editor(s) disclaim responsibility for any injury to people or property resulting from any ideas, methods, instructions or products referred to in the content.

