
Weight–Length Relationship Analysis Revealing the Impacts of Multiple Factors on Body Shape of Fish in China

 , , ,
, , ,
Abstract
1. Introduction
2. Materials and Methods
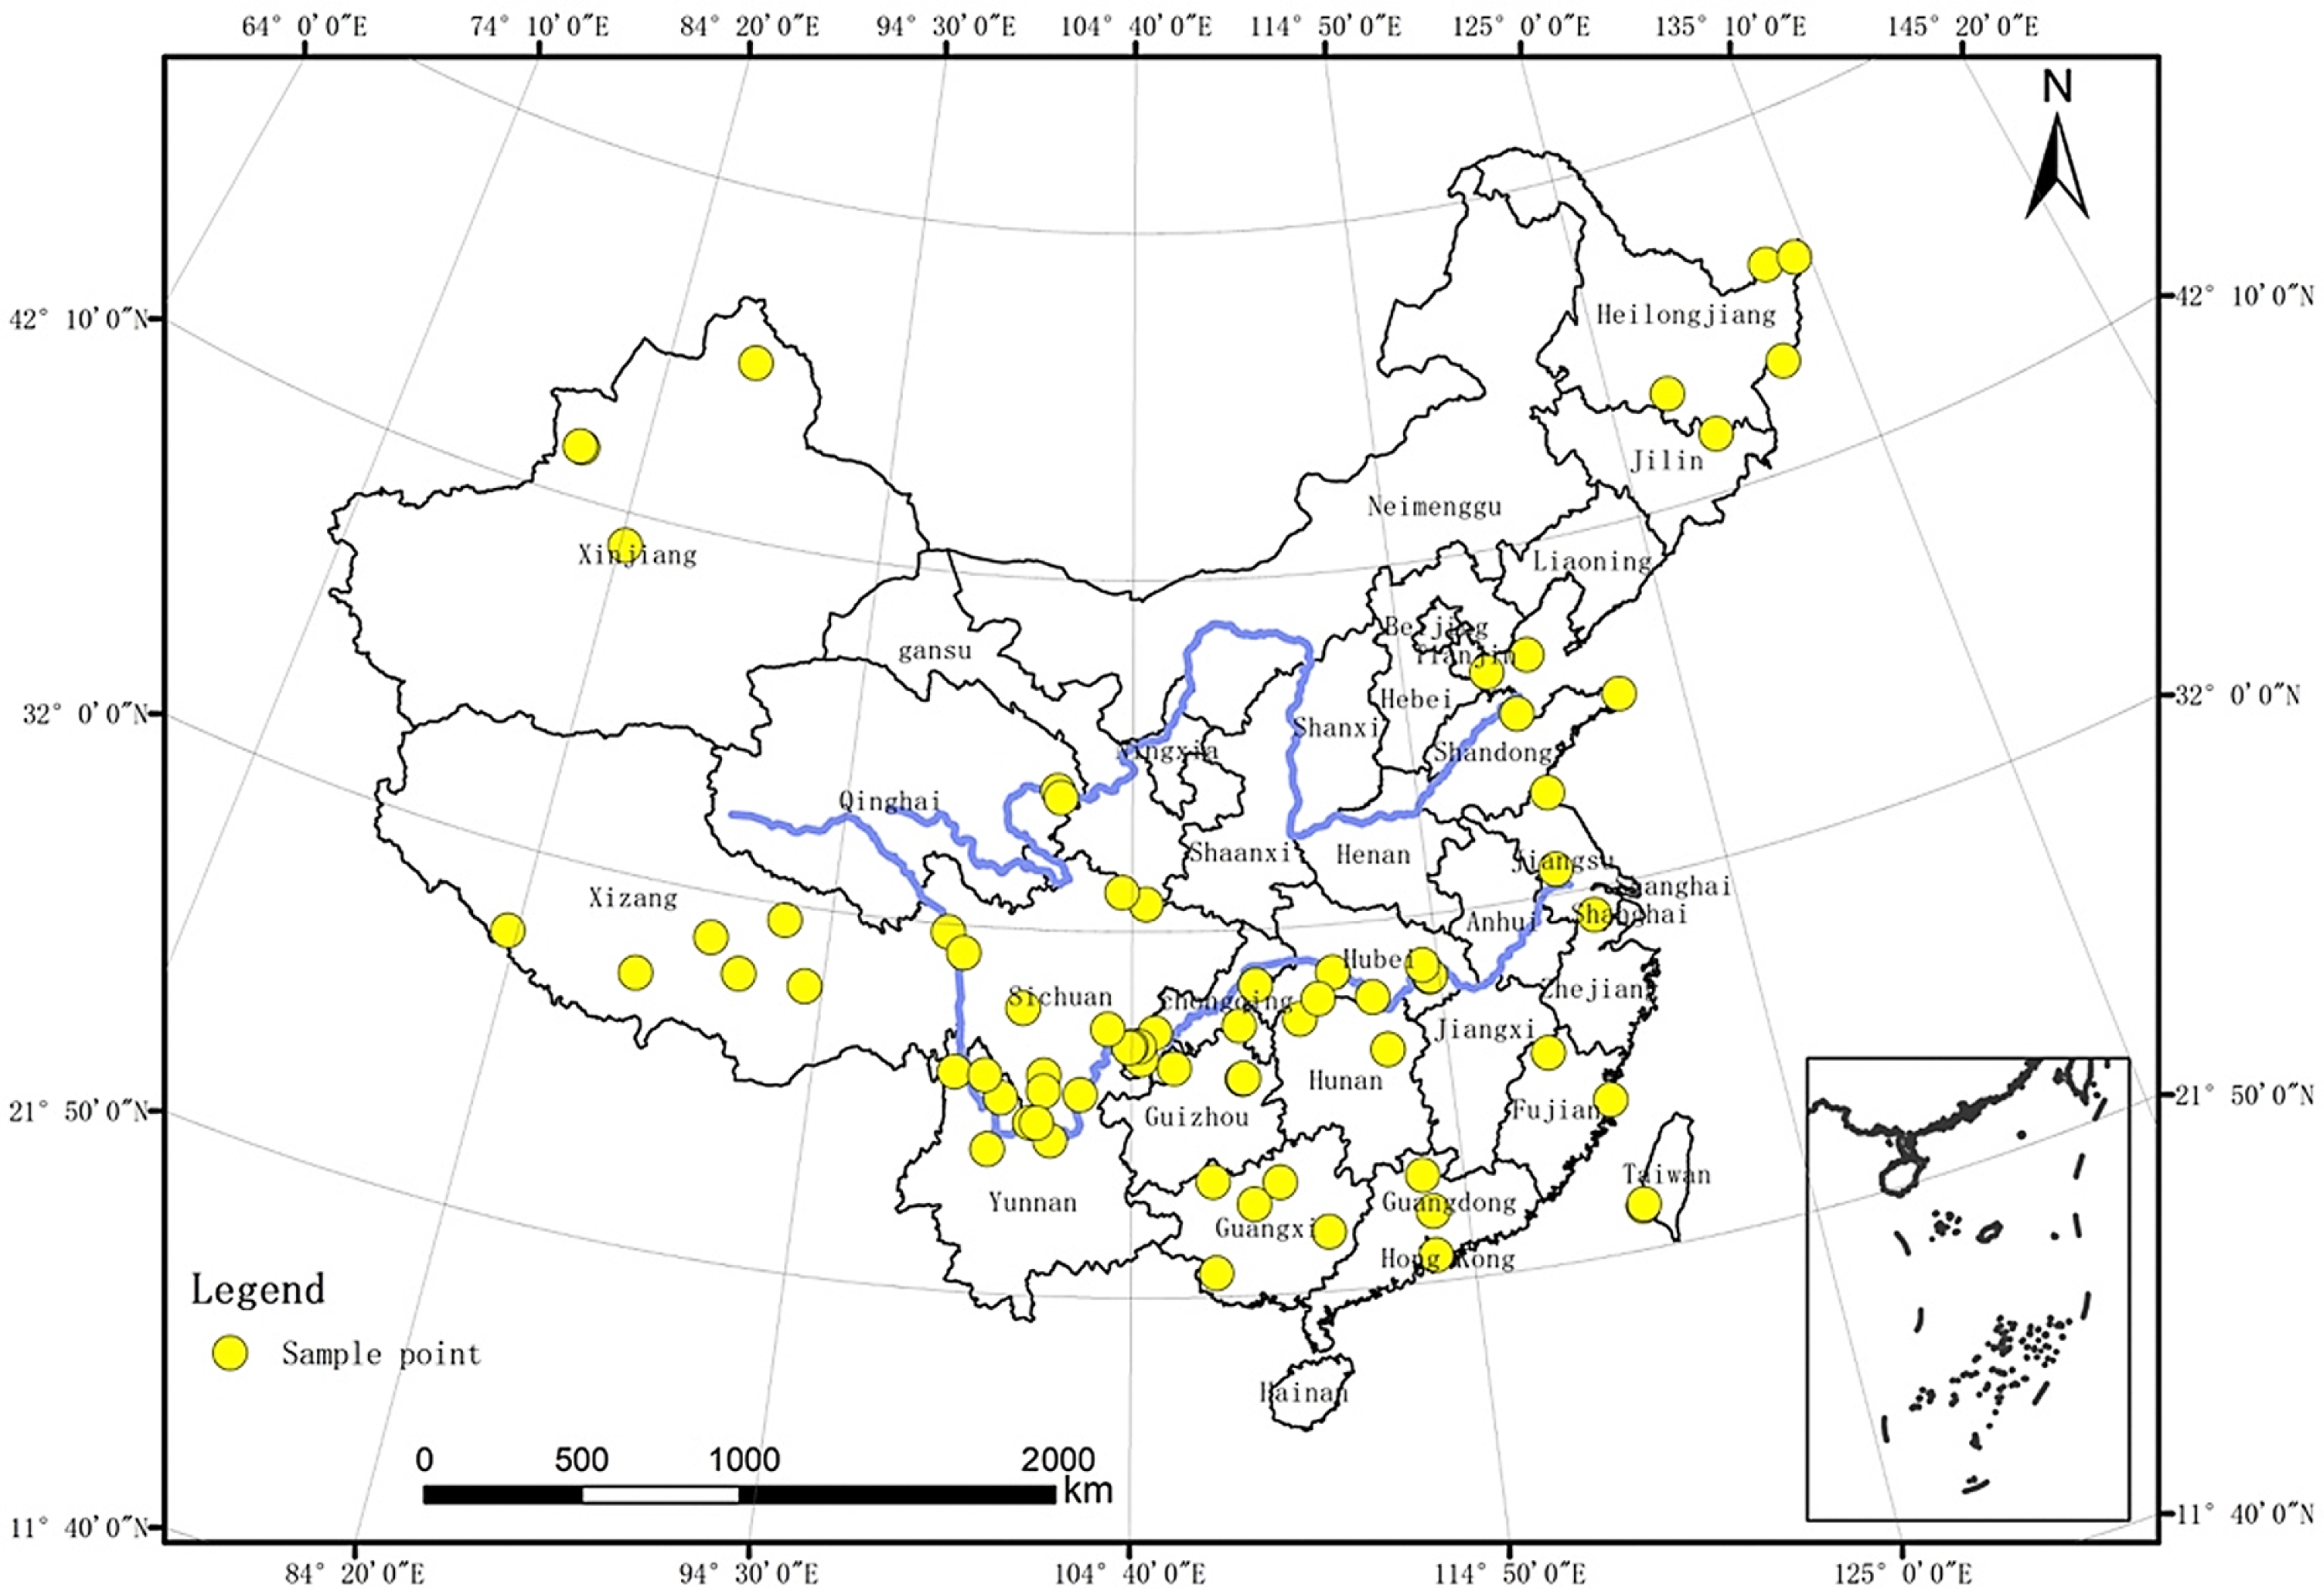
2.1. Fish Data
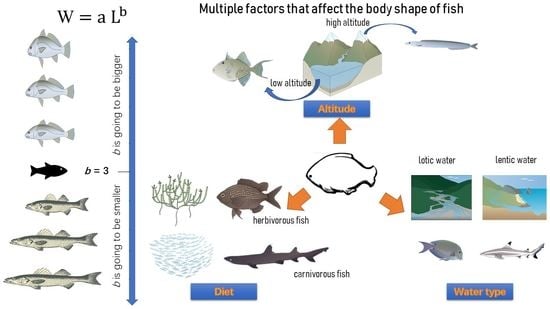
2.2. Influential Factors
2.3. Data Analysis
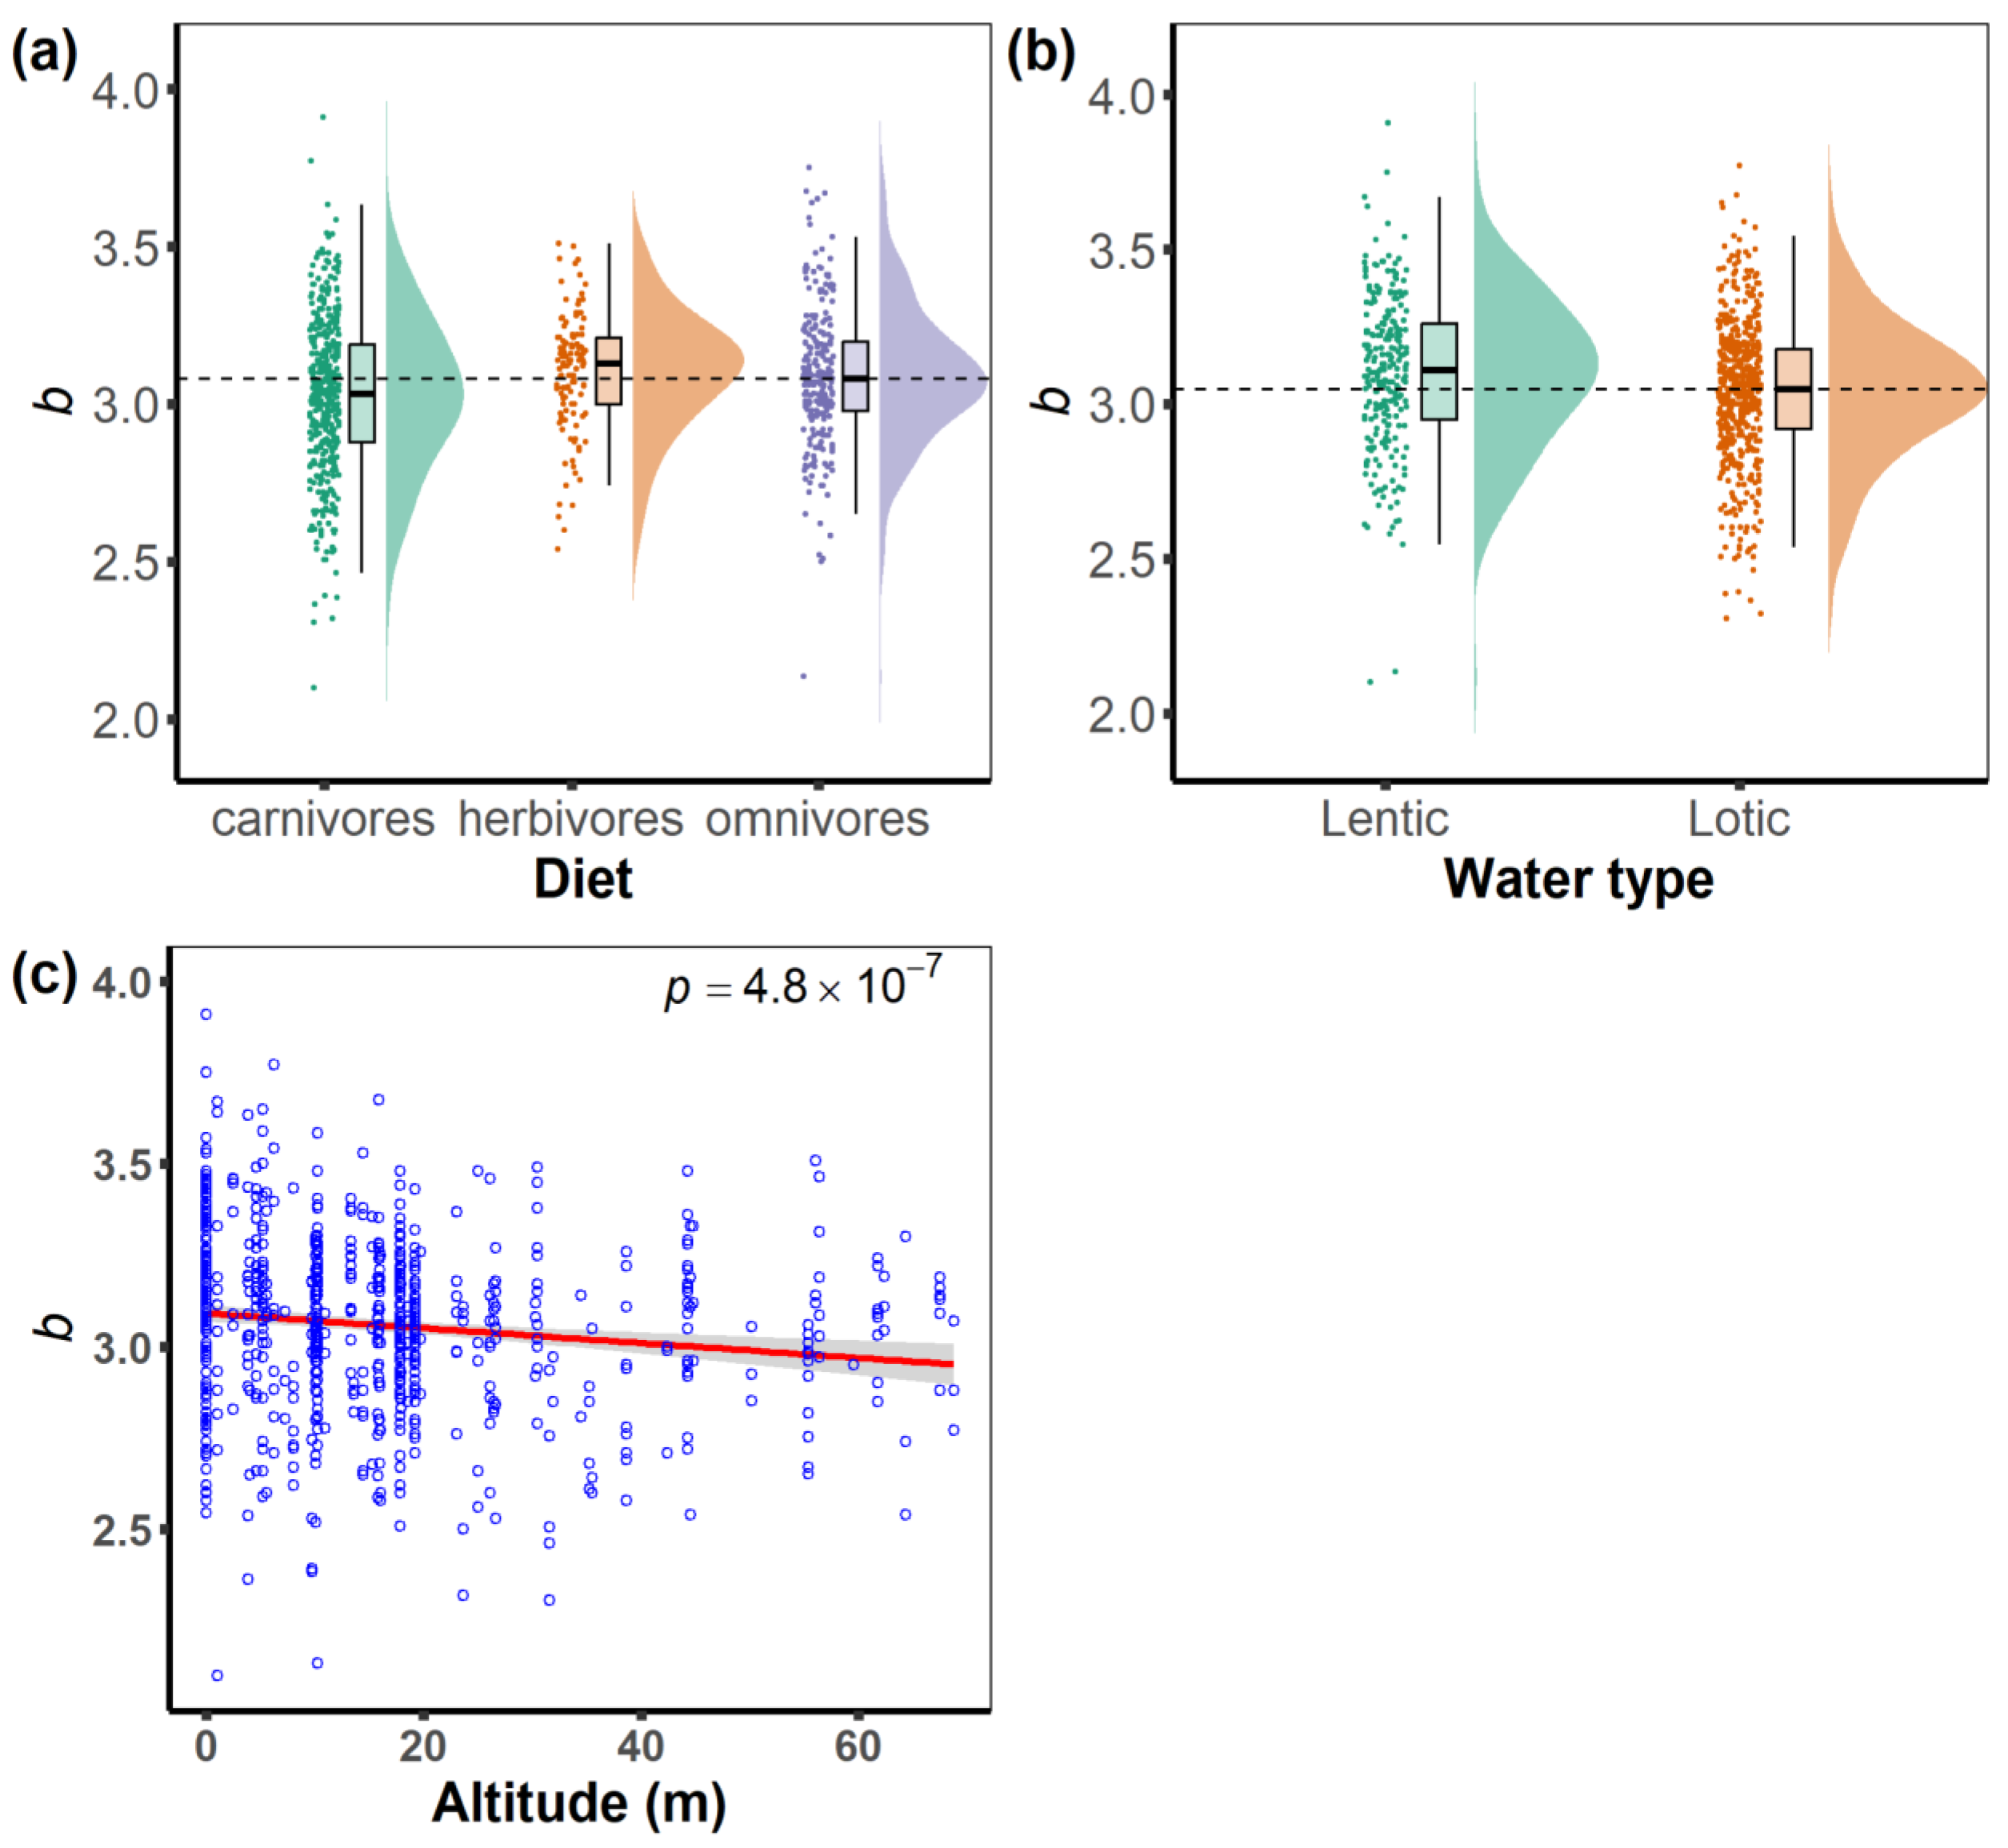
3. Results
4. Discussion
4.1. Effects of Feeding Habits on Fish Body Shape
4.2. Effects of Water Body Type on Fish Shape
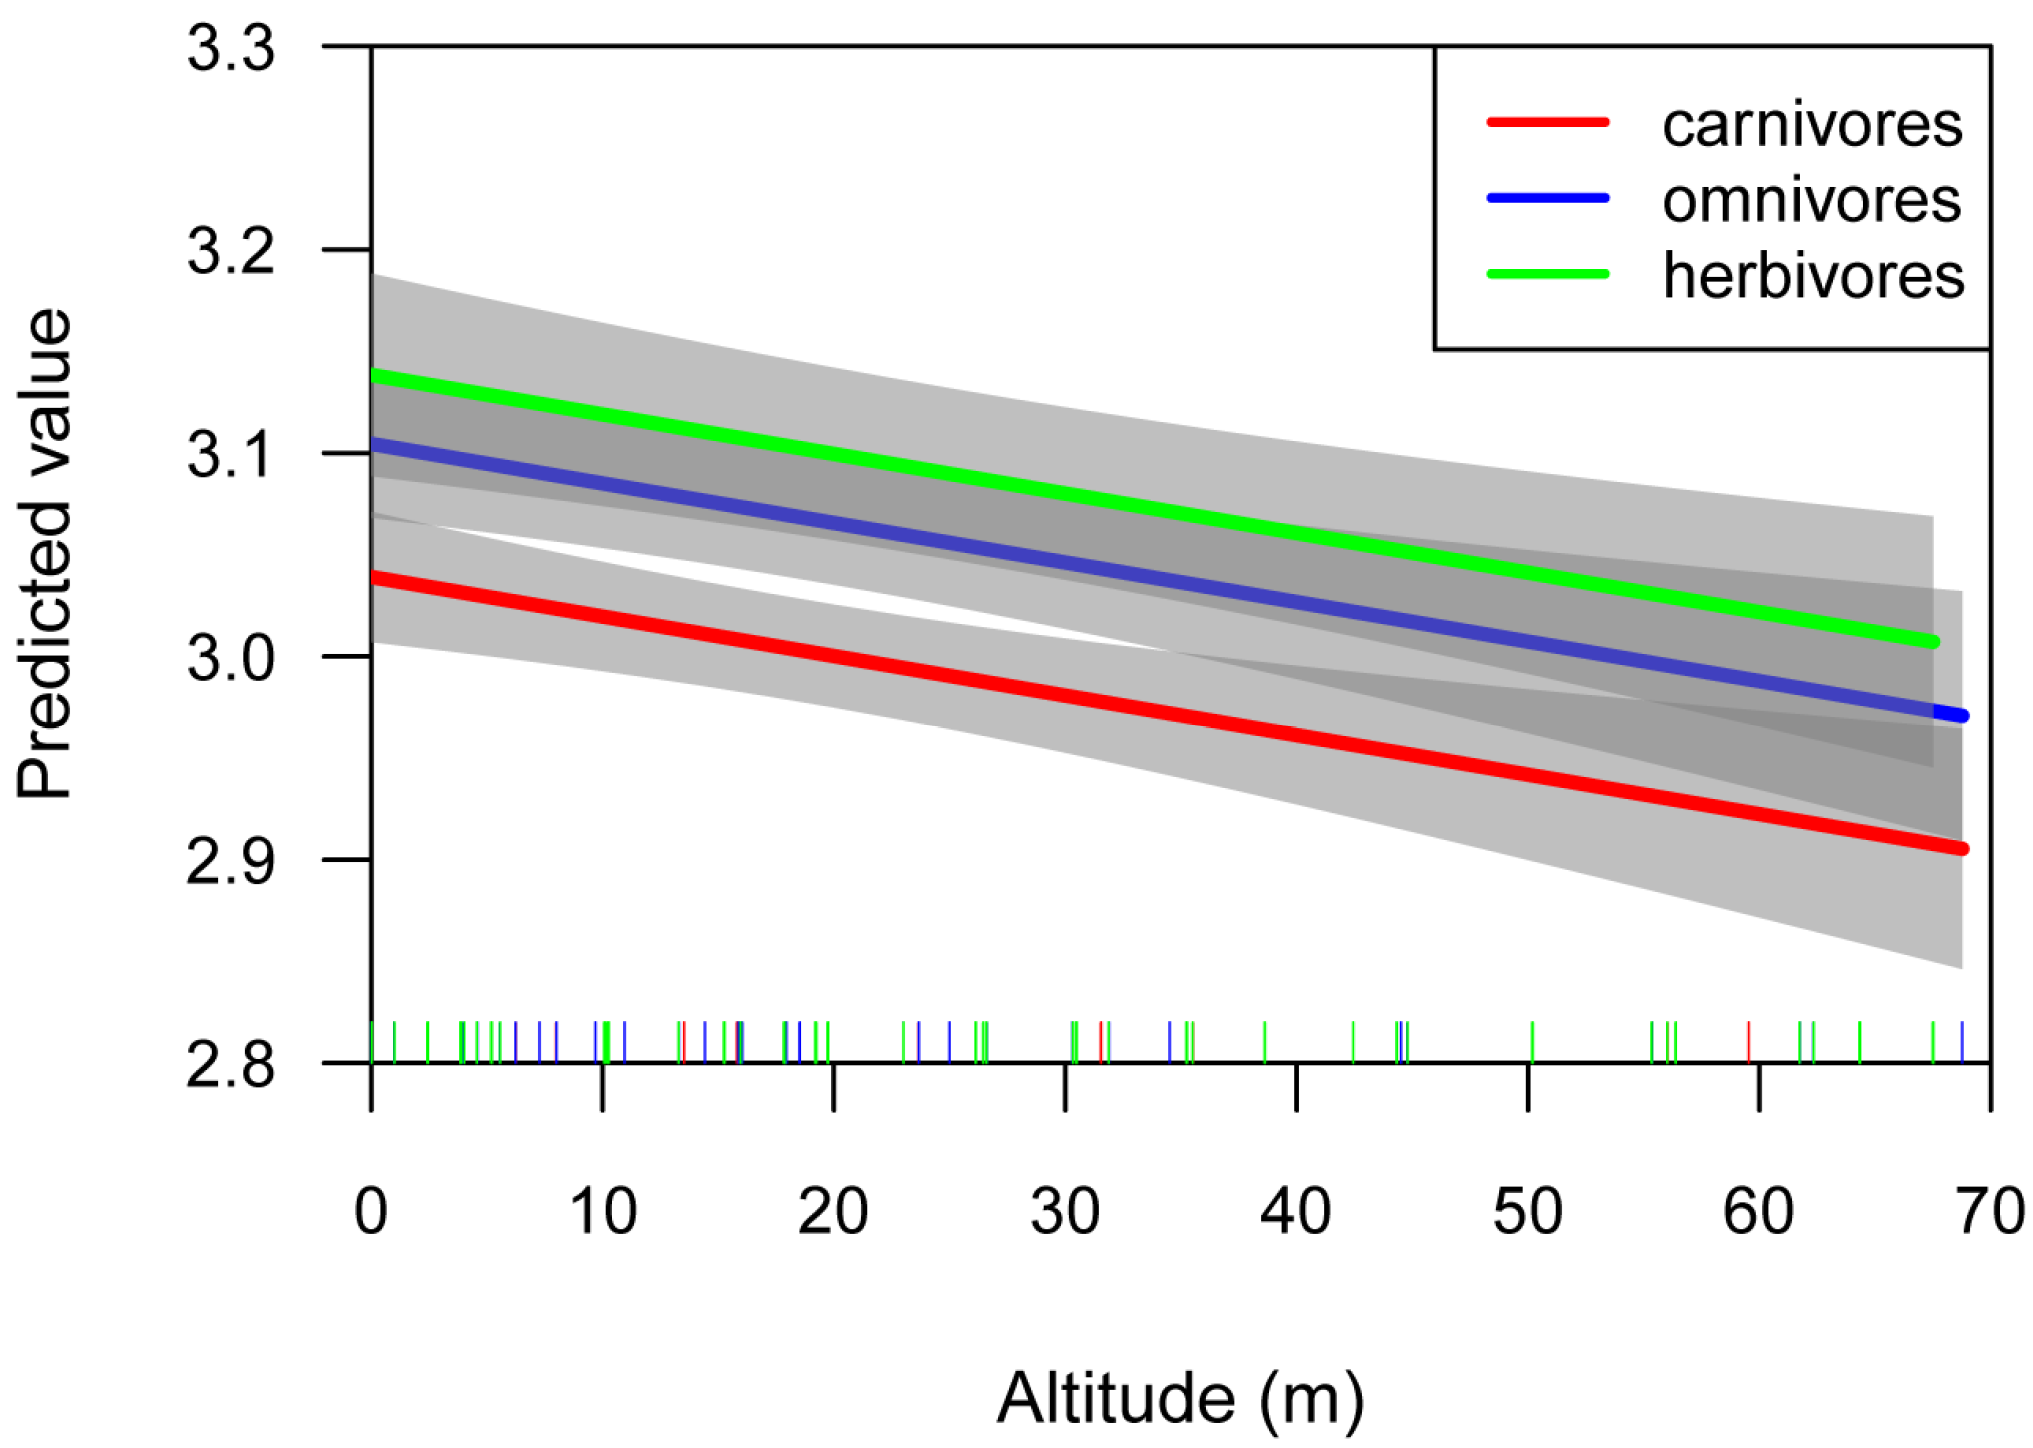
4.3. Effects of Altitude on Fish Body Shape
5. Conclusions
Supplementary Materials
Author Contributions
Funding
Institutional Review Board Statement
Data Availability Statement
Acknowledgments
Conflicts of Interest
References
- Yang, J.; Yan, D.; Yang, Q.; Gong, S.; Shi, Z.; Qiu, Q.; Huang, S.; Zhou, S.; Hu, M. Fish species composition, distribution and community structure in the Fuhe River Basin, Jiangxi Province, China. Glob. Ecol. Conserv. 2021, 27, e01559. [Google Scholar] [CrossRef]
- Wu, D.; Lu, A.; Tian, S.; Yin, X.W.; Zhang, Y.; Xu, Z.X. Quantitative analysis of the diversity and habitat suitability of the Huntai River fish community. China Environ. Sci. 2019, 39, 4875–4885. [Google Scholar] [CrossRef]
- Wang, X.; Peng, S.; Zhang, Y.; Zhang, Y.; Qian, C.; Ding, S. Analysis of Fish Community Spatial Heterogeneity and Its Driving Factors in the Luanhe River Basin. Res. Environ. Sci. 2018, 31, 273–282. [Google Scholar] [CrossRef]
- Huang, L.L.; Wu, Z.Q.; Li, J.H. Fish fauna, biogeography and conservation of freshwater fish in Poyang Lake Basin, China. Environ. Biol. Fishes 2013, 96, 1229–1243. [Google Scholar] [CrossRef]
- Oscoz, J.; Campos, F.; Escala, M.C. Weight–length relationships of some fish species of the Iberian Peninsula. J. Appl. Ichthyol. 2005, 21, 73–74. [Google Scholar] [CrossRef]
- Anene, A. Condition Factor of Four Cichlid Species of a Man-made Lake in Imo State, Southeastern Nigeria. J. Fish. Aquat. Sci. 2005, 5, 43–47. [Google Scholar]
- Hossain, M.Y.; Rahman, M.M.; Jewel, M.A.S.; Ahmed, Z.F.; Ahamed, F.; Fulanda, B.; Abdallah, E.M.; Ohtomi, J. Conditions- and From-Factor of the Five Threatened Fishes from the Jamuna (Brahmaputra River Distributary) River, Northern Bangladesah. Sains Malays. 2012, 41, 671–678. [Google Scholar] [CrossRef]
- Muchlisin, Z.A.; Musman, M.; Azizah, M.N.S. Length-weight relationships and condition factors of two threatened fishes, Rasbora tawarensis and Poropuntius tawarensis, endemic to Lake Laut Tawar, Aceh Province, Indonesia. J. Appl. Ichthyol. 2010, 26, 949–953. [Google Scholar] [CrossRef]
- Sarkar, U.K.; Deepak, P.K.; Negi, R.S. Length-weight relationship of clown knifefish Chitala chitala (Hamilton 1822) from the River Ganga basin, India. J. Appl. Ichthyol. 2009, 25, 232–233. [Google Scholar] [CrossRef]
- Landa, J.; Antolinez, A. Weight-length relationships, weight conversion factors and somatic indices from two stocks of black anglerfish (Lophius budegassa) and white anglerfish (L. piscatorius) in north-eastern Atlantic waters. Reg. Stud. Mar. Sci. 2018, 23, 87–96. [Google Scholar] [CrossRef]
- Fogg, A.Q.; Evans, J.T.; Peterson, M.S.; Brown-Peterson, N.J.; Hoffmayer, E.R.; Ingram, G.W. Comparison of age and growth parameters of invasive red lionfish (Pterois volitans) across the northern Gulf of Mexico. Fish. Bull. 2019, 117, 125–139. [Google Scholar] [CrossRef]
- Ahmed, E.O.; Ali, M.E.; Aziz, A.A. Length-weight relationships and condition factors of six fish species in atbara river and khashm el-Girba Reservoir, Sudan. J. Agric. Sci. 2011, 3, 65–70. [Google Scholar] [CrossRef]
- Froese, R. Cube law, condition factor and weight-length relationships: History, meta-analysis and recommendations. J. Appl. Ichthyol. 2006, 22, 241–253. [Google Scholar] [CrossRef]
- Sanaye, S.V.; Rivonker, C.U.; Sreepada, R.A.; Ansari, Z.A.; Murugan, A.; Ramkumar, B. Weight-length relationship and Fulton’s condition factor of the alligator pipefish, Syngnathoides biaculeatus (Bloch, 1785) from the Southeast coast of India. Curr. Sci. 2017, 113, 1605–1609. [Google Scholar] [CrossRef]
- Petrakis, G.; Stergiou, K.I. Weight-length relationships for 33 fish species in Greek waters. Fish. Res. 1995, 21, 465–469. [Google Scholar] [CrossRef]
- Perrin, W.F.; Dolar, M.L.L.; Chan, C.M.; Chivers, S.J. Length-weight relationships in the spinner dolphin (Stenella longirostris). Braz. Arch. Biol. Technol. 2010, 21, 765–778. [Google Scholar] [CrossRef]
- Rosas, F.C.W.; Rocha, C.S.D.; Mattos, G.E.D.; Lazzarini, S.M. Body weight-length relationships in giant otters (Pteronura brasiliensis) (Carnivora, Mustelidae). Braz. Arch. Biol. Technol. 2009, 52, 587–591. [Google Scholar] [CrossRef]
- Balasubramanian, R.; Murugan, A. Length-Weight Relationship of the Great seahorse, Hippocampus kelloggi (Jordan and Snyder 1902), inhabiting Coromandel Coast, Southeast coast of India. Ind. J. Geo-Mar. Sci. 2017, 46, 1193–1197. [Google Scholar]
- Giacalone, V.M.; D’Anna, G.; Badalamenti, F.; Pipitone, C. Weight-length relationships and condition factor trends for thirty-eight fish species in trawled and untrawled areas off the coast of northern Sicily (central Mediterranean Sea). J. Appl. Ichthyol. 2010, 26, 954–957. [Google Scholar] [CrossRef]
- Gurkan, S.; Taskavak, E. Length-weigth relationships for syngnathid fishes of the Aegean Sea, Turkey. Belg. J. Zool. 2007, 137, 219–222. [Google Scholar]
- Kelly, B.K.; Smokorowski, K.E.M.; Power, M. Growth, Condition and Survival of Three Forage Fish Species Exposed to Two Different Experimental Hydropeaking Regimes in a Regulated River. River Res. Appl. 2017, 33, 50–62. [Google Scholar] [CrossRef]
- Ribeiro, R.P.V.P.M.J. Length-weight relationships of six syngnathid species from Ria Formosa, SW Iberian coast. Cah. Biol. Mar. 2014, 55, 9–12. [Google Scholar] [CrossRef]
- Imsland, A.K.; Jonassen, T.M. Regulation of growth in turbot (Scophthalmus maximus Rafinesque) and Atlantic halibut (Hippoglossus hippoglossus L.): Aspects of environment x genotype interactions. Rev. Fish Biol. Fish. 2001, 11, 71–90. [Google Scholar] [CrossRef]
- Dülger, N.; Kumlu, M.; Türkmen, S.; Ölçülü, A.; Eroldoğan, O.T.; Yılmaz, H.A.; Öçal, N. Thermal tolerance of European Sea Bass (Dicentrarchus labrax) juveniles acclimated to three temperature levels. J. Therm. Biol. 2012, 37, 79–82. [Google Scholar] [CrossRef]
- Wang, L.; Wu, Z.; Liu, M.; Liu, W.; Zhao, W.; Liu, H.; Zhang, P.; You, F. Length-weight, length-length relationships, and condition factors of black rockfish Sebastes schlegelii Hilgendorf, 1880 in Lidao Bay, China. Thalass. Int. J. Mar. Sci. 2017, 33, 57–63. [Google Scholar] [CrossRef]
- Arnason, T.; Bjoernsson, B.; Steinarsson, A. Allometric growth and condition factor of Atlantic cod (Gadus morhua) fed to satiation: Effects of temperature and body weight. J. Appl. Ichthyol. 2009, 25, 401–406. [Google Scholar] [CrossRef]
- Catella, A.C.; Petrere, M. Body-shape and food habits of fish from Baia da Onca, a Pantanal flood plain lake, Brazil. Int. Assoc. Theor. Appl. Limnol. 1998, 26, 2203–2208. [Google Scholar] [CrossRef]
- Hohne, L.; Palmer, M.; Monk, C.T.; Matern, S.; Nikolaus, R.; Trudeau, A.; Arlinghaus, R. Environmental determinants of perch (Perca fluviatilis) growth in gravel pit lakes and the relative performance of simple versus complex ecological predictors. Ecol. Freshw. Fish 2020, 29, 557–573. [Google Scholar] [CrossRef]
- Liu, X.J.; Ao, X.F.; Ning, Z.T.; Hu, X.Y.; Wu, X.P.; Ouyang, S. Diversity of fish species in suichuan river and shushui river and conservation value, China. Environ. Biol. Fishes 2017, 100, 493–507. [Google Scholar] [CrossRef]
- Hu, M.L.; Wang, C.Y.; Liu, Y.Z.; Zhang, X.Y.; Jian, S.Q. Fish species composition, distribution and community structure in the lower reaches of Ganjiang River, Jiangxi, China. Sci. Rep. 2019, 9, 10100. [Google Scholar] [CrossRef]
- Famoofo, O.O.; Abdul, W.O. Biometry, condition factors and length-weight relationships of sixteen fish species in Iwopin fresh-water ecotype of Lekki Lagoon, Ogun State, Southwest Nigeria. Heliyon 2020, 6, e02957. [Google Scholar] [CrossRef] [PubMed]
- Froese, R.; Pauly, D. FishBase. Available online: www.fishbase.org (accessed on 23 March 2023).
- Carlander, K.D.; Hedgpeth, J.W. Handbook of Freshwater Fishery Biology. Q. Rev. Biol. 1997, 73, 1224–1225. [Google Scholar] [CrossRef]
- Hile, R. Age and growth of the cisco, Leucichthys ardeti (Le Sueur), in the lakes of the North-Eastern Highlands. Bull. Bureau Fish. 1936, 48, 211–317. [Google Scholar] [CrossRef]
- Blackwell, B.G.; Brown, M.L.; Willis, D.W. Relative Weight (Wr) Status and Current Use in Fisheries Assessment and Management. Rev. Fish. Sci. 2000, 8, 1–44. [Google Scholar] [CrossRef]
- R Core Team. A Language and Environment for Statistical Computing. R Foundation for Statistical Computing.Methods in Ecology and Evolution. Available online: http://softlibre.unizar.es/manuales/aplicaciones/r/fullrefman.pdf (accessed on 23 March 2023).
- Keast, A.; Webb, D. Mouth and Body Form Relative to Feeding Ecology in Fish Fauna of a Small Lake Lake Opinicon Ontario. J. Fish. Res. Board Can. 1966, 23, 1845. [Google Scholar] [CrossRef]
- Weliange, W.S.; Amarasinghe, U.S. Relationship between Body Shape and Food Habits of Fish from Three Reservoirs of Sri Lanka. Asian Fish. Sci. 2007, 20, 257–270. [Google Scholar] [CrossRef]
- Gammanpila, M.; Amarasinghe, U.S.; Wijeyaratne, M.J.S. Morphological correlates with diet of fish assemblages in brush park fisheries of tropical estuaries. Environ. Biol. Fishes 2017, 100, 1285–1299. [Google Scholar] [CrossRef]
- Romanda, R.; Putra, D.F.; Dewiyanti, I.; Nurfadillah, N.; Batubara, A.S.; Mustaqim, M.; Muthmainnah, C.R.; Nur, F.M.; Muchlisin, Z.A. Feeding habits and length-weight relationship of giant marbled eel Anguilla marmorata in the Brayeun River, Aceh Besar District, Aceh Province, Indonesia. IOP Conf. Ser. Earth Environ. Sci. 2019, 348, 012035. [Google Scholar] [CrossRef]
- Muchlisin, Z.A.; Batubara, A.S.; Azizah, M.N.S.; Adlim, M.; Hendri, A.; Fadli, N.U.R.; Muhammadar, A.A.; Sugianto, S. Feeding habit and length weight relationship of keureling fish, Tor tambra Valenciennes, 1842 (Cyprinidae) from the western region of Aceh Province, Indonesia. Biodiversitas J. Biol. Divers. 2015, 16, 89–94. [Google Scholar] [CrossRef]
- Dürrani, Ö.; Ateşşahin, T.; Eroğlu, M.; Düşükcan, M. Morphological variations of an invasive cyprinid fish (Carassius gibelio) in lentic and lotic environments inferred from the body, otolith, and scale shapes. Acta Zool. 2022, 1–15. [Google Scholar] [CrossRef]
- Ahmadi, A. Length-Weight Relationship and Condition Factor of the Silver Rasbora (Rasbora argyrotaenia) from Sungai Batang River, South Kalimantan, Indonesia. Philipp. J. Sci. 2021, 150, 1735–1749. [Google Scholar] [CrossRef]
- Del Signore, A.; Lenders, H.J.R.; Hendriks, A.J.; Vonk, J.A.; Mulder, C.; Leuven, R.S.E.W. Size-Mediated Effects of Water-Flow Velocity on Riverine Fish Species. River Res. Appl. 2016, 32, 390–398. [Google Scholar] [CrossRef]
- Jisr, N.; Younes, G.; Sukhn, C.; El-Dakdouki, M.H. Length-weight relationships and relative condition factor of fish inhabiting the marine area of the Eastern Mediterranean city, Tripoli-Lebanon. Egypt. J. Aquat. Res. 2018, 44, 299–305. [Google Scholar] [CrossRef]
- Baudron, A.R.; Needle, C.L.; Rijnsdorp, A.D.; Marshall, C.T. Warming temperatures and smaller body sizes: Synchronous changes in growth of North Sea fishes. Glob. Change Biol. 2014, 20, 1023–1031. [Google Scholar] [CrossRef]
- Gardmark, A.; Huss, M. Individual variation and interactions explain food web responses to global warming. Philos. Trans. R. Soc. B-Biol. Sci. 2020, 375, 20190449. [Google Scholar] [CrossRef]
- Lindmark, M.; Audzijonyte, A.; Blanchard, J.L.; Gardmark, A. Temperature impacts on fish physiology and resource abundance lead to faster growth but smaller fish sizes and yields under warming. Glob. Change Biol. 2022, 28, 6239–6253. [Google Scholar] [CrossRef]
- Lindmark, M.; Ohlberger, J.; Gardmark, A. Optimum growth temperature declines with body size within fish species. Glob. Change Biol. 2022, 28, 2259–2271. [Google Scholar] [CrossRef]
- Mustafa, S. Length-Weight Relationship and Condition Factor of Common Minnow, Esomus-Danricus (Ham.) from Different Freshwater Environments. Zool. J. Linn. Soc. 1978, 62, 349–354. [Google Scholar] [CrossRef]
- Huang, X.X.; Kang, B.; Lin, L.; Huang, L.L.; Hu, W.X.; Lin, H.D. Geology, climate, and hydrochemistry shape the spatial patterns of multiple diversity facets and functional traits of fishes. Ecol. Freshw. Fish 2023, 32, 375–387. [Google Scholar] [CrossRef]
- Kang, B.; Deng, J.; Wu, Y.; Chen, L.; Zhang, J.; Qiu, H.; Lu, Y.; He, D. Mapping China’s freshwater fishes: Diversity and biogeography. Fish Fish. 2014, 15, 209–230. [Google Scholar] [CrossRef]
- Yang, B.; Dou, M.; Xia, R.; Kuo, Y.-M.; Li, G.; Shen, L. Effects of hydrological alteration on fish population structure and habitat in river system: A case study in the mid-downstream of the Hanjiang River in China. Glob. Ecol. Conserv. 2020, 23, e01090. [Google Scholar] [CrossRef]
- Wu, W.; Xu, Z.X.; Yin, X.W.; Zuo, D.P. Assessment of ecosystem health based on fish assemblages in the Wei River basin, China. Environ. Monit. Assess 2014, 186, 3701–3716. [Google Scholar] [CrossRef] [PubMed]
- Jia, Y.T.; Chen, Y.F. River health assessment in a large river: Bioindicators of fish population. Ecol. Indic. 2013, 26, 24–32. [Google Scholar] [CrossRef]


| Range/Category | Sample Size, n | Min of b | Mean of b | Max of b | |
|---|---|---|---|---|---|
| Diet | herbivores | 24,044 | 2.540 | 3.100 | 3.510 |
| omnivores | 60,690 | 2.134 | 3.089 | 3.750 | |
| carnivores | 113,620 | 2.100 | 3.027 | 3.910 | |
| Water type | Lentic | 67,439 | 2.100 | 3.099 | 3.910 |
| Lotic | 130,915 | 2.306 | 3.040 | 3.770 | |
| Region | south | 159,279 | 2.100 | 3.054 | 3.910 |
| north | 28,706 | 2.530 | 3.079 | 3.750 | |
| Tibet | 10,369 | 2.540 | 3.012 | 3.510 | |
| Altitude | 0.0–4729.0 (m) | 198,354 | 2.100 | 3.058 | 3.910 |
| Temperature | 0.37–28.31 (°C) | 198,354 | 2.100 | 3.058 | 3.910 |
| Term | Diet | Water Type | Region | Altitude | Temperature |
|---|---|---|---|---|---|
| VIF | 1.07 | 1.17 | 2.00 | 2.00 | 1.32 |
| VIF 95% CI | (1.02, 1.22) | (1.10, 1.29) | (1.82, 2.24) | (1.81, 2.23) | (1.23, 1.46) |
| Model | AIC | Factor | p-Value |
|---|---|---|---|
| b ~ Diet + Water type + Region + Altitude + Temperature | −76.27 | Diet | <0.001 |
| Water type | 0.020 | ||
| Region | 0.076 | ||
| Altitude | 0.001 | ||
| Temperature | 0.098 | ||
| b ~ Diet + Water type + Altitude | −77.86 | Diet | <0.001 |
| Water type | 0.008 | ||
| Altitude | <0.001 |
| Estimate | Std. Error | p-Value | Confidence Interval | ||
|---|---|---|---|---|---|
| 2.5% | 97.5% | ||||
| (Intercept) | 3.0891 | 0.0169 | 2 × 10⁻¹⁶ | 3.007 | 3.071 |
| Diet herbivores | 0.0993 | 0.0245 | <0.001 | 0.051 | 0.148 |
| Diet omnivores | 0.0654 | 0.0183 | <0.001 | 0.029 | 0.101 |
| Water type Lotic | −0.0500 | 0.0187 | 0.008 | 0.013 | 0.087 |
| Altitude | −0.002 | 0.0005 | <0.001 | −0.003 | −0.001 |
| Diet | Estimate | Std. Error | p-Value | |
|---|---|---|---|---|
| (Intercept) | herbivores | 3.163 | 0.028 | <2 × 10⁻¹⁶ |
| Altitude | −0.003 | 0.001 | <0.004 | |
| (Intercept) | omnivores | 3.115 | 0.020 | <2 × 10⁻¹⁶ |
| Altitude | −0.002 | 0.001 | 0.074 | |
| (Intercept) | carnivores | 3.067 | 0.017 | <2 × 10⁻¹⁶ |
| Altitude | −0.003 | 0.001 | 0.001 |
Disclaimer/Publisher’s Note: The statements, opinions and data contained in all publications are solely those of the individual author(s) and contributor(s) and not of MDPI and/or the editor(s). MDPI and/or the editor(s) disclaim responsibility for any injury to people or property resulting from any ideas, methods, instructions or products referred to in the content. |
© 2023 by the authors. Licensee MDPI, Basel, Switzerland. This article is an open access article distributed under the terms and conditions of the Creative Commons Attribution (CC BY) license (https://creativecommons.org/licenses/by/4.0/).
Share and Cite
Li, Y.; Feng, M.; Huang, L.; Zhang, P.; Wang, H.; Zhang, J.; Tian, Y.; Xu, J. Weight–Length Relationship Analysis Revealing the Impacts of Multiple Factors on Body Shape of Fish in China. Fishes 2023, 8, 269. https://doi.org/10.3390/fishes8050269
Li Y, Feng M, Huang L, Zhang P, Wang H, Zhang J, Tian Y, Xu J. Weight–Length Relationship Analysis Revealing the Impacts of Multiple Factors on Body Shape of Fish in China. Fishes. 2023; 8(5):269. https://doi.org/10.3390/fishes8050269
Chicago/Turabian StyleLi, Yushan, Mingjun Feng, Liangliang Huang, Peiyu Zhang, Hongxia Wang, Jingwei Zhang, Yuehan Tian, and Jun Xu. 2023. "Weight–Length Relationship Analysis Revealing the Impacts of Multiple Factors on Body Shape of Fish in China" Fishes 8, no. 5: 269. https://doi.org/10.3390/fishes8050269
APA StyleLi, Y., Feng, M., Huang, L., Zhang, P., Wang, H., Zhang, J., Tian, Y., & Xu, J. (2023). Weight–Length Relationship Analysis Revealing the Impacts of Multiple Factors on Body Shape of Fish in China. Fishes, 8(5), 269. https://doi.org/10.3390/fishes8050269