
Discrimination of Schizothorax grahami (Regan, 1904) Stocks Based on Otolith Morphology


 ,
,
Abstract
:1. Introduction
2. Material and Methods
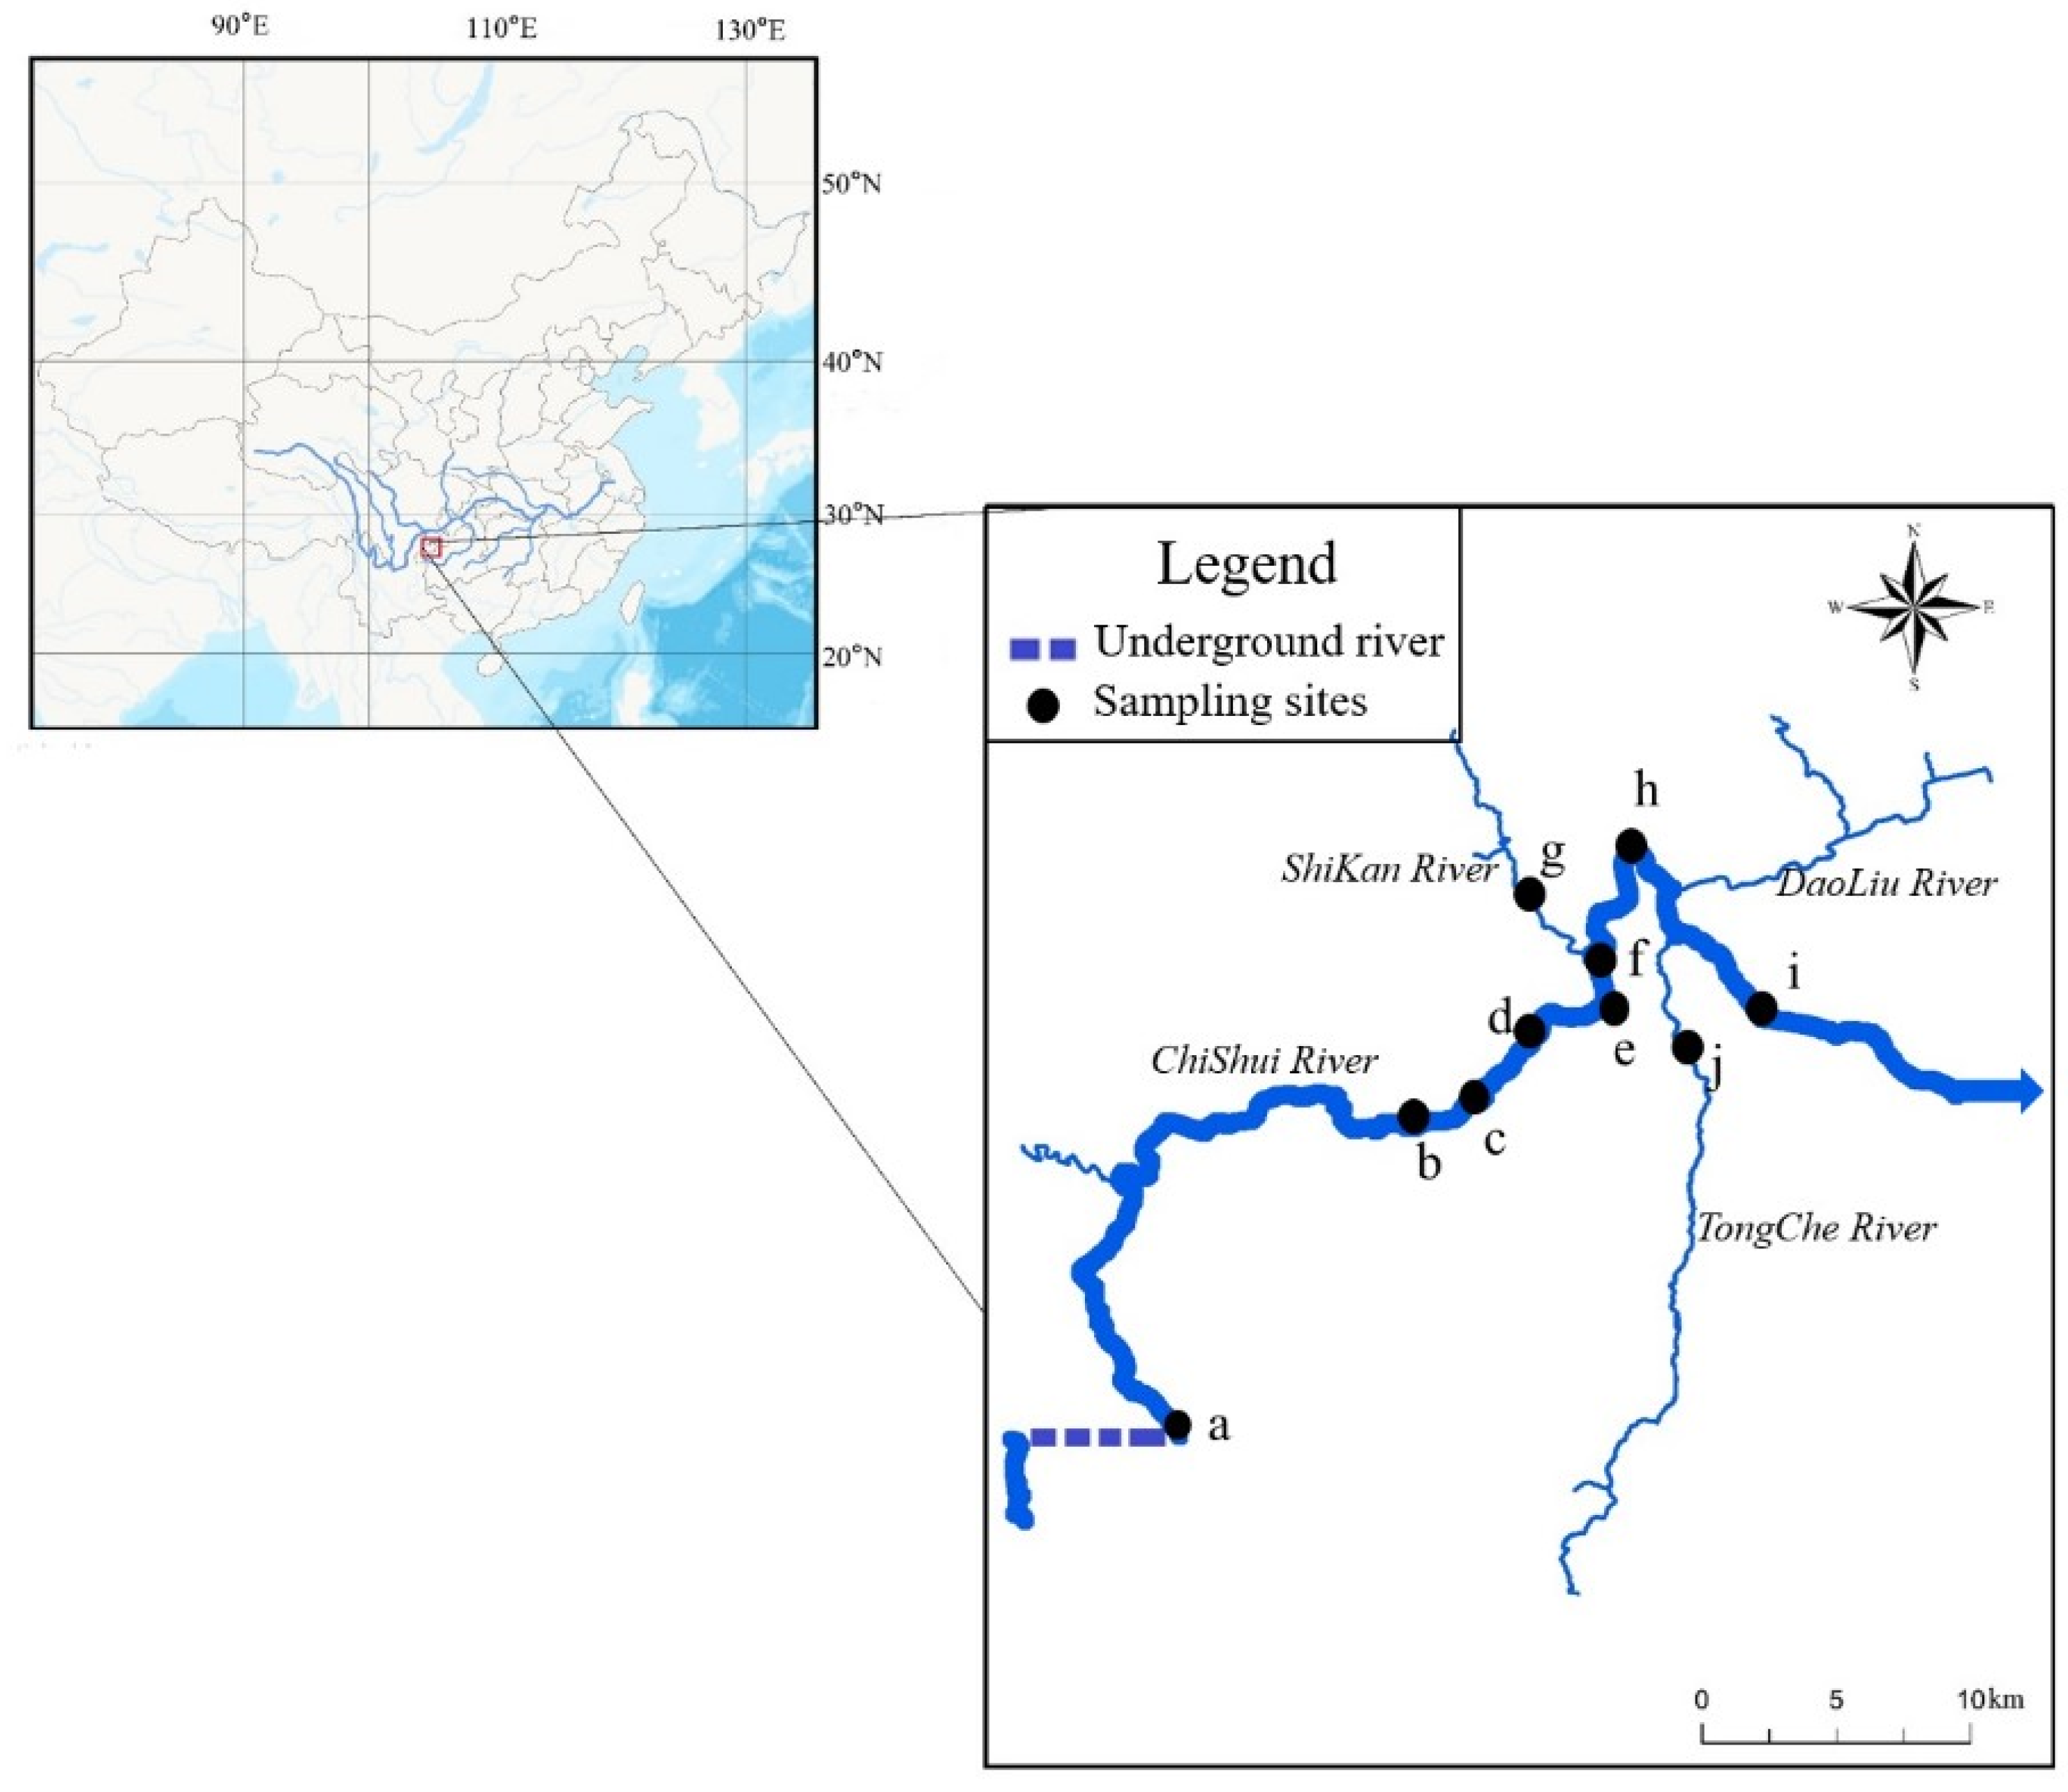
2.1. Study Area and Field Sampling
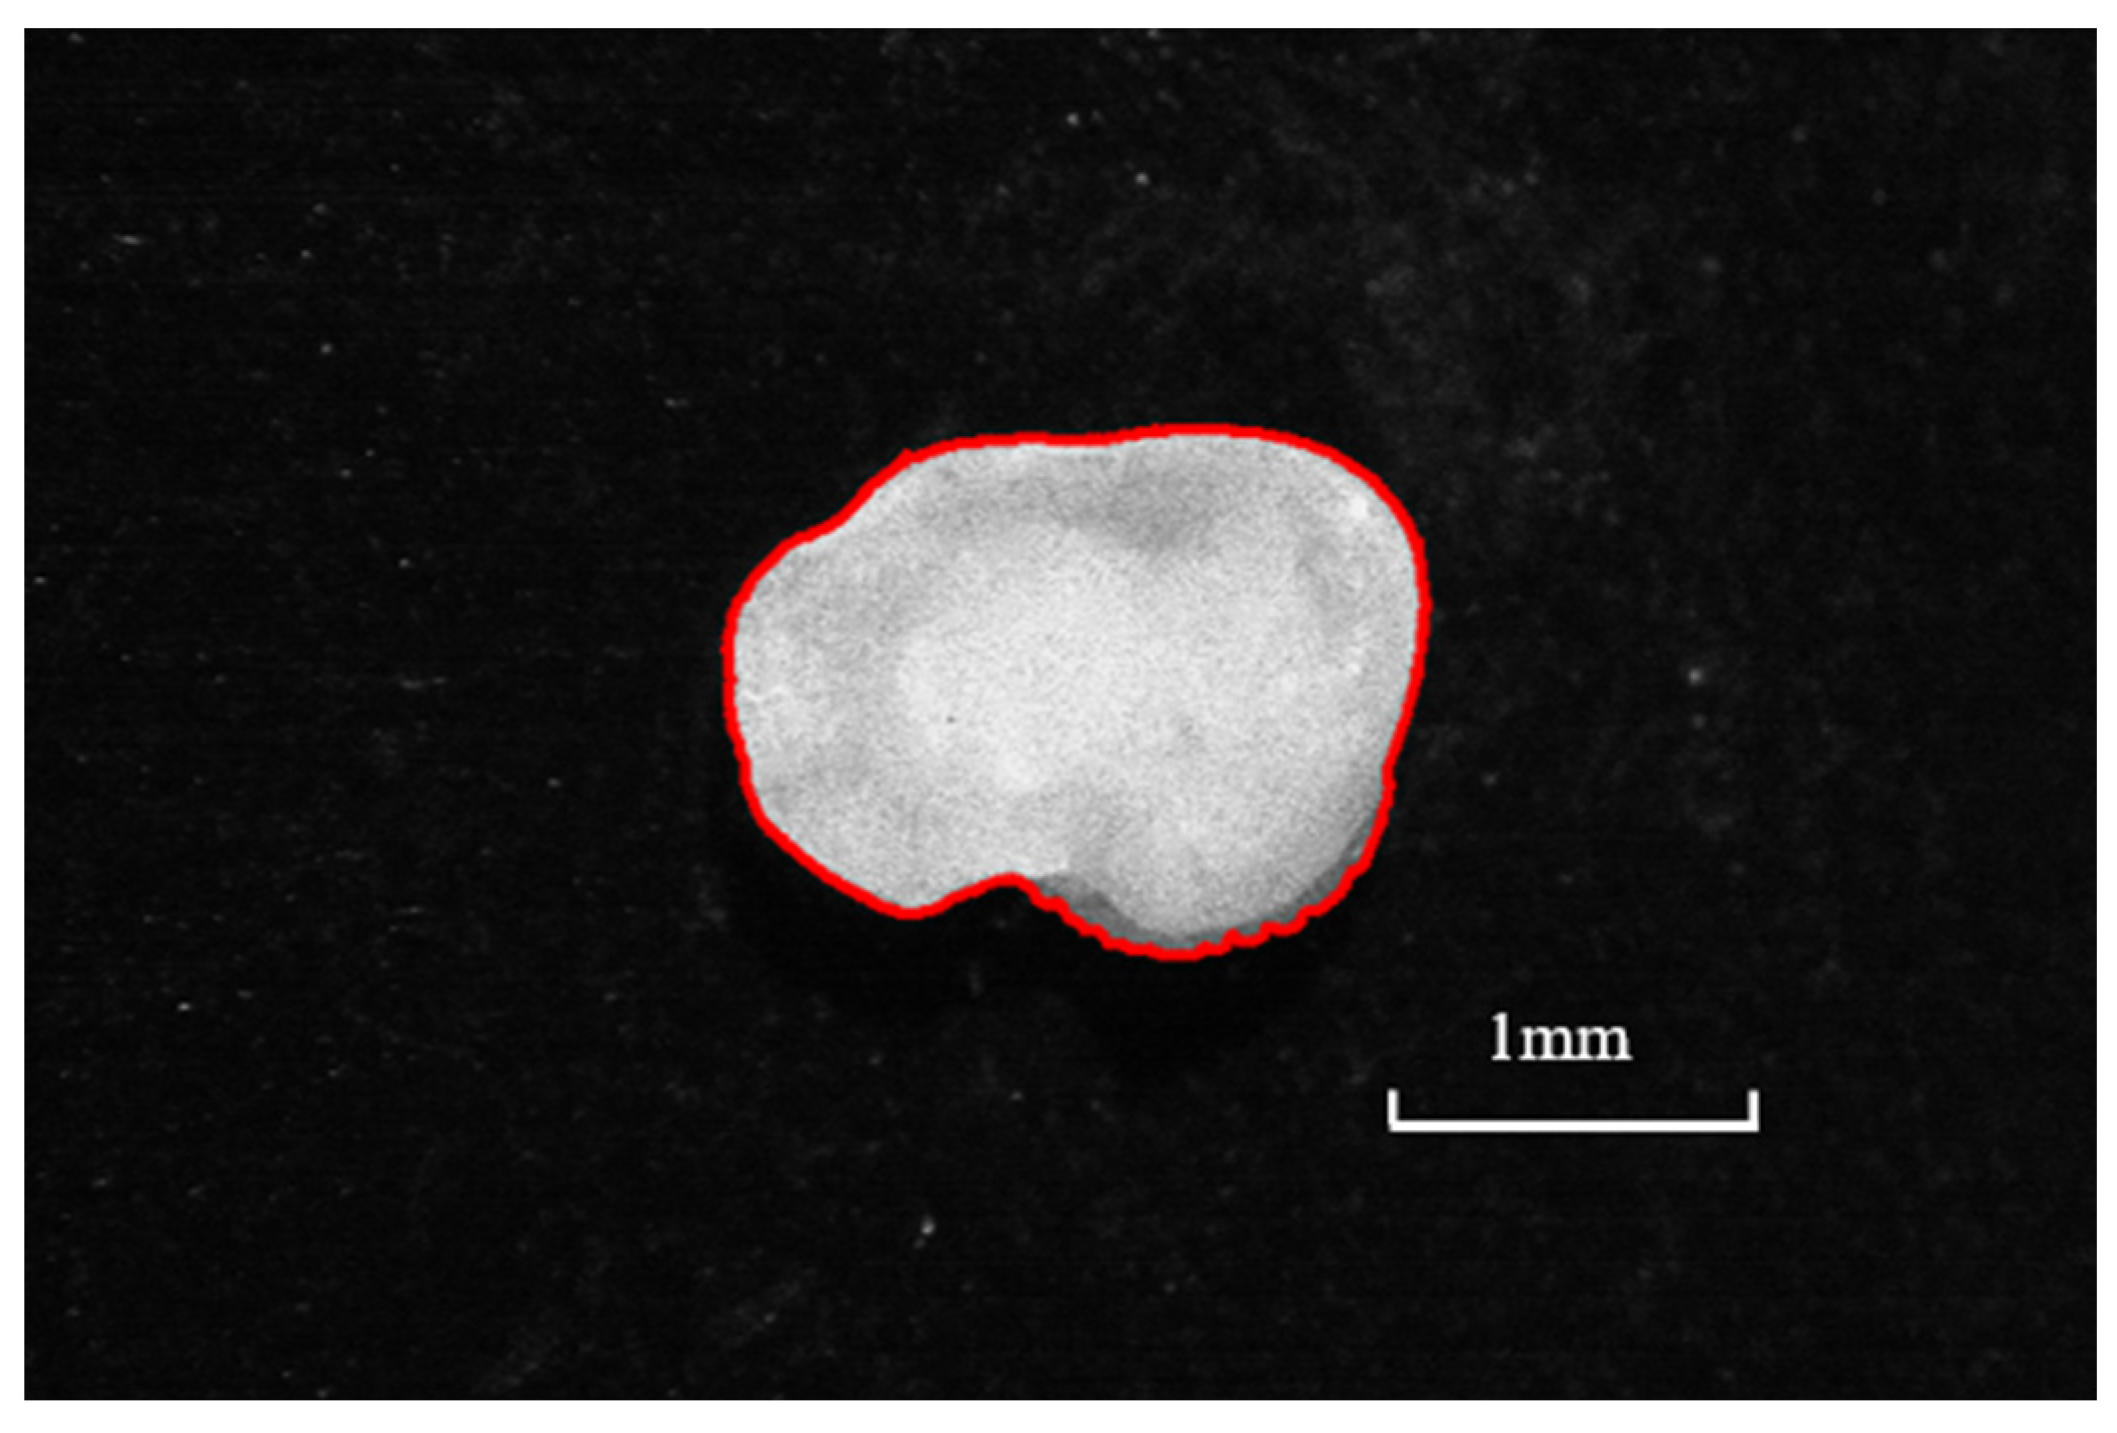
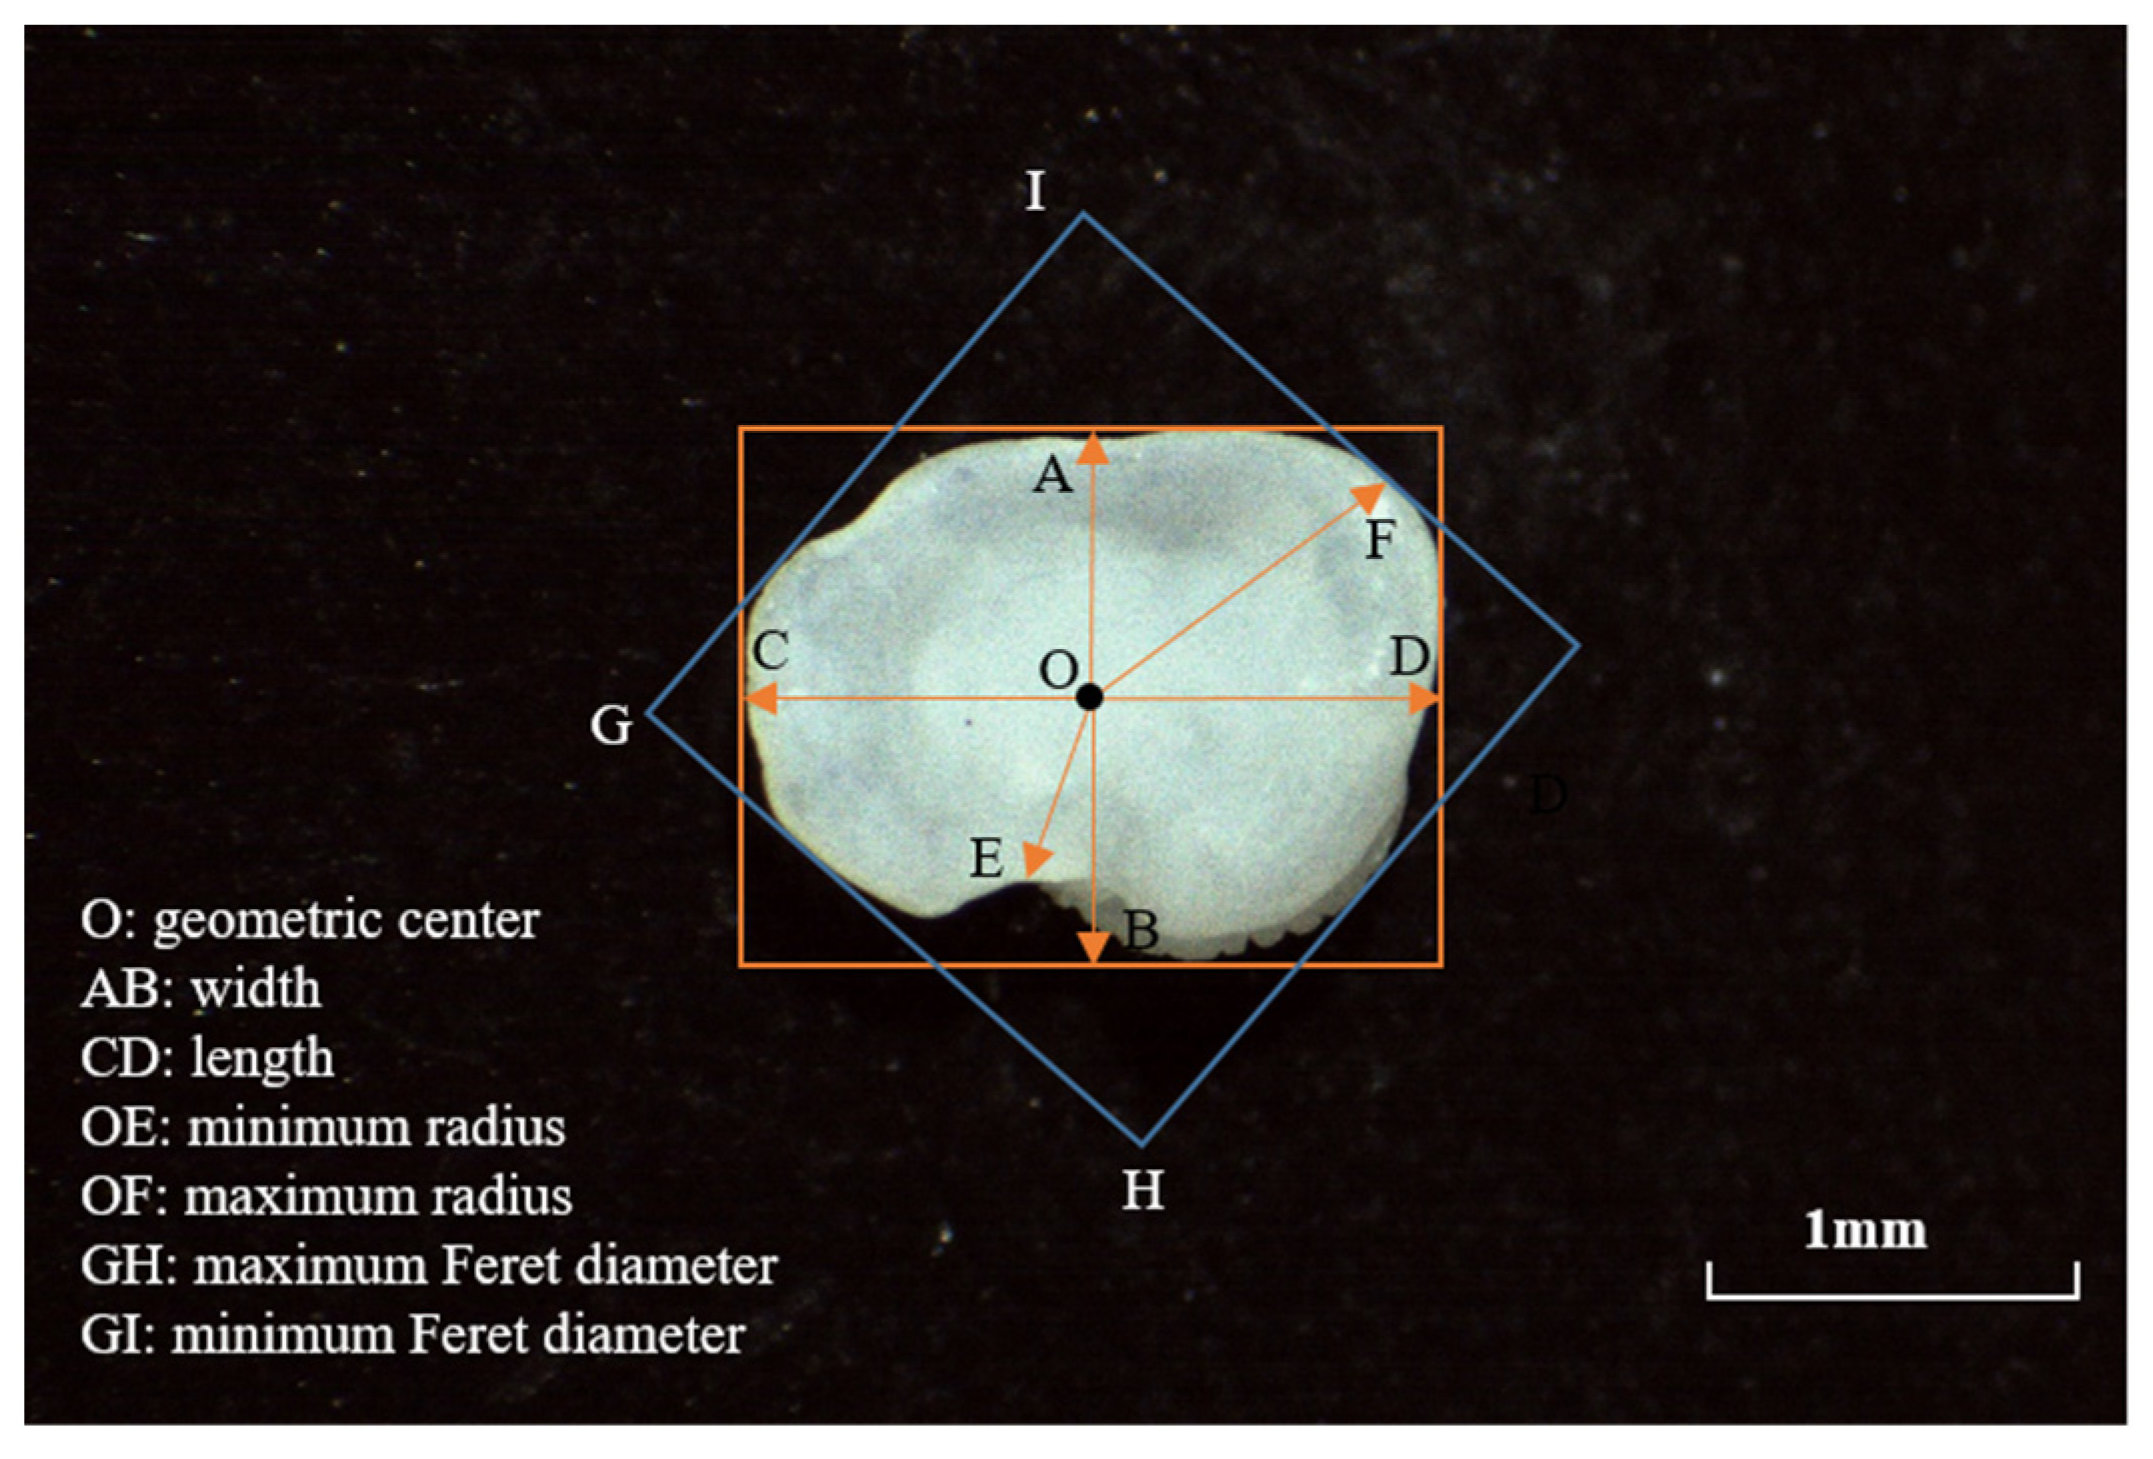
2.2. Otolith Morphometry
2.2.1. Shape Index
2.2.2. Elliptic Fourier Coefficients
2.2.3. Discrete Wavelet Coefficients
2.3. Statistical Analysis
3. Results
3.1. Analysis of Otolith Morphology Based on the River Section
3.1.1. Shape Index Analysis
ANOVA
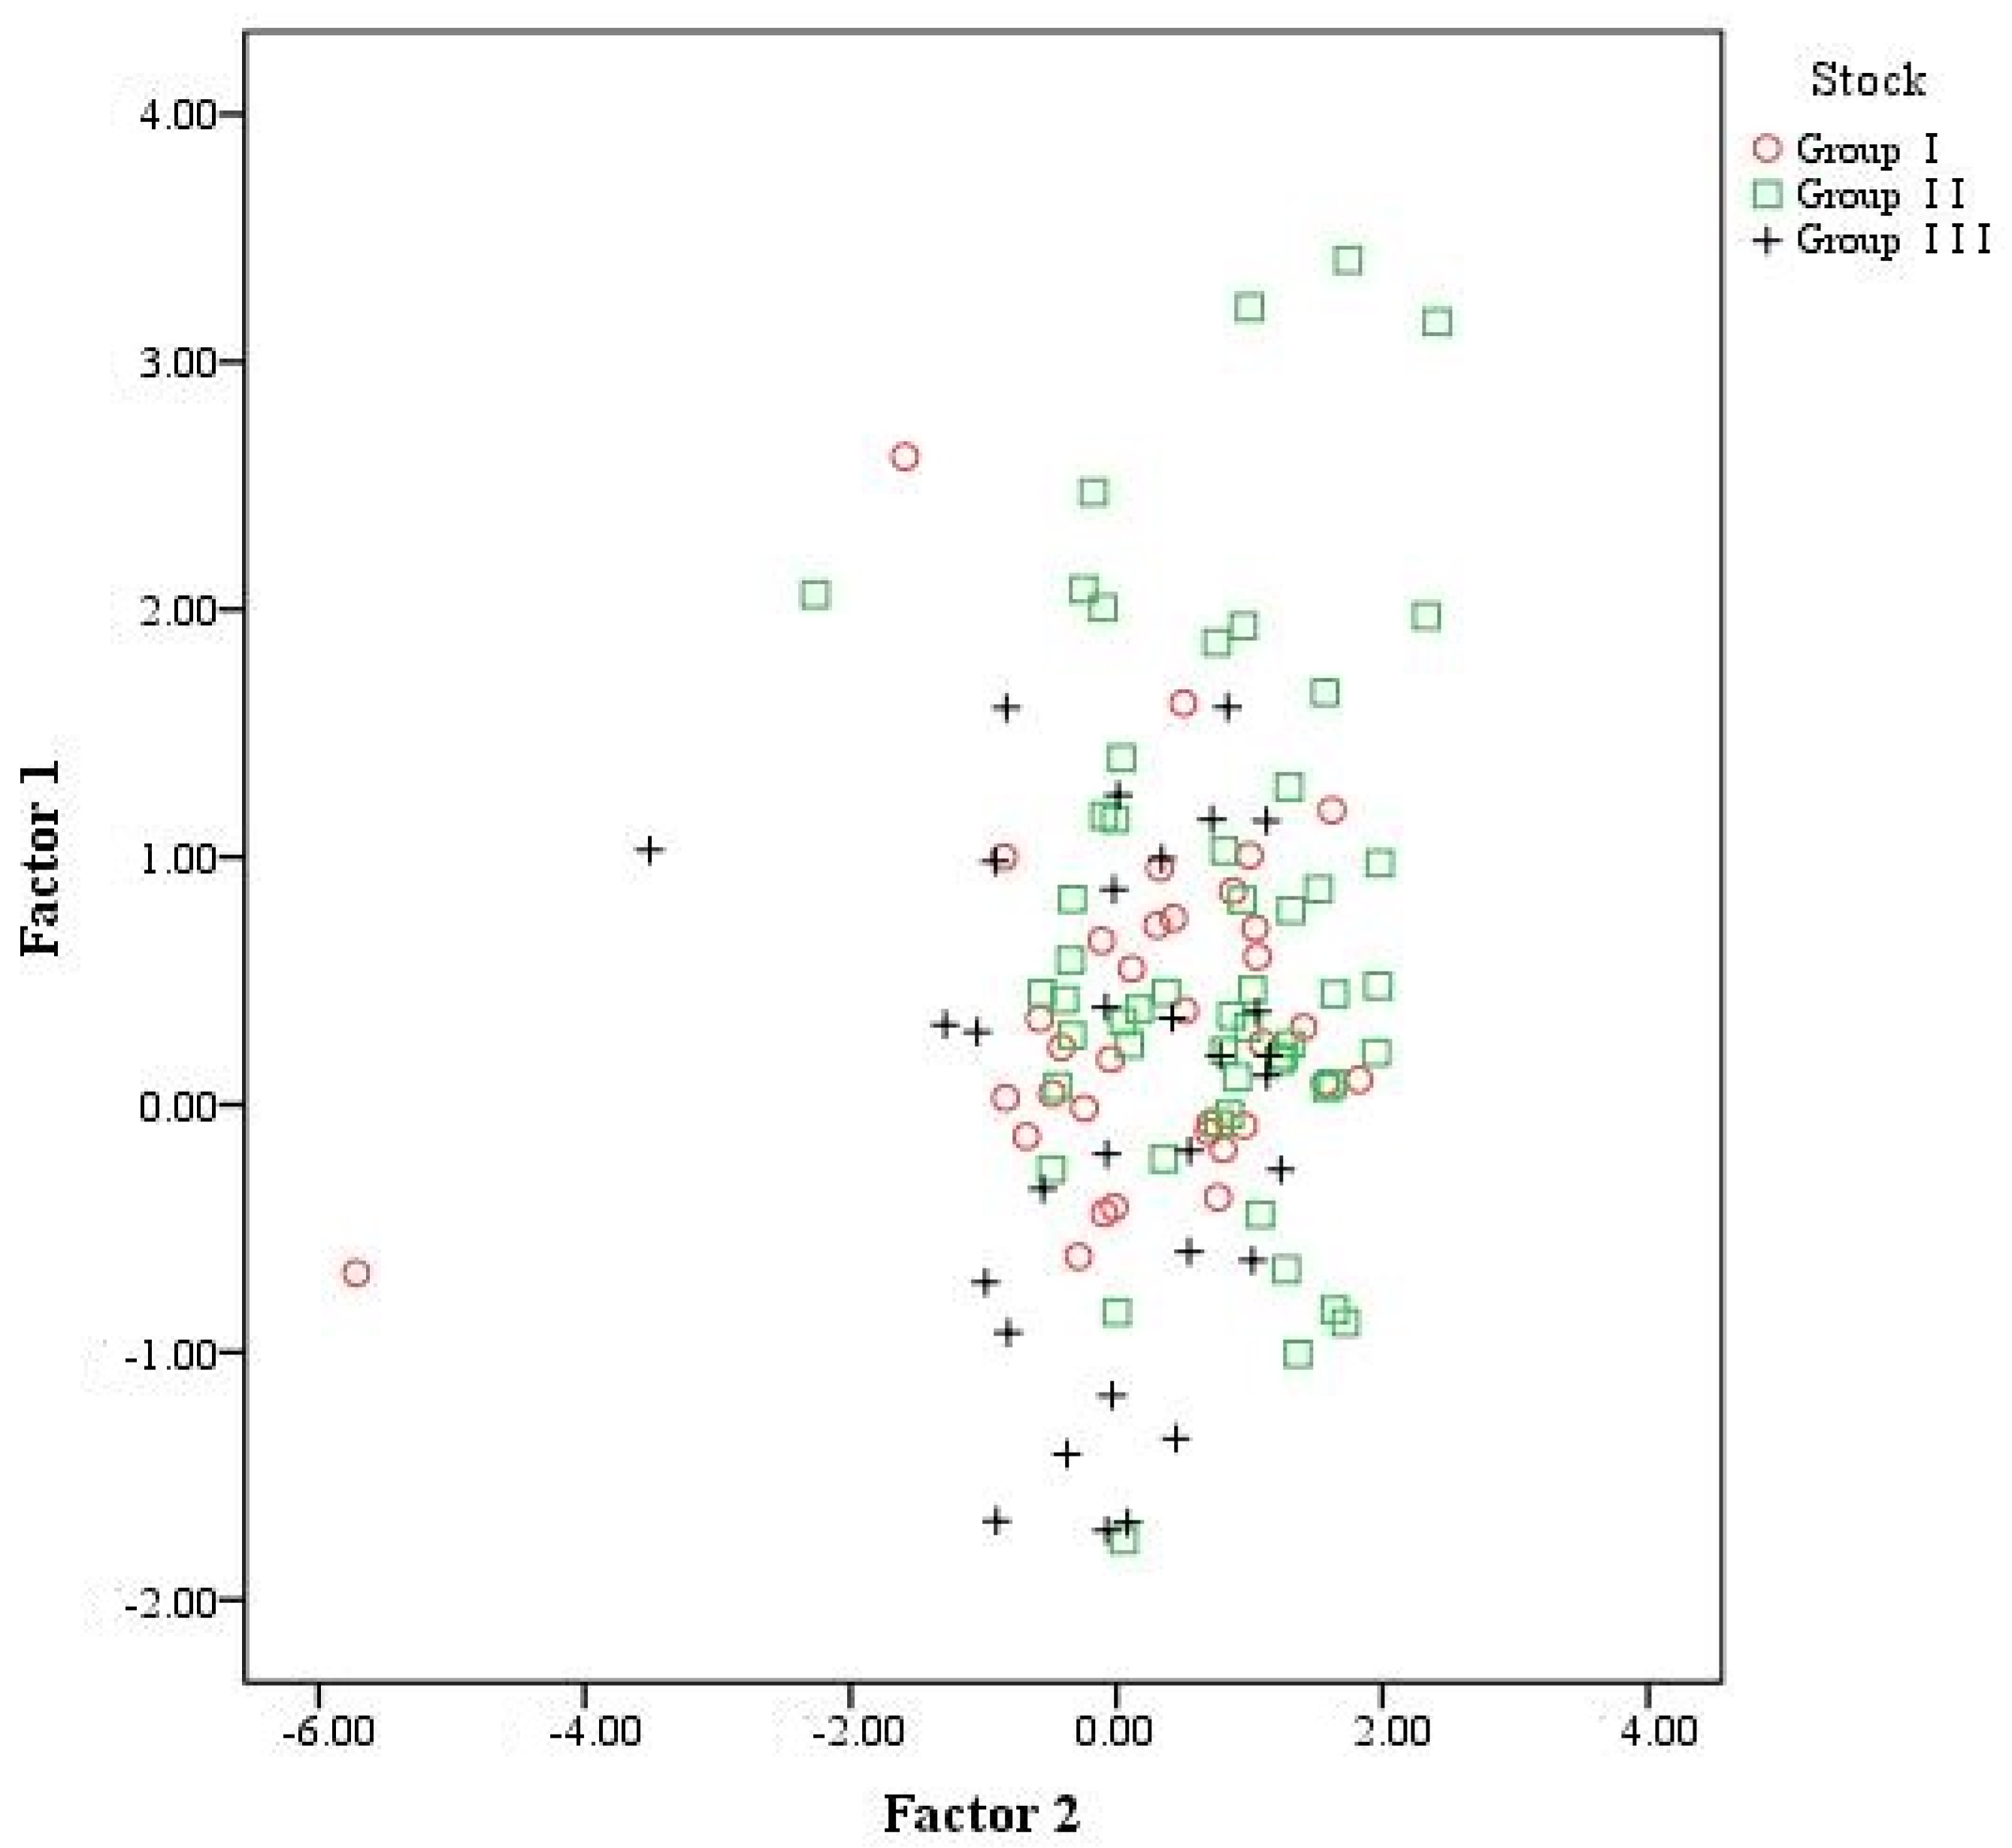
Principal Components Analysis
Discriminant Analysis
3.1.2. Fourier Coefficients and Wavelet Coefficients Analysis
ANOVA
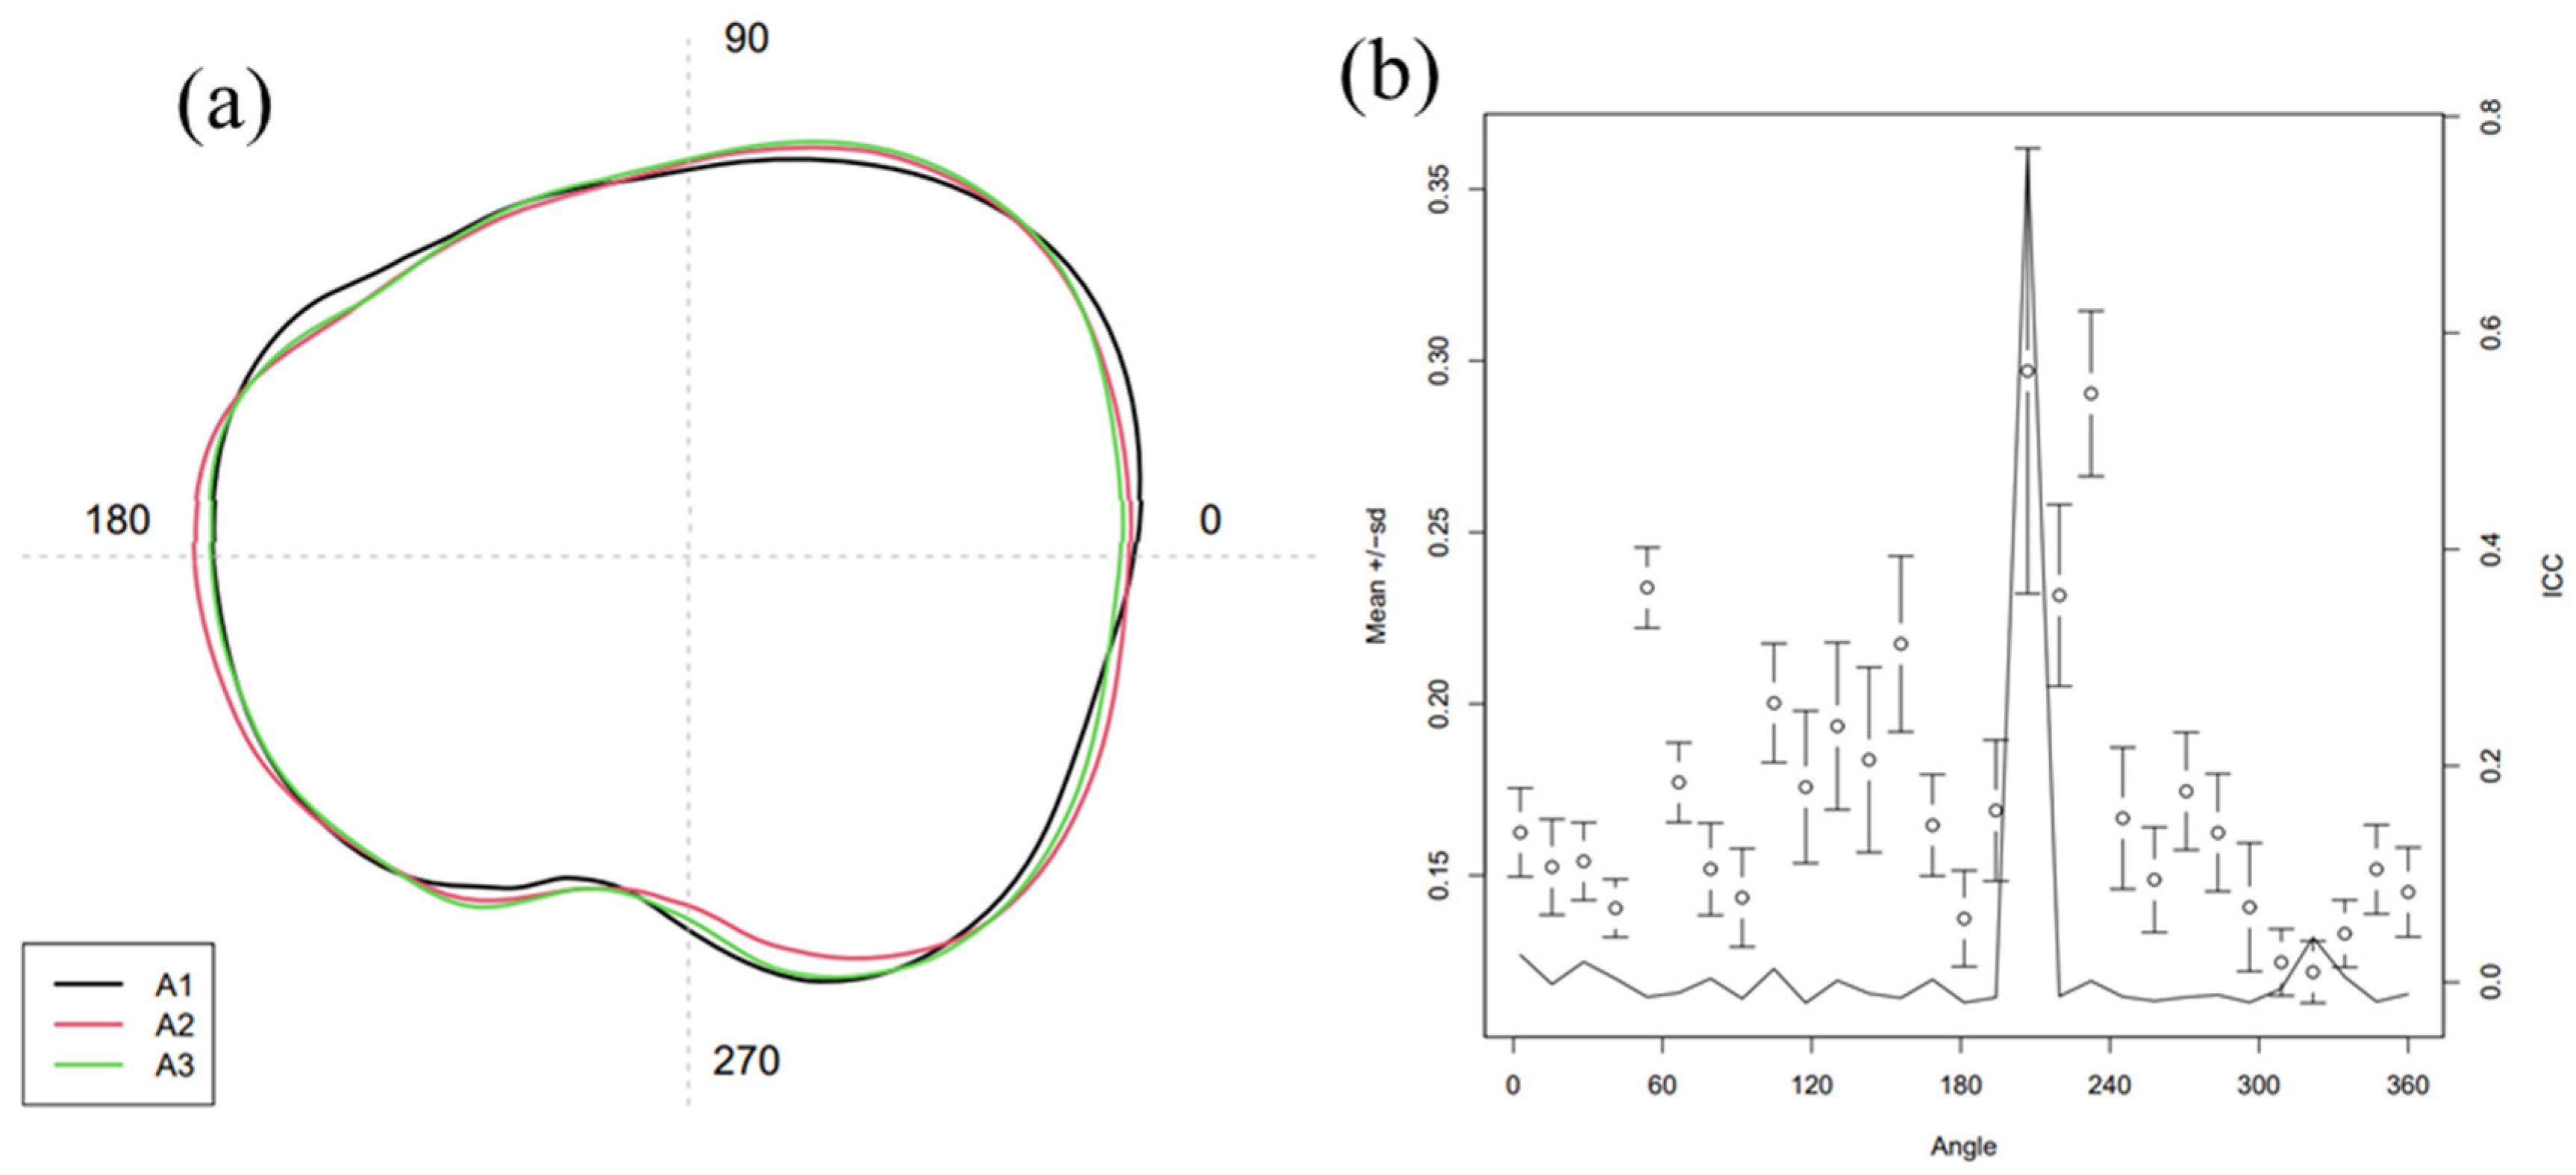
Mean Otolith Shape
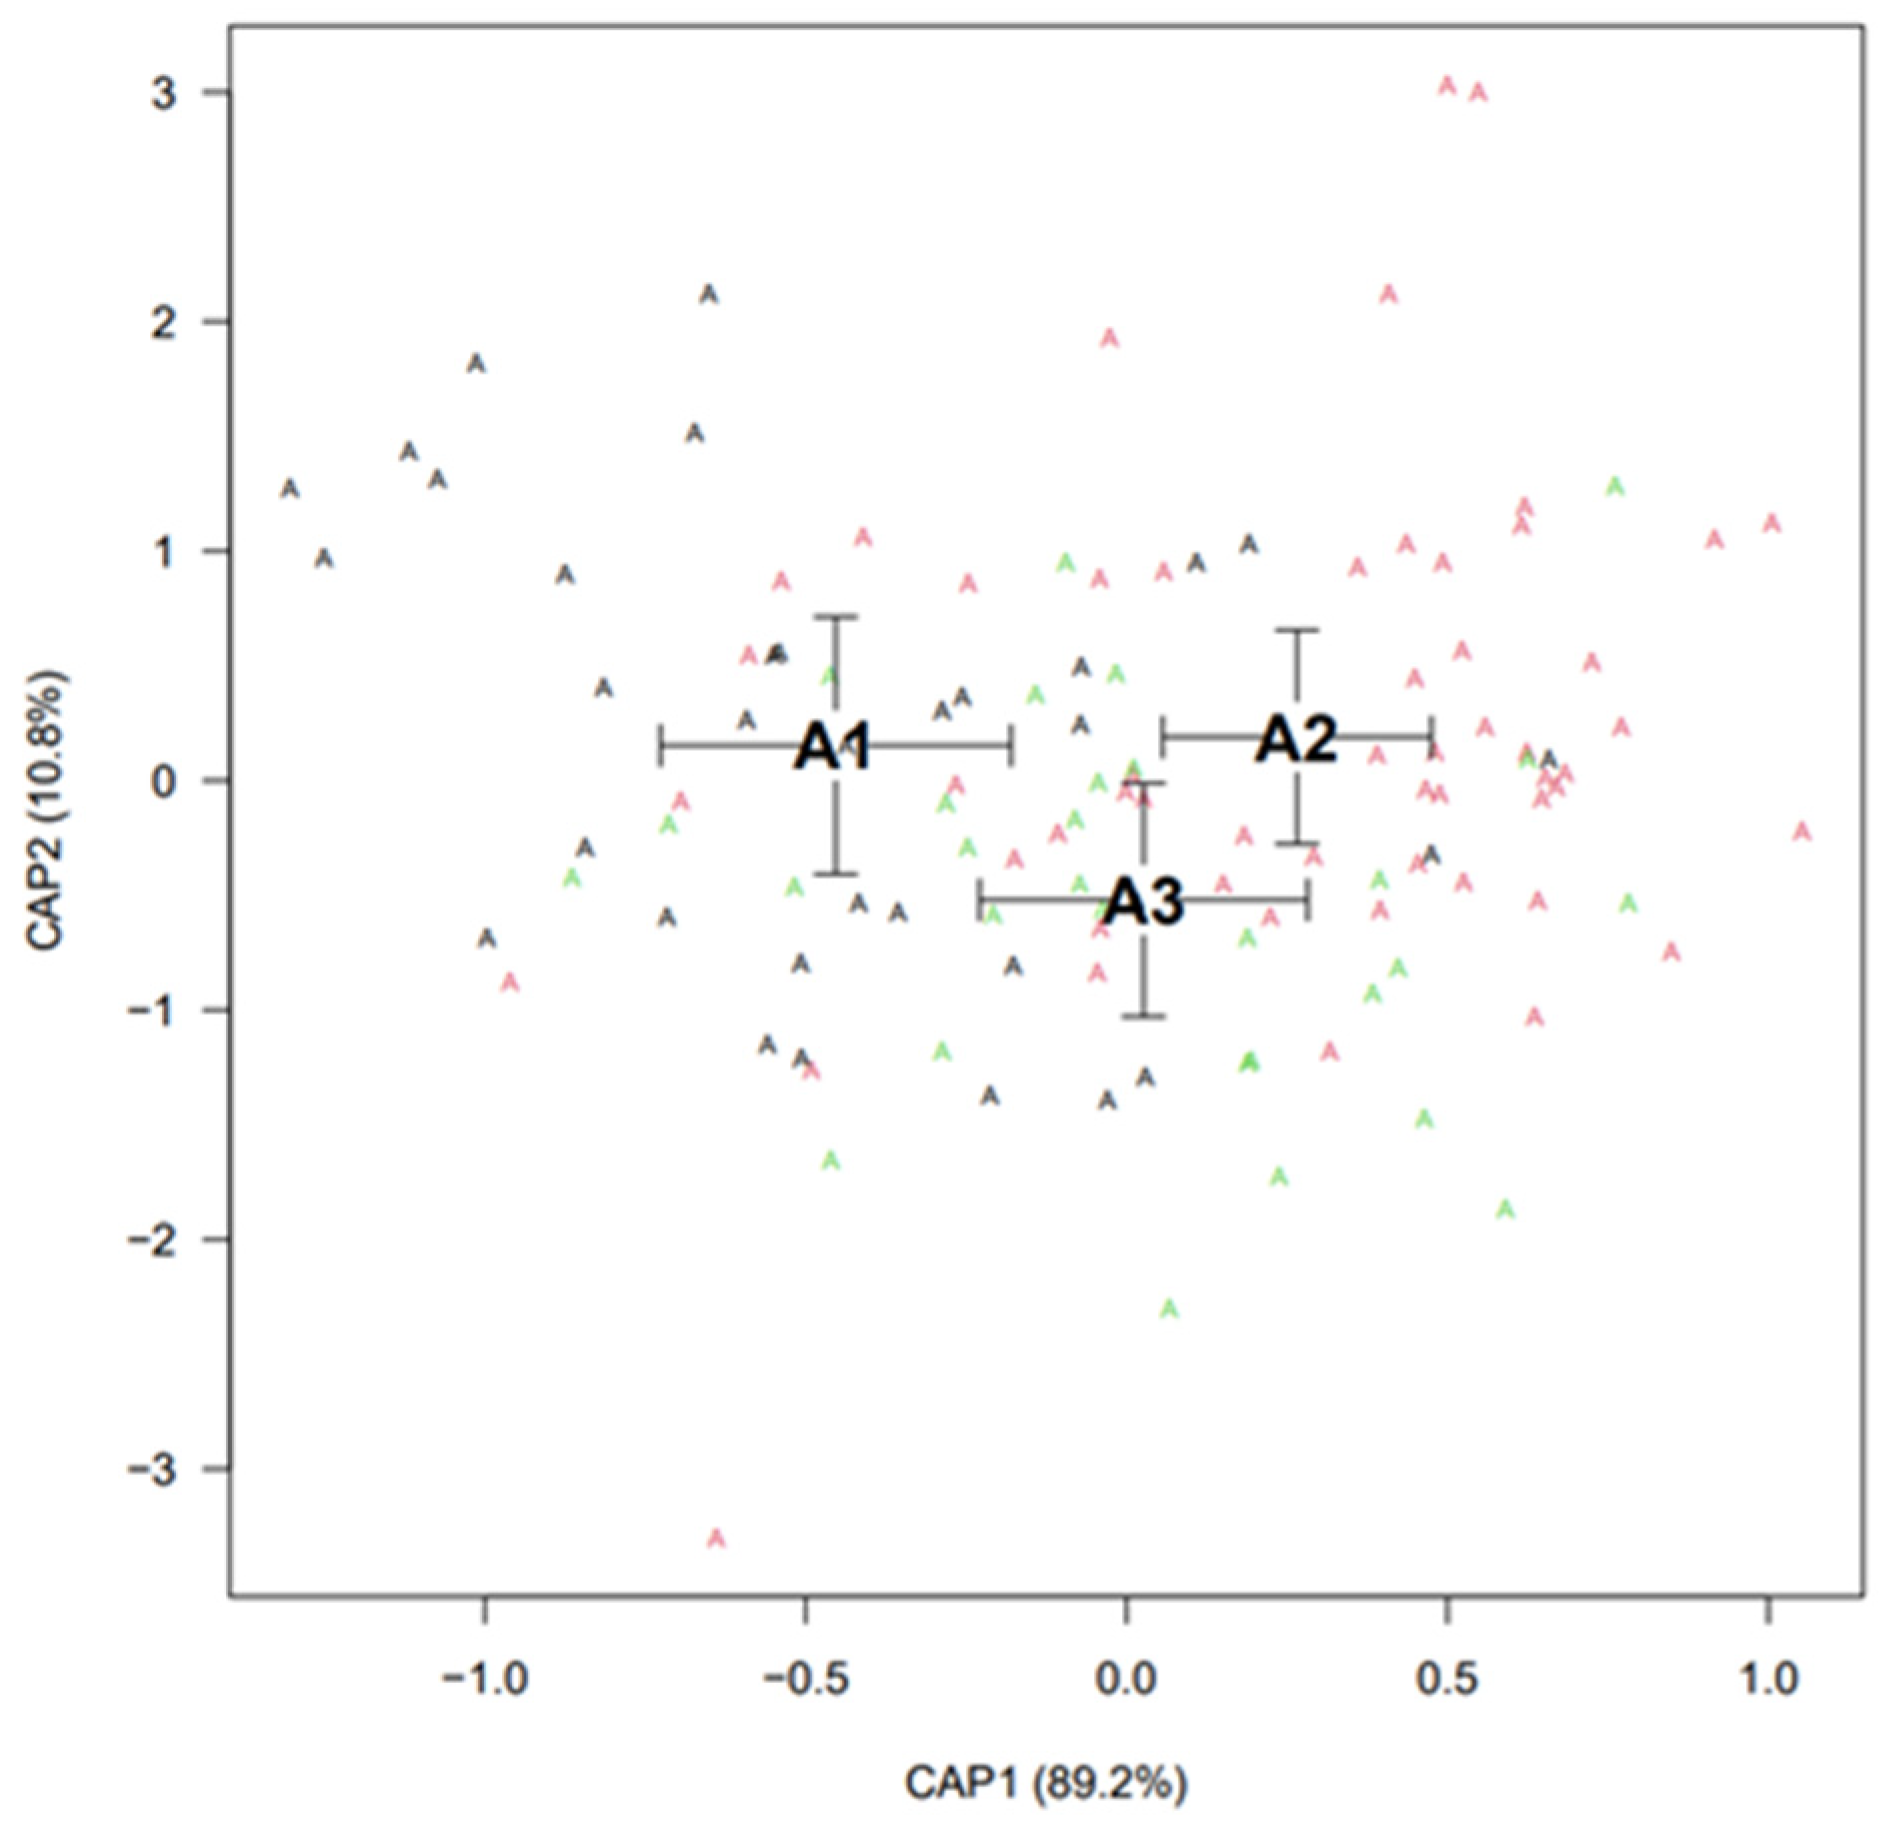
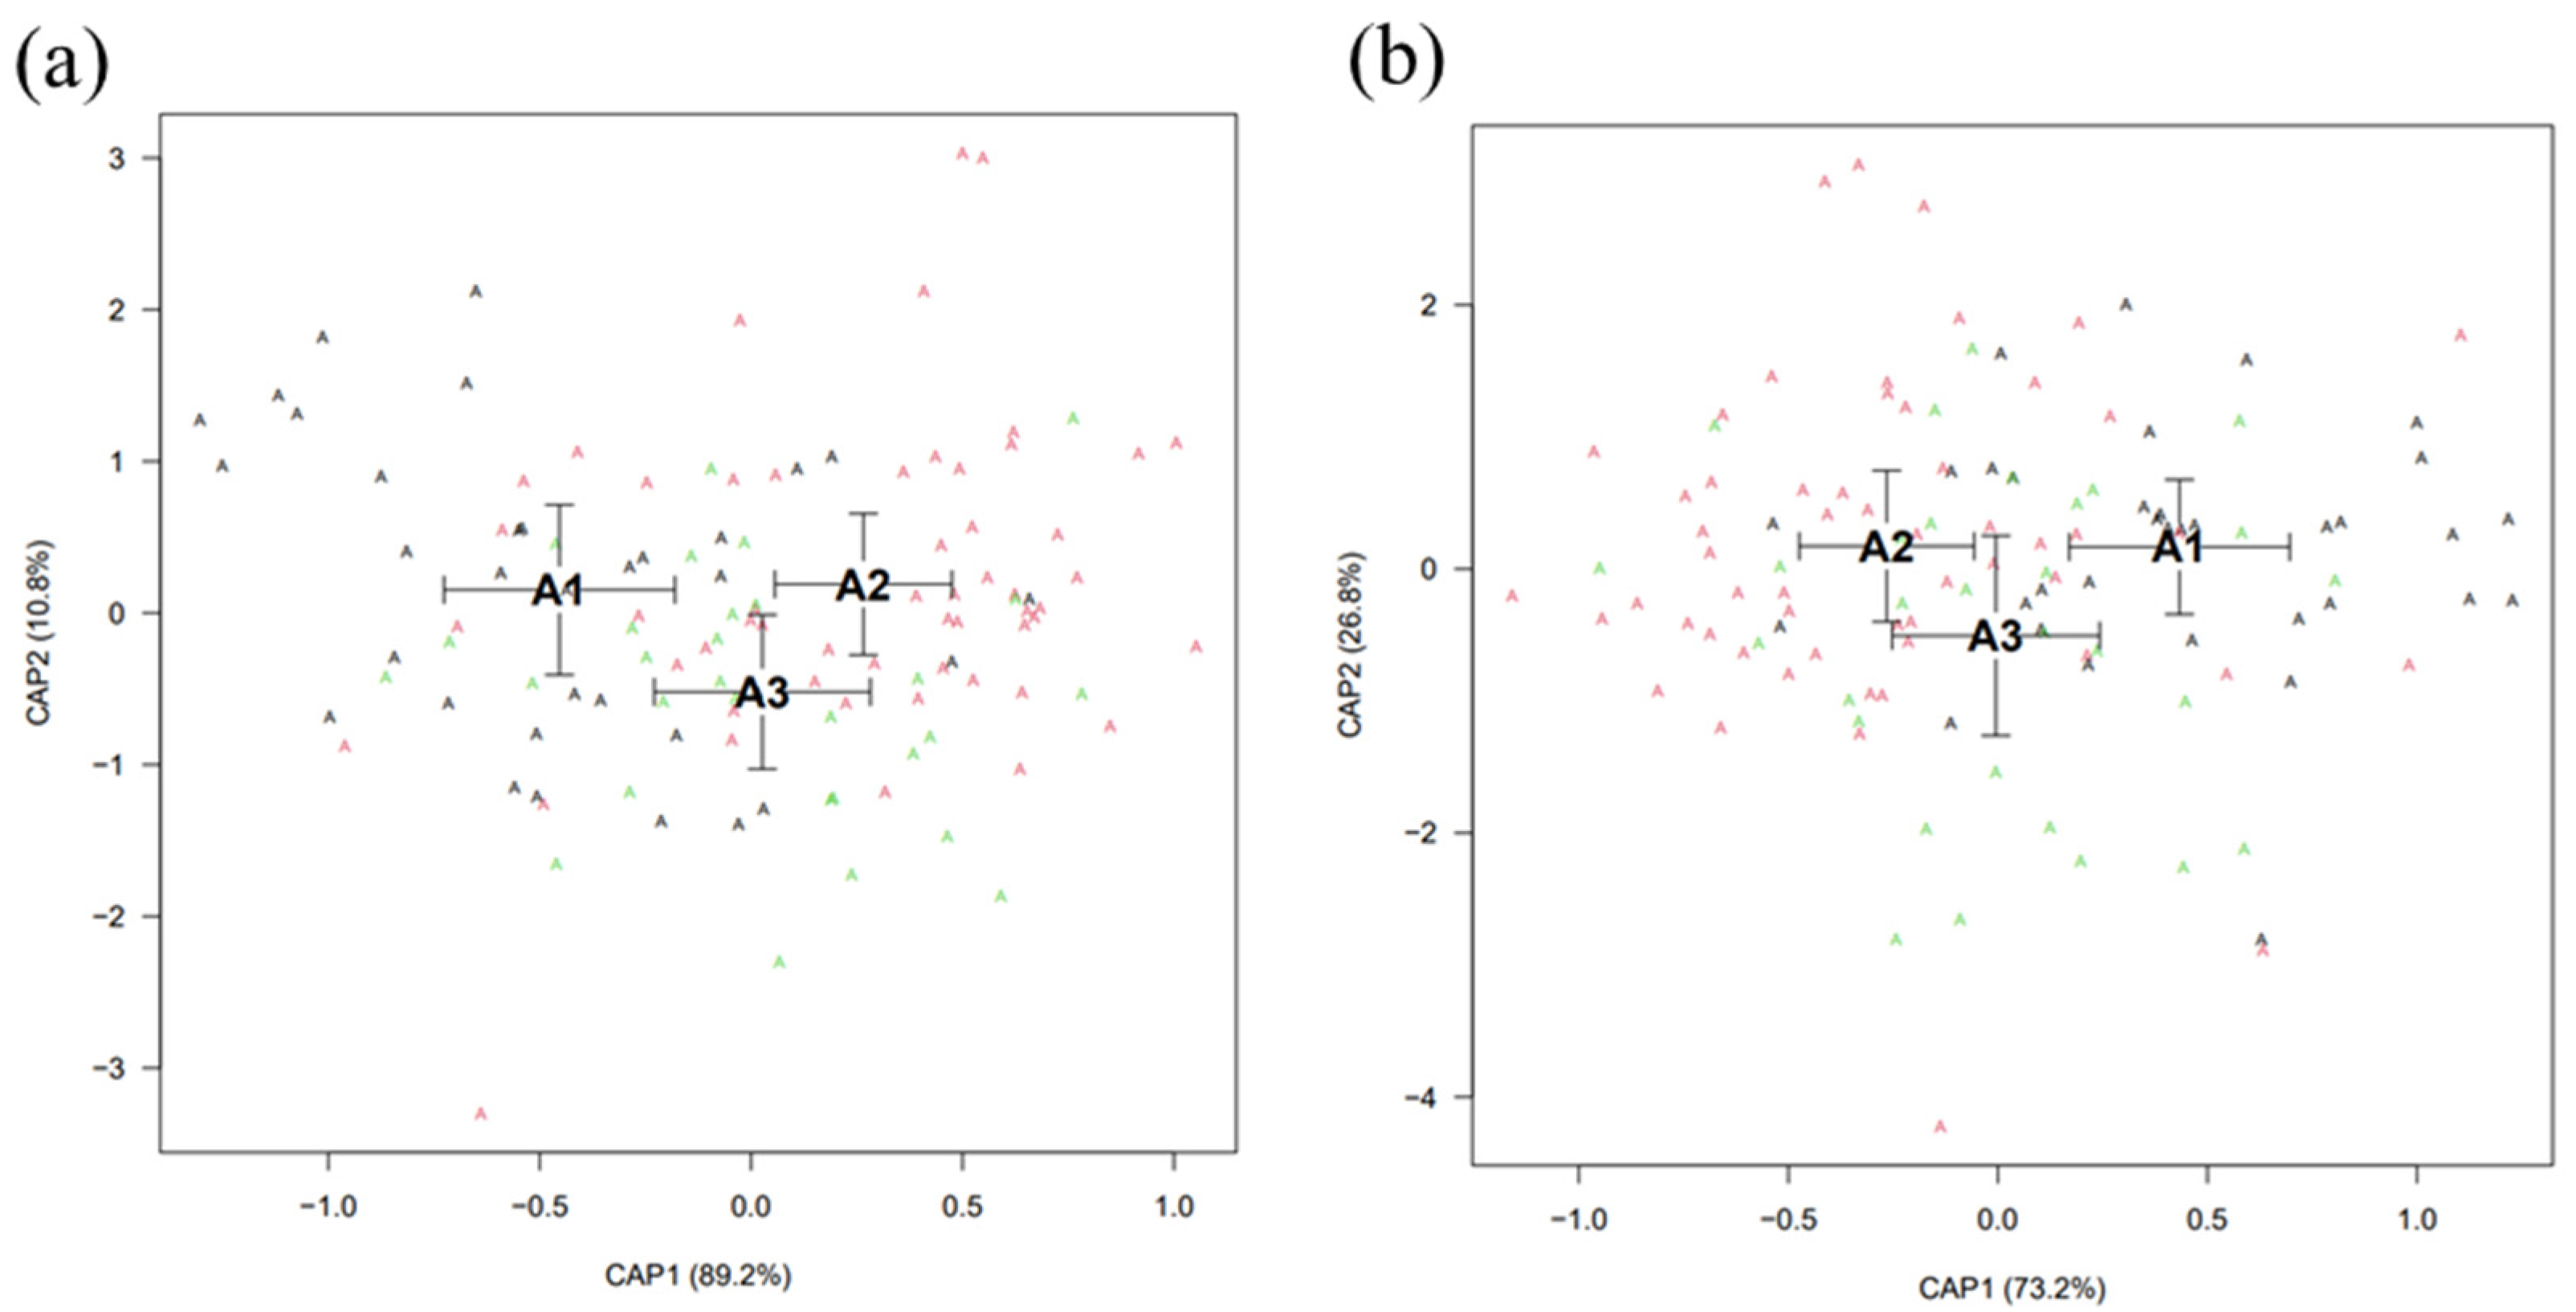
Canonical Analysis of Principal Coordinates
4. Discussion
5. Conclusions
Supplementary Materials
Author Contributions
Funding
Institutional Review Board Statement
Data Availability Statement
Acknowledgments
Conflicts of Interest
References
- Platt, C. Hair cell distribution and orientation in goldfish otolith organs. J. Comp. Neurol. 1977, 172, 283–297. [Google Scholar] [CrossRef] [PubMed]
- Lucille, C.; Collin, S.P. The auditory system of cartilaginous fishes. Rev. Fish Biol. Fish. 2022, 32, 521–554. [Google Scholar]
- Campana, S. Interactive effects of age and environmental modifiers on the production of daily growth increments in otoliths of plainfin midshipman, Porichthys notatus. Fish. Bull. 1984, 82, 165–177. [Google Scholar]
- Campana, S.; Neilson, J. Microstructure of Fish Otoliths. Can. J. Fish. Aquat. Sci. 1985, 42, 1014–1032. [Google Scholar] [CrossRef]
- Tzeng, W.-N.; Yu, S.-Y. Effects of starvation on the formation of daily growth increments in the otoliths of milkfish, Chanos chanos (Forsskal), larvae. J. Fish Biol. 1992, 40, 39–48. [Google Scholar] [CrossRef]
- De Carvalho, B.M.; Volpedo, A.V.; Albuquerque, C.Q.; Fávaro, L.F. First record of anomalous otoliths of Menticirrhus americanus. J. Appl. Ichthyol. 2019, 6, 1286–1291. [Google Scholar] [CrossRef]
- Manizadeh, N.; Teimori, A.; Hesni, M.A.; Motamedi, M. Abnormal otoliths in the marine fishes collected from the Persian Gulf and the Gulf of Oman. Acta Ichthyol. Et Piscat. 2018, 48, 143–151. [Google Scholar] [CrossRef]
- Yedier, S.; Bostanci, D. Intra- and interspecific discrimination of Scorpaena species from the Aegean, Black, Mediterranean and Marmara seas. Sci. Mar. 2021, 85, 197–209. [Google Scholar] [CrossRef]
- Batubara, A.S.; Muchlisin, Z.A.; Efizon, D.; Elvyra, R.; Fadli, N.; Irham, M. Morphometric variations of the Genus Barbonymus (Pisces, Cyprinidae) harvested from Aceh Waters, Indonesia. Fish. Aquat. Life 2018, 26, 231–237. [Google Scholar] [CrossRef]
- Kristjánsson, B.K.; Leblanc, C.A.-L.; Skúlason, S.; Snorrason, S.S.; Noakes, D.L. Phenotypic plasticity in the morphology of small benthic Icelandic Arctic charr (Salvelinus alpinus). Ecol. Freshw. Fish 2017, 27, 636–645. [Google Scholar] [CrossRef]
- Bano, F.; Serajuddin, M. Sulcus and outline morphometrics of sagittal otolith variability in freshwater fragmented populations of dwarf gourami, Trichogaster lalia (Hamilton, 1822). Limnologica 2020, 86, 125842. [Google Scholar] [CrossRef]
- Junjie, S. Otolith and Sulcus Morphology Analyses and Their Applications in Stock Discrimination of Three Sciaenids; University of Chinese Academy of Sciences: Bejing, China, 2018. [Google Scholar]
- Kriwet, J.; Hecht, T. A review of early gadiform evolution and diversification: First record of a rattail fish skull (Gadiformes, Macrouridae) from the Eocene of Antarctica, with otoliths preserved in situ. Naturwissenschaften 2008, 10, 899–907. [Google Scholar] [CrossRef]
- A Begg, G.; Waldman, J.R. An holistic approach to fish stock identification. Fish. Res. 1999, 43, 35–44. [Google Scholar] [CrossRef]
- Hilborn, R.; Walters, C.J. Quantitative Fisheries Stock Assessment: Choice, Dynamics and Uncertainty; Chapman and Hall: New York, NY, USA, 1992. [Google Scholar]
- Bolles, K.L.; Begg, G.A. Distinction between silver hake (Merluccius bilinearis) stocks in US waters of the northwest Atlantic based on whole otolith morphometrics. Fish Bull. 2000, 98, 451–462. [Google Scholar]
- Tuset, V.M.; Lozano, I.J.; González, J.A.; Pertusa, J.F.; García-Díaz, M.M. Shape indices to identify regional differences in otolith morphology of comber, Serranus cabrilla (L., 1758). J. Appl. Ichthyol. 2003, 19, 88–93. [Google Scholar] [CrossRef]
- Gallardo-Cabello, M.; Espino-Barr, E.; Cabral-Solís, E.G.; Puente-Gómez, M.; Garcia-Boa, A. Morphometric analysis on sagitta, asteriscus and lapillus of Shortnose Mojarra Diapterus brevirostris (Teleostei: Gerreidae) in Cuyutlan coastal Lagoon, Colima, Mexico. Rev. De Biol. Mar. Y Oceanogr. 2014, 49, 209–223. [Google Scholar] [CrossRef]
- Avigliano, E.; Velasco, G.; Volpedo, A.V. Use of lapillus otolith microchemistry as an indicator of the habitat of Genidens barbus from different estuarine environments in the southwestern Atlantic Ocean. Environ. Biol. Fishes 2015, 98, 1623–1632. [Google Scholar] [CrossRef]
- Bird, J.L.; Eppler, D.T.; Checkley, D.M., Jr. Comparisons of herring otoliths using Fourier series shape analysis. Can. J. Fish. Aquat. Sci. 1986, 43, 1228–1234. [Google Scholar] [CrossRef]
- Parisi-Baradad, V.; Lombarte, A.; Garcia-Ladona, E.; Cabestany, J.; Piera, J.; Chic, O. Otolith shape contour analysis using affine transformation invariant wavelet transforms and curvature scale space representation. Mar. Freshw. Res. 2005, 56, 795. [Google Scholar] [CrossRef]
- Tracey, S.R.; Lyle, J.M.; Duhamel, G. Application of elliptical Fourier analysis of otolith form as a tool for stock identification. Fish. Res. 2006, 77, 138–147. [Google Scholar] [CrossRef]
- Libungan, L.A.; Pálsson, S. ShapeR: An R Package to Study Otolith Shape Variation among Fish Populations. PLoS ONE 2015, 10, e0121102. [Google Scholar] [CrossRef] [PubMed]
- Zhao, H.; Chen, Y.; Hu, S.; Xiao, Y.; Zhu, B. Comparative Study on the Skeletal System of Schizothorax kozlovi and Schizothorax grahami. J. Anhui Agric. Sci. 2011, 39, 13848–13853+13873. [Google Scholar]
- Lv, W.; Daxiong, J.; Zhong, G.Z. Guizhou Fish History; Guizhou People’s Publishing House: Guiyang, China, 1989; pp. 189–190. [Google Scholar]
- Mingcheng, Y. Fish Ecology; China Agricultural Publishing House: Bejing, China, 1995; pp. 105–130. [Google Scholar]
- Mu, R.; Hongtai, W.; Qiyun, Y.; Xingwang, F.; Xi, H.; Enzhu, T.; Caijun, D. Captive breeding of Schizothorax prenanti. Freshw. Fish. 2001, 31, 3–5. [Google Scholar]
- Lijing, Z.; Huixiang, Z. Research Progress on Artificial Rearing Techniques of Schizothorax grahami. J. Domest. Anim. Ecol. 2013, 34, 81–84. [Google Scholar]
- Mei, Y. Study on Embryo Development and Early AntioxidantAbility of Schizothorax graham; Gui Zhou University: Guiyang, China, 2020. [Google Scholar]
- Yan, P.; Zeng, Y.; Zhang, C.; Gong, J.; Zhou, X. Otolith morphology of Saurogobio dabryi and the variance in different sections of Jialing River. J. Fish. China 2018, 42, 1896–1905. [Google Scholar]
- Qiao, J.; Ren, Z.; Chen, K.; Zhang, D.; Yan, Y.; He, D. Comparative Otolith Morphology of Two Morphs of Schizopygopsis thermalis Herzenstein 1891 (Pisces, Cyprinidae) in a Headwater Lake on the Qinghai-Tibet Plateau. Fishes 2022, 7, 99. [Google Scholar] [CrossRef]
- Mille, T.; Mahe, K.; Villanueva, M.C.; De Pontual, H.; Ernande, B. Sagittal otolith morphogenesis asymmetry in marine fishes. J. Fish Biol. 2015, 87, 646–663. [Google Scholar] [CrossRef]
- Crampton, J.S. Elliptic Fourier shape analysis of fossil bivalves: Some practical considerations. Lethaia 1995, 28, 179–186. [Google Scholar] [CrossRef]
- Mallat, S.G. A theory for multiresolution signal decomposition: The wavelet representation. IEEE Trans. Pattern Anal. Mach. Intell. 1989, 11, 674–693. [Google Scholar] [CrossRef]
- Libungan, L.A.; Slotte, A.; Otis, E.O.; Pálsson, S. Otolith variation in Pacific herring (Clupea pallasii) reflects mitogenomic variation rather than the subspecies classification. Polar Biol. 2016, 39, 1571–1579. [Google Scholar] [CrossRef]
- Ponton, D. Is geometric morphometrics efficient for comparing otolith shape of different fish species? Is geometric morphometrics efficient for comparing otolith shape of different fish species? J. Morphol. 2006, 276, 750–757. [Google Scholar] [CrossRef]
- Xiaozhe, P. Otolith Morphological Study and Analysis of the Mitochondrial Genome of Chinese and Japanese Dotted Gizzard Shad (Konosirus punctatus); Ocean University of China: Qingdao, China, 2012. [Google Scholar]
- Chao, S.; Qing, Y.; Feng, Z.; Tao, Z.; Lijuan, H.; Ping, Z. Otolith morphological variations among four geographic populations of Coilia mysyus in the Yangtze Estuary and its adjacent waters. J. Fish. Sci. China 2020, 27, 1125–1135. [Google Scholar]
- Ferguson, G.J.; Ward, T.M.; Gillanders, B.M. Otolith shape and elemental composition: Complementary tools for stock discrimination of mulloway (Argyrosomus japonicus) in southern Australia. Fish. Res. 2011, 110, 75–83. [Google Scholar] [CrossRef]
- Stransky, C.; Murta, A.G.; Schlickeisen, J.; Zimmermann, C. Otolith shape analysis as a tool for stock separation of horse mackerel (Trachurus trachurus) in the Northeast Atlantic and Mediterranean. Fish. Res. 2008, 89, 159–166. [Google Scholar] [CrossRef]
- Lord, C.; Morat, F.; Lecomte-Finiger, R.; Keith, P. Otolith shape analysis for three Sicyopterus (Teleostei: Gobioidei: Sicydiinae) species from New Caledonia and Vanuatu. Environ. Biol. Fishes 2011, 93, 209–222. [Google Scholar] [CrossRef]
- Morales, C.J.C.; Barnuevo, K.D.E.; Delloro, E.S.; Cabebe-Barnuevo, R.A.; Calizo, J.K.S.; Lumayno, S.D.P.; Babaran, R.P. Otolith Morphometric and Shape Distinction of Three Redfin Species under the Genus Decapterus (Teleostei: Carangidae) from Sulu Sea, Philippines. Fishes 2023, 8, 95. [Google Scholar] [CrossRef]
- Muñoz-Lechuga, R.; Sow, F.N.; Constance, D.N.; Angueko, D.; Macías, D.; Massa-Gallucci, A.; da Silva, G.B.; Gonçalves, J.M.S.; Lino, P.G. Differentiation of Spatial Units of Genus Euthynnus from the Eastern Atlantic and the Mediterranean Using Otolith Shape Analysis. Fishes 2023, 8, 317. [Google Scholar] [CrossRef]
- Barnuevo, K.D.E.; Morales, C.J.C.; Calizo, J.K.S.; Delloro, E.S.; Añasco, C.P.; Babaran, R.P.; Lumayno, S.D.P. Distinct Stocks of the Redtail Scad Decapterus kurroides Bleeker, 1855 (Perciformes: Carangidae) from the Northern Sulu and Southern Sibuyan Seas, Philippines Revealed from Otolith Morphometry and Shape Analysis. Fishes 2022, 8, 12. [Google Scholar] [CrossRef]


| Stock | Sampling Sites Number | Number | Total Length Ranges (mm) | Weight (g) |
|---|---|---|---|---|
| Upper reaches (Group I) | a | 34 | 135–212 | 39.8–339.4 |
| Middle reaches (Group II) | b–h | 55 | 82–247 | 11.6–383.6 |
| Lower reaches (Group III) | i–j | 30 | 113–238 | 23.2–328.5 |
| Total | 119 | |||
| Otolith Shape Indices | Principal Components | |
|---|---|---|
| 1 | 2 | |
| Roundness | 0.643 | −0.102 |
| Format factor | −0.834 | 0.385 |
| Circularity | 0.827 | −0.409 |
| Rectangularity | −0.467 | 0.610 |
| Ellipticity | 0.895 | 0.433 |
| Radius ratio | 0.936 | 0.061 |
| Feret ratio | 0.926 | 0.190 |
| Aspect ratio | 0.892 | 0.436 |
| Eigenvalue | 5.341 | 1.115 |
| Variance explained | 66.757 | 13.939 |
| Cumulative percentage | 66.757 | 80.696 |
| Shape Index | Stock | ||
|---|---|---|---|
| Group I | Group II | Group III | |
| Roundness | 2.66 | 2.64 | 2.66 |
| Format factor | 37,625.67 | 37,642.49 | 37,640.32 |
| Circularity | 651,841.13 | 652,165.72 | 652,118.05 |
| Rectangularity | 24,936.85 | 24,963.96 | 24,958.10 |
| Ellipticity | 83,462.43 | 83,347.47 | 83,343.42 |
| Radius ratio | 3296.84 | 3308.25 | 3307.26 |
| Feret ratio | 48,436.41 | 48,503.07 | 48,472.72 |
| Aspect ratio | −47,034.44 | −47,014.86 | −47,017.81 |
| Constant | −569,600.38 | −570,250.93 | −570,133.50 |
| Stock | Number | Accuracy % | Predicted Result | ||
|---|---|---|---|---|---|
| 1 | 2 | 3 | |||
| Group I | 34 | 61.8 | 21 | 6 | 7 |
| Group II | 55 | 67.3 | 6 | 37 | 12 |
| Group III | 30 | 43.3 | 12 | 5 | 13 |
Disclaimer/Publisher’s Note: The statements, opinions and data contained in all publications are solely those of the individual author(s) and contributor(s) and not of MDPI and/or the editor(s). MDPI and/or the editor(s) disclaim responsibility for any injury to people or property resulting from any ideas, methods, instructions or products referred to in the content. |
© 2023 by the authors. Licensee MDPI, Basel, Switzerland. This article is an open access article distributed under the terms and conditions of the Creative Commons Attribution (CC BY) license (https://creativecommons.org/licenses/by/4.0/).
Share and Cite
Zhou, Y.; Xu, L.; He, Z.; Cui, W.; Lu, Q.; Qin, J.; Su, S.; He, T. Discrimination of Schizothorax grahami (Regan, 1904) Stocks Based on Otolith Morphology. Fishes 2023, 8, 504. https://doi.org/10.3390/fishes8100504
Zhou Y, Xu L, He Z, Cui W, Lu Q, Qin J, Su S, He T. Discrimination of Schizothorax grahami (Regan, 1904) Stocks Based on Otolith Morphology. Fishes. 2023; 8(10):504. https://doi.org/10.3390/fishes8100504
Chicago/Turabian StyleZhou, Yang, Li Xu, Zhongtang He, Weijie Cui, Qun Lu, Jianguang Qin, Shengqi Su, and Tao He. 2023. "Discrimination of Schizothorax grahami (Regan, 1904) Stocks Based on Otolith Morphology" Fishes 8, no. 10: 504. https://doi.org/10.3390/fishes8100504
APA StyleZhou, Y., Xu, L., He, Z., Cui, W., Lu, Q., Qin, J., Su, S., & He, T. (2023). Discrimination of Schizothorax grahami (Regan, 1904) Stocks Based on Otolith Morphology. Fishes, 8(10), 504. https://doi.org/10.3390/fishes8100504