Article

Nutritional Profiling of Wild (Pangasius pangasius) and Farmed (Pangasius hypophthalmus) Pangasius Catfish with Implications to Human Health

by
Suprakash Chakma
1,†,
Md. Arifur Rahman
2,†,
Muhammad A. B. Siddik
2,*,
Md. Sazedul Hoque
1,
SM Majharul Islam
3 and
Ioannis N. Vatsos
3,*
1
Department of Fisheries Technology, Patuakhali Science and Technology University, Patuakhali 8602, Bangladesh
2
Department of Fisheries Biology and Genetics, Patuakhali Science and Technology University, Patuakhali 8602, Bangladesh
3
Faculty of Biosciences and Aquaculture, Nord University, 8026 Bodø, Norway
*
Authors to whom correspondence should be addressed.
These authors contributed equally to this work.
Fishes 2022, 7(6), 309; https://doi.org/10.3390/fishes7060309
Submission received: 3 October 2022 / Revised: 20 October 2022 / Accepted: 25 October 2022 / Published: 27 October 2022
(This article belongs to the Section Processing and Comprehensive Utilization of Fishery Products)

Abstract

:
This study analyzed and compared the nutritional profiles of wild (Pangasius pangasius) and farmed (Pangasius hypophthalmus) pangasius catfish collected from the various sources of river and culture ponds in Bangladesh. The results indicated that the wild pangasius catfish had a significantly (p < 0.05) higher levels of moisture, fat and ash content, compared to the farmed one. However, the farmed pangasius had significantly higher level of protein and carbohydrate, compared to wild pangasius. The total EAA ratio was found to be significantly higher (p < 0.05) in wild pangasius (1.51 ± 0.01 g/100 g), compared to farmed pangasius (1.55 ± 0.01 g/100 g), which exceeded the FAO/WHO minimum standard of 40% for both species. In regard to fatty acid contents, wild pangasius was found to be rich in docosahexaenoic acid (DHA) and eicosapentaenoic acid (EPA) with a mean value of 4.89% and 2.72%, respectively, while the values in the farmed pangasius were 1.07% and 0 (not detected), respectively. A higher ω-3/ω-6 ratio was found in wild pangasius 14.26%, in comparison with farmed pangasius (0.14%). Overall, the results indicated that pangasius catfish either farmed or wild are suitable for human consumption wherein wild pangasius has superior amino acid and fatty acid quality, compared to the pangasius reared in captivity.

Graphical Abstract

1. Introduction

Bangladesh is one of the top-ranked (5th position in 2018) aquaculture-producing countries in the world, producing over 2.6 million tonnes in 2020 [1]. Farmed pangasius (Pangasius hypophthalmus) has become the single most important species in Bangladesh, which represents 18% of the total aquaculture production in the year of 2017–2018 [2]. This species has the significant role of fulfilling nutritional security, especially for the low-income people of Bangladesh [3]. The muscles of farmed pangasius have been reported to be shipped to over 80 countries around the world, including the Netherlands, Germany, and the United States, where frozen fillets without skin and bone are in high demand [4]. On the other hand, the wild pangasius (Pangasius pangasius), known as yellowtail catfish, is one of the most popular riverine catfish species of Bangladesh, which has huge demand locally due to its superior taste over farmed pangasius [5].
Fish is considered one of the best nutrient-rich animal-derived foods due to its high-quality protein, well-balanced amino acids, low in saturated fat and high in omega-3 fatty acids, essential micro and macro elements, and vitamins to support the good health of consumers [6]. Fish protein is rich in essential amino acids that are vital for a healthy organism because the human body cannot generate some of these molecules. Fish protein is easily digestible and its amino acids promote a myriad of health benefits, including tissue healing, homeostasis, regulation of several cellular processes, as precursors of hormones and nitrogenous bases and development of all ages of people [7,8]. In addition, fish fat is regarded as a rich source of long-chain polyunsaturated ω-3 fatty acids, viz., eicosapentaenoic acid (EPA) and docosahexaenoic acid (DHA). The consumption of these long-chain polyunsaturated ω-3 fatty acids (viz., EPA) and docosahexaenoic acids (DHA) can prevent the development of many diseases in humans, especially cardiovascular diseases [9], reducing the risk of heart arrhythmias, blood pressure, triglyceride concentrations, platelet aggregation [10], atherosclerosis, hypertension, hyperlipidemia, allergies, arthritis, autoimmune disorders, and even cancers [11,12,13].
The nutritional and biochemical composition of fish varies widely from species to species and within the same species. The key variables that can influence the chemical composition of fish include feeding habits, sex, and seasonal variations [14]. Thus, it is imperative to comprehend the composition of a particular fish to get the most out of it and to ensure the nutritional requirements of human. Azam [15] reported that biochemical testing is required to make sure the fish is nutrient-dense and the human health is benefited. Despite the good market demand, the high growth rate, the white flesh, and the relatively good taste of the wild pangasius [5,16], the nutritional profile of this species is still not well presented to the consumers. The nutritional profiling of wild pangasius could further attract traders, processors, industries, and policymakers to produce its fillet and to expand to local and global consumers. Although some studies have reported amino acids and fatty acids compositions of farmed P. hypophthalmus [17,18], there is no data concerning complete nutritional profiling and dietary requirements of wild pangasius from Bangladesh, except the preliminary work of Monalisa [19]. Apart from that, how the nutritional compositions of Pangasius spp. could be varied with its consequent impact on human health is also unknown. Thus, this study was aimed to investigate the amino acid and fatty acid profiles of wild pangasius for the first time and compared with the farmed pangasius to correlate these results with the associated nutritional indices for the potential impact on human health.

2. Materials and Methods

2.1. Ethical Statement

The experimental protocol and guidelines were maintained according to the Animal Welfare and Ethical Committee of Patuakhali Science and Technology University, Patuakhali, Bangladesh. The research and use of animals for the experiment have been authorized by the Ethical Committee (Approval No. PSTU-FoF/2019/04).

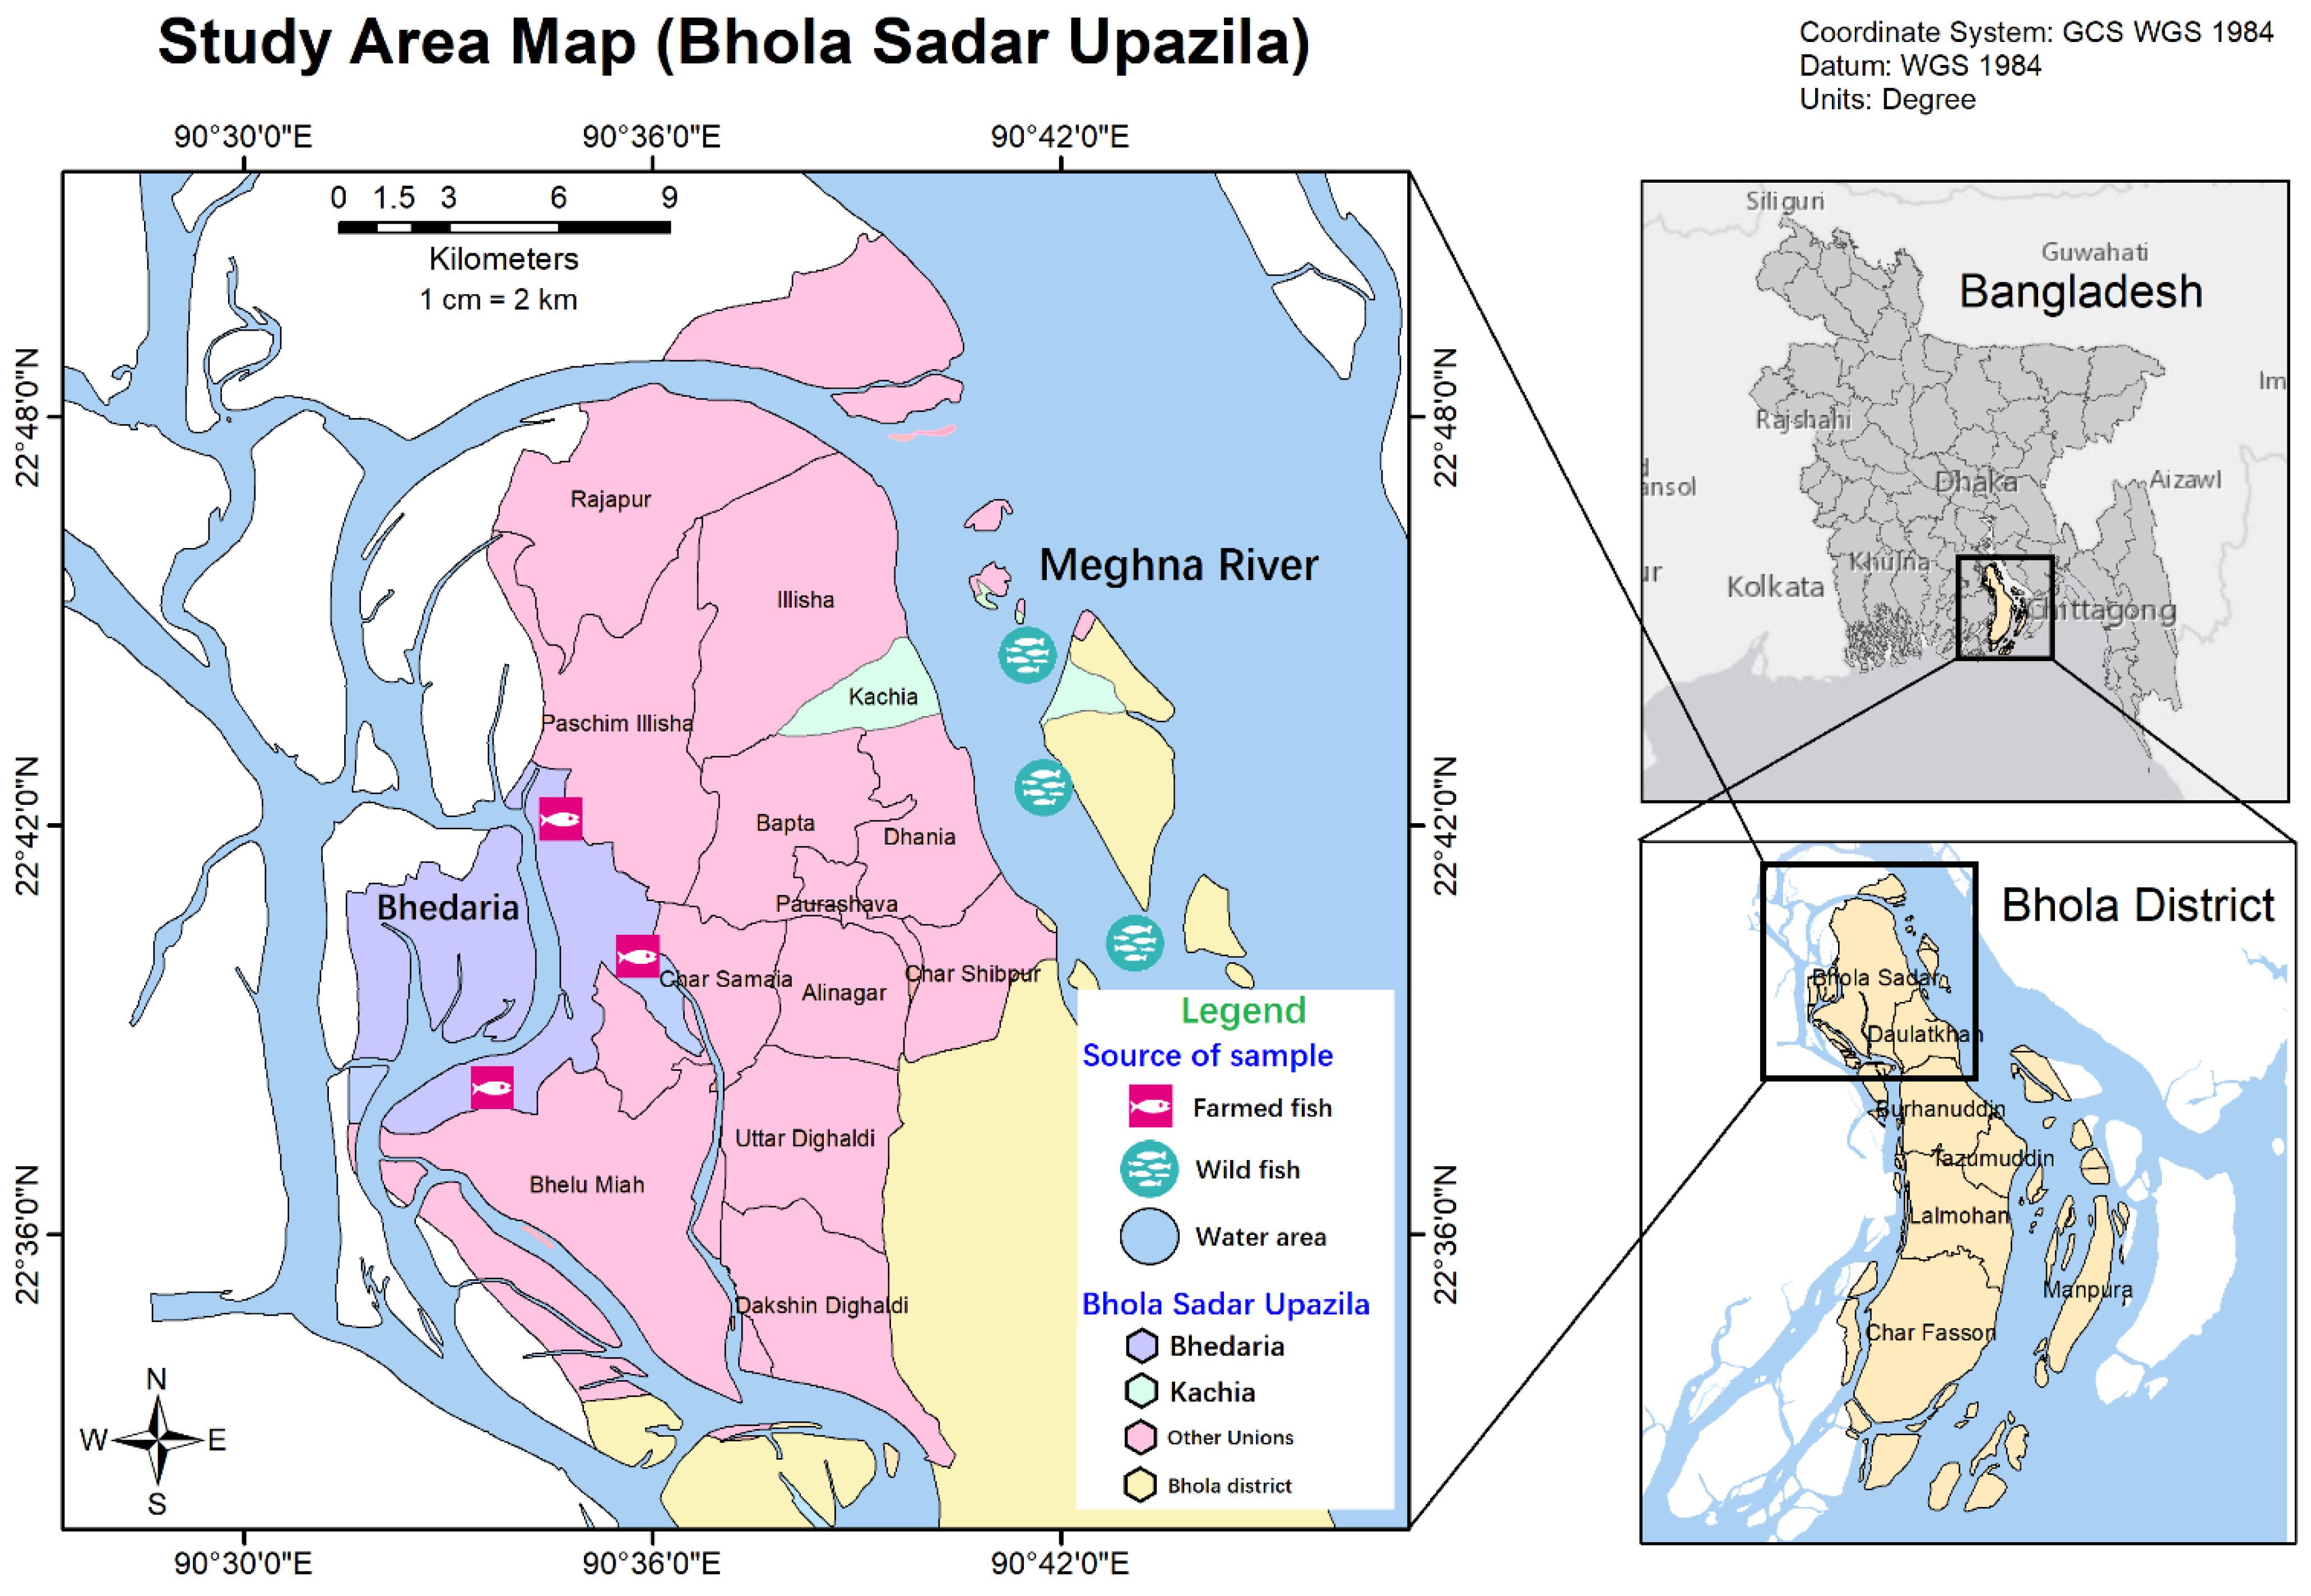
2.2. Collection of Fish and Sample

A total of 18 marketable-size wild and farmed pangasius catfish were collected from three different sampling sites of the Meghna River (3 species from each site) and from three different culture ponds (3 species from each pond) of Bhola, Bangladesh in September 2020 (Figure 1). Among the collected samples, three wild and three farmed fishes were chosen randomly for biochemical analysis, including proximate, amino acid and fatty acid composition. The sampling spots were selected on the basis of availability of wild pangasius catfish in this region. From the estuary to the freshwater, the Meghna River provides a reliable source of wild pangasius catfish.
The farmed pangasius catfish were raised using Mega feed (Spectra Hexa Feeds Ltd., Dhaka, Bangladesh), which contains 30% protein and 5% lipid fed at a rate of 4% of body weight three times a day. The marketable size for both of these species was utilized in this study. The wild pangasius considered for this study had a mean length (+SD) of 48.2 ± 0.7 cm, and a mean weight (+SD) of 1459.3 ± 74.8 g, while the farmed pangasius had a mean length (+SD) of 46.5 ± 5.8 cm, and mean weight (+SD) of 1572.3 ± 92.5 g. Collected fish samples were transported to the laboratory within 2–3 h in an insulated icebox maintaining 4 °C. On arrival at the laboratory, the samples for proximate composition and amino acids and fatty acids compositions from each individual were taken and stored in a freezer (JP Selecta, Abrera, Spain) at −20 °C.

2.3. Proximate Compositions

Proximate compositions of both wild and farmed pangasius muscle samples were analyzed following the standard methodology of the Association of Official Analytical Chemists [20]. For all the parameters, triplicate (n = 3) samples were used. Moisture content was determined using a hot air oven (HAS/50/TDIG/SS, Hot Air Oven, Genlab, Shrewsbury, UK) at 105 °C until a constant weight (g) was obtained. Ash content was determined by muffle furnace (HM-9MP, Raypa, Spain) at 550 °C for 20 h. Crude protein content was analyzed by using the Kjeldahl apparatus (Bloc Digest 12, JP Selecta, Abrera, Spain), where a 6.25 conversion factor was used to convert total nitrogen to crude protein. The fat content was measured by using the soxhlet apparatus (J-SH3, JISICO, Seoul, Korea). The following formula was used to determine the carbohydrate content using the method [21]: Carbohydrate = 100 − [Moisture + Ash + Crude protein + Crude fat].

2.4. Amino Acid Composition

The amino acid compositions of wild and farmed pangasius samples (n = 3) were determined following the methods described by Dimova [22] and Gheshlaghi [23], using the high-performance liquid chromatography (HPLC) with slight modifications. The samples were hydrolyzed for 22 h at 110 °C with 6 M HCl in sealed glass tubes filled with nitrogen. The amino acid samples were hydrolyzed, and the concentration of amino acids was diluted to 50 nM using 0.2 N sodium citrate buffers where the pH was 2.2. The solution obtained was kept in an evaporating dish to evaporate hydrochloric acid (HCl) in water. It was then filtered to 25 mL volumetric flask through Whatman No. 41 filter paper and volume with 0.1 N hydrochloric acid (HCl). The pH-adjusted samples were analyzed by a Biochrom 20 Automatic Amino Acid Analyzer (GE, USA). In addition, to determinate methionine content, performic oxidation and hydrolysis were used. The limits of detection of all the amino acids ranged from 0.004–1.258 µg cm−3. On the other hand, tryptophan content was measured based on the method of alkaline hydrolysis [24]. The essential amino acid score was calculated concerning the FAO reference amino acids pattern [25].

2.5. Fatty Acid Composition

Fatty acid was extracted and then fatty acid methyl esters (FAME’s) were prepared, according to the ISO5509 method [26], with slight modifications in capillary gas chromatography. The soxhlet apparatus was used to extract fat, followed by saponification and esterification, and finally extraction of FAMEs in hexane. FAMEs were subsequently analyzed by capillary gas chromatography (column: 30 m × 0.25 mm I.D., 0.5 μm film thickness; Supelco). Flame ionization detected temperature at 210 °C; carrier gas N2 at 1.0 mL/min; injector temperature at 210 °C; oven temperature programmed from 180 to 250 °C for 5 min. using an Agilent 6890 capillary gas chromatograph. Quantitative data were calculated using the peak area ratio (% total fatty acids).

2.6. Lipid Quality Indices

Based on the fatty acids composition of wild and farmed pangasius muscle, some health parameters were investigated to assess the lipid quality of fish for human health. For both species, the different fatty acid ratios, indicating the lipid quality values, such as ω-6:ω-3 PUFAs, ω-3:ω-6 PUFAs, DHA/EPA, PUFA and SFA were calculated to enable comparisons with the recommendations of the Department of Health, UK. The atherogenicity (AI) and thrombogenicity (TI) indices have been calculated [27] as follows:
AI = 4 × C 14 : 0 + C 18 : 0 + C 16 : 0 Σ MUFA + Σ   n 3   PUFA + Σ   n 6   PUFA
TI = C 14 : 0 + C 18 : 0 + C 16 : 0 ( 0.5 × Σ MUFA ) + ( 0.5 × Σ   n 6   PUFA ) + ( 3 × Σ   n 3   PUFA ) + ( Σ n 3 PUFA / Σ   n 6   PUFA )
where, ΣMUFA refers to the total monounsaturated fatty acids and ΣPUFA refers to the total polyunsaturated fatty acids. Following Siddik et al. [28], the hypocholesterolemic: hypercholesterolemic (HH) ratio was calculated as follows:
HH = C 18 : 1 n 9 + C 18 : 2 n 6 + C 20 : 4 n 6 + C 18 : 3 n 3 + C 20 : 5 n 3 + C 22 : 5 n 3 + C 22 : 6 n 3 C 14 : 0 + C 16 : 0

2.7. Flesh-Lipid Quality (FLQ)

The FLQ shows the percentage association between total lipids and the key ω-3 PUFA (EPA + DHA). A higher index value indicates that the dietary lipid source is of higher quality [29].
FLQ = 100 × [ EPA + DHA ] / [ %   of   total   fatty   acids ]

2.8. Nutritional Contribution of LA and ∑EPA + DHA

The nutritional value of wild and farmed pangasius was calculated using linoleic acid (LA) and the sum of eicosapentaenoic acid (EPA) and docosahexaenoic acid (DHA) concentrations in a 100 g fish sample. The meal size was set at an average of 227 g for an adult consumer with a 70 kg body weight, as recommended by US-EPA [30], which is a crucial factor in determining fish consumption habits. In adult men and women, the Australian National Health and Medical Research Council (NHMRC) and the New Zealand Ministry of Health (MoH) reported appropriate LA intake levels of 1300 mg/day, which are the values seen in a population with no obvious essential fatty acid shortages [31]. As a result, in the current investigation, an average of 1300 mg/day was utilized to estimate the nutritional contribution of LA in human consumption for both men and women. According to the European Food Safety Authority [32], daily EPA and DHA consumption for primary cardiovascular protection should be between 250 and 500 mg. In this investigation, the upper level of 500 mg/day was utilized to calculate the nutritional contribution of EPA + DHA, using the method proposed by Saavedra [33]:
Nutritional contribution (NC, %) = [(C × M)/DRI] × 100
where C is fatty acid concentration as mg/100 g fish sample, M is the meal portion in g, and DRI is dietary reference intake in mg.

2.9. Statistical Analysis

Statistical analysis was conducted using the SPSS (Statistical Package for Social Science, version 23.0, SPSS Inc., and Chicago, IL, USA) statistical software. The findings of the analyses are shown as mean values ± standard deviation (SD). The means of all parameters were compared between wild and farmed pangasius using multiple unpaired t-test to see whether there was any discrepancy between the two groups. The level of statistical significance was set at p < 0.05.

3. Results

3.1. Proximate Composition

The chemical compositions of the wild and the farmed pangasius mashed muscle are presented as moisture, protein, ash, carbohydrate, and fat contents (Table 1). Together they make up approximately 98.32 g/100 g of the total mass of mashed fish muscle. The moisture, fat, and ash content of wild pangasius were significantly higher (p < 0.05), when compared to farmed pangasius. On the contrary, the protein and carbohydrate contents in the wild pangasius were significantly lower (p < 0.05), compared to the farmed pangasius protein and carbohydrate.

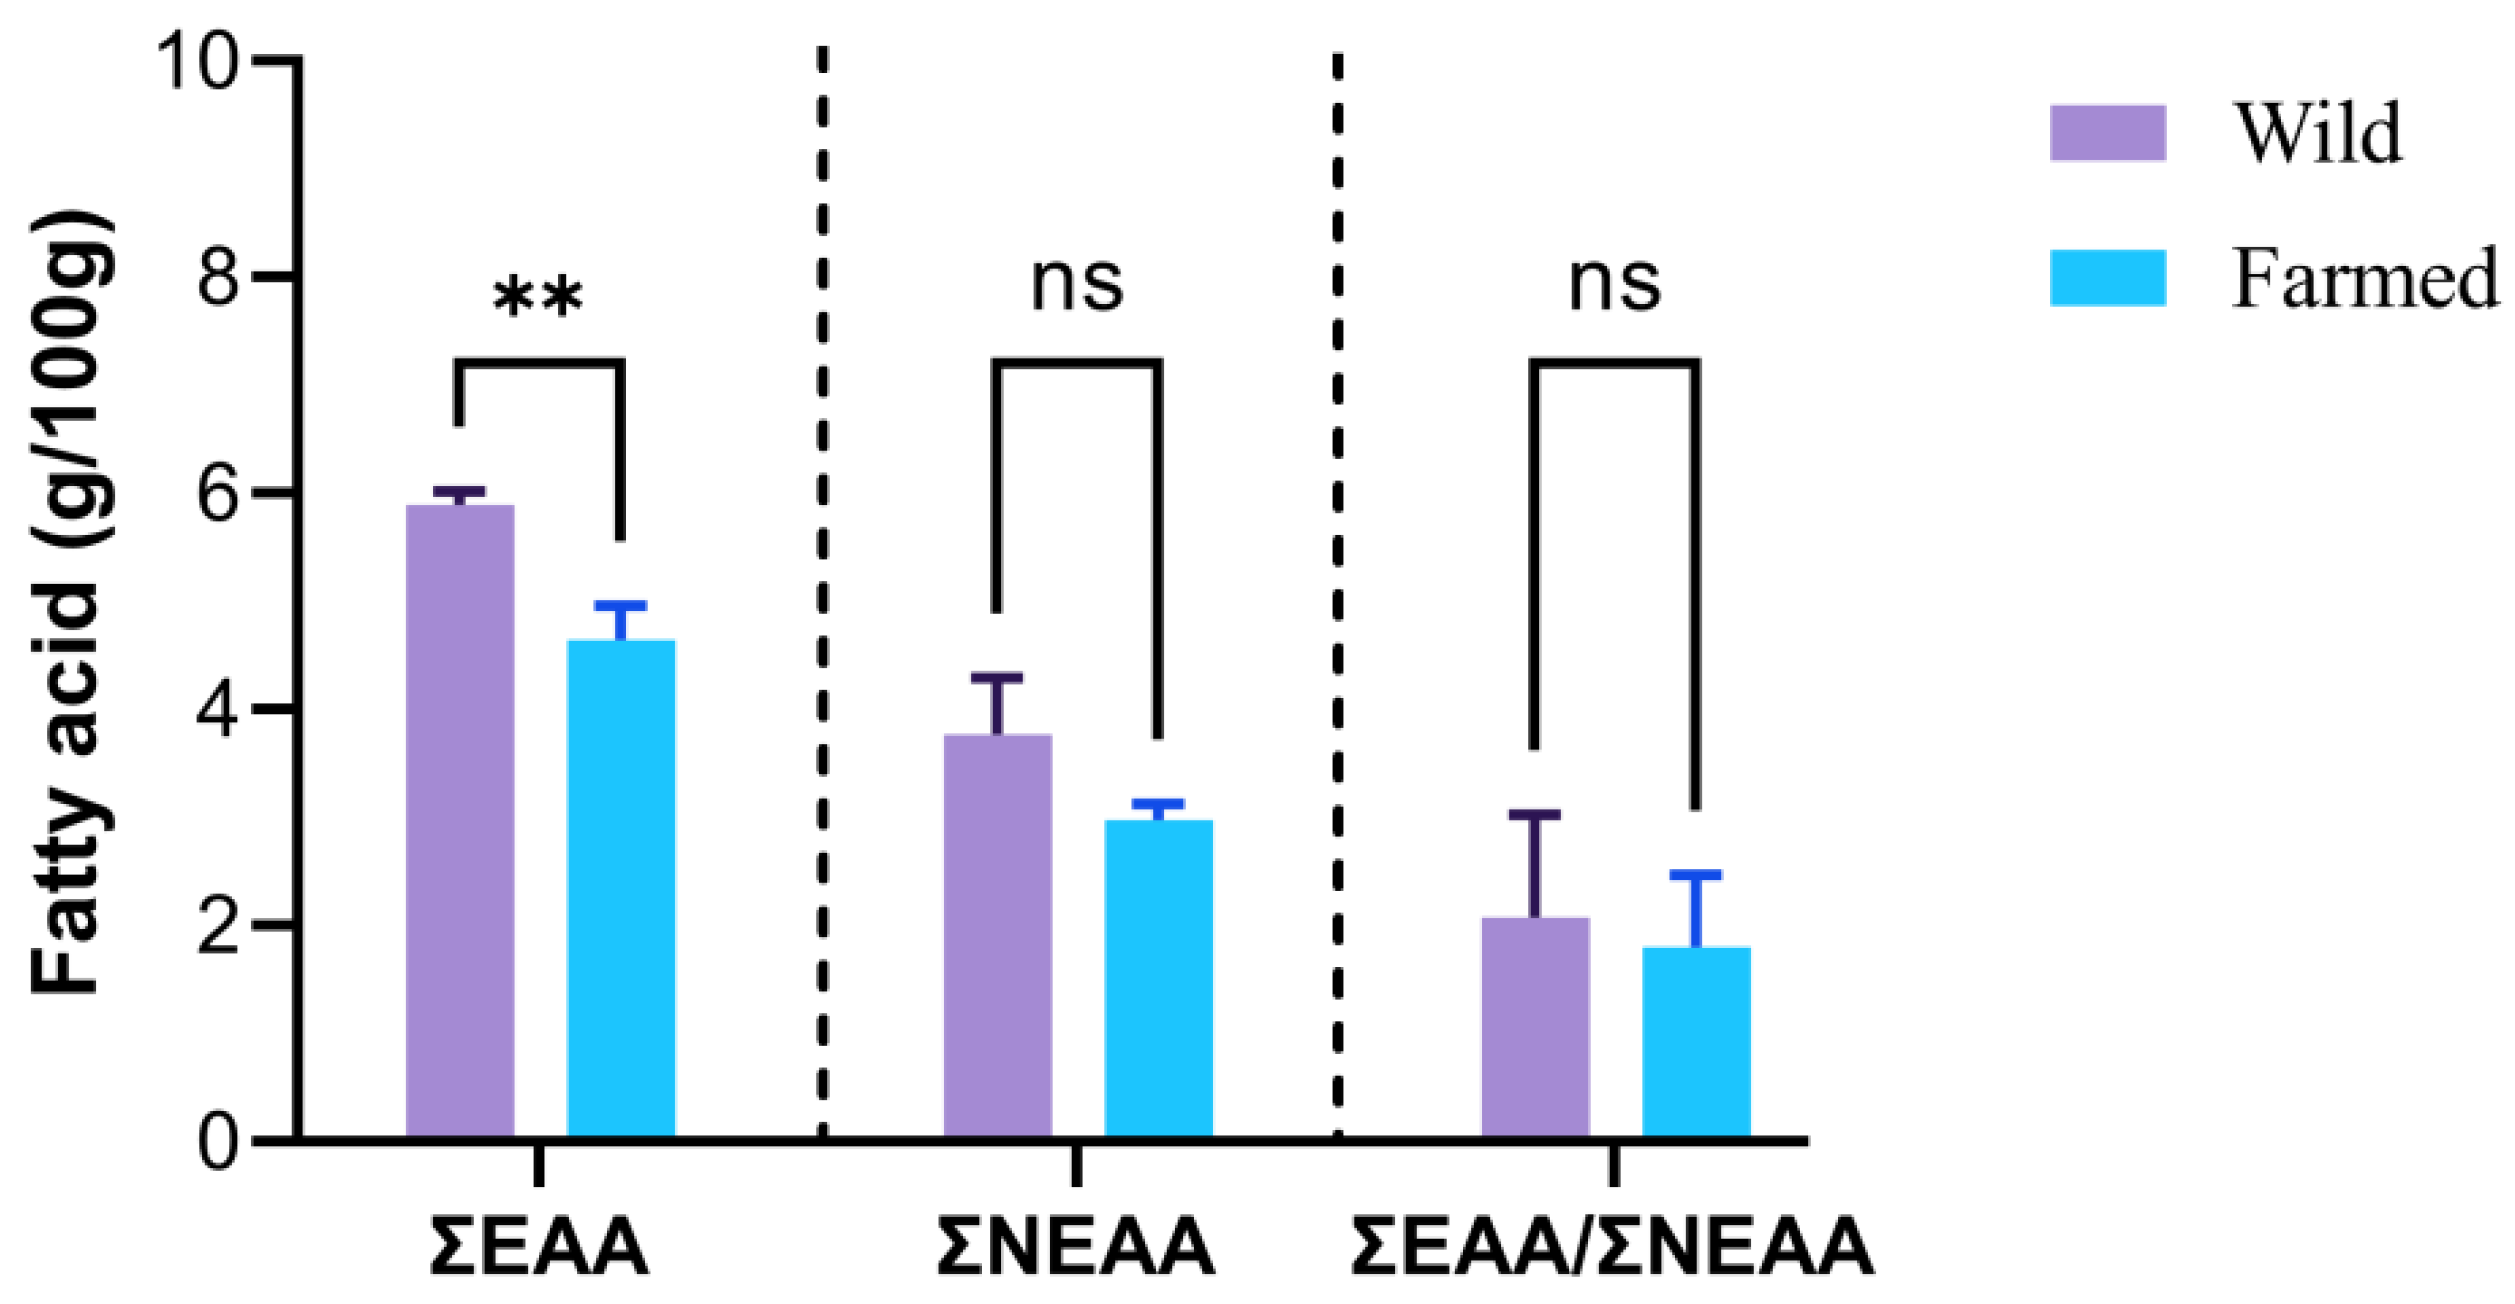
3.2. Amino Acid Composition

The amino acid composition of the wild and farmed fish muscles is displayed in Table 2. In the present study, a total of 14 amino acids was identified and quantified. The essential amino acids identified were methionine, threonine, valine, isoleucine, histidine, and lysine in both examined fishes, and the average mean was significantly higher (p < 0.05) in the wild pangasius than in the farmed pangasius. Furthermore, glycine was the most abundant amino acid in the wild pangasius (1.85 g/100 g), in comparison to the farmed pangasius (1.36 g/100 g). The most common essential amino acids (EAAs) in the wild and the farmed pangasius were lysine and leucine, respectively. Histidine was the lowest estimated amino acid in the wild pangasius (0.49 g/100 g) but higher than in the farmed pangasius (0.34 g/100 g), among all the amino acids found. Arginine found in the wild pangasius was 0.89 g/100 g, while the amount was 0.65 g/100 g in the farmed pangasius. Among the umami taste amino acids, aspartic and glutamic acids were significantly higher in wild pangasius, compared to the farmed pangasius. In addition, aspartic acid contents were comparable to other amino acids determined both for the wild and farmed pangasius.
The sum of essential amino acids (ΣEAA) and non-essential amino acids (ΣNEAA) was estimated to be higher in the wild pangasius than the farmed pangasius (Figure 2).
A significant difference was observed between wild and farmed pangasius in terms of ΣEAA ratio. However, the ΣEAA/ΣNEAA ratio was lower in the wild pangasius than in the farmed pangasius and was found to be significantly different (p < 0.05). Moreover, the ΣEAA/ΣAA ratios for wild and farmed pangasius were well above the FAO/WHO minimum guideline of 40% for both species. The nutritive qualities of protein of the wild and farmed pangasius were evaluated using an amino acid score based on the FAO (2013) standard amino acid profile established for humans. The mean data indicated that all compared amino acids were present in low amounts in both fishes examined, compared to the standards of FAO (2013) (Table 3). However, both the species are still a good source of lysine, leucine, threonine, and valine.

3.3. Fatty Acid Profile

The compositions of fatty acids of wild pangasius and farmed pangasius are shown in Table 4. In the case of saturated fatty acids (SFA), palmitic acid dominated in both the wild (29.17 g/100 g) and farmed (34.46 g/100 g) pangasius, followed by stearic acid (6.47 g/100 g and 5.9 g/100 g) and myristic acid (5.68 g/100 g and 2.79 g/100 g). Among the SFA, only palmitic acid was higher in the farmed pangasius (34.46 g/100 g) than the wild pangasius (29.17 g/100 g). In addition, arachidic acid was found in the farmed pangasius at a concentration of 0.55 ± 0.05 g/100 g but not detected in the wild pangasius.
Among the MUFA’s, oleic acid (18:1), belonging to the ω-9 fatty acid group, was found to be the most dominant and accounted for higher levels in the farmed pangasius (43.27 g/100 g) than wild pangasius (27.35 g/100 g), followed by palmitoleic acid (18.36 g/100 g) in wild pangasius wherein palmitoleic acid was not detected in farmed pangasius. The polyunsaturated fatty acids (PUFA) identified were linoleic acid (C18:2), linolenic acid (C18:3), docosahexaenoic acid (DHA, C22:6), and eicosapentaenoic acid (EPA, C20:5). The linoleic acid was significantly greater in farmed pangasius (10.06 g/100 g), compared to wild pangasius (0.57 g/100 g), while DHA was presented at a higher proportion in the wild pangasius (4.89 g/100 g) than in the farmed pangasius (1.07 g/100 g). In addition, linolenic acid was found more (0.45 g/100 g) in wild pangasius than in the farmed pangasius (0.34 g/100 g), respectively. The polyunsaturated lipid fraction of farmed pangasius was not detected in the present study, while 2.72 g/100 g was found in the wild pangasius. The fatty acid profile of total lipids extracted was dominated by unsaturated fatty acids (UFA) in both wild and farmed pangasius at 56.19 g/100 g and 55.89 g/100 g followed by 43.82 g/100 g and 44.10 g/100 g for saturated fatty acids (SFA), respectively. In the current experiment, PUFA and SFA were greater for the farmed pangasius at 11.47% and 44.10% than the wild pangasius at 8.63 g/100 g and 43.82 g/100 g, correspondingly. The monounsaturated fatty acids (MUFA) and PUFA were determined as 47.56 g/100 g and 8.62 g/100 g in the wild, and 44.42 g/100 g and 11.47 g/100 g in the farmed pangasius, respectively (Table 5). Total MUFA content, however, was lower in the farmed pangasius than in the wild pangasius muscle but varied significantly (p < 0.05). In the present investigation, it was found that the wild and the farmed pangasius mashed muscle usually contain high proportions of SFA, MUFA, and PUFA. The ΣPUFA/ΣSFA ratio was found to be lower than 1 in both the wild (0.2) and farmed (0.26) pangasius.
The wild pangasius had higher levels of ω-3, but the farmed pangasius had higher levels of ω-6. The ratio of ω-3/ω-6 being greater than 1 indicates higher quality in terms of nutritional quality, whereas the ratio of ω-3/ω-6 in the present study was 14.26 for the wild pangasius and 0.14 for the farmed pangasius. In addition to that, ω-3/ω-6 ratio was 13.32–15.07 for the wild pangasius and 13.56–14.47 for the farmed pangasius, both of which did not follow FAO/ WHO’s minimum recommendation of >60% for both species. On the contrary, the ratio of ω-6/ω-3 PUFAs was found to be lower than the value (4.0 at maximum) recommended by the UK Department of Health. According to the WHO recommendation, it is important to maintain the PUFAs intake at a ratio of ω-6/ω-3 ≤ 10, which is in fair agreement with the present study and found ω-6/ω-3 = 0.07 in the wild pangasius and ω-6/ω-3 = 7.14 in the farmed pangasius. Wild pangasius has a significantly higher amount of EPA and DHA than farmed pangasius.

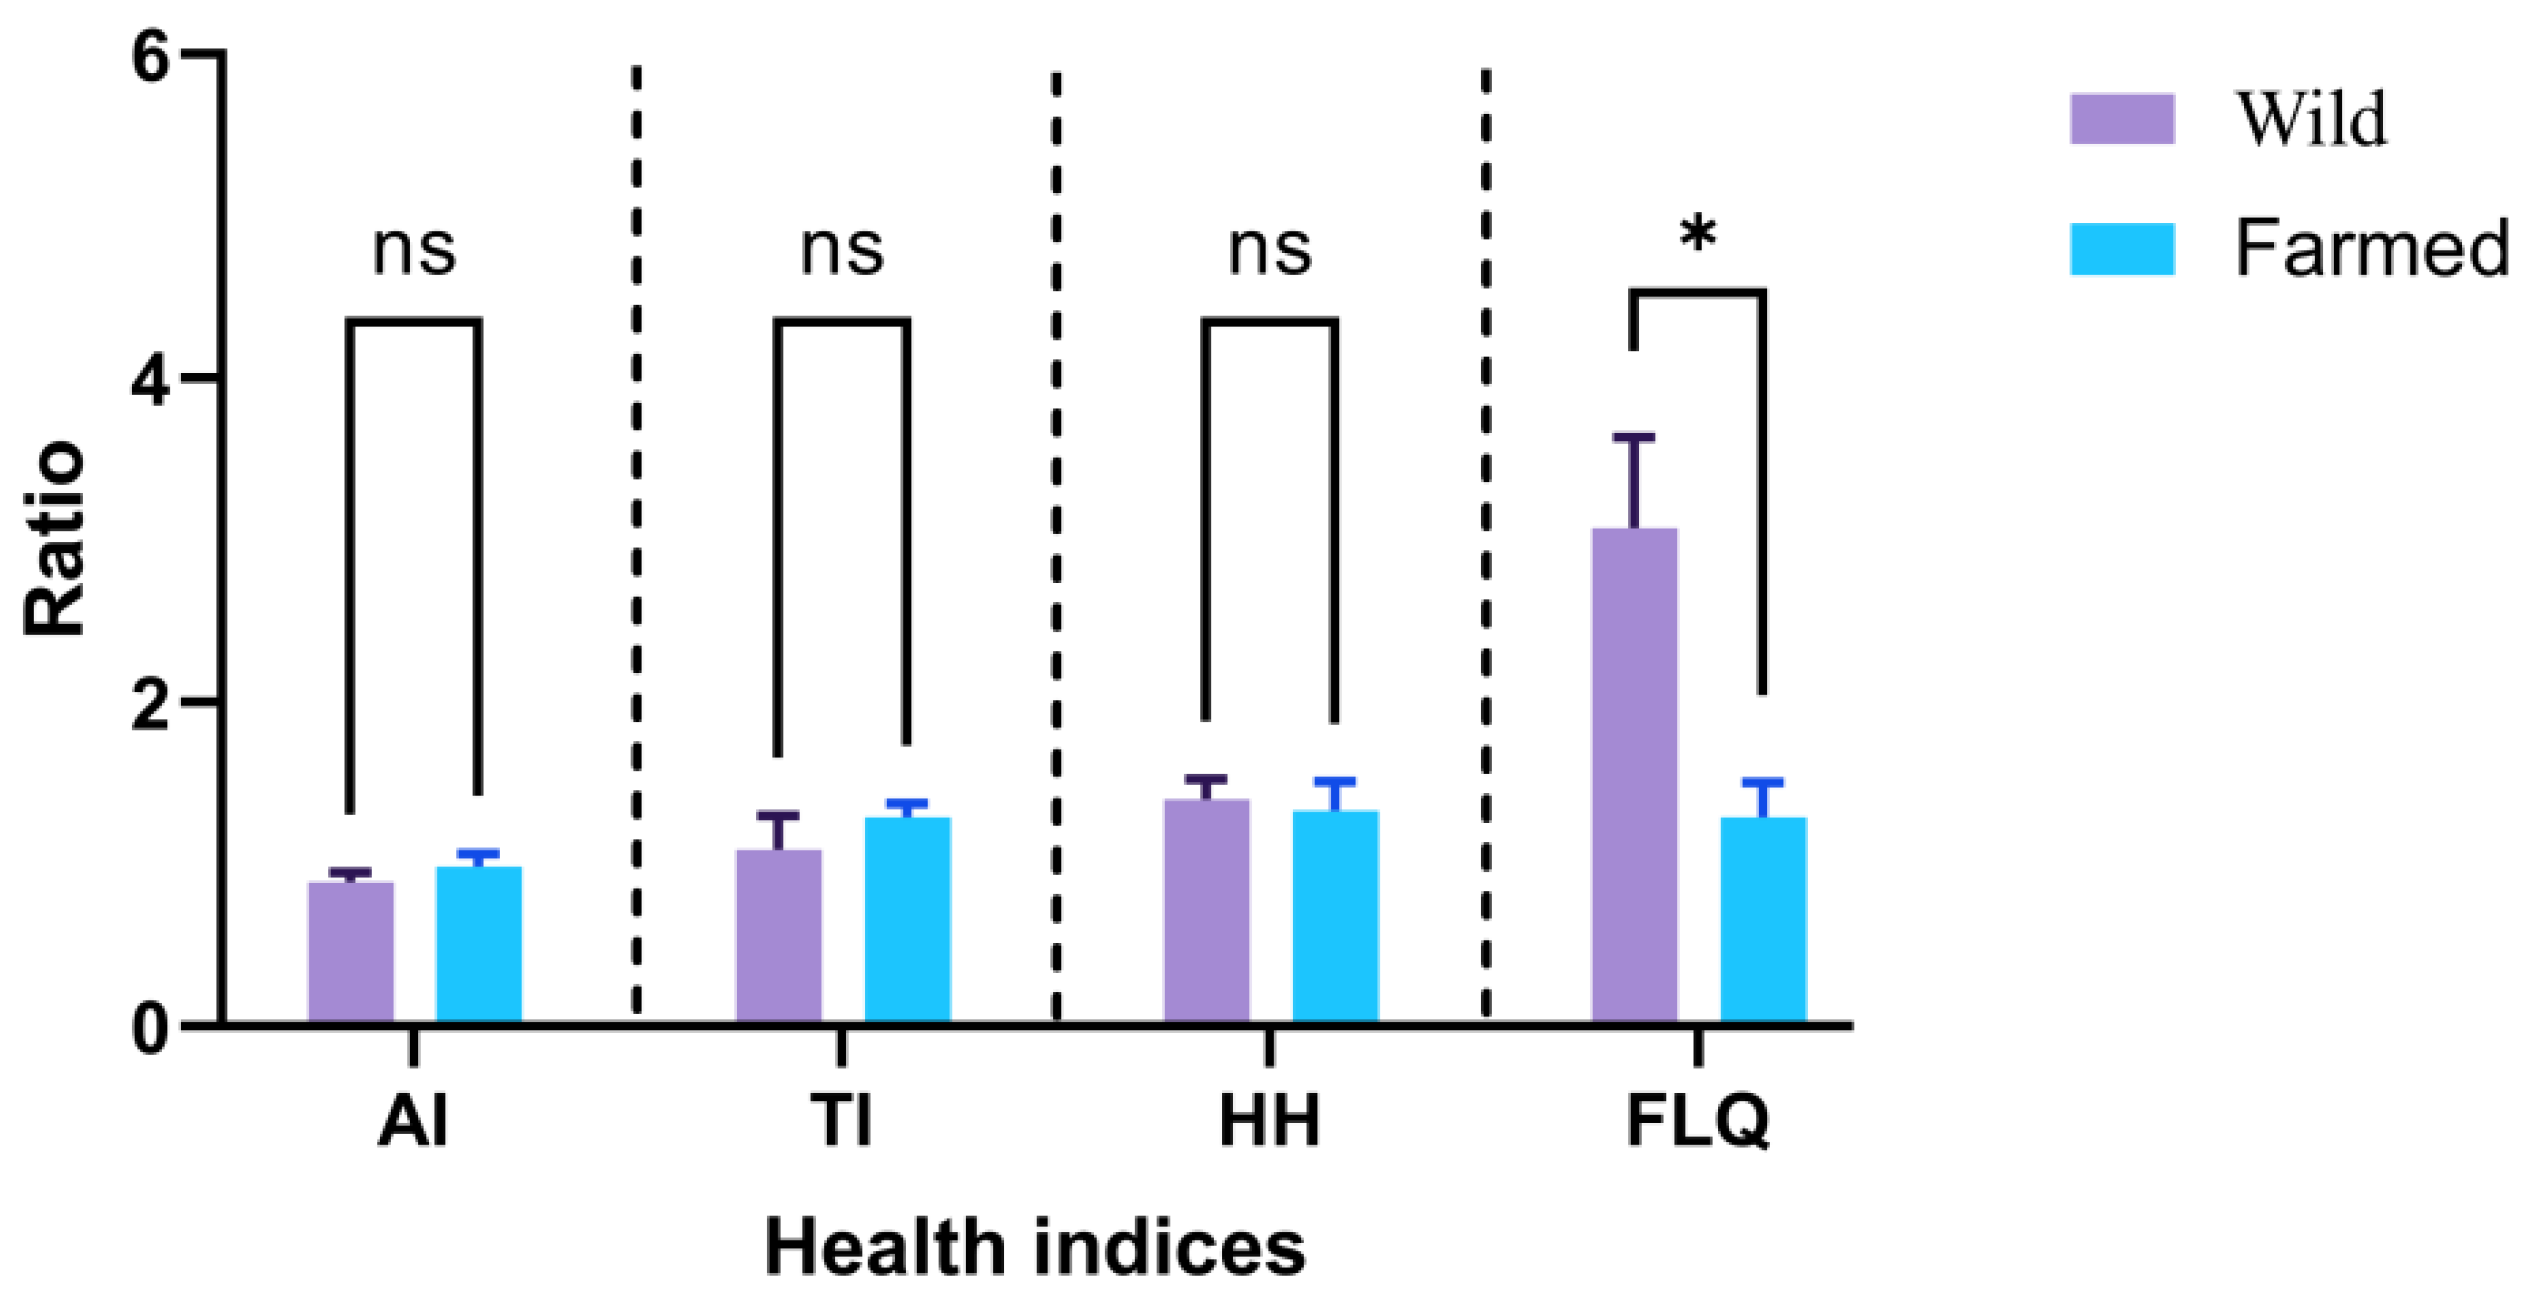
3.4. Nutritional Lipid Quality Indices

In this study, wild pangasius had low atherogenicity (AI), thrombogenicity (TI), and hypocholesterolemic: hypercholesterolemic (HH) values, compared to the farmed pangasius AI, TI, and HH (p > 0.05). In addition, the flesh lipid quality (FLQ) index was significantly higher (p < 0.05) in the wild pangasius than in the farmed pangasius, which indicates that the dietary lipid source is significantly higher in quality for wild pangasius, compared to farmed pangasius (Figure 3).

3.5. Contribution of LA and ∑EPA + DHA to Human Nutrition

The surpassing amounts of dietary contribution of LA (%) were found in the farmed pangasius, which varied significantly from wild pangasius. However, the nutritional contribution of ∑EPA + DHA (%) in the wild pangasius was higher than in the cultivated pangasius (Table 6).

4. Discussion

The proximate composition of fish relies primarily on intra–inter specific species, maturation, sex, environment, harvesting season, and nutritional quality of the animals [34,35]. In the present study, the wild pangasius had higher moisture and ash content than the farmed pangasius. Conversely, the wild pangasius had considerably lower protein and carbohydrate levels than the farmed pangasius. Different habitat, environmental condition, and food availability might have led to differences in muscle composition that consequently resulted in different moisture content. However, significant differences in moisture, protein, lipid, and ash contents have been measured in Pangasius bocourti fillets and conventionally farmed P. hypophthalmus, which is generally consistent with the present findings for both the wild and the farmed pangasius, with a minor exception in the moisture content [4,36]. Furthermore, many studies have found a pattern, whereby farmed fish tends to be higher in fat and lower in moisture, when compared to the same species caught in a natural habitat [37,38,39,40]. Moreover, the higher lipid content in wild pangasius, compared to the farmed pangasius could be the consequence of seasonal effect. In general, the changes in moisture content found between studies were extremely species-specific and heavily reliant on the farm’s farming practices and environmental conditions [41,42].
Fish with high protein content must have a minimum protein level of 15% [43]. Our research revealed that farmed pangasius had a higher protein content of almost 20%, demonstrating its status as a high protein fish, while the wild pangasius also had a high protein level, which is close to 15%. Literally, variations in protein content of cultured fishes may be due to different feeding techniques [44]. In the current study, the farmed pangasius were fed artificial feed that contained 30% protein, which may have led to higher protein content in the farmed pangasius. The less availability of food in the natural environment may have led to a reduced protein content in wild pangasius because no feed was provided from outside. Unlike farmed pangasius, the wild pangasius was not fed nutrient-rich artificial feed in a control environment that creates differences in protein content. Moreover, fish protein differences may be influenced by their habitat [45], feeding, and other physiological abilities [46]. The high protein content in farmed pangasius has been reported before [47], which complies with the present findings.
In addition, amino acids, such as methionine, threonine, valine, isoleucine, histidine, and lysine, were identified in both the investigated species. The glutamic acid, aspartic acid, and lysine have been reported to be dominant in aquatic organisms [48], which are fairly congruent with the current outcomes. In our research, significantly higher essential amino acids were measured in the wild pangasius than in the farmed pangasius. The higher amount of essential amino acids in wild pangasius may be due to consuming a variety of natural foods, while the farmed pangasius only received an artificial diet around the culture period.
The arginine level in the wild pangasius was higher than that in the farmed pangasius, implying that, in this respect, the wild pangasius is a superior dietary fish. Arginine is considered essential for treating heart disease and hypertension, as well as being involved in a number of metabolic activities [49]. In the current experiment, among the eight essential amino acids, tryptophan and phenylalanine were not detected, but both the fishes are good sources of the remaining six necessary amino acids, which can perform different functions in the body. Among the essential amino acids, tyrosine, histidine, cysteine, and arginine are taken into account as obligatory by kids and developing children, and deficiency in these amino acids may hinder the healing recovery process [50,51]. As a result, both wild and farmed pangasius can be viewed as a healthier diet for young children and growing youngsters. Moreover, both wild and farmed pangasius are good sources of indispensable amino acids and can be used as a substitute for other sources of proteins that are insufficient in lysine content.
In the present study, the ΣEAA/ΣNEAA ratio was higher in the farmed pangasius than in the wild pangasius. The ratio of EAA to NEAA is an index for determining the protein consistency [52] and the higher value represents excellent protein quality. The optimal EAA to NEAA ratio has been found to be 0.71 g/100 g in gilthead seabream (Sparus aurata) when commercial extruded feed that had 44% protein on average was used as feed, indicating a high-quality protein [53], while in Sperata aor is 0.86 mg/100 g [54] when collected from the market sources, which is comparatively lower than the present findings.
In comparison to the amino acid score based on the FAO [25] guidelines, the current study indicated that the majority of the essential amino acids was presented in both species. It is clear from the data analyzed and interpreted that both fishes are generally well-balanced in terms of essential amino acids, compared to other previously evaluated fishes; have a favorable EAA/NEAA ratio; and can be considered a high-quality protein food source. As a result, attention must be centered on low-cost, high-nutrient fish animal protein sources, such as wild pangasius and farmed pangasius.
In case of the lipid content, the wild pangasius had significantly higher content than the farmed pangasius. Based on the fat content, fish are graded as lean (less than 2% fat), low-fat (2–4% fat), medium-fat (4–8% fat), and high-fat (more than 8% fat) [55]. The current findings indicated that both the wild and the farmed pangasius catfish can be categorized as low-fat fish based on their lipid contents. In addition, both the fishes were a huge source of fat and necessary fatty acids. Among the mono-unsaturated fatty acids, oleic acid was significantly higher in the farmed pangasius than the wild pangasius. Similar results have been found for Pangaasius sutchi when compared to the Pangasius pangasius [56]. In comparison to wild pangasius, farmed pangasius has significantly more linoleic acid.
On the contrary, the wild pangasius was a great source of polyunsaturated fatty acids, especially DHA, compared to the farmed pangasius. In addition, linolenic acid was found more in the wild pangasius than in farmed pangasius. The percentage of EPA and DHA in the wild pangasius was significantly higher than that of the farmed pangasius. The amount of DHA and EPA recorded in fresh fillets of the P. hypophthalmus were 2.69 mg/100 g and 0.36 mg/100 g [18], respectively, which is lower than the present findings. The DHA and EPA prevent human coronary artery diseases [57], which suggest that the consumption of wild pangasius could provide valuable health benefits. In addition, the most effective way to add important oils to daily dishes is to provide at least 2–3 pieces of fatty fishes, such as salmon, Salmo salar; barramundi, Lates calcarifer, per week. The British Nutrition Foundation has recommended that fish is a balanced and healthy dish; one should consume 0.2 g of EPA + DHA daily or 1.5 g every week [58]. Even longer life span in Japan and Nordic populations has been partly associated with their high consumption of fish and seafood [59]. Nutritionists believe that the desirable ratio of ω-6/ω-3 (ω-6 to ω-3 fatty acids) should be 5 and that the addition of ω-3 polyunsaturated fatty acids (ω-3 PUFA) could improve the nutritional picture, and thus help in the prevention of diseases. In the current experiment, PUFA and SFA were greater for farmed pangasius than wild pangasius correspondingly. Furthermore, it was found that the wild and farmed pangasius mashed muscle usually contains high proportions of SFA, MUFA, and PUFA, which is significantly higher than that was reported by Bogard [17] in P. hypophthalmus collected from the fish market. The SFA and MUFA, and PUFA were observed in all tissues of Pangasius bocourti [60], which are approximately similar to the present findings.
Many studies covering the KIHD (Kuopio Ischaemic Heart Disease) and the Nurses’ Health study have come across an inverse relationship between the PUFA/SFA ratio and cardiovascular outcomes, importing that exchanging SFA with PUFA in the diet, as well as the replacement of ΣSFA with ΣPUFA in the higher ratio, will abate cardiovascular disease [10,61]. The ΣPUFA/ΣSFA ratio was found to be lower than 1 in both the wild (0.2) and farmed (0.26) pangasius, which was lower than P. hypophthalmus fillet imported to Poland (0.357), Germany (0.326), and Ukraine (0.343) [62] and in the Dicentrarchus labrax (0.90 ± 0.01), Mugil cephalus (0.64), and Liza saliens (0.59) reported by Diraman and Dibeklioglu [63] and Özogul [64]. Moreover, the PUFAs identified to belong to the group of ω-3 fatty acids and ω-6 represented higher for both of the species.
Wild pangasius contained higher amounts of PUFA, both ω-3 and ω-6, lower ω-6/ω-3 ratios, and higher ω-3/ω-6 ratio, as well as more desirable PUFA/MUFA ratio to be beneficial for human diets. In general, the ratio of ω-3/ω-6 being greater than 1 indicates higher quality in terms of nutritional quality, whereas the ratio of ω-3/ω-6 in the present study was higher for the wild pangasius and very low for the farmed pangasius. High ω-3/ω-6 ratios were also observed in some freshwater and marine fishes, such as Theragra chalcogramma (23.4%), Salmo salar (7.4%), Oncorhynchus mykiss (4.3%), Cyprinus carpio (1.1%), and wild Sparus aurata (1.08%), respectively, but lower ratios also were found in Pangasius hypophthalmus (0.3%), Dicentrarchus labrax (0.73%) and cultured Sparus aurata (0.83%) [63,65]. In addition to that, the ω-3/ω-6 ratio was low for the wild pangasius and the farmed pangasius, both of which did not fulfill the FAO/WHO’s minimum recommendation of >60% for both species. The study stated that the increase of the ω-3/ω-6 ratio helps to prevent coronary heart disease (CHD) by reducing plasma lipids and reducing the risk of cancer [66]. On the contrary, the ratio of ω-6/ω-3 PUFAs was found to be lower than the value (4.0 at maximum) recommended by the UK Department of Health, and exceeding the maximum is detrimental to health and may enhance cardiovascular disease [67]. According to the WHO recommendation, it is important to maintain the PUFAs intake at a ratio ω-6/ω-3 < 10, which is in fair agreement with the present study. A lower ratio of ω-6/ω-3 (2.00–3.83) was found in the fillets of P. hypophthalmus [68], while higher values (9.51–11.33) were reported in the fillets of Pangasius bocourti [60].
The higher AI and TI values (>1.0) are harmful to human health, whereas higher H/H levels (>1.0 ± 0.2) are beneficial [28,69]. The present outcomes for both fishes are higher in the cases of AI and TI and lower in the case of HH, comparatively to the findings of Tonial [70] for tilapia alevin (Oreochromis niloticus) where AI, TI, and HH are 0.55, 0.82, and 1.63 and juvenile tilapia (Oreochromis niloticus) 0.60, 87, and 1.56, respectively. In addition, the flesh lipid quality (FLQ) index was higher in the wild pangasius than the farmed pangasius, which indicates that the dietary lipid source is significantly higher in quality [71] for the wild pangasius, compared to the farmed pangasius. The higher FLQ value was also reported in carp 6.84 [72], which is lower than the present findings for the wild pangasius but much higher than for the farmed pangasius.
In the present study, wild and farmed pangasius met the daily intake requirements of EPA + DHA suggested by the European Food Safety Authority (EFSA) [32] for the prevention of primary cardiovascular diseases. The nutritional contribution of wild and farmed pangasius was evaluated in this study using EFSA [32] recommendations, with the maximum daily dietary value for EPA + DHA set at 500 mg/day. In terms of the dietary contribution of EPA + DHA documented in this study, 100 g of wild pangasius muscles appears to be closer to the requirement and almost fulfills the amount of 500 mg recommended by EFSA [32] for primary prevention of cardiovascular diseases, whereas the farmed fish was moderate according to the recommended daily amount for human consumption and the prevention of coronary diseases. Less beneficial fatty acids, such as saturated and unsaturated fatty acids, as well as LA, were discovered in higher concentrations in farmed pangasius in terms of dietary contribution. Recommendations for fat intake are based on a person’s overall energy intake, age, degree of exercise, and lifestyle [33]. The results of this study contradicted those of Oztekin [45] and Saavedra [33], who found that farmed fish meet the recommended daily quantity of 500 mg of EPA + DHA, but wild fish only meet it partially.

5. Conclusions

In recapitulation, the wild pangasius is a higher-quality source of balanced essential amino acids and fatty acids than farmed pangasius. To our knowledge, this is the first report on the amino acids and fatty acids composition of wild yellowtail catfish P. pangasius. Furthermore, the consumption of both wild and farmed pangasius can offer adequate health benefits, particularly the wild pangasius, according to the nutritional quality indices and the ω-6/ω-3 ratio of these two species.

Author Contributions

Conceptualization, S.C. and M.A.R.; methodology, S.C. and M.A.R.; software, M.A.R. and M.A.B.S.; validation, S.C., M.A.R., M.A.B.S., M.S.H. and I.N.V.; formal analysis, M.A.R. and M.A.B.S.; investigation, S.C. and M.A.R.; resources, S.C., M.A.R. and M.S.H.; data curation, S.C. and M.A.R.; writing—original draft preparation, S.C. and M.A.R.; writing—review and editing, M.A.B.S., M.S.H. and I.N.V.; visualization, M.A.R., M.A.B.S. and S.M.I.; supervision, M.S.H. and M.A.B.S.; project administration, S.C., M.A.R., M.S.H. and M.A.B.S.; funding acquisition, S.C., M.A.R., M.A.B.S. and I.N.V. All authors have read and agreed to the published version of the manuscript.

Funding

The study was funded by the Ministry of Science and Technology (MoST) of Bangladesh (Grant number: SL. 163, BS-266).

Institutional Review Board Statement

The experimental protocol and guidelines were maintained according to the Animal Welfare and Ethical Committee of Patuakhali Science and Technology University, Patuakhali, Bangladesh. The research and use of animals for the experiment have been authorized by the Ethical Committee (Approval No. PSTU-FoF/2019/04).

Informed Consent Statement

The consent of authors was obtained before the submission of the present work.

Data Availability Statement

The supporting data are accessible from the corresponding author upon feasible demand.

Acknowledgments

The authors acknowledge the assistance of fisherman in obtaining fish for the study.

Conflicts of Interest

The authors proclaim no conflict of interest.

References

  1. Food and Agricultural Organization. World Food and Agriculture—Statistical Yearbook; FAO: Rome, Italy, 2021. [Google Scholar] [CrossRef]
  2. Department of Fisheries. Yearbook of fsheries statistics of Bangladesh 2018–19. In Fisheries Resources Survey System (FRSS), 36; Department of Fisheries, Ministry of Fisheries and Livestock: Dhaka, Bangladesh, 2019; pp. 142–146. [Google Scholar]
  3. Haque, M.M.; Alam, M.M.; Hoque, M.S.; Hasan, N.A.; Nielsen, M.; Hossain, M.I.; Frederiksen, M. Can Bangladeshi pangasius farmers comply with the requirements of aquaculture certification? Aquac. Rep. 2021, 21, 100811. [Google Scholar] [CrossRef]
  4. Karl, H.; Lehmann, I.; Rehbein, H.; Schubring, R. Composition and quality attributes of conventionally and organically farmed Pangasius fillets (Pangasius hypophthalmus) on the German market. Int. J. Food Sci. Technol. 2010, 45, 56–66. [Google Scholar] [CrossRef]
  5. Rahman, M.A.; Ullah, M.R.; Kabir, M.A.; Alam, M.A.; Rahman, M.; Hossen, M.F. Artificial propagation of indigenous yellowtail catfish (Pangasius pangasius): Experiences and challenges. Aquaculture 2020, 523, 735215. [Google Scholar] [CrossRef]
  6. Gladyshev, M.I.; Sushchik, N.N.; Gubanenko, G.A.; Demirchieva, S.M.; Kalachova, G.S. Effect of way of cooking on content of essential polyunsaturated fatty acids in muscle tissue of humpback salmon (Oncorhynchus gorbuscha). Food Chem. 2006, 96, 446–451. [Google Scholar] [CrossRef]
  7. Oluwaniyi, O.O.; Dosumu, O.O.; Awolola, G.V. Effect of local processing methods (boiling, frying and roasting) on the amino acid composition of four marine fishes commonly consumed in Nigeria. Food Chem. 2010, 123, 1000–1006. [Google Scholar] [CrossRef]
  8. Wu, G. Amino acids: Metabolism, functions, and nutrition. Amino Acids 2009, 37, 1–17. [Google Scholar] [CrossRef]
  9. Sidhu, K.S. Health benefits and potential risks related to consumption of fish or fish oil. Regul. Toxicol. Pharmacol. 2003, 38, 336–344. [Google Scholar] [CrossRef]
  10. Fung, T.T.; Rexrode, K.M.; Mantzoros, C.S.; Manson, J.E.; Willett, W.C.; Hu, F.B. Mediterranean diet and incidence of and mortality from coronary heart disease and stroke in women. Circulation 2009, 119, 1093–1100. [Google Scholar] [CrossRef] [Green Version]
  11. Calder, P.C. n-3 Fatty acids and cardiovascular disease: Evidence explained and mechanisms explored. Clin. Sci. 2004, 107, 1–11. [Google Scholar] [CrossRef]
  12. Mnari, A.; Bouhlel, I.; Chraief, I.; Hammami, M.; Romdhane, M.S.; El Cafsi, M.; Chaouch, A. Fatty acids in muscles and liver of Tunisian wild and farmed gilthead sea bream, Sparus aurata. Food Chem. 2007, 100, 1393–1397. [Google Scholar] [CrossRef]
  13. Von Schacky, C. The role of omega-3 fatty acids in cardiovascular disease. Curr. Atheroscler. Rep. 2003, 5, 139–145. [Google Scholar] [CrossRef] [PubMed]
  14. Shaikh, A.S.; Lohar, P.S. Biochemical Composition and Gonadosomatic Index of Three Major Carps in Hatnoor Reservoir, Maharashtra, India. J. Ecobiotechnol. 2011, 3, 1–4. [Google Scholar]
  15. Azam, K.; Ali, M.Y.; Asaduzzaman, M.; Basher, M.Z.; Hossain, M.M. Biochemical Assessment of Selected Fresh Fish. J. Biol. Sci. 2003, 4, 9–10. [Google Scholar] [CrossRef] [Green Version]
  16. Talwar, P.K.; Jhingran, A.G. Inland Fishes of India Andadjacent Countries, Volumes 1 and 2; Oxford and IBHPublishing Co. Pvt. Ltd.: New Delhi/Bombay/Calcutta, India, 1991; p. 1063. [Google Scholar]
  17. Bogard, J.R.; Thilsted, S.H.; Marks, G.C.; Wahab, M.A.; Hossain, M.A.R.; Jakobsen, J.; Stangoulis, J. Nutrient composition of important fish species in Bangladesh and potential contribution to recommended nutrient intakes. J. Food Compos. Anal. 2015, 42, 120–133. [Google Scholar] [CrossRef] [Green Version]
  18. Sokamte, T.A.; Mbougueng, P.D.; Mohammadou, B.A.; Tatsadjieu, N.L.; Sachindra, N.M. Proximal composition and fatty acid profile of fresh and smoked fillets of Pangasius hypophthalmus. Sci. Afr. 2020, 9, e00534. [Google Scholar] [CrossRef]
  19. Monalisa, K.; Islam, M.Z.; Khan, T.A.; Abdullah, A.T.M.; Hoque, M.M. Comparative study on nutrient contents of native and hybrid Koi (Anabas testudineus) and Pangas (Pangasius pangasius, Pangasius hypophthalmus) fish in Bangladesh. Int. Food Res. J. 2013, 20, 791–797. [Google Scholar]
  20. Association of Official Agricultural Chemistry. Official Methods of Analysis of the AOAC, 18th ed.; Association of Official Analytical Chemists: Arlington, VA, USA, 2005. [Google Scholar]
  21. James, C.J. The Analytical Chemistry of Foods; Chapman and Hall Press: New York, NY, USA, 1995; p. 86. [Google Scholar]
  22. Dimova, N. RP-HPLC Analysis of Amino Acids with UV-Detection; Tome 56, No 12; Bulgarian Academy Science: Sofia, Bulgaria, 2003. [Google Scholar]
  23. Gheshlaghi, R.; Scharer, J.M.; Moo-Young, M.; Douglas, P.L. Application of statistical design for the optimization of amino acid separation by reverse-phase HPLC. Anal. Biochem. 2008, 383, 93–102. [Google Scholar] [CrossRef]
  24. Basha, S.M.M.; Roberts, R.M. A simple colorimetric method for the determination of tryptophan. Anal. Biochem. 1977, 77, 378–386. [Google Scholar] [CrossRef]
  25. Food and Agricultural Organization. Dietary Protein Quality Evaluation in Human Nutrition; Report of an FAO Expert Consultation. Food and Nutrition Paper 92; FAO: Rome, Italy, 2013; ISBN 978-92-5-107417-6. [Google Scholar]
  26. Method ISO 5509; Animal and Vegetable Fats and Oils—Preparation of Methyl Esters of Fatty Acids. International Organization of Standardization: Geneva, Switzerland, 2000. Available online: https://www.iso.org/standard/11560.html (accessed on 25 October 2022).
  27. Ulbricht, T.L.; Southgate, D.A. Coronary heart disease: Seven dietary factors. Lancet 1991, 338, 985–992. [Google Scholar] [CrossRef]
  28. Siddik, M.A.B.; Chungu, P.; Fotedar, R.; Howieson, J. Bioprocessed poultry by-product meals on growth, gut health and fatty acid synthesis of juvenile barramundi, Lates calcarifer (Bloch). PLoS ONE 2019, 14, e0215025. [Google Scholar]
  29. Senso, L.; Suárez, M.D.; Ruiz-Cara, T.; García-Gallego, M. On the possible effects of harvesting season and chilled storage on the fatty acid profile of the fillet of farmed gilthead sea bream (Sparus aurata). Food Chem. 2007, 101, 298–307. [Google Scholar] [CrossRef]
  30. United States-Environmental Protection Agency. Guidance for assessing chemical contaminant data for use in fish advisories. In Volume 1: Fish Sampling and Analysis, 2nd ed.; EPA 823-R-95-007; Office of Science and Technology, Office of Water: Washington, DC, USA, 1995. [Google Scholar]
  31. National Health and Medical Research Council. Fats: Total Fats and Fatty Acids. Nutrient Reference Values for Australia and New Zealand Including Recommended Dietary Intakes. Australian National Health and Medical Research Council (NHMRC) and the New Zealand Ministry of Health (MoH), New Zealand. 2006. Available online: https://www.nrv.gov.au/sites/default/files/content/n35-fat_0.pdf (accessed on 25 September 2022).
  32. European Food Safety Authority. EFSA Panel on Dietetic Products, Nutrition, and Allergies (NDA); Scientific Opinion on Dietary Reference Values for Fats, including Saturated Fatty Acids, Polyunsaturated Fatty Acids, Monounsaturated Fatty Acids, Trans Fatty Acids, and Cholesterol; EFSA: Parma, Italy, 2010; p. 1461. [Google Scholar]
  33. Saavedra, M.; Pereira, T.G.; Carvalho, L.M.; Pousão-Ferreira, P.; Grade, A.; Teixeira, B.; Quental-Ferreira, H.; Mendes, R.; Bandarra, N.; Gonçalves, A. Wild and farmed meagre, Argyrosomus regius: A nutritional, sensory and histological assessment of quality differences. J. Food Compos. Anal. 2017, 63, 8–14. [Google Scholar] [CrossRef]
  34. Siddik, M.A.B.; Howieson, J.; Fotedar, R. Beneficial effects of tuna hydrolysate in poultry by-product meal diets on growth, immune response, intestinal health and disease resistance to Vibrio harvei in barramundi, Lates calcarifer. Fish Shellfish. Immunol. 2019, 89, 61–70. [Google Scholar]
  35. Boran, G.; Karaçam, H. Seasonal changes in proximate composition of some fish species from the black sea. Turk. J. Fish. Aquat. Sci. 2011, 11, 1–5. [Google Scholar] [CrossRef]
  36. Pongpet, J.; Ponchunchoovong, S.; Payooha, K. Partial replacement of fishmeal by brewer’s yeast (Saccharomyces cerevisiae) in the diets of Thai Panga (Pangasianodon hypophthalmus × Pangasius bocourti). Aquac. Nutr. 2016, 22, 575–585. [Google Scholar] [CrossRef]
  37. Fuentes, A.; Fernández-Segovia, I.; Serra, J.A.; Barat, J.M. Comparison of wild and cultured sea bass (Dicentrarchus labrax) quality. Food Chem. 2010, 119, 1514–1518. [Google Scholar] [CrossRef]
  38. Zhao, F.; Zhuang, P.; Zhang, L.Z.; Shi, Z.H. 2016Biochemical composition of juvenile cultured vs. wild silver pomfret, Pampus argenteus: Determining the diet for cultured fish. Fish Physiol. Biochem. 2010, 36, 1105–1111. [Google Scholar] [CrossRef]
  39. Rodríguez-Barreto, D.; Jerez, S.; Cejas, J.R.; Martin, M.V.; Acosta, N.G.; Bolaños, A.; Lorenzo, A. Comparative study of lipid and fatty acid composition in different tissues of wild and cultured female broodstock of greater amberjack (Seriola dumerili). Aquaculture 2012, 360–361, 1–9. [Google Scholar] [CrossRef]
  40. Wang, Y.Y.; Yu, S.L.; Ma, G.J.; Chen, S.B.; Shi, Y.; Yang, Y.H. Comparative study of proximate composition and amino acid in farmed and wild Pseudobagrus ussuriensis muscles. Int. J. Food. Sci. Technol. 2014, 49, 983–989. [Google Scholar] [CrossRef]
  41. Cardinal, M.; Cornet, J.; Donnay-Moreno, C.; Gouygou, J.P.; Bergé, J.P.; Rocha, E.; Soares, S.; Escórcio, C.; Borges, P.; Valente, L.M.P. Seasonal variation of physical, chemical and sensory characteristics of sea bream (Sparus aurata) reared under intensive conditions in Southern Europe. Food Control 2011, 22, 574–585. [Google Scholar] [CrossRef] [Green Version]
  42. Nurnadia, A.A.; Azrina, A.; Amin, I.; Mohd, Y.A.S.; Mohd, I.E.H. Mineral contents of selected marine fish and shellfish from the west coast of Peninsular Malaysia. Food Res. Int. 2013, 20, 431–437. [Google Scholar]
  43. Stansby, M. Chemical characteristics of fish caught in the northeast Pacific Ocean. Mar. Fish. Rev. 1976, 38, 9. [Google Scholar]
  44. Khan, M.S.; Ang, K.J.; Ambak, M.A.; Saad, C.R. Optimum dietary protein requirement of a Malaysian freshwater catfish, Mystus nemurus. Aquaculture 1993, 112, 227–235. [Google Scholar] [CrossRef]
  45. Oztekin, A.; Yigit, M.; Kizilkaya, B.; Ucyol, N.; Yilmaz, S.; Tan, E.; Bulut, M.; Ergün, S.; Ayaz, A. Fatty Acid Profiles in Wild Axillary Seabream (Pagellus acarne) versus Cage-Aggregated and Cage-Farmed Fish with Reference to Nutritional Contribution for Human Consumers. Aquac. Stud. 2018, 18, 29–38. [Google Scholar] [CrossRef]
  46. Islam, M.N.; Joadder, M.A.R. Seasonal variation of the proximate composition of freshwater Gobi, Glossoqibius giuris (Hamilton) for river Padma. Pak. J. Biol. Sci. 2005, 8, 532–536. [Google Scholar]
  47. Ali, M.Z.; Hossain, M.A.; Mazid, M.A. Effect of mixed feeding schedules with varying dietary protein levels on the growth of sutchi catfish, Pangasius hypophthalmus (Sauvage) with silver carp, Hypophthalmichthys molitrix (Valenciennes) in ponds. Aquac. Res. 2005, 36, 627–634. [Google Scholar] [CrossRef]
  48. Özden, Ö.; Erkan, N. Comparison of biochemical composition of three aqua cultured fishes (Dicentrarchus labrax, Sparus aurata, Dentex dentex). Int. J. Food Sci. Nutr. 2008, 59, 545–557. [Google Scholar] [CrossRef]
  49. Furuya, W.M.; Graciano, T.S.; Vidal, L.V.O.; Xavier, T.O.; Gongora, L.D.; Righetti, J.S.; Furuya, V.R.B. Digestible lysine requirement of Nile tilapia fingerlings fed arginine-tolysine-balanced diets. Rev. Bras. Zootec. 2012, 41, 485–490. [Google Scholar] [CrossRef] [Green Version]
  50. Imura, K.; Okada, A. Amino acid metabolism in pediatric patients. Nutrition 1998, 14, 143–148. [Google Scholar] [CrossRef]
  51. Jais, A.M.M.; McCulloch, R.; Croft, K. Fatty acid and amino acid composition in haruan as a potential role in wound healing. Gen. Pharmacol. 1994, 25, 947–950. [Google Scholar] [CrossRef]
  52. Swendseid, M.E.; Villalobos, J.; Friedrich, B. Ratios of Essential-to-Nonessential Amino Acids in Plasma from Rats Fed Different Kinds and Amounts of Proteins and Amino Acids. J. Nutr. 1963, 80, 99–102. [Google Scholar] [CrossRef]
  53. Pinto, J.F.; Nunes, M.L.; Cardoso, C. Feeding interruption and quality of cultured gilthead sea bream. Food Chem. 2007, 100, 1504–1510. [Google Scholar] [CrossRef]
  54. Alam, M.D.; Karim, S.H.M.; Chakrabortty, A.; Amin, R.; Hasan, S. Nutritional Characterization of the Long-Whiskered Catfish Sperata aor: A Commercially Important Freshwater Fish of Bangladesh. Int. J. Food Sci. Nutr. Eng. 2016, 6, 1–8. [Google Scholar] [CrossRef]
  55. Ackman, R.G. Nutritional composition of fats in seafoods. Prog. Food Nutr. Sci. 1989, 13, 161–289. [Google Scholar] [PubMed]
  56. Islam, R.; Paul, D.K.; Rahman, A.; Parvin, T.; Islam, D.; Sattar, A. Comparative Characterization of Lipids and Nutrient Contents of Pangasius Pangasius and Pangasius sutchi Available in Bangladesh. J. Nutr. Food Sci. 2012, 2, 1–6. [Google Scholar] [CrossRef] [Green Version]
  57. Weber, P.C.; Sellmayer, A. S-3-4 Cardiovascular Effects of N-3 Fatty Acids. J. Nutr. Sci. Vitaminol. 1992, 38, 144–147. [Google Scholar] [CrossRef]
  58. Özyurt, G.; Polat, S.; Özkütük, S. Seasonal changes in the fatty acids of gilthead sea bream (Sparus aurata) and white sea bream (Diplodus sargus) captured in Iskenderun Bay, eastern Mediterranean coast of Turkey. Eur. Food Res. Technol. 2005, 220, 120–124. [Google Scholar] [CrossRef]
  59. Bang, H.O.; Dyerberg, J.; Sinclair, H.M. The composition of the Eskimo food in north Western Greenland. Am. J. Clin. Nutr. 1980, 33, 2657–2661. [Google Scholar] [CrossRef] [Green Version]
  60. Thammapat, P.; Raviyan, P.; Siriamornpun, S. Proximate and fatty acids composition of the muscles and viscera of Asian catfish (Pangasius bocourti). Food Chem. 2010, 122, 223–227. [Google Scholar] [CrossRef]
  61. Erkkilä, A.; De Mello, V.D.F.; Risérus, U.; Laaksonen, D.E. Dietary fatty acids and cardiovascular disease: An epidemiological approach. Prog. Lipid Res. 2008, 47, 172–187. [Google Scholar] [CrossRef]
  62. Kulawik, P.; Migdał, W.; Tkaczewska, J.; Gambu, F.; Szczurowska, K.; Özoğul, F. Nutritional composition of frozen fillets from Pangasius catfish (Pangasius hypophthalmus) and Nile tilapia (Oreochromis nilotcus) imported to European countries. Ann. Anim. Sci. 2016, 16, 931–950. [Google Scholar] [CrossRef] [Green Version]
  63. Diraman, H.; Dibeklioglu, H. Chemometric characterization and classification of selected freshwater and marine fishes from turkey based on their fatty acid profiles. J. Am. Oil Chem. Soc. 2009, 86, 235–246. [Google Scholar] [CrossRef]
  64. Özogul, Y.; Özogul, F.; Çiçek, E.; Polat, A.; Kuley, E. Fat content and fatty acid compositions of 34 marine water fish species from the Mediterranean Sea. Int. J. Food Sci. Nutr. 2009, 60, 464–475. [Google Scholar] [CrossRef]
  65. Usydus, Z.; Szlinder-Richert, J.; Adamczyk, M.; Szatkowska, U. Marine and farmed fish in the Polish market: Comparison of the nutritional value. Food Chem. 2011, 126, 78–84. [Google Scholar] [CrossRef]
  66. Simopoulos, A.P. Omega-3 fatty acids in inflammation and autoimmune diseases. J. Am. Coll. Nutr. 2002, 21, 495–505. [Google Scholar] [CrossRef] [PubMed]
  67. Moreira, A.B.; Visentainer, J.V.; De Souza, N.E.; Matsushita, M. Fatty acids profile and cholesterol contents of three Brazilian Brycon freshwater fishes. J. Food Compos. Anal. 2001, 14, 565–574. [Google Scholar] [CrossRef]
  68. Orban, E.; Nevigato, T.; Di Lena, G.; Masci, M.; Casini, I.; Gambelli, L.; Caproni, R. New trends in the seafood market. Sutchi catfish (Pangasius hypophthalmus) fillets from Vietnam: Nutritional quality and safety aspects. Food Chem. 2008, 110, 383–389. [Google Scholar] [CrossRef]
  69. Turan, H. Fatty acid profile and proximate composition of the thornback ray (Raja clavata L. 1758) from the Sinop coast in the Black Sea. J. Fish. Sci. 2007, 1, 97–103. [Google Scholar] [CrossRef]
  70. Tonial, I.B.; Oliveira, D.F.; Coelho, A.R.; Matsushita, M.; Coró, F.A.G.; De Souza, N.E.; Visentainer, J.V. Quantification of Essential Fatty Acids and Assessment of the Nutritional Quality Indexes of Lipids in Tilapia Alevins and Juvenile Tilapia Fish (Oreochromis niloticus). J. Food Res. 2014, 3, 105. [Google Scholar] [CrossRef]
  71. Abrami, G.; Natiello, F.; Bronzi, P.; McKenzie, D.; Bolis, L.; Agradi, E. A comparison of highly unsaturated fatty acid levels in wild and farmed eels (Anguilla Anguilla). Comp. Biochem. Physiol.-B 1992, 101, 79–81. [Google Scholar] [CrossRef]
  72. Stancheva, M.; Merdzhanova, A.; Dobreva, D.A.; Makedonski, L. Common Carp (Cyprinus caprio) and European Catfish (Sillurus glanis) from the Danube River as Sources of Fat Soluble Vitamins and Fatty Acids. Czech J. Food Sci. 2014, 32, 16–24. [Google Scholar] [CrossRef]
Figure 1. Geographical location of the sampling points of wild and farmed pangasius catfish.
Fishes 07 00309 g001
Figure 2. Total essential amino acids (ΣEAA), non-essential amino acids (ΣNEAA), and the ratio of ΣEAA/ΣNEAA compounds in g/100 g in the wild and the farmed pangasius. Data were subjected to multiple unpaired t-test and significant level was set at p < 0.05. Asterisks (**) indicate significant difference and ns, non-significant.
Fishes 07 00309 g002
Figure 3. Variations in lipid quality indices of atherogenicity index (AI); thrombogenicity index (TI); hypocholesterolemic: hypercholesterolemic (HH); and flesh lipid quality (FLQ) ratio of the muscles in wild and farmed pangasius. Data were subjected to multiple unpaired t-test and significant level set at p < 0.05. Asterisk (*) indicates highly significant difference and ns, non-significant.
Fishes 07 00309 g003
Table 1. Proximate composition (g/100 g wet weight basis) in the muscle of the wild and the farmed pangasius catfish.
Parameters (%)Wild PangasiusFarmed Pangasiusp-Value
Moisture79.49 ± 0.0975.05 ± 0.09<0.0001
Protein14.36 ± 0.0620.19 ± 0.06<0.0001
Lipid3.74 ± 0.092.11 ± 0.4<0.0001
Ash0.73 ± 0.020.52 ± 0.3<0.001
Carbohydrate1.05 ± 0.041.23 ± 0.070.017
Values are mean ± SD of the mean (n = 18) samples and are significantly different at (p < 0.05).
Table 2. Amino acid compositions of the wild and the farmed pangasius catfish muscles (g/100 g of total amino acids; wet basis).
ParametersWild PangasiusFarmed Pangasiusp-Value
Methionine0.52 ± 0.020.38 ± 0.01<0.0001
Threonine0.81 ± 0.030.59 ± 0.02<0.0001
Valine0.88 ± 0.030.62 ± 0.02<0.0001
Isoleucine0.79 ± 0.020.58 ± 0.02<0.0001
Histidine0.49 ± 0.050.34 ± 0.010.005
Lysine1.48 ± 0.031.07 ± 0.02<0.0001
Leucine1.20 ± 0.020.87 ± 0.01<0.0001
Arginine0.89 ± 0.030.65 ± 0.02<0.0001
Glycine1.85 ± 0.021.36 ± 0.03<0.0001
Tyrosine0.63 ± 0.020.45 ± 0.03<0.001
Alanine1.10 ± 0.030.79 ± 0.03<0.0001
Aspartic acid1.38 ± 0.030.98 ± 0.02<0.0001
Serine0.76 ± 0.020.51 ± 0.03<0.0001
Glutamic acid0.86 ± 0.030.60 ± 0.03<0.0001
Values are mean ± SD of the mean (n = 3) samples and are significantly different at (p < 0.05).
Table 3. Comparison of wild and farmed pangasius catfish amino acid contents mg/g to the amino acid requirements of infants and children of different age groups, based on FAO (2013) standard.
Amino Acids (mg/g)Infant
(0–6 Month)
Child
(6 Month–3 Years)
Old Child, Adolescent, AdultWild PangasiusFarmed Pangasiusp-Value
His.2120164.92 ± 0.453.42 ± 0.100.0050
Ile.5532307.93 ± 0.195.80 ± 0.17<0.0001
Leu.96666112.03 ± 0.228.73 ± 0.06<0.0001
Lys.69574814.81 ± 0.2510.72 ± 0.24<0.0001
Met. + Cys. *3327235.21 ± 0.193.77 ± 0.12<0.0001
Phe. + Tyr. *9452416.24 ± 0.074.37 ± 0.12<0.0001
Thr.4431258.11 ± 0.255.90 ± 0.17<0.0001
Trp. *178.56.6---
Val.5543408.82 ± 0.316.20 ± 0.17<0.0001
* Only the values of wild and farmed pangasius were considered for statistical validation and other values were treated as reference. Values are mean ± SD of the mean (n = 3) samples and are significantly different at p < 0.05.
Table 4. Comparison of the fatty acids compositions (g/100 g of total fatty acids; wet basis) of wild and farmed pangasius catfish.
NutrientsFatty AcidsWild PangasiusFarmed Pangasiusp-Value
Saturated fatty acid (SFA)C14:0, Myristic acid5.68 ± 0.062.79 ± 0.04<0.0001
C16:0, Palmitic Acid29.17 ± 0.0934.46 ± 0.16<0.0001
C18:0, Stearic Acid6.47 ± 0.045.90 ± 0.04<0.0001
C20:0, Arachidic AcidND 0.55 ± 0.05 <0.0001
C24:0, Lignoseric Acid2.50 ± 0.040.40 ± 0.03<0.0001
Monounsaturated fatty acid (MUFA)C16:1, Palmitoleic acid18.36 ± 0.04 ND <0.0001
C18:1, Oleic acid27.35 ± 0.0843.27 ± 0.09<0.0001
C20:1, Eicosenoic acid1.85 ± 0.031.15 ± 0.05<0.0001
Polyunsaturated fatty acid (PUFA)C18:2, Linoleic Acid0.57 ± 0.0410.06 ± 0.03<0.0001
C18:3, Linolenic Acid0.45 ± 0.020.34 ± 0.040.013
C20:5, EPA2.72 ± 0.03 ND <0.0001
C22:6, DHA4.89 ± 0.031.07 ± 0.01<0.0001
Values are mean ± SD of the mean of triplicated samples are significantly different at (p < 0.05). ND, not determined.
Table 5. Fatty acid profiles (g/100 g of total fatty acids; wet basis) and ratios estimated from lipids of the wild and the farmed pangasius catfish.
Fatty AcidsWild PangasiusFarmed Pangasiusp-Value
ΣSFA43.82 ± 0.0344.10 ± 0.300.181
ΣUFA56.18 ± 0.1455.89 ± 0.150.065
ΣMUFA47.56 ± 0.0444.42 ± 0.13<0.0001
ΣPUFA8.62 ± 0.1111.47 ± 0.03<0.0001
ω-38.06 ± 0.071.41 ± 0.05<0.0001
ω-60.57 ± 0.0410.06 ± 0.03<0.0001
ΣPUFA/ΣSFA0.20 ± 0.0020.26 ± 0.001<0.0001
ω-6/ω-30.07 ± 0.007.14 ± 0.29<0.0001
ω-3/ω-614.14 ± 0.9250.14 ± 0.006<0.0001
EPA + DHA7.61 ± 0.061.07 ± 0.01<0.0001
DHA/EPA1.79 ± 0.009--
EPA/DHA0.56 ± 0.003-<0.0001
Values are mean ± SD of the mean of triplicated samples are significantly different at (p < 0.05).
Table 6. Fatty acid composition (wet basis) as total fatty acids in mg/100 g and nutritional contribution of wild pangasius versus farmed pangasius for human consumption.
Fatty AcidsWild PangasiusFarmed Pangasiusp-Value
Dietary levels (mg/100 g wet)
LA566.67 ± 23.3310056.67 ± 17.64<0.0001
EPA2723.33 ± 17.64ND-
DHA4886.67 ± 18.561073.33 ± 6.67<0.0001
DHA/EPA1.79 ± 0.010.00<0.0001
Σ EPA + DHA7610.00 ± 36.061073.33 ± 6.67<0.0001
Dietary reference intake (mg/day)
LA13001300-
ΣEPA + DHA500500-
Nutritional contribution for human consumption
LA (%) 98.95 ± 4.071756.05 ± 3.08<0.0001
∑EPA + DHA (%)345.49 ± 1.6448.73 ± 0.30<0.0001
Values are mean ± SD of the mean of triplicated samples are significantly different at (p < 0.05); ND—Not Detected.
Publisher’s Note: MDPI stays neutral with regard to jurisdictional claims in published maps and institutional affiliations.

