Article

Histological and Transcriptomic Profiling Reveals Metabolic and Immune Responses to Ammonia Stress in Scatophagus argus

Jiangsu Key Laboratory of Marine Biotechnology, Jiangsu Ocean University, Lianyungang 222005, China
*
Author to whom correspondence should be addressed.
Fishes 2025, 10(8), 412; https://doi.org/10.3390/fishes10080412
Submission received: 6 July 2025 / Revised: 4 August 2025 / Accepted: 12 August 2025 / Published: 15 August 2025

Abstract

Ammonia is widely regarded as the primary chemical pollutant responsible for fish toxicity in aquaculture. Scatophagus argus is an economically important euryhaline species extensively cultured in marine aquaculture. To investigate its physiological responses and molecular mechanisms under ammonia exposure, we determined the 96 h median lethal concentration (LC50-96 h) of total ammonia nitrogen (TAN) for S. argus juveniles. Histopathological analyses were conducted at TAN concentrations of 0 (control), 30, and 60 mg/L, with transcriptomic analysis performed at 0 and 60 mg/L. The results showed that the LC50-96 h for S. argus was 59.43 mg/L. Histological analysis revealed lamellar epithelial detachment and hepatocyte vacuolization in S. argus exposed to 60 mg/L TAN, indicating substantial structural impairment under ammonia stress. Transcriptomic profiling identified 245 differentially expressed genes (DEGs), comprising 142 upregulated and 103 downregulated genes. KEGG enrichment analysis indicated that DEGs were primarily enriched in energy metabolism and immune-related pathways. Key genes involved in glucose metabolism, amino acid metabolism, and cellular regulation (e.g., PFKM, PGM1, MAT2A, DDIT4) were significantly upregulated in energy metabolism pathways. In immune-related pathways, immune regulatory genes such as GIMAP4 and ARRDC3 were upregulated, while NAMLAA, associated with inflammatory modulation, was downregulated. Collectively, these transcriptional changes suggest that S. argus responds to external ammonia stress through coordinated regulation of energy metabolism and immune function. This study provides novel insights into the physiological and molecular strategies employed by S. argus in response to ammonia toxicity, offering a reference for environmental risk assessment and aquaculture management.
Key Contribution: Energy metabolism and immune function are regulated to counteract acute ammonia stress in Scatophagus argus.

1. Introduction

Ammonia is a common metabolic waste product in intensive aquaculture systems, primarily originating from uneaten feed, fish excretion, and microbial decomposition of organic matter [1,2]. In seawater, it exists as a mixture of un-ionized ammonia (NH3) and ionized ammonium (NH4+), collectively termed total ammonia nitrogen (TAN) [3,4]. Elevated ammonia levels disrupt energy metabolism, ion regulation, and the acid–base balance and compromise nervous and immune functions [5,6]. These physiological disturbances cumulatively impair growth and can be lethal to aquatic animals [7]. Previous studies have reported species-specific sensitivity to ammonia in various fish, such as Hypophthalmichthys nobilis [8], Siniperca chuatsi [9], and Oncorhynchus mykiss [10], providing fundamental insights into toxicity thresholds and physiological disruption caused by elevated environmental ammonia.
Physiologically, fish can tolerate a certain amount of ammonia exposure by modulating ammonia excretion and detoxification processes. In teleosts, the primary ammonia detoxification strategies involve converting ammonia into glutamine and its active excretion via gill transporters, while urea synthesis may serve as a supplementary pathway under specific stress conditions [11,12]. However, excessive environmental ammonia not only hinders endogenous ammonia excretion but also increases its uptake through the gills, leading to dual toxic stress [13].
Scatophagus argus, commonly known as the spotted scat, is a warm-water euryhaline species with high nutritional and economic value, widely cultivated in southern China [14]. This species exhibits strong adaptability to salinity fluctuations and is often cultured in coastal estuarine regions [15]. In recent years, aquaculture of S. argus has expanded significantly in China, owing to its fast growth, omnivorous diet, and ability to tolerate wide ranges of salinity [16,17]. Despite its growing commercial importance, the toxicological effects of ammonia on S. argus and the underlying physiological and molecular response mechanisms remain poorly documented.
To address this knowledge gap, the present study investigates the acute toxicity of ammonia to S. argus, evaluates histopathological changes in gill and liver tissues, and analyzes transcriptomic responses in gill tissue using RNA-Seq. This multi-level approach aims to elucidate the physiological, histological, and transcriptomic responses of S. argus under acute ammonia stress, thereby contributing to a deeper understanding of its stress adaptation strategies and offering theoretical support for environmental management in aquaculture.

2. Materials and Methods

2.1. Fish and Experimental Conditions

Healthy spotted scat (Scatophagus argus) juveniles (mean body length 6.42 ± 0.32 cm; mean weight 9.59 ± 0.16 g) were purchased from a commercial aquaculture farm in Shanwei, Guangdong, China. Before the experiments, all fish were acclimated in laboratory tanks with aerated seawater (temperature 25 ± 0.5 °C, salinity 25 ppt, dissolved oxygen ≥ 8.0 mg/L, pH 8.1 ± 0.1) for one week. During acclimation, fish were fed twice daily, and 50% of the water was renewed every day. The ammonia stock solution was prepared by dissolving ammonium chloride (NH4Cl) in seawater to a concentration of 10 g/L and diluted to desired experimental concentrations as needed.

2.2. Acute Toxicity Test

Based on preliminary experiments, five TAN concentrations (55, 59.4, 64.19, 69.39, and 74.98 mg/L) were set, along with a control group. Each group included three replicates with 15 fish per replicate, placed in 60 cm × 45 cm × 45 cm glass aquaria. The exposure lasted for 96 h, and mortality was recorded at 24, 48, 72, and 96 h. Dead fish were removed immediately. Water quality parameters were maintained as during acclimation. The TAN concentration was measured every 6 h using the Nessler’s reagent spectrophotometric method.
The 96 h median lethal concentration (LC50) was determined via Probit regression analysis (SPSS 27.0). The safe concentration (SC) was defined as 10% of LC50. The un-ionized ammonia (NH3) concentration was calculated using the following equation:
NH3 = TAN/(10^(pKa − pH) + 1)
where pKa = 0.09018 + 2729.92/T, and T = 273.15 + t, with t being the water temperature (°C).

2.3. Histological Observation

To evaluate histological alterations, experimental groups were exposed to TAN concentrations of 0, 30, and 60 mg/L, with three biological replicate groups per concentration. From each replicate group, three fish were randomly selected, resulting in nine fish per concentration group (n = 9). After 96 h of exposure, gill and liver tissues were collected from three fish per replicate. Fish were anesthetized using tricaine methanesulfonate (MS-222, 100 mg/L) prior to sampling. Samples were fixed in 4% paraformaldehyde for 24 h, transferred to 70% ethanol, and stored at 4 °C until processing. Tissue dehydration, paraffin embedding, and sectioning were performed following standard procedures, as previously reported [18]. Sections were stained using hematoxylin and eosin (H&E), and microscopic images were captured at 400× magnification (10 × ocular × 40 × objective lens) and edited using Photoshop 2023. Gill and liver sections were microscopically examined for histopathological alterations based on established criteria in fish toxicology. The severity of tissue damage was assessed qualitatively according to the extent of morphological disruption.

2.4. Transcriptome Analysis

2.4.1. Sample Collection and RNA Extraction

After 6 h of ammonia exposure, three fish were randomly selected from the control (0 mg/L) and high-concentration (60 mg/L) groups. Fish were anesthetized with MS-222 (100 mg/L), and gill tissues were immediately excised, flash-frozen in liquid nitrogen, and stored at −80 °C until RNA extraction. Total RNA was extracted using TRIzol reagent (Life technologies, Carlsbad, CA, USA) following the manufacturer’s instructions. RNA quality and integrity were assessed using a NanoDrop 2000 spectrophotometer (Thermo Fisher Scientific, Wilmington, DE, USA) and Agilent 2100 Bioanalyzer (Agilent Technologies, Santa Clara, CA, USA).

2.4.2. cDNA Library Preparation and Sequencing

cDNA libraries were constructed using the Hieff NGS Ultima Dual-mode mRNA kit (Yeasen, Shanghai, China). Paired-end sequencing (150 bp, PE150) was conducted on the Illumina NovaSeq 6000 platform. Raw reads were filtered to remove adapters, poly-N reads, and low-quality sequences. Clean reads were aligned to the reference genome (S. argus) using HISAT2(v2.0.4, Johns Hopkins University, Baltimore, MD, USA).

2.4.3. Differential Expression and Enrichment Analysis

Gene expression levels were calculated using FPKMs (Fragments Per Kilobase of transcript per Million fragments mapped). DESeq2(v1.30.1, European Molecular Biology Laboratory, Heidelberg, Germany) was used to identify differentially expressed genes (DEGs), with |log2 fold change| ≥ 1 and p < 0.01 as the threshold. DEGs were annotated using multiple databases including COG, GO, and KEGG. Functional enrichment analyses were performed to explore affected pathways under ammonia stress.

2.4.4. qRT-PCR Validation

To validate RNA-seq results, 10 DEGs (5 upregulated and 5 downregulated) were selected for qRT-PCR analysis using β-actin as the internal reference gene. Total RNA was extracted from six fish samples (n = 3 per group, control and 60 mg/L TAN). Reverse transcription was performed using the HiScript III RT SuperMix kit (Vazyme, Nanjing, China). Quantitative PCR was conducted using SYBR Green Master Mix on a Roche LightCycler 96 system. Relative expression levels were calculated using the 2−ΔΔCt method. Primer sequences are listed in Table 1.

2.5. Ethical Statement

The experiments were carried out in compliance with the committee at Jiangsu Ocean University. All tissues were removed under MS-222 anesthesia, and all efforts were made to minimize fish suffering.

3. Results

3.1. Acute Toxicity of Ammonia to Scatophagus argus

In this study, the 96 h median lethal concentration (LC50-96 h) and safe concentration (SC) of TAN and non-ionized ammonia (NH3) for S. argus were determined by Probit regression analysis. As shown in Table 2, the LC50-96 h and SC values of TAN were 59.43 mg/L and 5.94 mg/L, respectively, with a 95% confidence interval of 58.27–60.61 mg/L. The corresponding LC50-96 h and SC values of NH3 were calculated to be 3.93 mg/L and 0.39 mg/L

3.2. Histological Changes in the Gill and Liver of Scatophagus argus Under Ammonia Stress

3.2.1. Gill Morphology

Histological examination revealed significant morphological changes in the gill of S.argus after 96 h of exposure to different concentrations of TAN (Figure 1). In the control group (0 mg/L), the gill filaments and secondary lamellae were well-organized, with tightly arranged blood cells and chloride cells and no apparent signs of tissue damage.
In the 30 mg/L group, moderate structural changes were observed, including slight bending of the secondary lamellae, epithelial cell detachment, and mild cellular vacuolation. In the 60 mg/L group, the degree of tissue damage was further aggravated, characterized by pronounced lamellar curling, enlargement and shortening of the secondary lamellae, increased epithelial shedding, and severe cellular vacuolation.

3.2.2. Liver Histopathology

Microscopic observations of liver tissues also revealed concentration-dependent structural changes (Figure 2). In the control group, hepatocytes exhibited normal morphology with clear nuclei and compact cellular arrangement. At 30 mg/L TAN, mild histopathological changes were noted, such as sinusoidal dilation and slight nuclear displacement.
In contrast, liver tissues in the 60 mg/L TAN group showed extensive vacuolation of hepatocytes, severe sinusoidal dilation, nuclear pyknosis, and disorganization of hepatic cellular structure. The presence of necrotic hepatocytes and blurred cell boundaries further suggested that high ammonia exposure induced marked structural damage in the liver of S. argus.

3.3. Transcriptomic Response of Scatophagus argus Gills to Ammonia Stress

3.3.1. Sequencing Quality and Mapping Statistics

In this study, transcriptome sequencing was conducted on the control group (An0) and ammonia-stressed group (An60) in triplicate to investigate the molecular responses of S. argus gill tissues to TAN exposure. A total of 124,848,503 clean reads were obtained after stringent quality control, including 21,332,348, 19,319,538, and 19,690,111 reads in the control group and 21,218,424, 21,061,737, and 22,226,345 reads in the treatment group. The average GC content and Q30 values across all samples were 46.59% and 93.82%, respectively (Table 3). All clean reads were aligned to the reference genome of S. argus (accession number: GWHAOSK00000000.1), with mapping rates ranging from 84.76% to 87.94% across the six samples, confirming the reliability of the sequencing data for downstream transcriptomic analysis.

3.3.2. Identification of Differentially Expressed Genes

Differential expression analysis between the control and TAN-stressed groups revealed a total of 245 differentially expressed genes (DEGs), including 142 upregulated and 103 downregulated genes (adjusted p < 0.01, |log2FC| ≥ 1). The volcano plot in Figure 3A illustrates the distribution of DEGs, where red and blue dots represent significantly upregulated and downregulated genes, respectively.
Hierarchical clustering was performed to visualize the expression patterns of DEGs across samples. The heatmap (Figure 3B) shows that DEGs were clearly grouped by treatment condition, indicating distinct transcriptomic responses to ammonia exposure. The clustering patterns further support the reliability of the RNA-seq data and the effectiveness of the experimental design in capturing the molecular impact of TAN stress on S. argus gill tissue.

3.3.3. Functional Enrichment Analysis of DEGs

A total of 229 DEGs were annotated across multiple functional databases, including 64 in COG, 201 in GO, and 207 in KEGG.
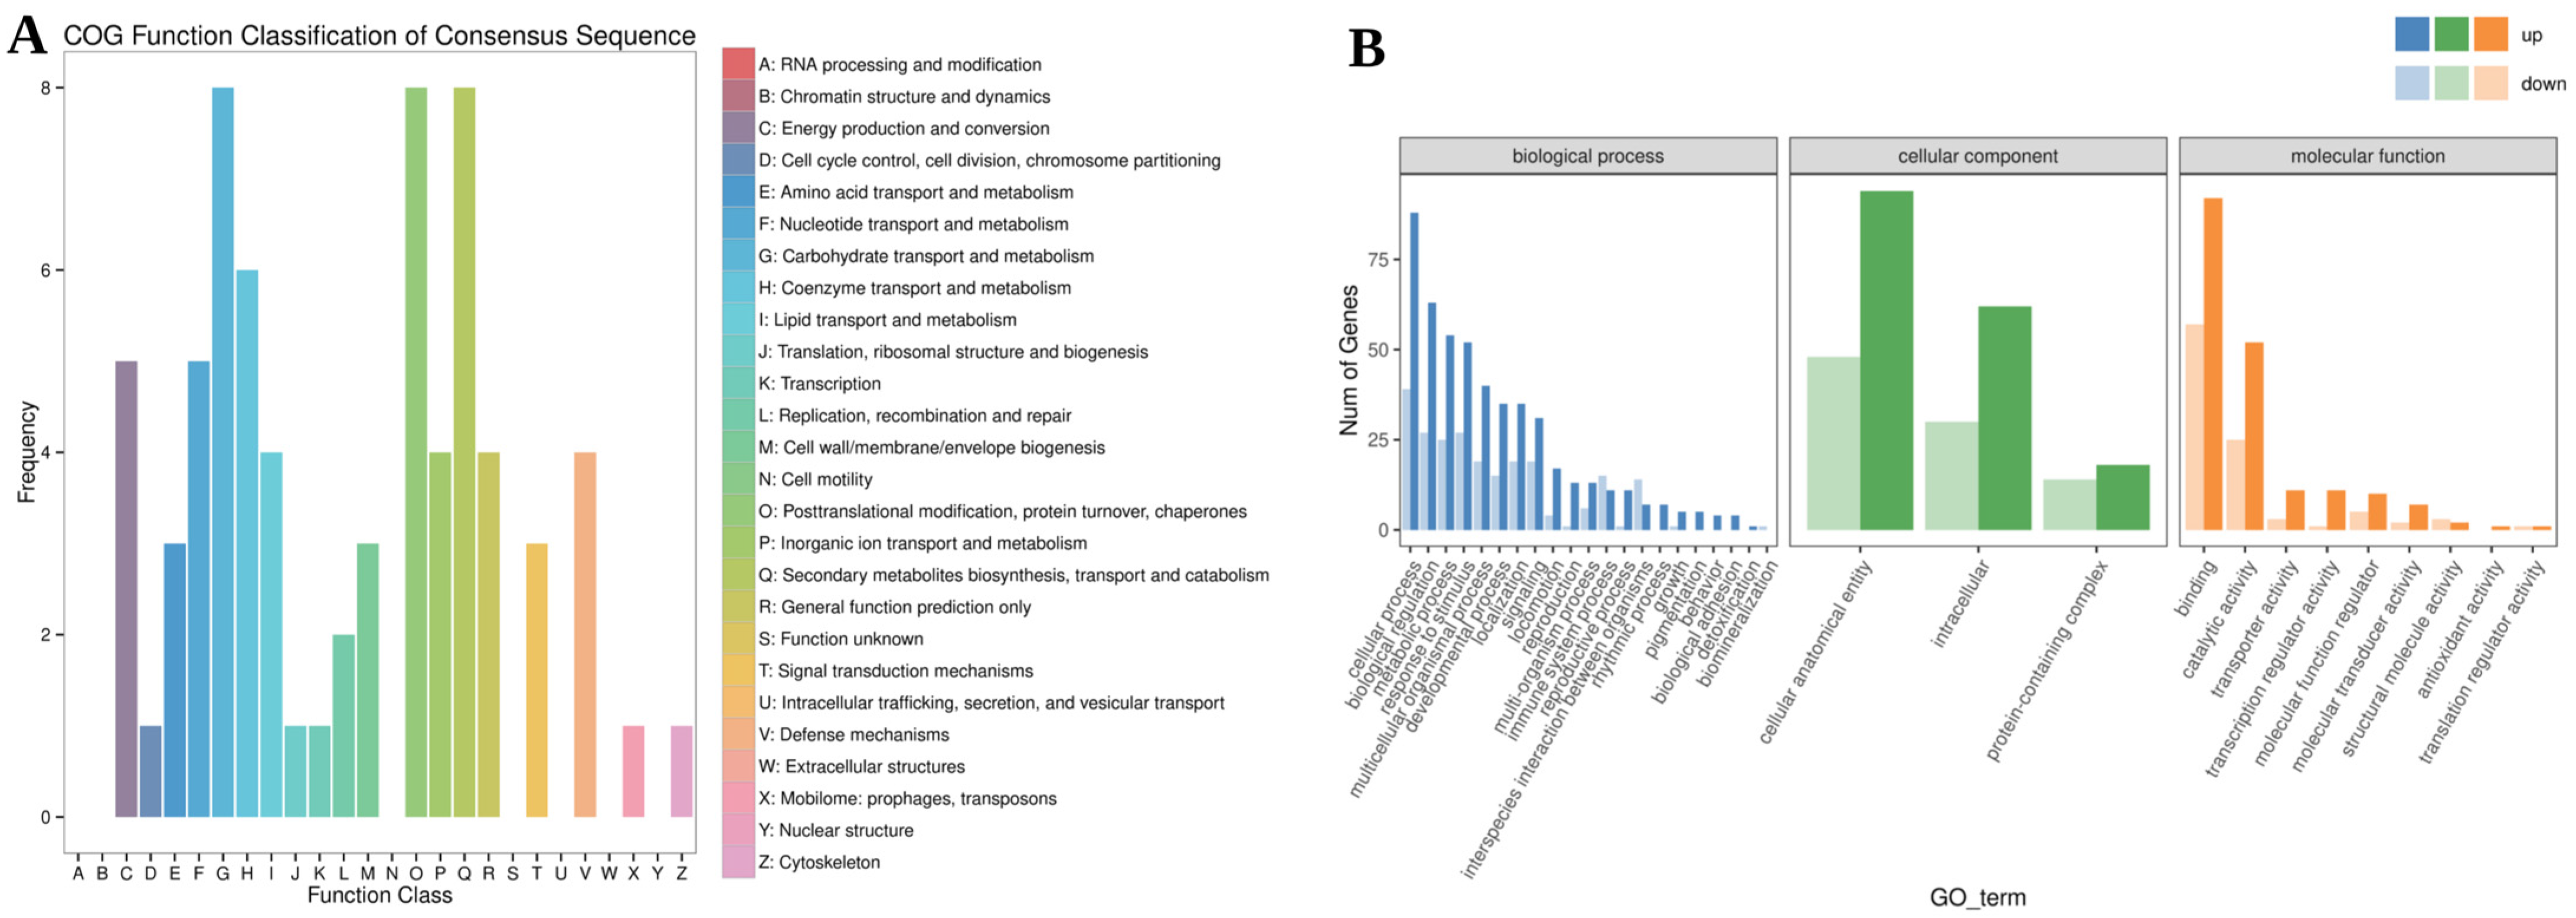
COG classification assigned 64 DEGs to 19 functional groups (Figure 4A), with the most abundant categories being “Secondary metabolites biosynthesis, transport and catabolism”, “Carbohydrate transport and metabolism”, and “Posttranslational modification, protein turnover, chaperones”.
GO enrichment clustered 201 DEGs into the three canonical domains (Figure 4B). In biological processes, DEGs were mainly involved in cellular processes, biological regulation, and metabolic processes; in molecular function, they were enriched in binding and catalytic activity; and in cellular components, they were chiefly associated with intracellular structures and protein-containing complexes.
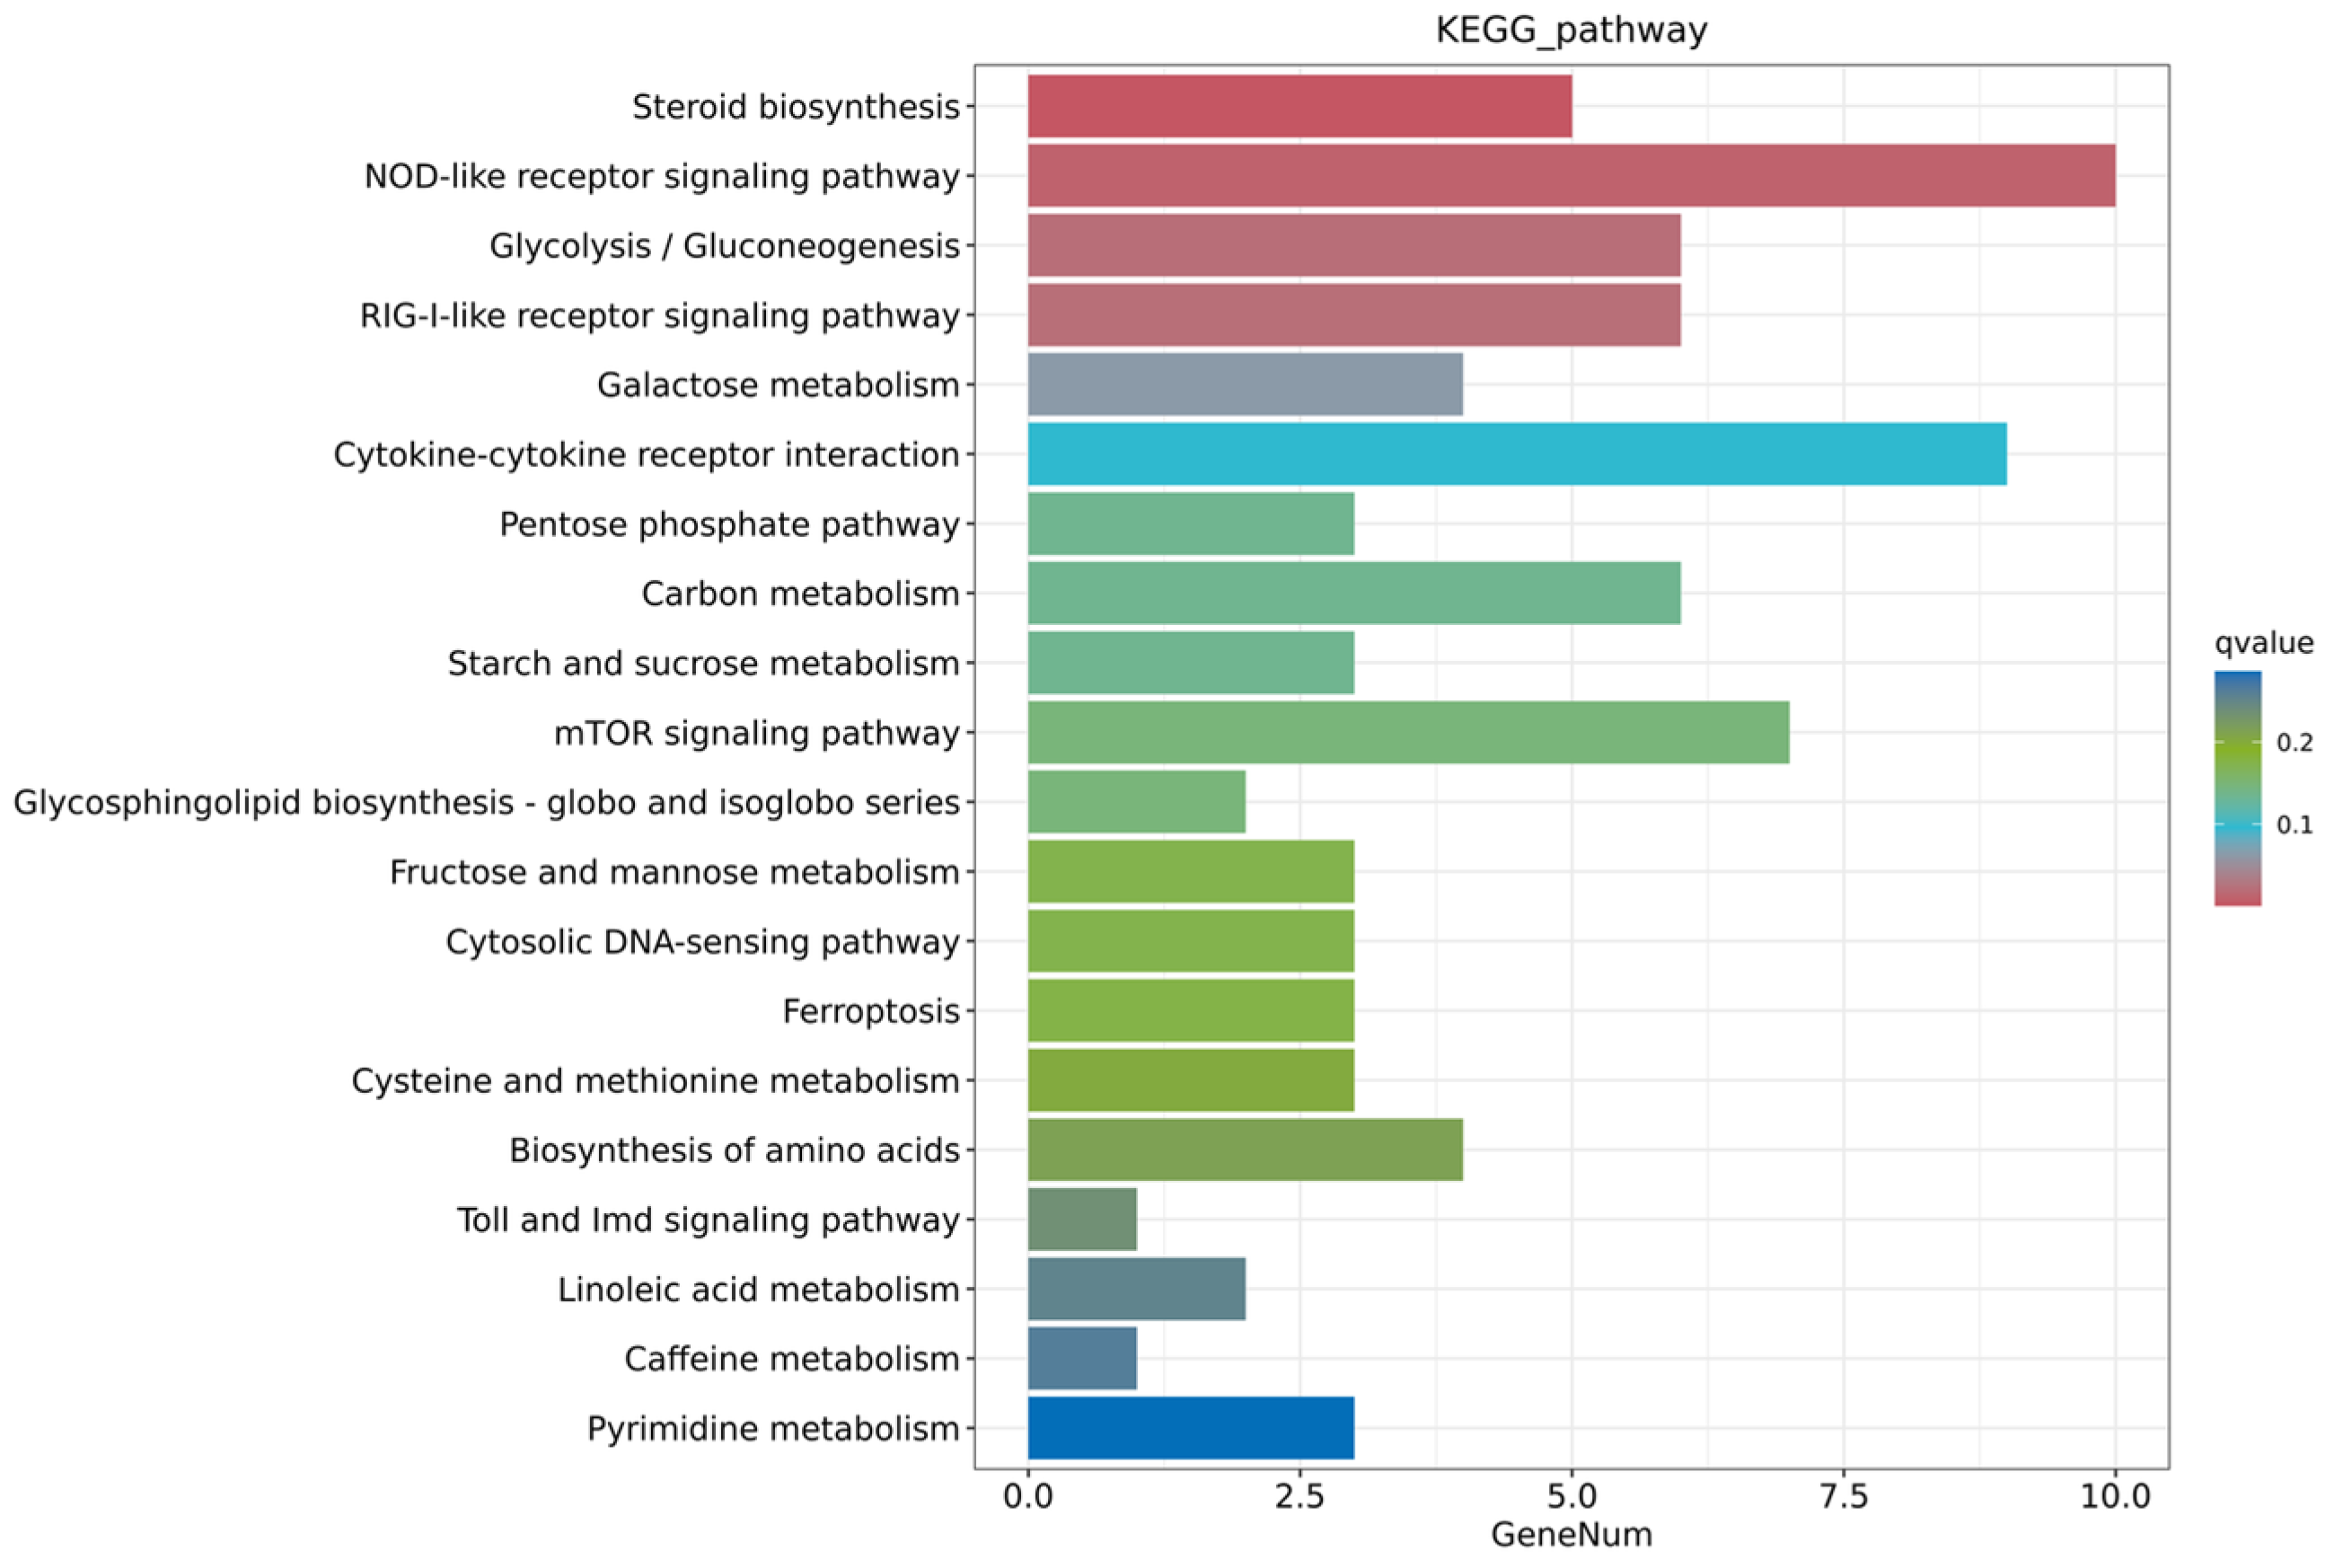
KEGG annotation revealed that 207 DEGs were enriched in 104 pathways (Figure 5). The top enriched pathways included glycolysis/gluconeogenesis, the pentose phosphate pathway, the mTOR signaling pathway, the NOD-like receptor signaling pathway, and the Toll/Imd signaling pathway.

3.3.4. Expression Changes in Representative Energy Metabolism-Related Genes

Transcriptome analysis revealed numerous differentially expressed genes associated with energy metabolism in the gills of S. argus following ammonia exposure. Among these, eight representative genes were selected, and they are summarized in Table 4. Of these, PFKM, GAPDH, PGM1, DDIT4, SDHB, and BHMT1 were upregulated, while MAT2A and MDH1 were downregulated. These genes are associated with glycolysis/gluconeogenesis, the pentose phosphate pathway, the mTOR signaling pathway, the citrate cycle, and amino acid metabolism pathways, including glycine, serine, and threonine metabolism and cysteine and methionine metabolism.

3.3.5. Expression Changes in Representative Immune-Related Genes

Multiple differentially expressed genes related to innate immunity were identified in the gills of S. argus under ammonia stress. Six representative immune-related genes are presented in Table 5. Among them, ARRDC3, GIMAP4, CTSL1, and TNFRSF21 were upregulated, while NAMLAA and STING were downregulated. These genes were enriched in the NOD-like receptor signaling pathway, Toll and Imd signaling pathway, lysosome pathway, and cytokine–cytokine receptor interaction pathway.

3.3.6. Validation of DEGs by qRT-PCR

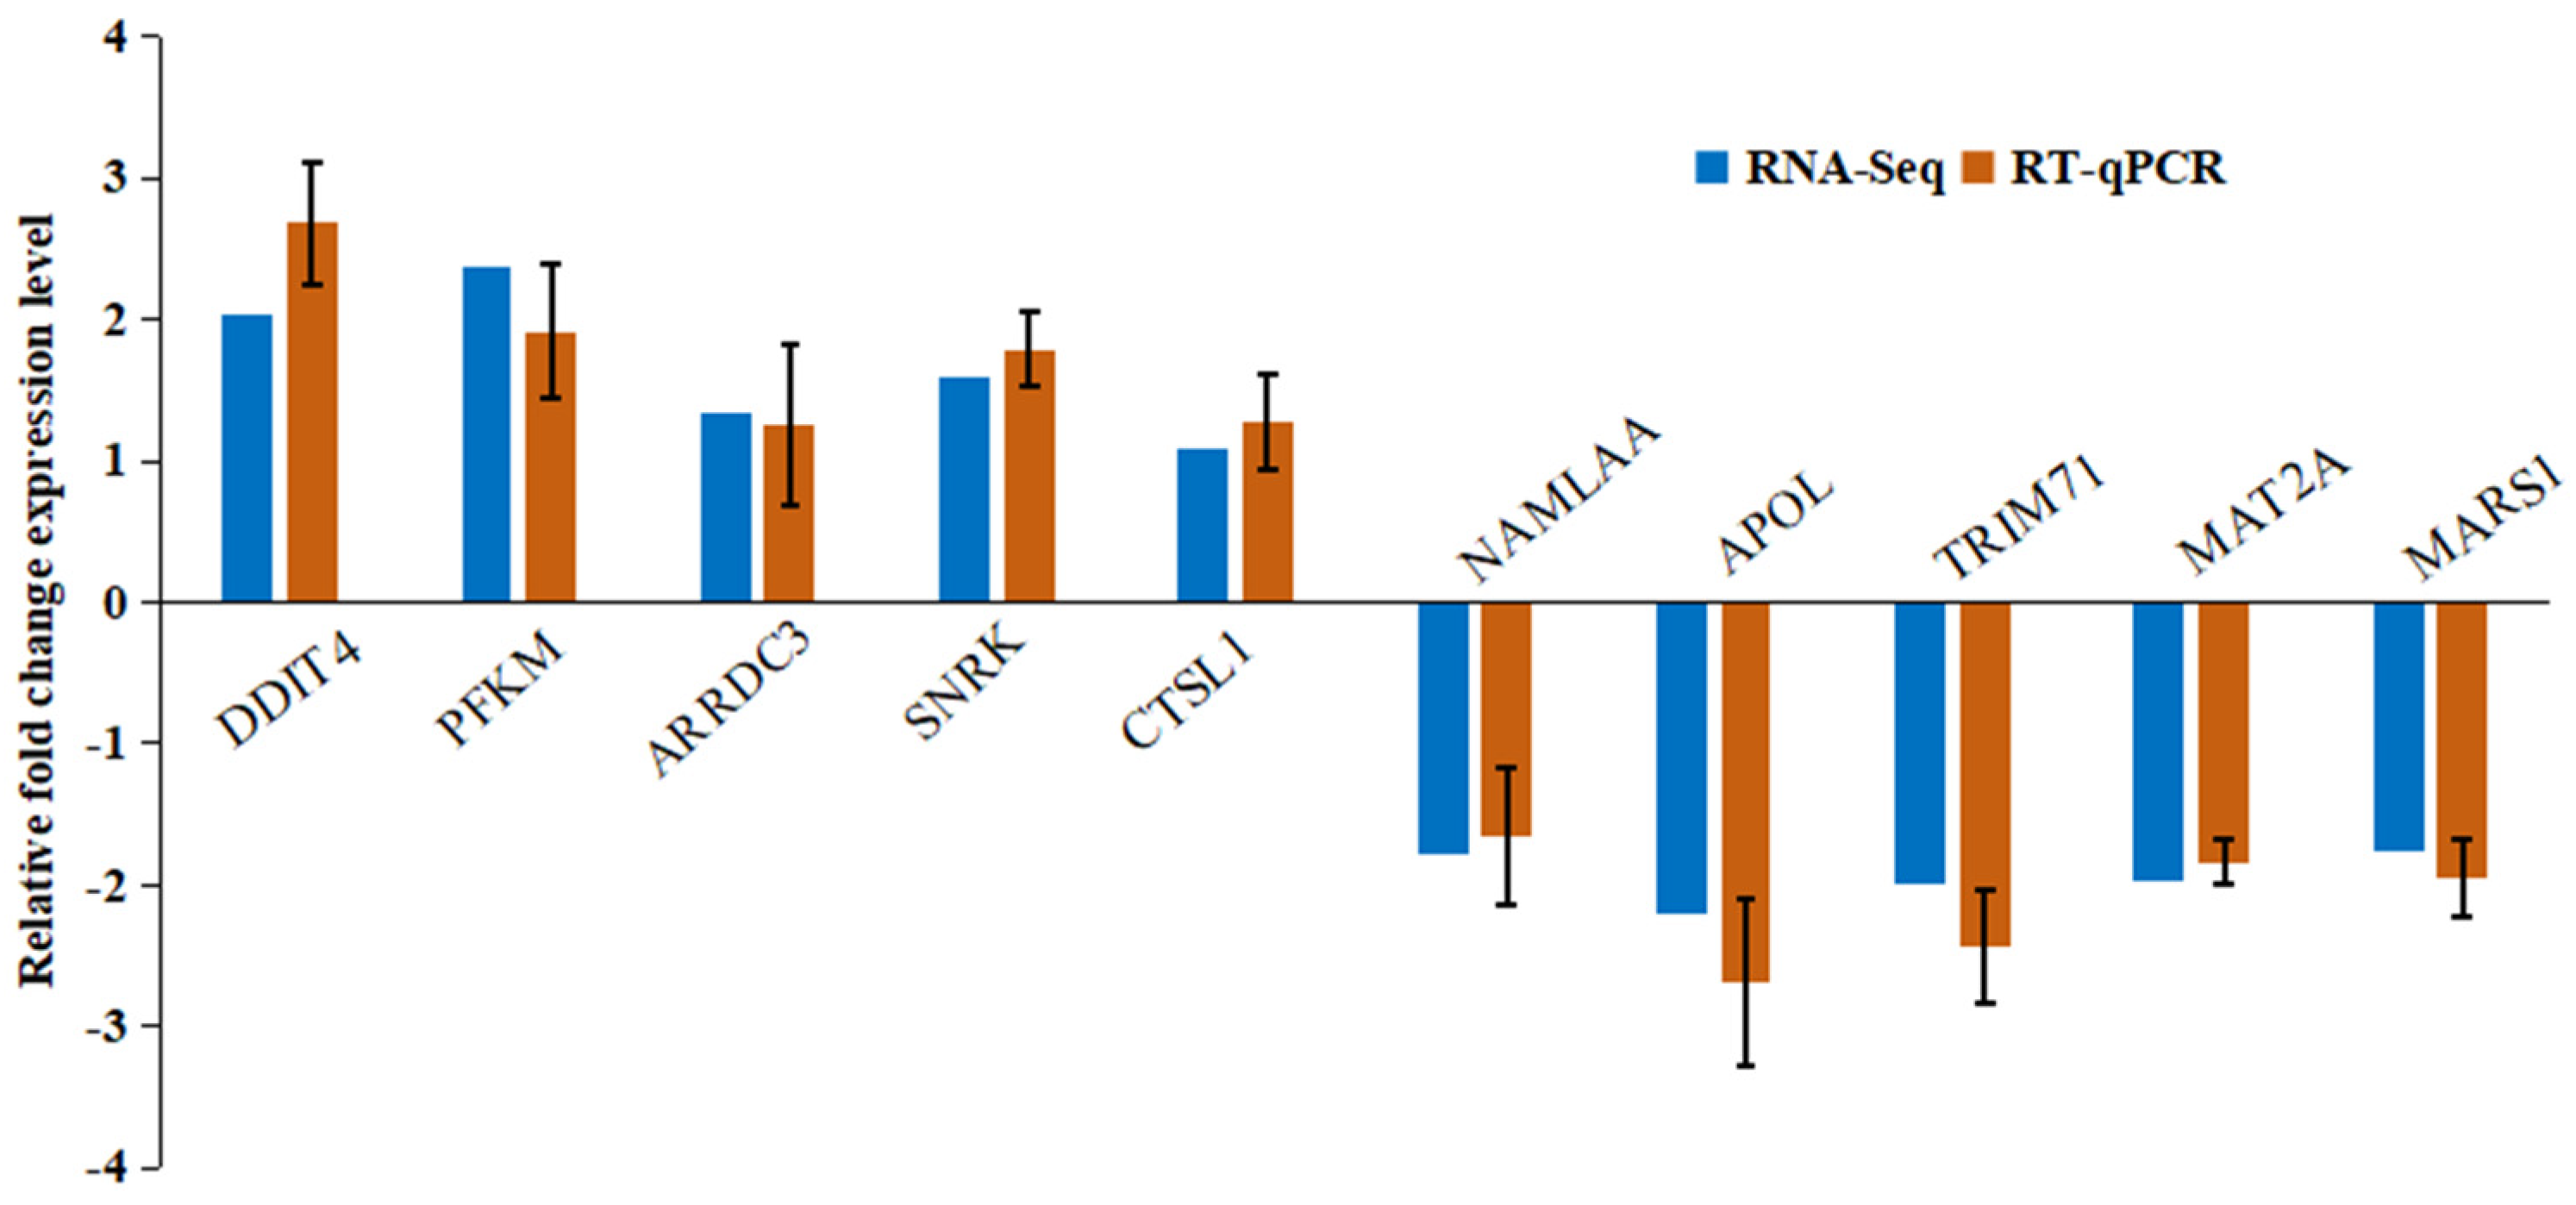
To validate the RNA-seq results, quantitative real-time PCR (qRT-PCR) was performed on ten selected DEGs, including five upregulated and five downregulated genes. β-actin was used as the internal reference gene for normalization.
The qRT-PCR analysis was conducted using RNA extracted from six gill samples (n = 3 per group, control and 60 mg/L TAN), and the results showed that the expression trends of the selected genes were highly consistent with the RNA-seq data, confirming the reliability and accuracy of the transcriptomic analysis (Figure 6).

4. Discussion

Ammonia is a major stressor in aquaculture, and elevated levels pose significant threats to aquatic animals. The reported 96 h LC50 values for TAN in species like Trachinotus ovatus [19], Oreochromis Niloticus [20], Micropterus salmoides [21], and Eleutheronema tetradactylum [22] are typically below 50 mg/L. In this study, the 96 h LC50 of TAN for S. argus was determined to be 59.43 mg/L. Un-ionized ammonia (NH3) is widely recognized as the primary toxic form due to its high membrane permeability and disruptive effects on cellular homeostasis [23,24]. The calculated 96 h LC50 of NH3 for S. argus was 3.93 mg/L. Regarding the safe concentration (SC), exceeding this threshold leads to ammonia accumulation in tissues and potential physiological damage [25]. The SC of TAN for S. argus was estimated at 5.94 mg/L, similar to values reported for Epinephelus coioides [26]. These findings demonstrate considerable interspecific variability in ammonia sensitivity among aquatic species. Compared to the aforementioned species, S. argus exhibited relatively greater tolerance to TAN. This may provide a reference for selective breeding strategies aimed at enhancing ammonia resistance in aquaculture.
The gills, serving as primary sites for gas exchange, osmoregulation, and nitrogenous waste excretion, are highly vulnerable to waterborne pollutants [27,28]. Exposure to 30 mg/L TAN induced mild histological alterations in S. argus gills, including bending and shortening of secondary lamellae. These changes may represent an adaptive response to reduce the contact area with external toxicants, acting as a protective mechanism [29]. At 60 mg/L TAN, severe structural disruptions, such as epithelial detachment and lamellar tip swelling, indicated progressive tissue damage. Similar ammonia-induced gill lesions have been reported in previous studies. Under acute ammonia exposure, Trachinotus ovatus exhibited progressive shortening, curling, and fusion of gill lamellae, accompanied by vacuolization of epithelial and chloride cells [27]. Comparable pathological changes were also observed in Carassius auratus under high-concentration ammonia exposure, including curling and shortening of secondary lamellae, epithelial cell vacuolization, and partial detachment of epithelial cells [30]. The liver, central to metabolism and detoxification, plays a crucial role in physiological adaptation to stressors [18]. Liver tissues of S. argus exhibited concentration-dependent pathological changes under TAN exposure. At 30 mg/L, sinusoidal dilation and mild nuclear displacement occurred, while 60 mg/L exposure resulted in extensive hepatocyte vacuolization, pronounced sinusoidal congestion, and widespread nuclear dissolution. These findings indicate that TAN stress induces progressive hepatic damage in S. argus, with lesion severity increasing at higher concentrations. Similarly, acute ammonia exposure induced hepatic alterations in Verasper variegatus, including hepatocyte vacuolization, sinusoidal dilation, peripheral nuclear positioning, and karyolysis [31]. Under high ammonia concentrations, Megalobrama amblycephala also exhibited hepatic damage, such as karyolysis, peripheral nuclear positioning, and sinusoidal dilation [32]. Although fish livers possess regenerative potential [33,34,35], the exacerbated degeneration observed at high TAN concentrations suggests that acute exposure may surpass the self-repair capacity of S. argus, potentially leading to irreversible injury.
To elucidate the molecular mechanisms of TAN-induced stress, transcriptome sequencing was performed on gill tissues. As the primary organ for gas exchange and osmoregulation, fish gills are highly sensitive to waterborne pollutants [36,37], making gill transcriptomics key for understanding physiological responses. High-quality sequencing data (Q30 > 90%) ensured reliable analysis. A total of 245 DEGs (142 up, 103 down) were identified, with hierarchical clustering clearly distinguishing the treatment groups, reflecting robust transcriptional responses.
Ammonia stress induces fish to adjust energy metabolism to enable adaptation, such as enhanced glycolysis and promotion of anaerobic metabolism [38,39]. KEGG analysis showed significant enrichment of DEGs in glycolysis/gluconeogenesis, the pentose phosphate pathway (PPP), the cysteine and methionine metabolism pathway, and the mTOR signaling pathway, indicating alterations in glucose metabolism, energy production, amino acid metabolism, and cellular regulation. Glycolysis and gluconeogenesis are central to cellular energy homeostasis [40]. Within glycolysis/gluconeogenesis, PFKM, encoding a rate-limiting enzyme (6-phosphofructokinase), was significantly upregulated. PFKM catalyzes a critical step accelerating glycolytic flux [41], suggesting an increased cellular demand for ATP under ammonia stress. The PPP, vital for nucleotide biosynthesis and redox balance [42,43,44], also showed transcriptional activation. PGM1, a key gene in this pathway facilitating glucose-6-phosphate flux into the oxidative PPP branch [45], was significantly upregulated. The co-upregulation of PFKM and PGM1 suggests a coordinated enhancement in glycolysis and the PPP to meet increased energy and redox demands [46]. In addition, the cysteine and methionine metabolism pathway was significantly enriched, highlighting potential shifts in amino acid utilization under stress conditions. Within this pathway, MAT2A was markedly upregulated. MAT2A encodes a key enzyme responsible for S-adenosylmethionine (SAM) synthesis, a critical methyl group donor involved in methylation reactions and antioxidant defense [47]. Its elevated expression under ammonia exposure may indicate an adaptive mechanism to counter redox imbalance and maintain metabolic stability. Furthermore, the mTOR signaling pathway, regulating cellular growth and metabolism, was affected. DDIT4, a stress-responsive inhibitor of mTOR, was significantly upregulated. Induced by stressors like DNA damage and oxidative stress, elevated DDIT4 inhibits mTOR signaling, reducing protein synthesis and energy consumption to facilitate adaptation [48,49]. Collectively, the transcriptional activation of glycolysis/PPP genes and DDIT4-mediated mTOR inhibition indicates that S. argus mounts an integrated metabolic response to cope with ammonia stress.
Alongside metabolic adjustments, ammonia exposure elicited a robust activation of immune-related pathways. DEGs were significantly enriched in the NOD-like receptor (NLR) and Toll/Imd signaling pathways, implicating innate immune regulation and apoptosis. NLRs detect pathogen- and stress-associated molecular patterns, initiating inflammatory responses and modulating immune cell survival [50]. In this study, GIMAP4 and ARRDC3, components of the NLR pathway, were significantly upregulated. GIMAP4, a GTPase involved in lymphocyte survival and apoptosis regulation [51], may facilitate immune cell turnover or selective apoptosis to maintain homeostasis. ARRDC3, implicated in macrophage-mediated inflammatory signaling [52], may contribute to cytokine response regulation and inflammation control. These changes suggest S. argus initiates a fine-tuned immune response under ammonia exposure, potentially involving GIMAP4-mediated apoptotic regulation and ARRDC3-associated signaling modulation. DEGs were also enriched in the Toll/Imd pathway, a central innate immune cascade mediating pathogen recognition and inflammatory responses in aquatic animals [53]. Within this pathway, NAMLAA, encoding an enzyme that degrades bacterial peptidoglycan and modulates inflammatory mediator release [54], was significantly downregulated. Its suppression may reflect an adaptive mechanism to avoid excessive immune activation and minimize inflammation-induced damage, although the precise regulatory mechanism warrants further investigation. Together, these findings indicate that S. argus maintains immune equilibrium under ammonia stress through the activation of immunoregulatory genes and suppression of potential pro-inflammatory signals.
In summary, transcriptomic analysis of S. argus gills under ammonia exposure revealed coordinated molecular responses involving energy metabolism and immune signaling adjustments. The upregulation of key glycolysis and PPP genes and activation of the cysteine and methionine metabolism pathway, coupled with mTOR pathway suppression, suggest modulation of energy production and redox homeostasis. Concurrently, the activation of the NLR and Toll/Imd pathways reflects an orchestrated immune response characterized by controlled apoptosis, cytokine signaling modulation, and attenuated pro-inflammatory activity. Collectively, these transcriptional adjustments constitute an adaptive strategy enabling S. argus to maintain cellular homeostasis and limit tissue damage under ammonia-induced environmental stress.

5. Conclusions

This study provides the first integrated assessment of ammonia-induced toxicity and the associated physiological and molecular responses in S. argus. Transcriptomic analysis revealed that ammonia stress affected both energy metabolism and immune-related pathways. These responses likely serve as adaptive strategies to maintain physiological homeostasis and minimize tissue damage under ammonia-induced stress. Overall, this study provides valuable insights into the physiological responses and molecular mechanisms of S. argus under ammonia exposure, offering theoretical support to refine water quality management and informing potential breeding strategies for enhancing ammonia tolerance in aquaculture.

Author Contributions

Conceptualization, H.X., J.C. and S.L.; data curation, H.X., Z.Z. and H.Z.; formal analysis, H.X., Z.Z. and H.Z.; funding acquisition, S.L. and J.C.; investigation, H.X., Z.Z., Q.X. and H.Z.; project administration, S.L. and J.C.; visualization, H.X., Z.Z. and H.Z.; writing—original draft preparation, H.X., Z.Z. and H.Z.; writing—review and editing, S.L. and J.C. All authors have read and agreed to the published version of the manuscript.

Funding

This study was financially supported by the analysis and evaluation of ecological samples of coastal marine organisms in Jiangsu (JOUH23603), special fund for scientific and technological innovation of Sihong (H202303), and Open Fund of Key Laboratory of Tropical and Subtropical Aquatic Resources Utilization and Aquaculture of the Ministry of Agriculture and Rural Affairs (20230203).

Institutional Review Board Statement

This study was approved by the Animal Care and Use Committee of Jiangsu Ocean University (protocol no. 2020-37; approval date: 1 September 2019). All procedures involving animals were performed in accordance with guidelines for the Care and Use of Laboratory Animals in China.

Informed Consent Statement

Not applicable.

Data Availability Statement

All data generated during this study are included in this article.

Conflicts of Interest

The authors declare no conflicts of interest.

References

  1. Edwards, T.M.; Puglis, H.J.; Kent, D.B.; Durán, J.L.; Bradshaw, L.M.; Farag, A.M. Ammonia and Aquatic Ecosystems—A Review of Global Sources, Biogeochemical Cycling, and Effects on Fish. Sci. Total Environ. 2024, 907, 167911. [Google Scholar] [CrossRef]
  2. Hoseini, S.M.; Barbieri, E.; Aydın, B.; Yousefi, M. A Review of Dietary Approaches for Ammonia Toxicity Remediation in Fish. Aquacult. Int. 2024, 32, 5639–5675. [Google Scholar] [CrossRef]
  3. Randall, D.J.; Tsui, T.K.N. Ammonia Toxicity in Fish. Mar. Pollut. Bull. 2002, 45, 17–23. [Google Scholar] [CrossRef]
  4. Camargo, J.A.; Alonso, Á. Ecological and Toxicological Effects of Inorganic Nitrogen Pollution in Aquatic Ecosystems: A Global Assessment. Environ. Int. 2006, 32, 831–849. [Google Scholar] [CrossRef] [PubMed]
  5. Wright, P.A.; Wood, C.M. Seven Things Fish Know about Ammonia and We Don’t. Respir. Physiol. Neurobiol. 2012, 184, 231–240. [Google Scholar] [CrossRef]
  6. Ip, A.Y.K.; Chew, S.F. Ammonia Production, Excretion, Toxicity, and Defense in Fish: A Review. Front. Physiol. 2010, 1, 2118. [Google Scholar] [CrossRef] [PubMed]
  7. Ip, Y.K.; Chew, S.F.; Randall, D.J. Ammonia Toxicity, Tolerance, and Excretion. Fish Physiol. 2001, 20, 109–148. [Google Scholar]
  8. Sun, H.; Wang, W.; Li, J.; Yang, Z. Growth, Oxidative Stress Responses, and Gene Transcription of Juvenile Bighead Carp (Hypophthalmichthys nobilis) under Chronic-Term Exposure of Ammonia. Environ. Toxicol. Chem. 2014, 33, 1726–1731. [Google Scholar] [CrossRef] [PubMed]
  9. Guo, M.; Xu, Z.; Zhang, H.; Mei, J.; Xie, J. The Effects of Acute Exposure to Ammonia on Oxidative Stress, Hematological Parameters, Flesh Quality, and Gill Morphological Changes of the Large Yellow Croaker (Larimichthys crocea). Animals 2023, 13, 2534. [Google Scholar] [CrossRef]
  10. Wu, Y.; Zhao, M.; Xia, Y.; Sun, W.; Xiong, G.; Shi, L.; Qiao, Y.; Wu, W.; Ding, A.; Chen, L.; et al. Deterioration of Muscle Quality Caused by Ammonia Exposure in Rainbow Trout (Oncorhynchus mykiss). Food Biosci. 2023, 53, 102609. [Google Scholar] [CrossRef]
  11. Hongxing, G.; Xiafei, L.; Jialing, L.; Zhenquan, C.; Luoyu, G.; Lei, L.; Yuxuan, S.; Zhiguo, D.; Min, W. Effects of Acute Ammonia Exposure on Antioxidant and Detoxification Metabolism in Clam Cyclina sinensis. Ecotoxicol. Environ. Saf. 2021, 211, 111895. [Google Scholar] [CrossRef] [PubMed]
  12. Loong, A.M.; Tan, J.Y.L.; Wong, W.P.; Chew, S.F.; Ip, Y.K. Defense against Environmental Ammonia Toxicity in the African Lungfish, Protopterus aethiopicus: Bimodal Breathing, Skin Ammonia Permeability and Urea Synthesis. Aquat. Toxicol. 2007, 85, 76–86. [Google Scholar] [CrossRef] [PubMed]
  13. Wilkie, M.P. Ammonia Excretion and Urea Handling by Fish Gills: Present Understanding and Future Research Challenges. J. Exp. Zool. 2002, 293, 284–301. [Google Scholar] [CrossRef]
  14. Gupta, S. An Overview on Morphology, Biology, and Culture of Spotted Scat Scatophagus argus (Linnaeus 1766). Rev. Fish. Sci. Aquac. 2016, 24, 203–212. [Google Scholar] [CrossRef]
  15. Su, M.; Feng, Z.; Zhong, Y.; Ye, Z.; Zhang, J. Insights into Salinity Effect on Growth of the Spotted Scat (Scatophagus argus): Exploring the Optimum Salinity for Its Culture. Aquac. Rep. 2025, 41, 102667. [Google Scholar] [CrossRef]
  16. Su, M.; Liu, N.; Zhang, Z.; Zhang, J. Osmoregulatory Strategies of Estuarine Fish Scatophagus argus in Response to Environmental Salinity Changes. BMC Genom. 2022, 23, 545. [Google Scholar] [CrossRef]
  17. Lin, X.; Hu, S.; Liu, S.; Huang, H. Unexpected Prey of Juvenile Spotted Scat (Scatophagus Argus) near a Wharf: The Prevalence of Fouling Organisms in Stomach Contents. Ecol. Evol. 2018, 8, 8547–8554. [Google Scholar] [CrossRef]
  18. Shi, S.; Sun, X.; Zhang, C.; Lv, C.; Liu, Y.; Du, J.; Qi, Q. Transcriptome Analysis of the Effect of Acute Ammonia Stress on Pseudobagrus ussuriensis Liver Tissue. Fishes 2025, 10, 17. [Google Scholar] [CrossRef]
  19. Liu, M.-J.; Guo, H.-Y.; Zhu, K.-C.; Liu, B.-S.; Liu, B.; Guo, L.; Zhang, N.; Yang, J.-W.; Jiang, S.-G.; Zhang, D.-C. Effects of Acute Ammonia Exposure and Recovery on the Antioxidant Response and Expression of Genes in the Nrf2-Keap1 Signaling&nbsp;Pathway in the Juvenile Golden Pompano (Trachinotus ovatus). Aquat. Toxicol. 2021, 240, 105969. [Google Scholar] [CrossRef]
  20. Motamedi-Tehrani, J.; Peyghan, R.; Shahriari, A.; Razijalali, M.; Ebrahimi, E. The Influence of Ammonia-N and Salinity Levels on Oxidative Stress Markers, Hepatic Enzymes, and Acid Phosphatase Activity in Nile Tilapia (Oreochromis niloticus). Sci. Rep. 2025, 15, 559. [Google Scholar] [CrossRef] [PubMed]
  21. Egnew, N.; Renukdas, N.; Ramena, Y.; Yadav, A.K.; Kelly, A.M.; Lochmann, R.T.; Sinha, A.K. Physiological insights into largemouth bass (Micropterus salmoides) survival during long-term exposure to high environmental ammonia. Aquat. Toxicol. 2019, 207, 72–82. [Google Scholar] [CrossRef]
  22. Jin, J.; Amenyogbe, E.; Yang, Y.; Wang, Z.; Lu, Y.; Xie, R.; Droepenu, E.K.; Huang, J. Effects of Ammonia Nitrogen Stress on the Physiological, Biochemical, and Metabolic Levels of the Gill Tissue of Juvenile Four-Finger Threadfin (Eleutheronema tetradactylum). Aquat. Toxicol. 2024, 274, 107049. [Google Scholar] [CrossRef]
  23. Xu, Z.; Cao, J.; Qin, X.; Qiu, W.; Mei, J.; Xie, J. Toxic Effects on Bioaccumulation, Hematological Parameters, Oxidative Stress, Immune Responses and Tissue Structure in Fish Exposed to Ammonia Nitrogen: A Review. Animals 2021, 11, 3304. [Google Scholar] [CrossRef]
  24. Lin, W.; Luo, H.; Wu, J.; Hung, T.-C.; Cao, B.; Liu, X.; Yang, J.; Yang, P. A Review of the Emerging Risks of Acute Ammonia Nitrogen Toxicity to Aquatic Decapod Crustaceans. Water 2022, 15, 27. [Google Scholar] [CrossRef]
  25. Li, Y.; Zhou, F.; Huang, J.; Yang, L.; Jiang, S.; Yang, Q.; He, J.; Jiang, S. Transcriptome Reveals Involvement of Immune Defense, Oxidative Imbalance, and Apoptosis in Ammonia-Stress Response of the Black Tiger Shrimp (Penaeus monodon). Fish Shellfish Immunol. 2018, 83, 162–170. [Google Scholar] [CrossRef] [PubMed]
  26. Zheng, L. Acute toxic effects of ammonia and nitrite on Epinephelus coioides fry. Mar. Sci. 2012, 36, 81–86, (In Chinese with English abstract). [Google Scholar]
  27. Liu, M.-J.; Guo, H.-Y.; Liu, B.; Zhu, K.-C.; Guo, L.; Liu, B.-S.; Zhang, N.; Yang, J.-W.; Jiang, S.-G.; Zhang, D.-C. Gill Oxidative Damage Caused by Acute Ammonia Stress Was Reduced through the HIF-1α/NF-κb Signaling Pathway in Golden Pompano (Trachinotus ovatus). Ecotoxicol. Environ. Saf. 2021, 222, 112504. [Google Scholar] [CrossRef] [PubMed]
  28. Ni, Q.; Liang, X.; Yang, S.; Ge, H.; Dong, Z. Molecular and Physiological Responses in the Ammonia Transport Pathways in Clam Cyclina sinensis Exposed to Chronic Ammonia Nitrogen. Aquac. Rep. 2024, 35, 101952. [Google Scholar] [CrossRef]
  29. Sun, Y.; Fu, Z.; Liu, X.; Ma, Z. The Impact of Acute Ammonia Nitrogen Stress on the Gill Tissue Structure and Antioxidant Ability of Gills and Red and White Muscle in Juvenile Yellowfin Tuna (Thunnus albacares). Antioxidants 2024, 13, 1357. [Google Scholar] [CrossRef]
  30. Hu, Y.; Jia, X.; Geng, Z.; Chen, C.; Zhang, Y.; Liu, S.; Song, J. Effects of Chronic Ammonia Nitrogen Toxicity on the Gill Tissues and Non-Specific Immune Indexes of Juvenile Carassius auratus. Freshw. Fish. 2024, 54, 59–68, (In Chinese with English abstract). [Google Scholar]
  31. Wang, Z.; Chen, S.; Cao, D.; Lu, B.; Chang, Q.; Liu, C.; Yan, J. Effects of Acute Ammonia Nitrogen Stress on Histopathology of Gill and Liver and Enzyme Activities of Juvenile Verasper variegatus. Prog. Fish. Sci. 2017, 38, 59–69, (In Chinese with English abstract). [Google Scholar]
  32. Zhang, W.; Xia, S.; Zhu, J.; Miao, L.; Ren, M.; Lin, Y.; Ge, X.; Sun, S. Growth Performance, Physiological Response and Histology Changes of Juvenile Blunt Snout Bream, Megalobrama amblycephala exposed to Chronic Ammonia. Aquaculture 2019, 506, 424–436. [Google Scholar] [CrossRef]
  33. Lin, S.; Nascimento, E.M.; Gajera, C.R.; Chen, L.; Neuhöfer, P.; Garbuzov, A.; Wang, S.; Artandi, S.E. Distributed Hepatocytes Expressing Telomerase Repopulate the Liver in Homeostasis and Injury. Nature 2018, 556, 244–248. [Google Scholar] [CrossRef]
  34. Wang, B.; Zhao, L.; Fish, M.; Logan, C.Y.; Nusse, R. Self-Renewing Diploid Axin2(+) Cells Fuel Homeostatic Renewal of the Liver. Nature 2015, 524, 180–185. [Google Scholar] [CrossRef]
  35. Font-Burgada, J.; Shalapour, S.; Ramaswamy, S.; Hsueh, B.; Rossell, D.; Umemura, A.; Taniguchi, K.; Nakagawa, H.; Valasek, M.A.; Ye, L.; et al. Hybrid Periportal Hepatocytes Regenerate the Injured Liver without Giving Rise to Cancer. Cell 2015, 162, 766–779. [Google Scholar] [CrossRef]
  36. Chen, Y.; Liu, E.; Li, C.; Pan, C.; Zhao, X.; Wang, Y.; Ling, Q. Effects of Heat Stress on Histopathology, Antioxidant Enzymes, and Transcriptomic Profiles in Gills of Pikeperch Sander lucioperca. Aquaculture 2021, 534, 736277. [Google Scholar] [CrossRef]
  37. Mangang, Y.A.; Pandey, P.K. Hemato-Biochemical Responses and Histopathological Alterations in the Gill and Kidney Tissues of Osteobrama belangeri (Valenciennes, 1844) Exposed to Different Sub-Lethal Unionized Ammonia. Aquaculture 2021, 542, 736887. [Google Scholar] [CrossRef]
  38. Zhao, L.; Cui, C.; Liu, Q.; Sun, J.; He, K.; Adam, A.A.; Luo, J.; Li, Z.; Wang, Y.; Yang, S.; et al. Combined Exposure to Hypoxia and Ammonia Aggravated Biological Effects on Glucose Metabolism, Oxidative Stress, Inflammation and Apoptosis in Largemouth Bass (Micropterus salmoides). Aquat. Toxicol. 2020, 224, 105514. [Google Scholar] [CrossRef]
  39. Zou, J.; Hu, P.; Wang, M.; Chen, Z.; Wang, H.; Guo, X.; Gao, J.; Wang, Q. Liver Injury and Metabolic Dysregulation in Largemouth Bass (Micropterus salmoides) after Ammonia Exposure. Metabolites 2023, 13, 274. [Google Scholar] [CrossRef]
  40. Polakof, S.; Panserat, S.; Soengas, J.L.; Moon, T.W. Glucose Metabolism in Fish: A Review. J. Comp. Physiol. B 2012, 182, 1015–1045. [Google Scholar] [CrossRef] [PubMed]
  41. Zhang, Y.; Qin, C.; Wang, J.; Yang, L.; Yan, X.; Zhi, S.; Nie, G. Phosphofructokinase Family Genes in grass carp: Molecular Identification and Tissue-Specific Expression in Response to Glucose, Insulin and Glucagon. Comp. Biochem. Physiol. B Biochem. Mol. Biol. 2024, 269, 110898. [Google Scholar] [CrossRef] [PubMed]
  42. Wamelink, M.M.C.; Struys, E.A.; Jakobs, C. The Biochemistry, Metabolism and Inherited Defects of the Pentose Phosphate Pathway: A Review. J. Inherit. Metab. Dis. 2008, 31, 703–717. [Google Scholar] [CrossRef] [PubMed]
  43. Stincone, A.; Prigione, A.; Cramer, T.; Wamelink, M.M.C.; Campbell, K.; Cheung, E.; Olin-Sandoval, V.; Grüning, N.; Krüger, A.; Tauqeer Alam, M.; et al. The Return of Metabolism: Biochemistry and Physiology of the Pentose Phosphate Pathway. Biol. Rev. 2015, 90, 927–963. [Google Scholar] [CrossRef]
  44. González-Ruiz, R.; Leyva-Carrillo, L.; Peregrino-Uriarte, A.B.; Yepiz-Plascencia, G. The Combination of Hypoxia and High Temperature Affects Heat Shock, Anaerobic Metabolism, and Pentose Phosphate Pathway Key Components Responses in the White Shrimp (Litopenaeus vannamei). Cell Stress Chaperones 2023, 28, 493–509. [Google Scholar] [CrossRef]
  45. Li, T.Y.; Sun, Y.; Liang, Y.; Liu, Q.; Shi, Y.; Zhang, C.-S.; Zhang, C.; Song, L.; Zhang, P.; Zhang, X.; et al. ULK1/2 Constitute a Bifurcate Node Controlling Glucose Metabolic Fluxes in Addition to Autophagy. Mol. Cell 2016, 62, 359–370. [Google Scholar] [CrossRef]
  46. Ni, Q.; Li, W.; Liang, X.; Liu, J.; Ge, H.; Dong, Z. Gill Transcriptome Analysis Reveals the Molecular Response to the Acute Low-Salinity Stress in Cyclina sinensis. Aquac. Rep. 2021, 19, 100564. [Google Scholar] [CrossRef]
  47. Shafqat, N.; Muniz, J.R.C.; Pilka, E.S.; Papagrigoriou, E.; von Delft, F.; Oppermann, U.; Yue, W.W. Insight into S-adenosylmethionine biosynthesis from the crystal structures of the human methionine adenosyltransferase catalytic and regulatory subunits. Biochem. J. 2013, 452, 27–36. [Google Scholar] [CrossRef]
  48. Cuaz-Pérolin, C.; Furman, C.; Larigauderie, G.; Legedz, L.; Lasselin, C.; Copin, C.; Jaye, M.; Searfoss, G.; Yu, K.T.; Duverger, N.; et al. REDD2 Gene Is Upregulated by Modified LDL or Hypoxia and Mediates Human Macrophage Cell Death. Arterioscler. Thromb. Vasc. Biol. 2004, 24, 1830–1835. [Google Scholar] [CrossRef]
  49. Simonson, B.; Subramanya, V.; Chan, M.C.; Zhang, A.; Franchino, H.; Ottaviano, F.; Mishra, M.K.; Knight, A.C.; Hunt, D.; Ghiran, I.; et al. DDiT4L Promotes Autophagy and Inhibits Pathological Cardiac Hypertrophy in Response to Stress. Sci. Signal. 2017, 10, eaaf5967. [Google Scholar] [CrossRef] [PubMed]
  50. Wu, X.; Yang, Z.-H.; Wu, J.; Han, J. Ribosome-Rescuer PELO Catalyzes the Oligomeric Assembly of NOD-like Receptor Family Proteins via Activating Their ATPase Enzymatic Activity. Immunity 2023, 56, 926–943.e7. [Google Scholar] [CrossRef]
  51. Schnell, S.; Démollière, C.; Van Den Berk, P.; Jacobs, H. Gimap4 Accelerates T-Cell Death. Blood 2006, 108, 591–599. [Google Scholar] [CrossRef] [PubMed]
  52. La Marca, J.E.; Aubrey, B.J.; Yang, B.; Chang, C.; Wang, Z.; Kueh, A.; Tai, L.; Wilcox, S.; Milla, L.; Heinzel, S.; et al. Genome-Wide CRISPR Screening Identifies a Role for ARRDC3 in TRP53-Mediated Responses. Cell Death Differ. 2024, 31, 150–158. [Google Scholar] [CrossRef] [PubMed]
  53. Liu, Y.; Song, L.; Sun, Y.; Liu, T.; Hou, F.; Liu, X. Comparison of Immune Response in Pacific White Shrimp, Litopenaeus Vannamei, after Knock down of Toll and IMD Gene in Vivo. Dev. Comp. Immunol. 2016, 60, 41–52. [Google Scholar] [CrossRef] [PubMed]
  54. Li, X.; Wang, S.; Qi, J.; Echtenkamp, S.F.; Chatterjee, R.; Wang, M.; Boons, G.-J.; Dziarski, R.; Gupta, D. Zebrafish Peptidoglycan Recognition Proteins Are Bactericidal Amidases Essential for Defense against Bacterial Infections. Immunity 2007, 27, 518–529. [Google Scholar] [CrossRef]
Figure 1. Histological changes in the gills of Scatophagus argus exposed to different concentrations of TAN for 96 h (H&E staining). (AC) represent 0, 30, and 60 mg/L TAN, respectively. PL: primary lamella; SL: secondary lamella; BC: blood cell; CC: chloride cell; Pic: pillar cell; BSL: bending of secondary lamellae; ESL: enlargement of secondary lamellae; SSL: shortened secondary lamella; ELD: epithelial cell lysis and detachment; EV: cellular vacuolation.
Fishes 10 00412 g001
Figure 2. Histological changes in the liver of Scatophagus argus after 96 h TAN exposure (H&E staining). (AC) represent 0, 30, and 60 mg/L TAN, respectively. H: hepatocyte; HV: hepatocyte vacuolization; DS: sinusoidal dilation; PN: peripheral nucleus; K: karyolysis.
Fishes 10 00412 g002
Figure 3. Differentially expressed genes (DEGs) in the gill tissues of Scatophagus argus after 96 h TAN exposure. (A) Volcano plot showing the distribution of DEGs between control and TAN-treated groups. Red and blue dots represent significantly upregulated and downregulated genes, respectively (adjusted p < 0.01, |log2FC| ≥ 1). (B) Hierarchical clustering heatmap of DEGs. Each column represents a biological replicate, and each row corresponds to a DEG. Color scale indicates relative expression levels (z-score-normalized FPKM values).
Fishes 10 00412 g003
Figure 4. COG and GO functional annotation of transcriptome in Scatophagus argus. (A) COG classification of differentially expressed genes; (B) GO functional annotation of differentially expressed genes.
Fishes 10 00412 g004
Figure 5. KEGG pathway enrichment analysis of DEGs.
Fishes 10 00412 g005
Figure 6. Validation of RNA-seq results by qRT-PCR. The relative expression levels of ten selected DEGs were compared between the control and TAN-exposed groups. β-actin was used as the internal reference gene. The expression trends determined by qRT-PCR were consistent with the RNA-seq results (n = 3).
Fishes 10 00412 g006
Table 1. Primers used in qRT-PCR.
GenePrimer Sequence (5′-3′)
ForwardReverse
DDIT4TGTACCAAACTTCTCATCCCGGGCTGAAAGGTGGGTACAAGGTA
PFKMGTCGTATCTTTGCTAACACACCGTTCATGATGGGCCTGATCTTCAA
ARRDC3GGTCCTATTTCCCTAAGTGCCAATGACCTCCTTCATCTTCCCTTTG
SNRKCGACACACAACAAGCCCAAGGCTCTTGTGCCTCGAAGTCT
CTSL1CCCAAATACAACTCTGCCAACGCTTGCCATCTACATCCTCTCCC
NAMLAATTCCTTGGTGACGCTGACTCGTGGAGCTGTGTCTGAACGA
APOLCCGGATGGTGTTCTCATTCCACACTGGAGATCTTTGCCCCTT
TRIM71ATCCAAACACAGCACACACATGCCAGTAACAACGTCCAGTCAGA
MAT2AGACCGAACAGTTAGACCAGCATCTTCTTCCATGTCAGCCCAC
MARS1TCCCATCATCAGCTCCTCCATGATGCAGCGAGGTTTGAGT
β-actinTCATGAAGATCCTGACAGAGCGTGATGCTGTTGTAGGTGGTCTC
Table 2. The 96 h median lethal concentration (LC50-96 h) and safe concentration (SC) for Scatophagus argus. TAN: total ammonia nitrogen. NH3: non-ionized ammonia.
LC50-96 h (mg/L)SC (mg/L)95% Confidence Interval
TAN59.435.9458.27–60.61
NH33.930.39
Table 3. Mapping statistics of RNA-seq reads to the reference genome.
SamplesClean ReadsGC Content% ≥ Q30Genome
Mapping Ratio
An0-121,332,34845.77%93.48%84.76%
An0-219,319,53847.37%93.73%87.94%
An0-319,690,11147.66%93.83%86.89%
An60-121,218,42447.07%94.40%85.96%
An60-221,061,73747.54%93.73%86.46%
An60-322,226,34546.05%93.75%86.83%
Table 4. Differentially expressed genes involved in energy metabolism-related pathways in the gills of Scatophagus argus under ammonia stress.
Gene IDGene NameKEGG PathwayLog2FCFDR
EVM0015383Glyceraldehyde-3-phosphate dehydrogenase
(GAPDH)
Glycolysis/gluconeogenesis
(ko00010)
1.640.04015
EVM00169586-phosphofructokinase, muscle type
(PFKM)
Glycolysis/gluconeogenesis
(ko00010)
2.000.01206
EVM0022814Phosphoglucomutase-1
(PGM1)
Pentose phosphate pathway
(ko00030)
1.040.04084
EVM0013965DNA damage-inducible transcript 4
(DDIT4)
mTOR signaling pathway
(ko04150)
2.030.01011
EVM0012705Succinate dehydrogenase iron–sulfur subunit
(SDHB)
Citrate cycle (TCA cycle)
(ko00020)
1.290.00077
EVM0021624Betaine-homocysteine S-methyltransferase 1
(BHMT1)
Glycine, serine, and threonine metabolism (ko00260)1.300.01799
EVM0007678S-adenosylmethionine synthase isoform type-2
(MAT2A)
Cysteine and methionine metabolism
(ko00270)
−1.980.00012
EVM0022587Malate dehydrogenase 1 (MDH1)Citrate cycle (TCA cycle)
(ko00020)
−1.280.01748
Table 5. Differentially expressed genes involved in immune-related pathways in the gills of Scatophagus argus under ammonia stress.
Gene IDGene NameKEGG PathwayLog2FCFDR
EVM0005729Arrestin domain-containing protein 3
(ARRDC3)
NOD-like receptor signaling pathway
(ko04621)
1.340.00825
EVM0018062GTPase IMAP family member 4
(GIMAP4)
NOD-like receptor signaling pathway (ko04621)2.120.01906
EVM0023124Cathepsin L1
(CTSL1)
Lysosome
(ko04142)
1.104.07 × 10−5
EVM0007718Tumor necrosis factor receptor superfamily member 21 (TNFRSF21)Cytokine–cytokine receptor interaction
(ko04060)
1.390.01206
EVM0002453N-acetylmuramoyl-L-alanine amidase
(NAMLAA)
Toll and Imd signaling pathway
(ko04624)
−1.770.00713
EVM0023302Stimulator of interferon genes protein
(STING)
NOD-like receptor signaling pathway
(ko04621)
−1.810.03222
Disclaimer/Publisher’s Note: The statements, opinions and data contained in all publications are solely those of the individual author(s) and contributor(s) and not of MDPI and/or the editor(s). MDPI and/or the editor(s) disclaim responsibility for any injury to people or property resulting from any ideas, methods, instructions or products referred to in the content.