1. Introduction
1.1. Growth of the Aquaculture Industry and Safety Issues
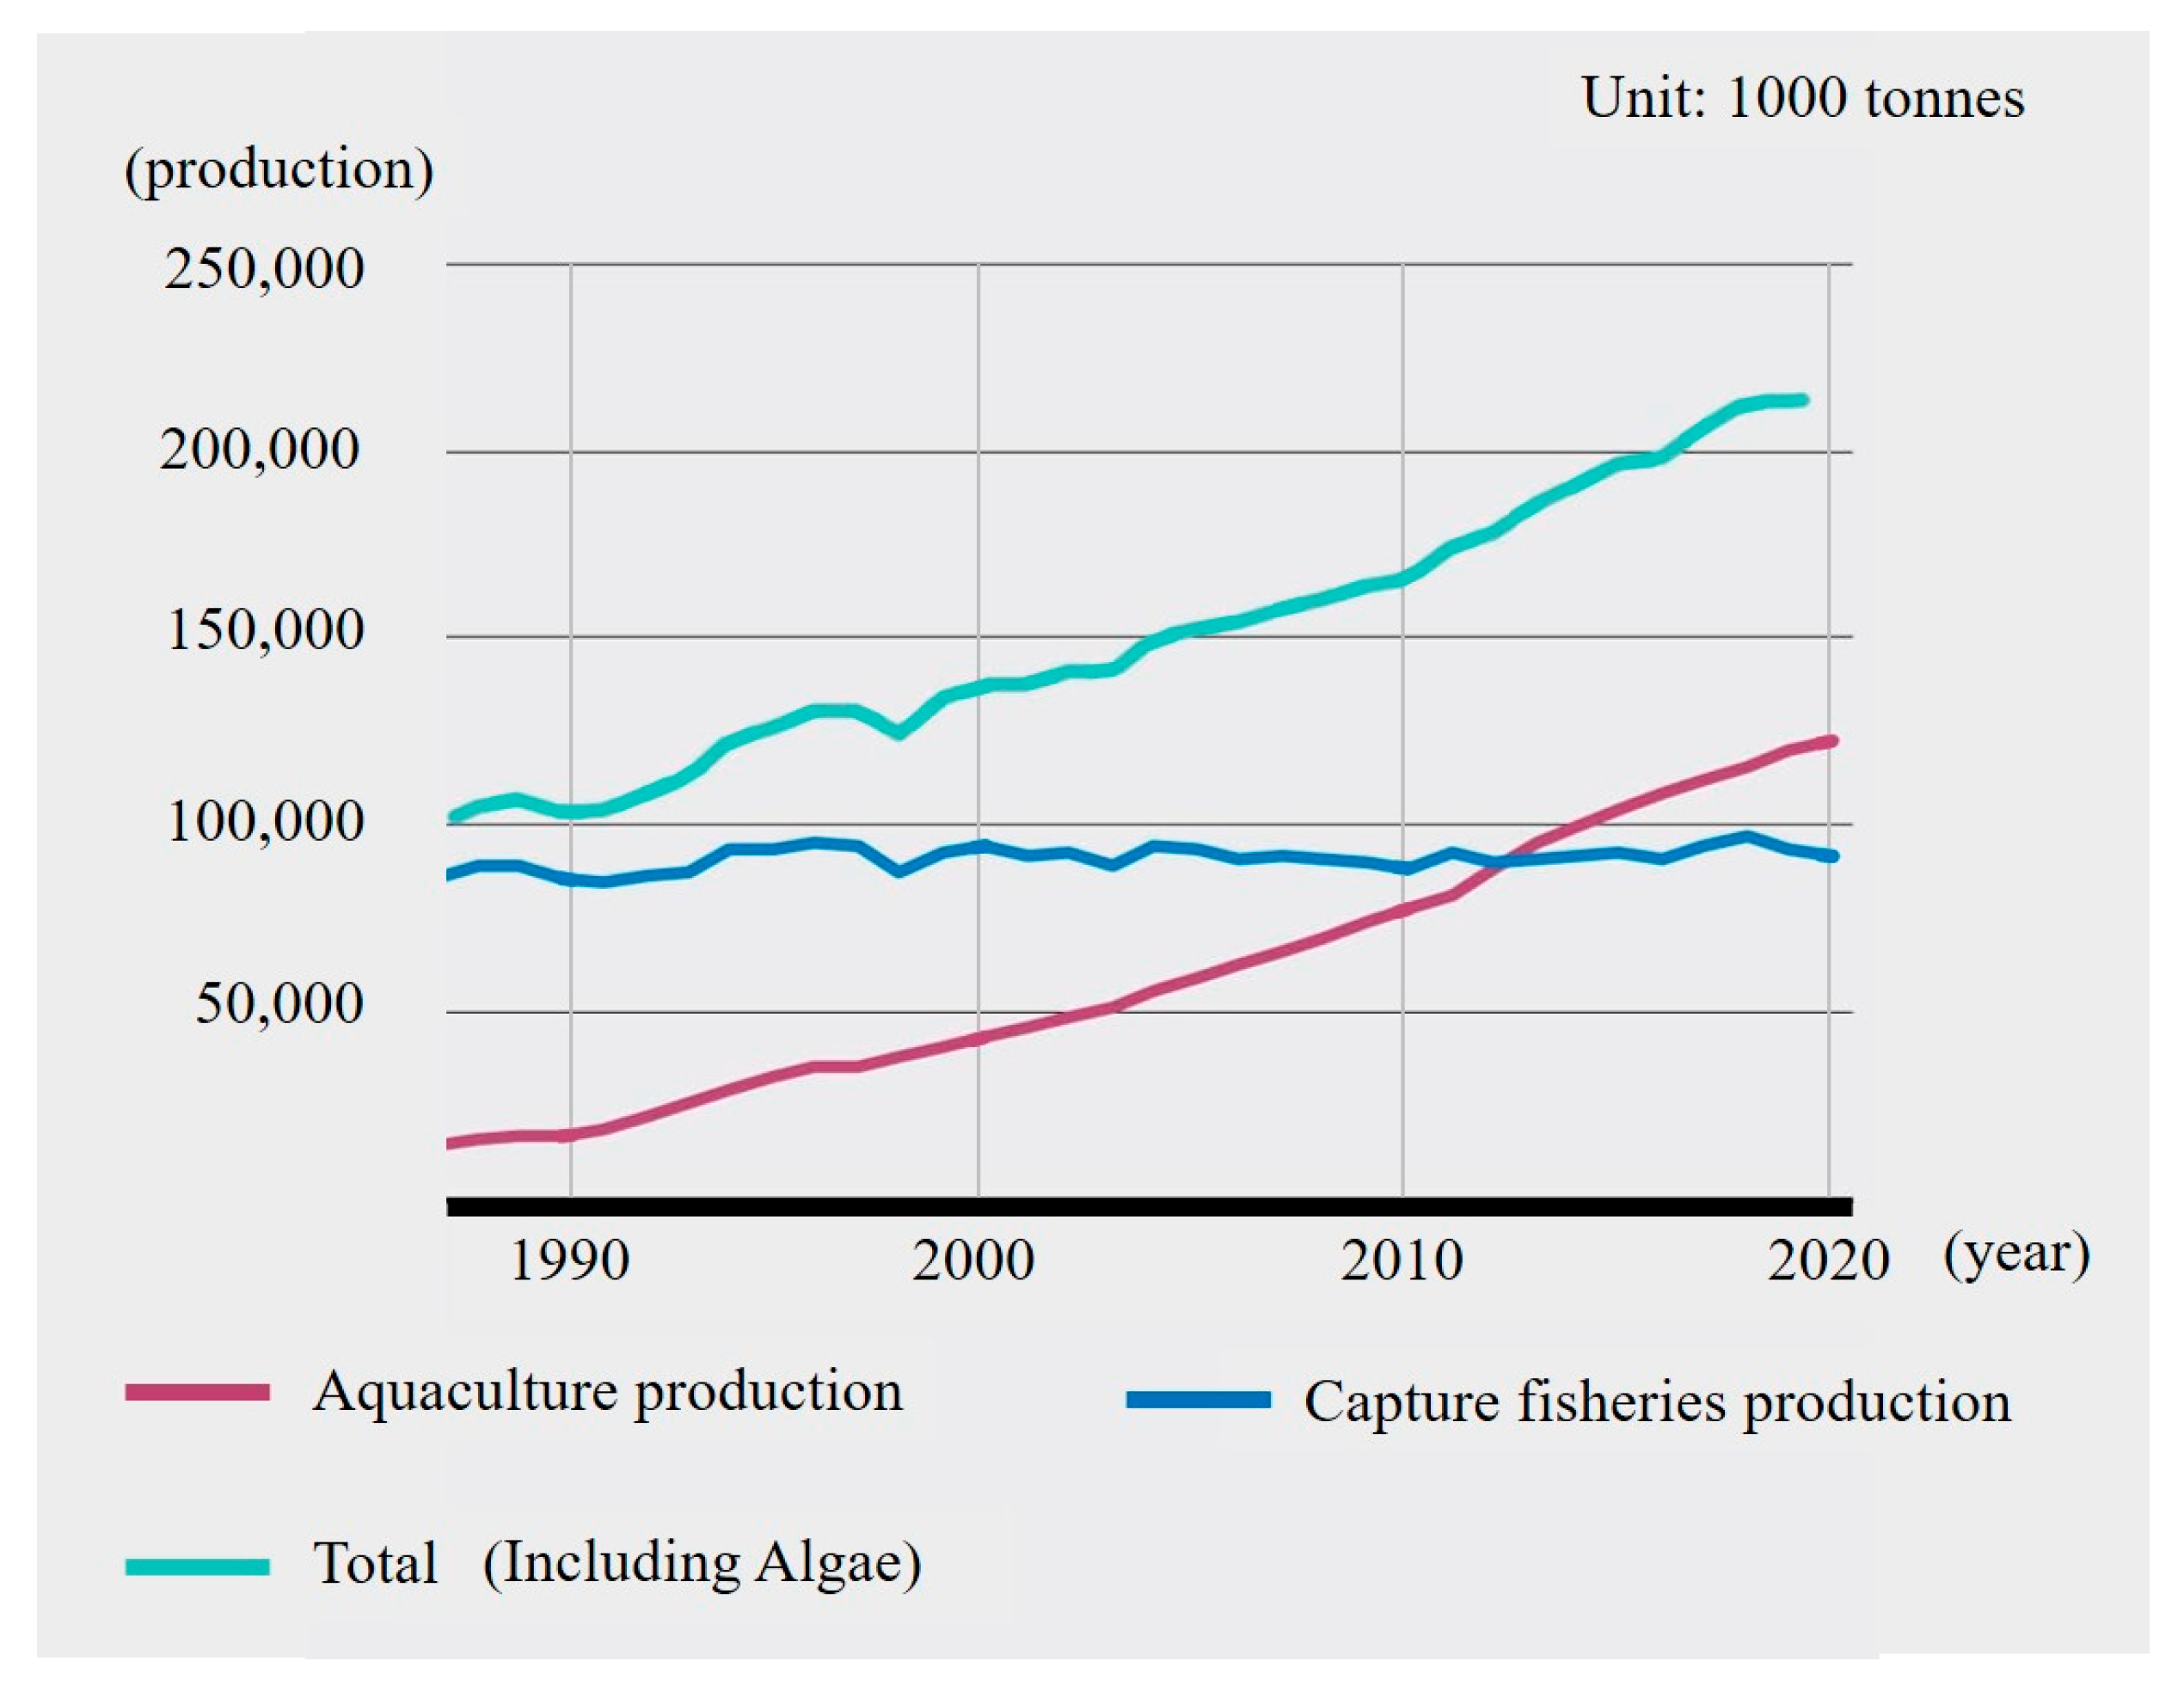
The global aquaculture industry continues to grow rapidly in response to the food security crisis and the depletion of marine resources. According to the Food and Agriculture Organization of the United Nations, more than half of the global seafood consumed is produced from aquaculture, and the number of people engaged in the industry is also increasing [
1]. As shown in
Figure 1, aquaculture production has surpassed capture fisheries since the 1990s, marking a major shift in the structure of global seafood supply.
Aquaculture production is heavily concentrated in Asia. In 2020, Asia accounted for approximately 91.6% of global aquaculture output. These figures are detailed in
Table 1, which presents aquaculture production by continent and major producing countries.
The workforce distribution shows a similar pattern. In 2020, more than 93% of aquaculture workers were based in Asia.
Table 2 summarizes the number of aquaculture workers by continent, highlighting the region’s central role in the industry and the scale of associated safety concerns.
Despite this rapid industrial growth, research and policy attention to safety issues in aquaculture remains limited. Because fish farms are mostly located along the coast or on land, they are often viewed as relatively static and low-risk environments. However, in practice, various types of accidents frequently occur at aquaculture sites, such as trip/slip, stuck, and fall, particularly in marine facilities exposed to wave and weather conditions.
Especially, offshore facilities, like floating cages and seaweed farms, are significantly affected by marine weather conditions, and additional risks arise from difficulties in rescue and reporting in remote locations.
1.2. Safety Gaps and Regulatory Disparities Between Capture Fisheries and Aquaculture
Capture fisheries benefit from a range of international conventions and regulatory frameworks aimed at improving worker safety. These include the International Labour Organization’s (ILO) C188 Convention on working conditions, the International Maritime Organization’s (IMO) STCW-F Convention on safety training and crew qualifications, and the 2012 Cape Town Agreement on vessel design and safety equipment [
2,
3,
4]. Collectively, these instruments enhance the legal and institutional foundation for safety in capture fisheries.
However, their application to aquaculture remains limited or ambiguous, creating structural vulnerabilities in the industry’s safety systems. While capture fisheries benefit from formal vessel-based management and international safety standards, aquaculture is often excluded from equivalent oversight, leading to regulatory gaps in worker protection.
Academic research has also largely focused on capture fisheries. Numerous studies have analyzed marine accidents in fishing operations using statistical and probabilistic methods [
5,
6,
7,
8,
9,
10,
11] and many have emphasized human elements—such as fatigue, negligence, and lack of training—as key contributors to accident occurrence [
12,
13,
14,
15]. Other studies have examined the influence of environmental and mechanical factors, including adverse weather conditions and aging equipment [
16,
17,
18]. Although these studies have significantly advanced our understanding of safety risks in the fishing sector, research focusing on aquaculture remains scarce.
1.3. Korea as a Case Study
In recent years, several studies have begun to address this gap by focusing on the aquaculture sector. Myers [
19] reviewed occupational risks in U.S. aquaculture and emphasized the need for tailored safety policies. Ramasamy et al. [
20] investigated health risks and non-communicable disease profiles among aquaculture workers in India, while Thorvaldsen and Kongsvik [
21] identified ergonomic hazards in Norwegian fish farming and proposed improvements through work process redesign. These studies demonstrate that aquaculture presents distinct risks that differ from those in capture fisheries, requiring independent safety analyses and policy frameworks.
This study was conducted using the Republic of Korea as the case study. Within Asia, the Republic of Korea ranked sixth in aquaculture production, contributing approximately 2.1% of the global total. Although this figure is smaller than those of China or Indonesia, it is comparable to the total aquaculture production of entire continents, such as Africa (2,354,300 t, 1.9%) and Europe (3,291,700 t, 2.7%), suggesting that Korea’s contribution is meaningful on a global scale (see
Table 1). More importantly, Korea provides a valuable case for empirical safety research due to the availability of structured and reliable accident data, supported by a national accident compensation insurance system. Under the “Fishermen and Fishing Vessel Accident Compensation Insurance Act”, Korea operates a comprehensive insurance scheme that was extended to aquaculture workers through the Aquaculture Disaster Insurance Program [
22,
23].
Of course, this study does not seek to generalize findings across Asia. Instead, it uses Korea as a data-rich and systemized case to explore safety risks and identify practical challenges in the industry. Several studies have already demonstrated the utility of Korea’s insurance data for analyzing safety issues. For example, Lee et al. [
24] statistically analyzed 329 accident cases involving aquaculture fisheries management vessels and identified key operational risk factors, highlighting the applicability of data-driven approaches in aquaculture safety research.
Based on this background, the present study aimed to quantitatively analyze accident cases involving aquaculture workers by utilizing accident compensation insurance data and a worker awareness survey. The study particularly focused on accidents directly caused by human elements. The indirect factors used in the worker awareness survey were classified based on IMO Resolution A.884, Guidelines for the Investigation of Human Factors in Marine Casualties and Incidents [
25], and the probability of accident occurrence for each indirect factor was quantitatively evaluated by applying the Fault Tree Analysis (FTA) method, one of the Formal Safety Assessment (FSA) techniques developed by the IMO [
26].
2. Materials and Methods
2.1. Accident Compensation Insurance Data (Selection of Direct Causes)
Generally, accidents in the aquaculture industry are less severe than those in capture fisheries (accidents that cause economic/environmental damage to society, such as collisions and stranding), and they are considered personal accidents (accidents that are mainly caused by human elements). Therefore, most of them are not included or reported in official statistics. This makes it difficult to accurately identify the number of accidents or accident types, and related statistics are inevitably estimated through individual data collection or insurance payment records.
This study utilized accident compensation insurance payment data in Korea over the past five years (2018–2022) for the aquaculture industry (e.g., land-based tank systems, floating cages, and seaweed farms) [
22]. These data enabled a relatively quantitative analysis because they were based on compensation claims prepared at the time of actual accidents and contained specific information, such as the time, type, and damage level (amount) of each accident. In particular, they can also include accident cases that do not appear in public statistics, allowing them to be utilized as useful data in identifying the tendency and status of aquaculture industry accidents.
While the structured and reliable nature of this data supports detailed analysis, it is important to note that the findings are based on Korean cases alone and may not be directly generalizable to countries with different regulatory systems or industry structures, such as China or Indonesia. The study does not claim representativeness for the entire Asian aquaculture industry but rather uses Korea as a practical case study with accessible and detailed data.
2.2. Selection of Basic Causes
Most accidents in fish farms are directly caused by human elements; however, various basic causes are also involved. In this study, Bird’s Domino Theory (also referred to as the updated domino theory) was applied as a theoretical basis to derive and quantitatively evaluate such basic causes affecting the occurrence of accidents. In addition, the awareness of aquaculture workers was identified by conducting a survey based on the basic causes derived.
2.2.1. Theoretical Background: Bird’s Domino Theory
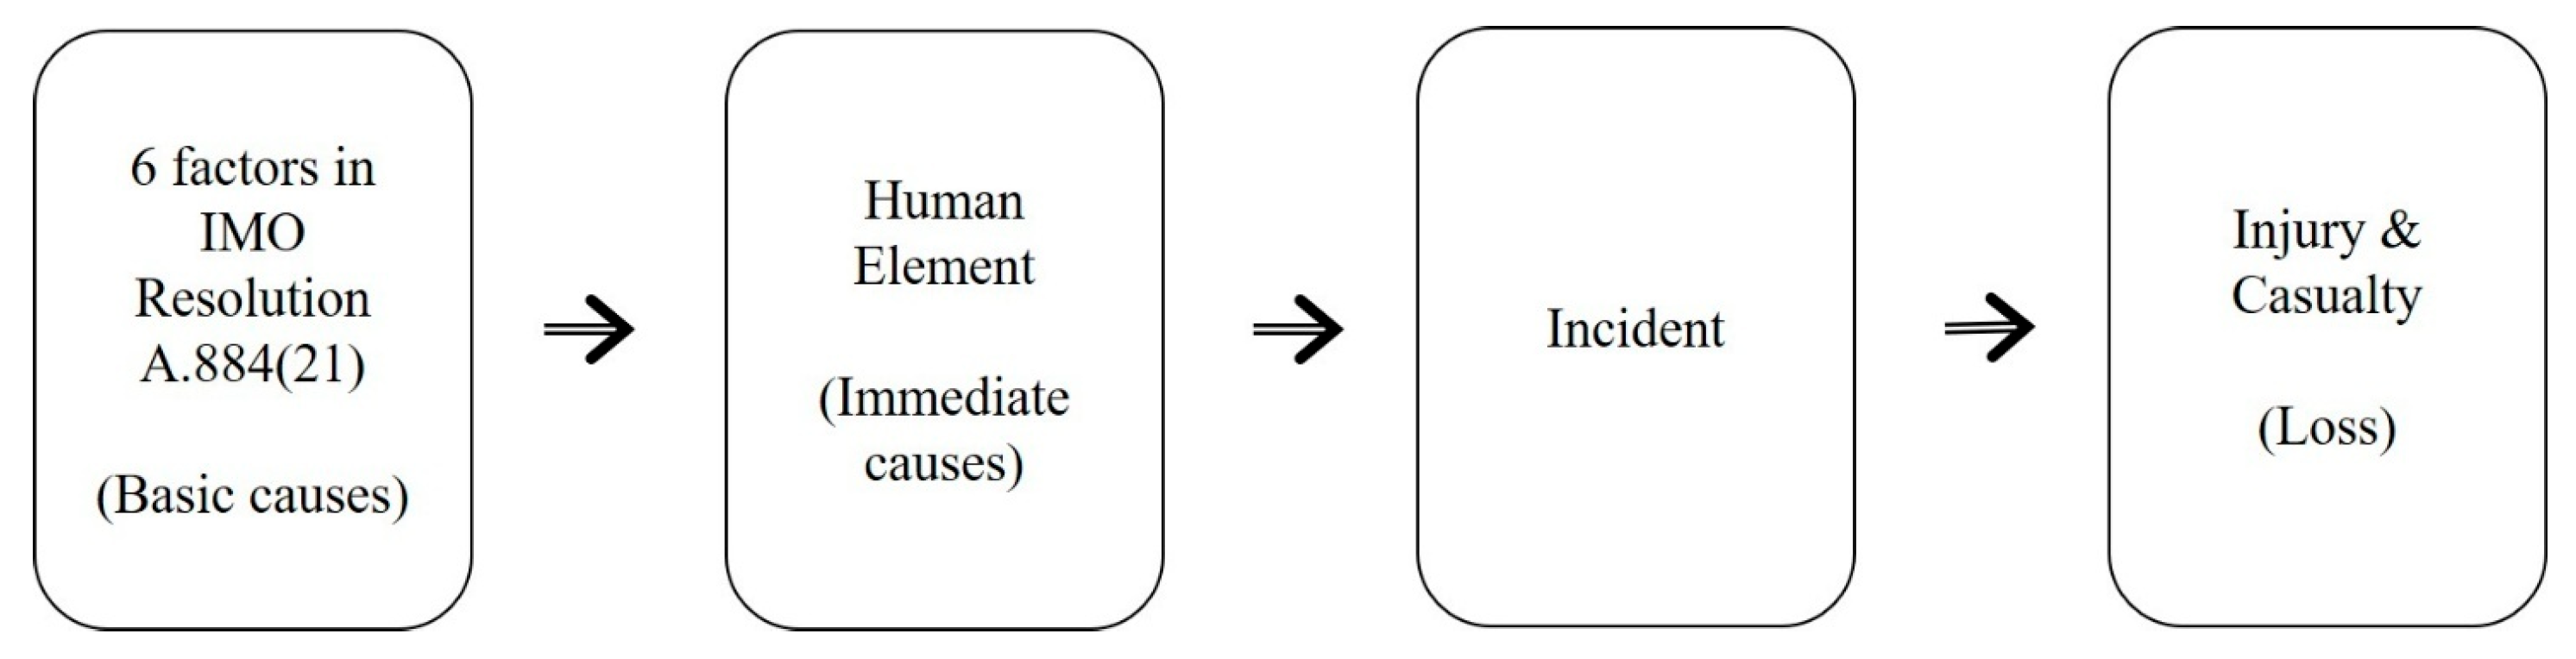
Frank E. Bird Jr. presented the domino theory composed of five elements (defects in management → basic causes → immediate causes → incident → loss) by expanding on H. W. Heinrich’s disaster theory. Bird emphasized that removing direct causes and their preceding basic causes is more effective for accident prevention [
27].
This study analyzed the incident causation chain based on Bird’s theory. Based on the purpose of this study, the “defects in management” item was excluded, and “basic causes” were reconstructed into six basic causes based on the classification criteria presented by the IMO.
Figure 2 shows the incident causation chain.
2.2.2. Configuration of Basic Cause Items
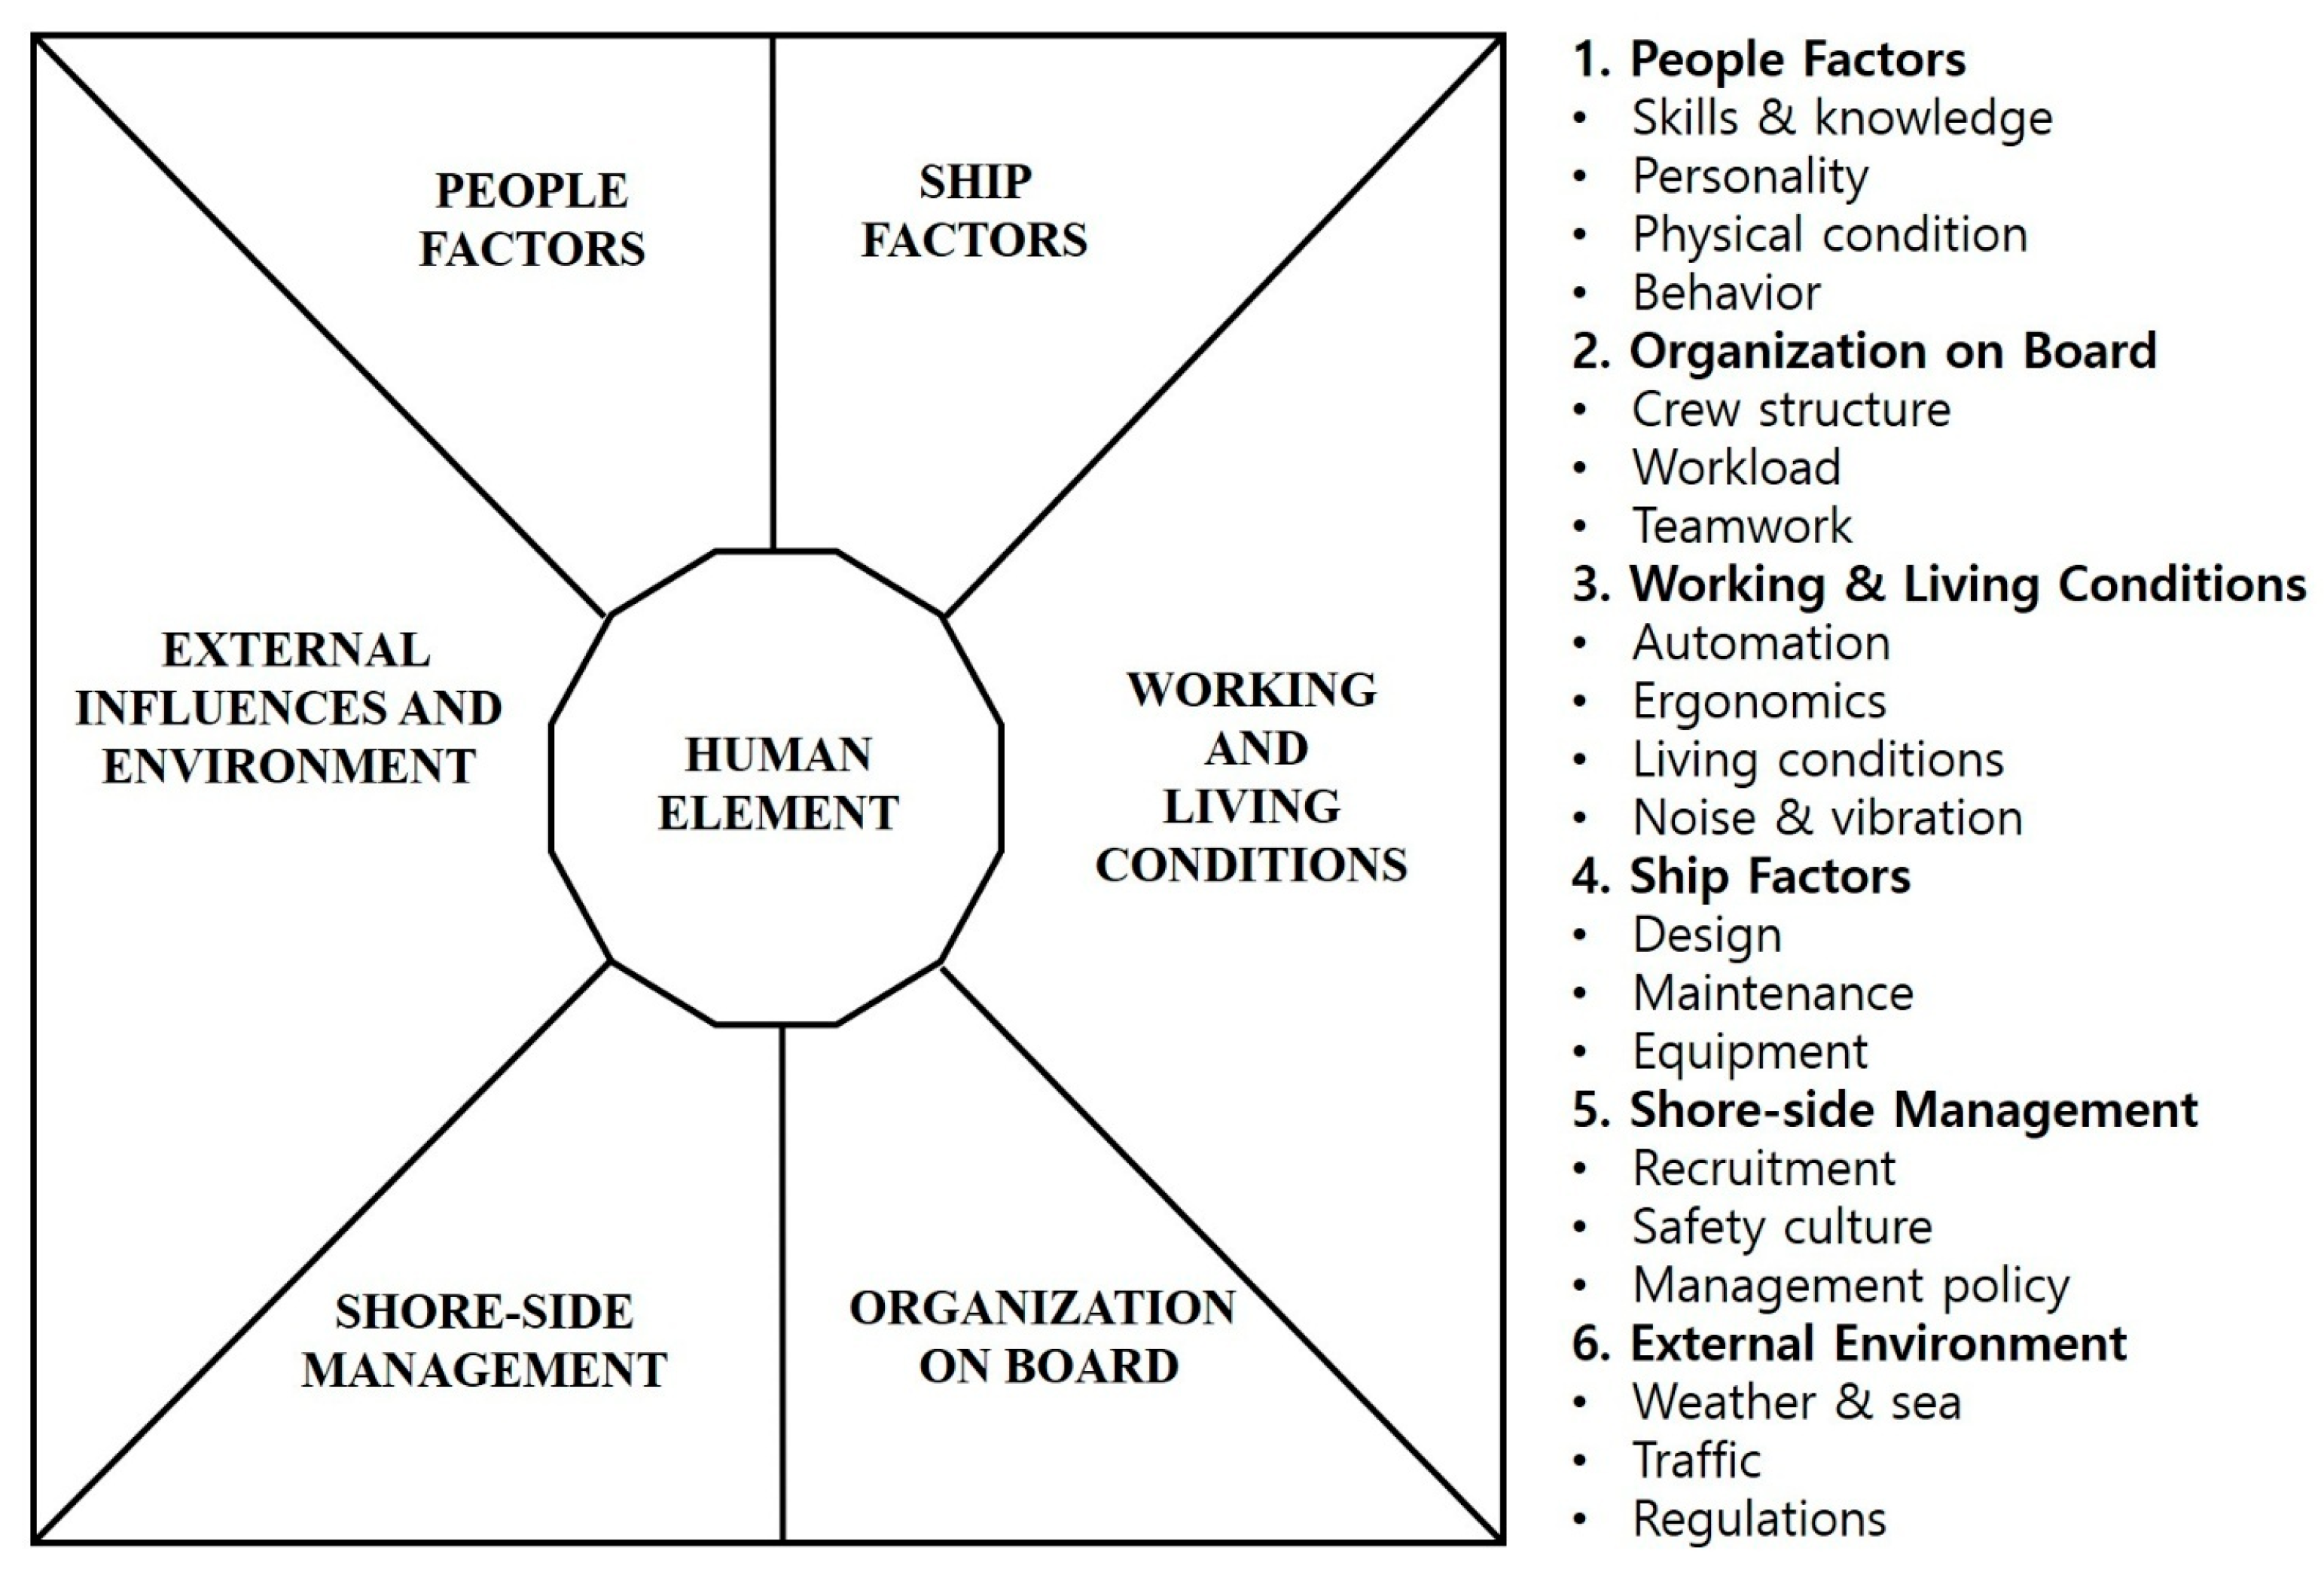
According to IMO’s Resolution A.884 (21), human elements can be classified into six major items, as shown in
Figure 3, indicating that human elements are formed not by a single factor but by the interactions between various basic causes [
25]. Accordingly, basic causes were also organized in this study.
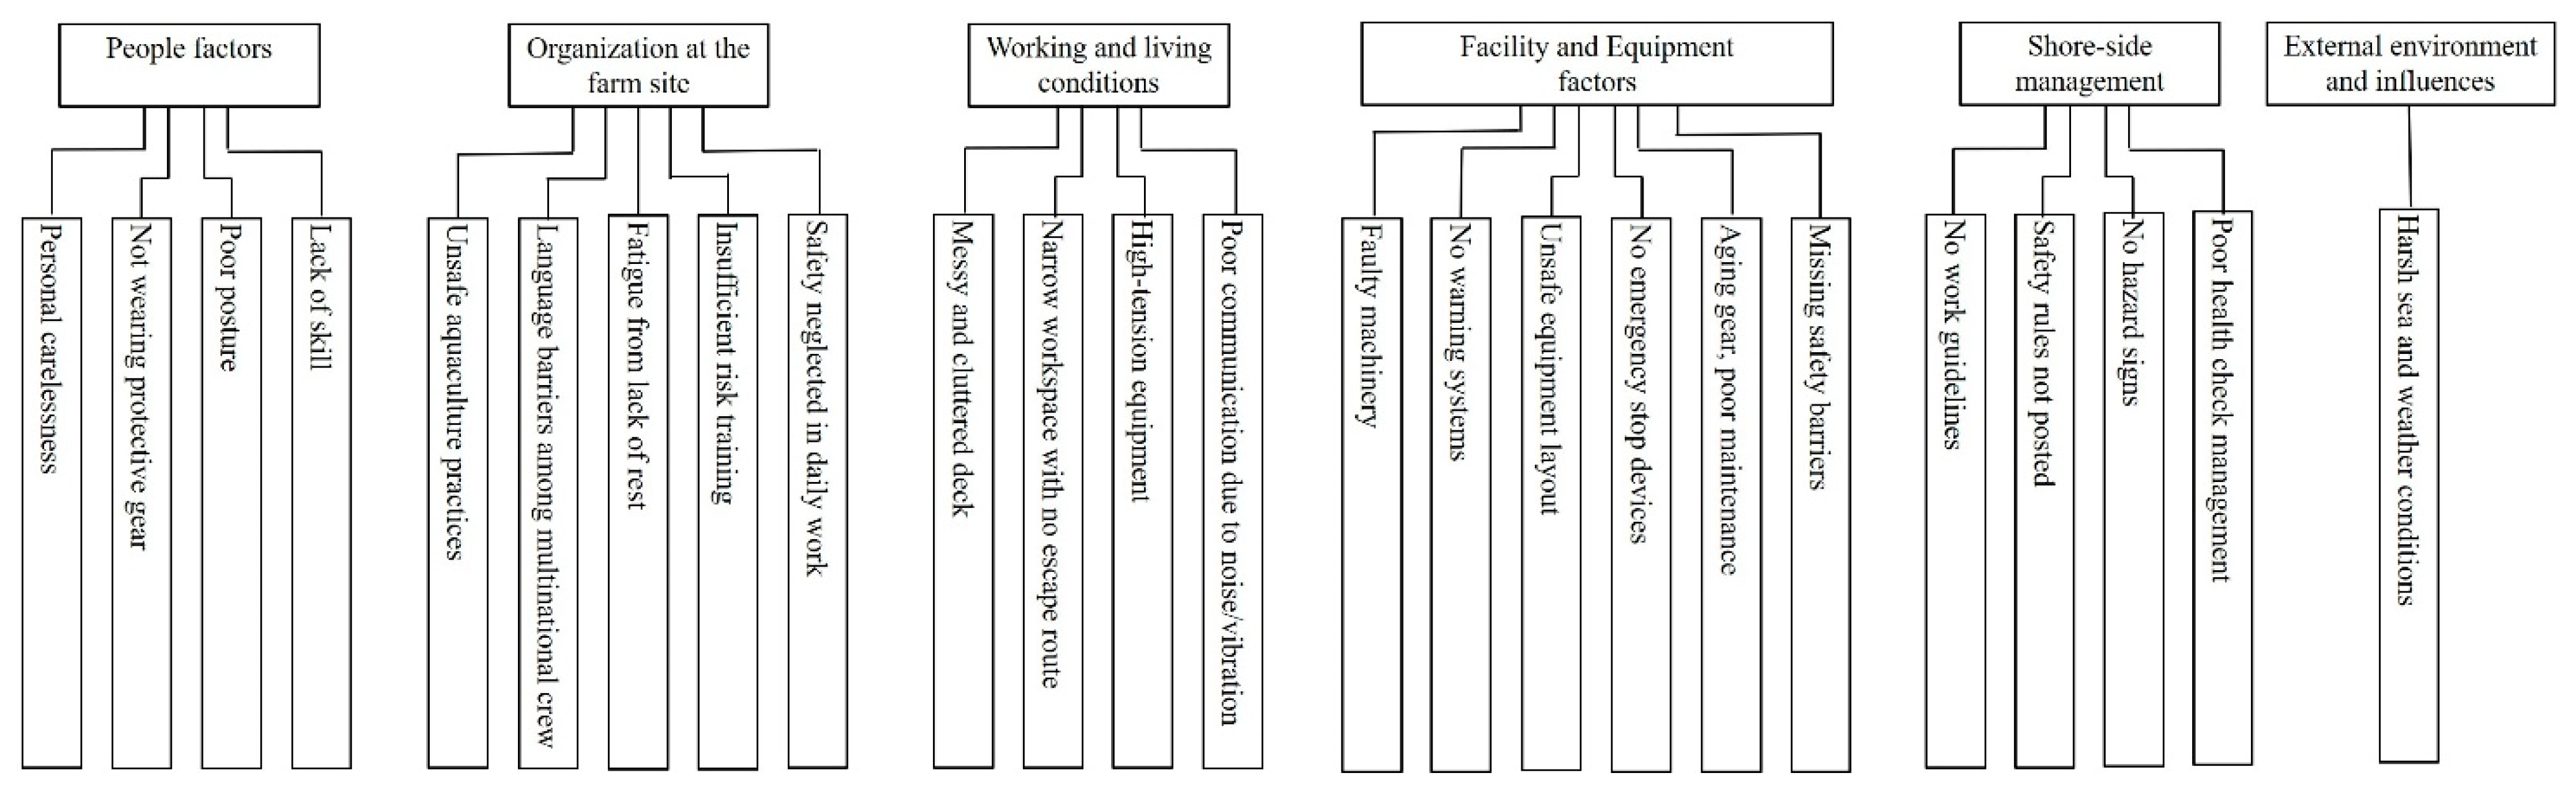
Because IMO Resolution A.884 (21) was prepared based on the survey of accidents in merchant ships, some items were reconstructed to suit the aquaculture industry, and only related basic cause items were selected in this study. In addition, various examples were included for each item considering the understanding of the survey respondents, and six classifications (primary basic causes) and their sub-items (secondary basic causes) were summarized (
Figure 4). Herein, survey items were limited to only secondary basic causes because items below them include complex social science elements that are outside the scope of this study.
2.3. Expert Survey on Basic Causes
A survey was conducted in this study to analyze the practical influence of basic causes. The survey was conducted mainly for fishermen engaged in land-based tank systems, floating cages, and seaweed farms, and the participants were fishermen selected during the production process of the “Fishing Operations Safety and Accident Prevention Manual” supervised by the National Institute of Fisheries Science in Korea (NIFS) [
28].
A survey based on the awareness of accidents was conducted with 202 aquaculture workers. Cases where all questions were not answered were excluded, and finally, the survey results of 193 respondents were used for the analysis. The questionnaire was composed of multiple-choice questions, which included basic personal information (age and career), accident experience, and awareness of working environments.
As for the age distribution of the respondents, 26 people were in their 30s or younger (13.5%), 42 people were in their 40s (21.8%), 58 people were in their 50s (30.15%), and 67 people were in their 60s or older (34.7%). Work experience was less than 10 years for 59 people (30.6%), 10 to 20 years for 54 people (28.0%), 20 to 30 years for 48 people (24.9%), and 30 years or more for 32 people (16.6%).
To prevent the bias of responses, the six primary basic causes presented in
Figure 4 were classified into the four categories of “Man, Management, Machine, and Environment”. Based on the classification, secondary basic cause items were arranged as shown in
Figure 5.
2.4. Quantitative Analysis Method: Fault Tree Analysis
In this study, the FTA technique was applied to quantitatively analyze the effects of basic causes on accidents. The FTA, an analysis technique used to calculate accident probability by logically mapping the occurrence path of a certain accident (top event) and combining causative factors, is one of the risk analysis methods proposed in IMO’s Formal Safety Assessment (FSA) STEP 2 [
26]. It has been used in various safety studies in the marine sector, and it can be used to visually identify the relationship between the causes and basic causes of an accident [
29].
2.4.1. Analysis Procedure
The FTA is typically conducted in the following manner:
Top event selection: The main accident to be analyzed is defined.
Cause identification: Related factors are derived through accident statistics and surveys.
Fault tree (FT) diagram creation: The accident structure is drawn by connecting the causes with a logic gate.
Quantification: The probability of the top event is calculated based on the probability of the basic event.
Risk assessment: The priorities of the risk factors are derived based on the probability calculation results.
2.4.2. Symbols and Terms
The main symbols used in the FTA are summarized in
Table 3.
2.4.3. Probability Calculation
For a quantitative analysis in the FTA technique, logical operations based on Boolean algebra are utilized. The formulae for calculating the probability of accidents according to each gate are as follows:
- (1)
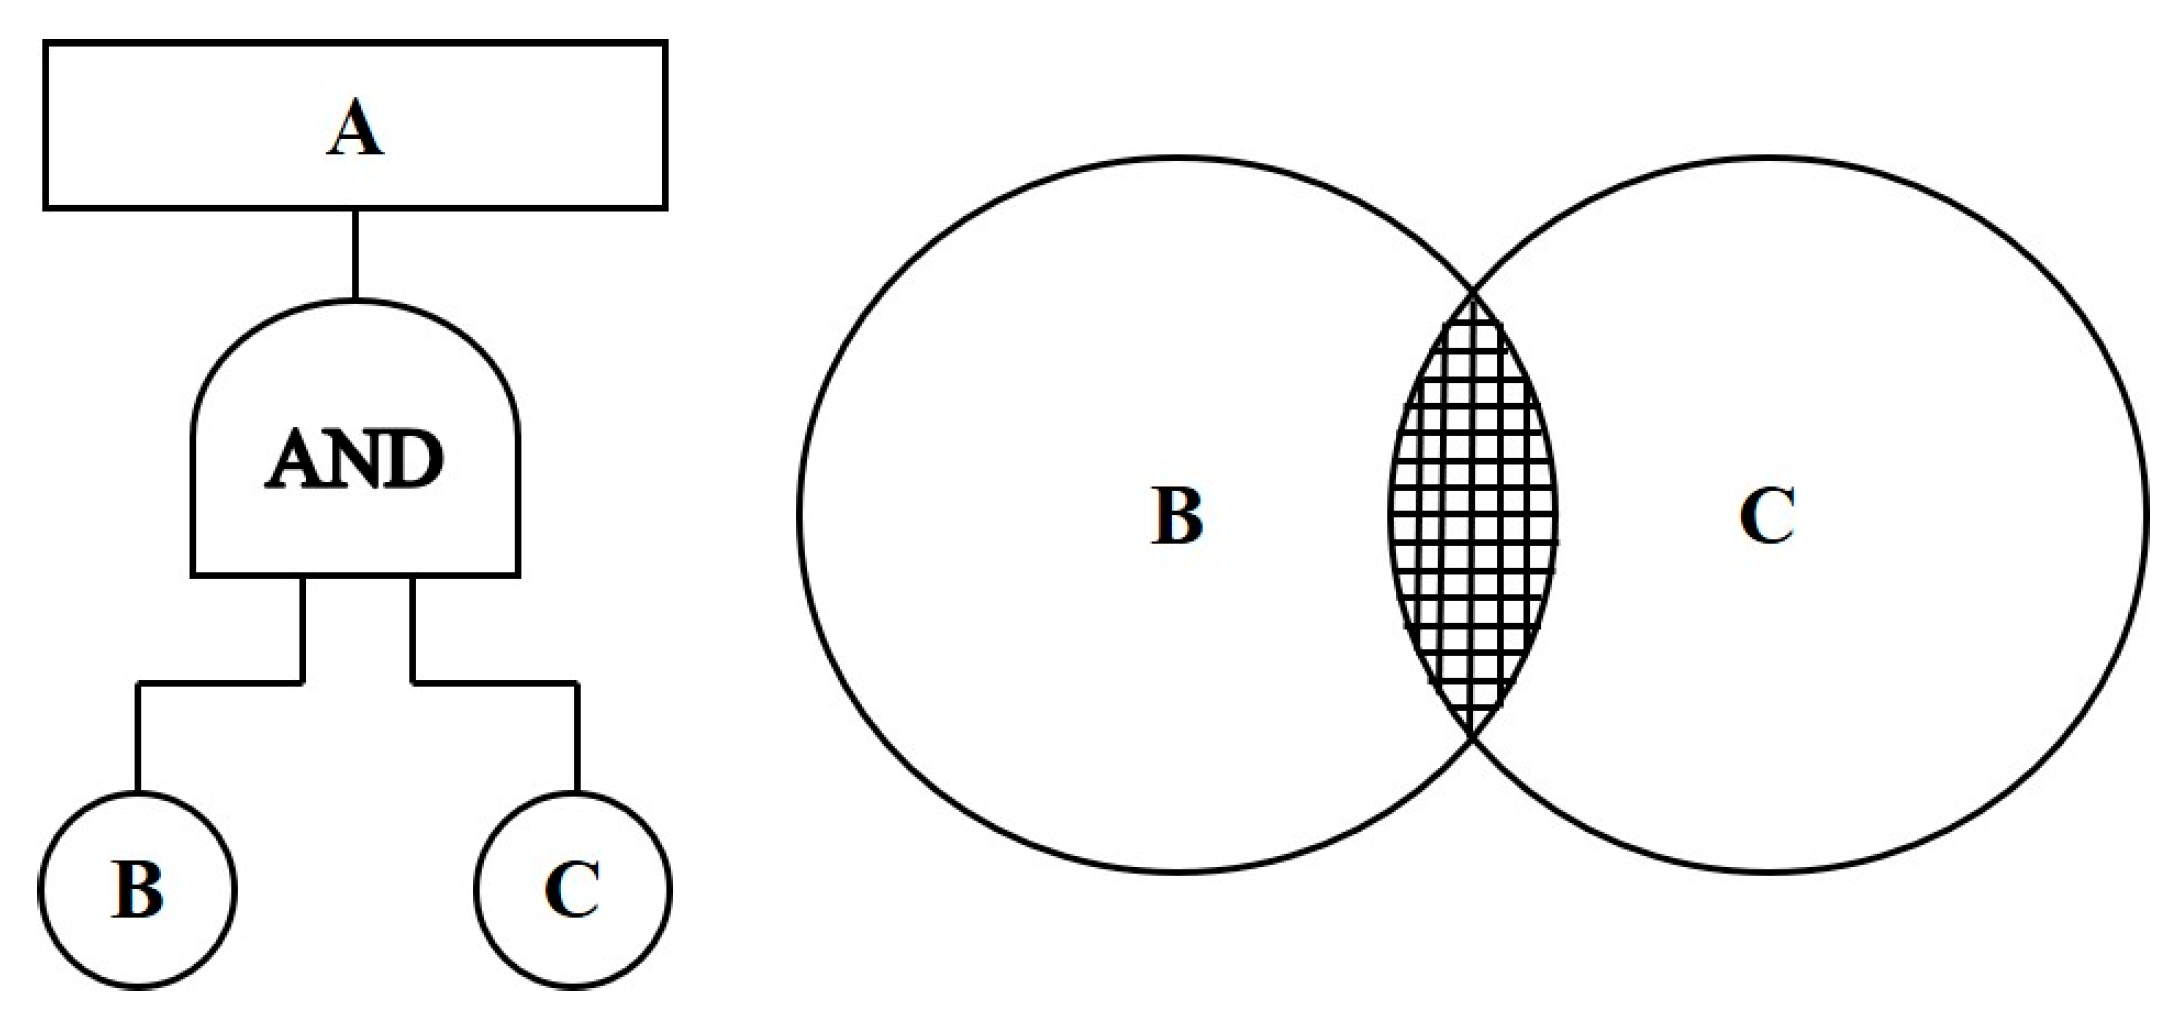
AND gate (logical product)
The AND gate, a structure in which an output event occurs when all the input events occur simultaneously, can be expressed for two independent events B and C as follows (Equations (1)–(3)).
Figure 6 shows its logical structure.
This can be re-written when reliability
R is used as follows:
when
n basic events are combined
- (2)
OR gate (logical sum)
The OR gate, a structure in which an output event occurs when one or more input events occur, can be expressed for independent events B and C as follows (Equations (4)–(6)).
Figure 7 shows its logical structure.
This can be re-written using reliability
R as follows:
when
n basic events are combined
By quantitatively deriving the probability of accidents through these calculations, we can numerically analyze the effects of basic causes on accidents.
3. Results and Analysis
3.1. Accident-Type Analysis: Insurance Data and Worker Awareness Comparison
3.1.1. Accident Analysis Results Through Disaster Compensation Insurance Data
The disaster compensation insurance approval data used in this study were classified by type according to the industrial disaster occurrence code designated by the Korea Occupational Safety and Health Agency (KOSHA) [
30]. Accident types were divided into types related to direct physical damage, such as “trip/slip”, “bump/hit”, “stuck”, and “fall”. Cases where no clear cause was identified or classification was difficult, such as diseases, and other marine accidents (e.g., contact with dangerous substances and exposure to abnormal temperatures) were classified as “others”.
Insurance claims were paid for 325 accidents that occurred over the past five years from 2018 to 2022.
Table 4 presents the results.
The analysis results of all the accident types showed that “trip/slip” accidents exhibited the highest proportion of 37.5%. This is because the areas surrounding farming sites frequently hold water or get wet owing to their nature; in addition, factors such as slippery surfaces caused by moss or seaweed were found to be the main causes. In particular, conditions that make hands or feet slippery were frequently noted during the process of directly handling seaweed.
“Stuck” accidents showed the second highest proportion of 23.1%. There were many cases in which fingers, arms, and legs were stuck in narrow spaces while handling ropes or equipment for transporting harvests between ships and fish farm structures. In particular, wave-induced ship movement and the unexpected motion of floating matter due to tidal currents (cage and seaweed farms) also acted as factors causing stuck accidents. In addition, there was a tendency for workers to overlook safety rules owing to repeated harvest transportation tasks and the pressure of shipping deadlines, which could have further increased the likelihood of accidents.
“Bump/hit” accidents represented 15.7% of all accidents. These accidents mainly occurred when a rope in high tension suddenly broke and hit nearby workers or when transportation equipment containing fish or seaweed during harvest shook and struck body parts. Inside farming sites with limited workspace, in particular, minor impacts were highly likely to lead to physical injury because the gaps between equipment were narrow and the movement paths of workers were limited.
“Fall” accidents accounted for 3.7% of all accidents. The main causes were found to be unstable working environments involving waves and currents as well as narrow workspaces. Meanwhile, the “others” item was excluded from the quantitative analysis of this study because it included cases that were difficult to classify into clear types, such as accidents caused by complex factors, contact with hazardous materials, and exposure to abnormal temperatures.
3.1.2. Results of the Worker Awareness-Based Survey
The results of the survey conducted with workers showed that their awareness of accident types was generally similar to the disaster compensation insurance data analysis results. Among the most frequent accidents perceived by the 193 respondents, “trip/slip” accounted for 36.3%, followed by “stuck” (20.7%). These rankings were consistent with the actual insurance data. They were followed by “fall” (19.2%) and “bump/hit” (13.0%) (
Table 5).
In the actual disaster compensation insurance statistics, “bump/hit” exhibited a higher proportion than “fall”. However, the survey results showed the opposite trend. This can be attributed to the fact that “fall” accidents occurred more frequently; however, they could not meet insurance payment requirements, as most of them caused only minor injuries. In fact, people frequently lose balance and fall into water from fish farm structures or ships owing to environmental factors (e.g., waves and strong winds), and many of these cases do not lead to insurance claims owing to the absence of clear physical damage.
In addition, the respondents with an experience of over 20 years tended to perceive “fall” accidents more frequently than “bump/hit”. With age, physiological changes, such as reduced motor ability, in unstable locations may have affected their perception of accidents. This result reflects the aging issue of aquaculture workers and highlights the need for customized safety management measures that consider experience and age.
3.2. Selection of Accident Types for Risk Assessment
Derivation of Major Accident Types Based on Disaster Compensation Insurance Data and Worker Awareness
Both the analysis of disaster compensation insurance data and the results of the survey with workers showed that “trip/slip” accidents are the most frequently occurring type. Accordingly, “trip/slip” was selected as the key accident type for the risk assessment in this study. To identify the major basic causes of this accident type, an additional survey was conducted with 70 workers who responded that “trip/slip” accidents occur frequently. In the survey results, the basic cause that showed the highest response rate (13.2%) was “personal negligence” of the people factors item, followed by “aging gear, poor maintenance” of the facility and equipment factors item (11.4%), and “insufficient risk training” of the organization at the farm site item (10.4%) (
Table 6).
Table 6 includes the symbols required for
Section 3 (FT diagram configuration).
Notably, factors representing the second and third highest proportions were included in the facility and equipment factors and organization at the farm site, even though several detailed items were included in the people factors. This indicates that basic causes affecting human elements may result from various factors (e.g., equipment conditions and organizational management) without being simply limited to the people factors. This shows that responses for accident prevention should consider improvements in equipment management systems and organizational safety culture as well as personal training.
3.3. FT Diagram Configuration and Quantitative Analysis
3.3.1. FT Diagram Configuration
Typically, accidents can be classified into cases that are caused by human elements and those caused by unavoidable natural phenomena (external environment), such as typhoons and tsunamis. In this study, however, the external environment was considered a reference item for supplementing the FT structure as one of the conditions that cause accidents, and it was excluded from the analysis targets of the risk assessment to construct the FT diagram.
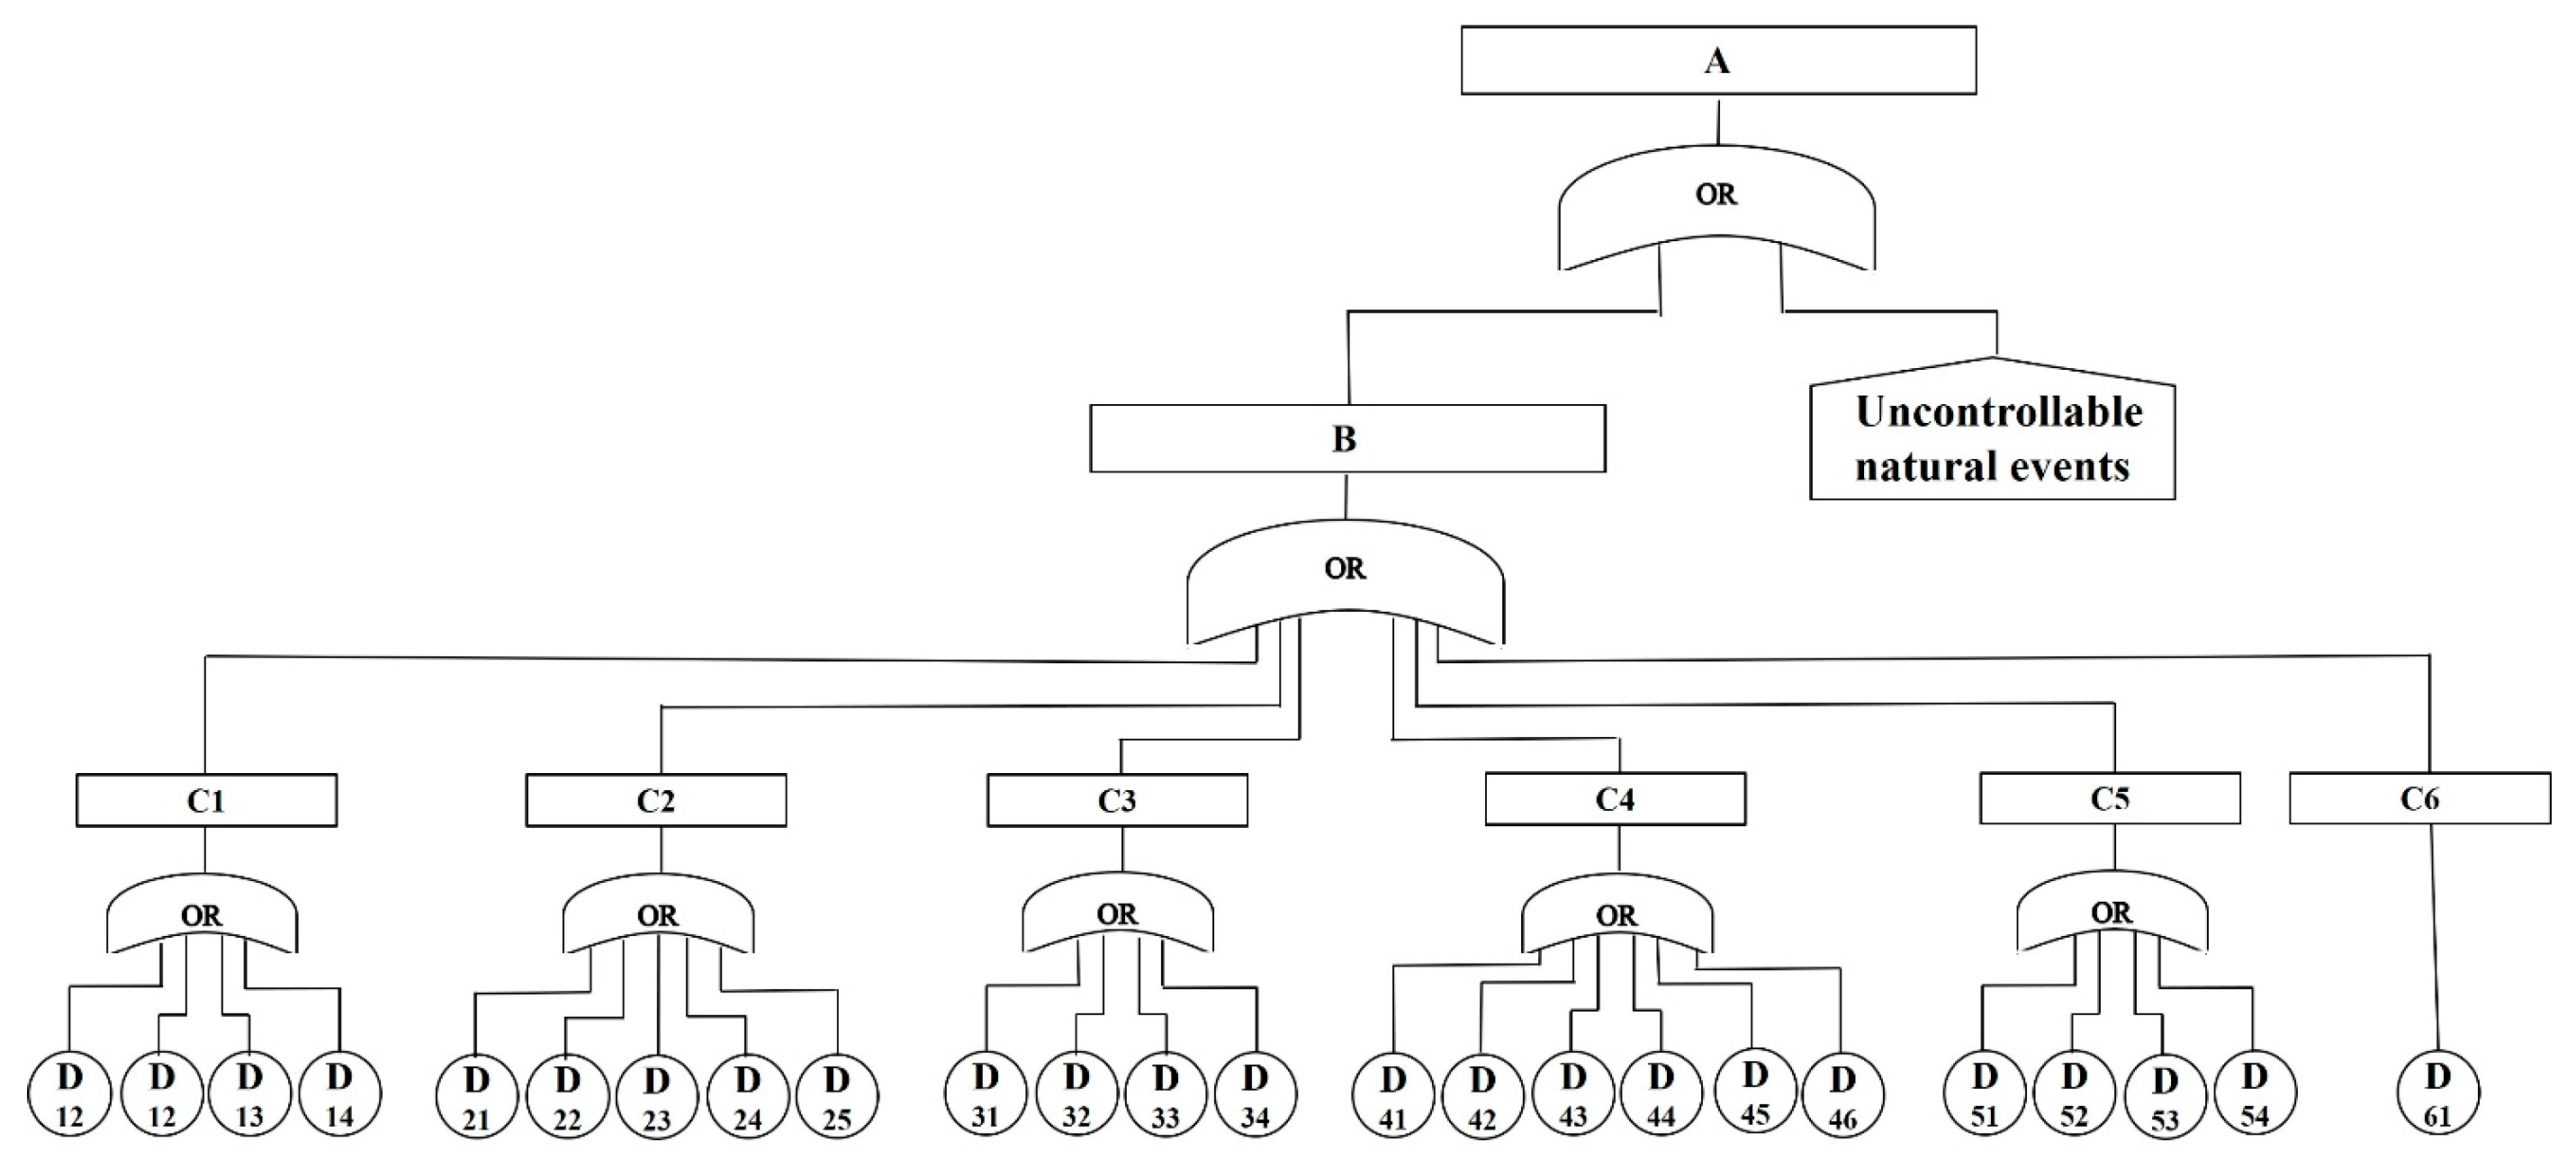
Injury or casualty, which is the final result of accidents, was considered the top event and excluded from the construction. “Trip/slip”, which is the accident type that causes it, was defined as A, while the direct cause (human element) of A was defined as B. It was assumed that B was caused by six primary basic causes (C1 to C6), and each primary cause was again subdivided into 24 secondary basic causes (Dij) (
Figure 8).
In this study, independence among all basic causes was assumed, and each OR gate was constructed under the premise that a single sub-cause may lead to an upper-level event. This reflects the situation in which an accident may occur from a single hidden basic cause.
3.3.2. Calculation of the Probabilities of Secondary and Primary Basic Causes
Based on the results of the additional survey with 70 workers who responded that trip/slip incidents occur most frequently (
Table 6), the probabilities of secondary basic causes were calculated, as shown in
Table 7.
Secondary basic causes are involved in primary basic causes, and they may act as the causes of primary basic causes. The probabilities of primary basic causes were calculated by applying the OR gate (logical sum) to each item as follows:
C1 = 1 − {(1 − D11)(1 − D12)(1 − D13)(1 − D14)} = 0.21358 (21.4%);
C2 = 1 − {(1 − D21)(1 − D22)(1 − D23)(1 − D24)(1 − D25)} = 0.23311 (23.3%);
C3 = 1 − {(1 − D31)(1 − D32)(1 − D33)(1 − D34)} = 0.12974 (13.0%);
C4 = 1 − {(1 − D41)(1 − D42)(1 − D43)(1 − D44)(1 − D45)(1 − D46)} = 0.2275 (22.8%);
C5 = 1 − {(1 − D51)(1 − D52)(1 − D53)(1 − D54)} = 0.07026 (7.0%);
C6 = 1 − (1 − D61) = 0.061 (6.1%).
Consequently, the contributions of the primary basic causes affecting the probability of human elements, which are the direct causes of trip/slip incidents, are as follows:
Organization at the farm site (C2): 23.3%;
Facility and equipment factors (C4): 22.8%;
People factors (C1): 21.4%;
Working and living conditions (C3): 13.0%;
Shore-side management (C5): 7.0%;
External influences and environment (C6): 6.1%.
Conventionally, the causes of accidents were attributed to human elements. Consequently, preventive measures were mostly focused on the education and training of workers. The analysis results of this study, however, showed that organization at the farm site had the greatest impact among the basic causes of human elements and that facility and equipment factors had a greater impact than the people factors. This indicates that preventive measures against accidents that lead to human elements should not be limited to simple education for human factors and that a system capable of eliminating basic causes in a more systematic manner is required.
The probability that human elements will occur (B) was calculated as follows:
Thus, the probability that human elements will occur owing to basic causes was approximately 64.6%.
3.3.3. Analysis of the Structure of Basic Causes
From the research results, it could not be determined whether primary basic causes with high probabilities necessarily had the greatest impact on the probability of human elements. This is because the impact of primary basic causes on the probability of human elements varies depending on the probabilities and structural characteristics of the secondary basic causes inherent in the primary basic causes. To verify this, the case of selectively removing insufficient risk training (D24, 10.4%) with the highest probability among the secondary basic causes included in the organization at the farm site (C2), which is the primary basic cause with the highest probability, was compared with the case of eliminating personal negligence (D11, 13.2%), which showed the highest probability among all the secondary basic causes.
When D24 was removed (change in the probability of C2)
After D24 removal, C2 = 1 − {(1 − D21)(1 − D22)(1 − D23)(1 − D25)} = 0.1441.
B′ = 1 − {(1 − C1)(1 − 0.1441)(1 − C3)(1 − C4)(1 − C5)(1 − C6)} = 0.60495 (60.5%).
The probability of human elements decreased by approximately 4.1%.
When D11 was removed (change in the probability of C1)
After D11 removal, C1 = 1 − {(1 − D12)(1 − D13)(1 − D14)} = 0.09398.
B′ = 1 − {(1 − 0.09398)(1 − C2)(1 − C3)(1 − C4)(1 − C5)(1 − C6)} = 0.5922 (59.2%).
The probability of human elements decreased by approximately 5.4%.
The above results verify that removing the item with the highest risk (D11) among the secondary basic causes can help reduce the probability of human elements more significantly than simply removing the primary basic cause with a high probability (C2). This indicates that the method of selectively removing the secondary basic causes hidden inside the primary basic causes that are easy to identify after analyzing their probabilities and impacts can be more effective than primary basic cause-oriented approaches.
4. Discussion
4.1. Impact of Human Elements and Limitations of Safety Awareness
The survey results revealed that aquaculture workers considered organization at the farm site and facility and equipment factors more important than the people factors as the basic causes of accidents. This shows that safety issues result from structural problems, such as the absence of working instructions, lack of delivery systems, and insufficient on-site management, rather than personal negligence. Therefore, it is necessary to construct an organizational safety management system and improve on-site management beyond personal negligence so as to address the safety issues in the aquaculture industry.
In practical terms, the findings suggest that aquaculture operations should adopt standardized operating procedures (SOPs) for high-risk tasks such as rope handling, harvest transfers, and net maintenance. Regular safety inspections and maintenance checklists tailored to fish farm environments are also needed. Moreover, targeted training programs for aging workers, who are shown to perceive higher fall risks, and clear visual safety signage on platforms can contribute to establishing a sustainable safety culture.
4.2. Significance and Limitations of Quantitative Analysis Through FTA
In this study, the FTA technique was applied to quantitatively identify the logical structure between accident factors. This made it possible to calculate the contributions of each basic cause to the probability of accidents, and the results were used as a significant basis for setting the priorities of safety management. Because survey-based probability values were used for the FTA in this study, some assumptions may have led to limitations. The generalization of the analysis results can also be restricted owing to the problem of sample representativeness. In future research, various techniques, such as dynamic risk assessment, will be applied to improve reliability.
One limitation of this study is that the accident data were sourced exclusively from Korea’s accident compensation insurance system. As such, accidents that were not reported or did not result in insurance claims—particularly minor or undocumented incidents—may not be reflected in the analysis. This potential underreporting introduces uncertainty in comprehensiveness.
In terms of methodology, this study applied Fault Tree Analysis (FTA) primarily at the level of risk identification and quantification, focusing on the relationships among human element-related causes. While this approach offers practical insights for aquaculture, it differs from more comprehensive FTA applications in other maritime domains. For example, Uğurlu et al. [
9] employed FTA to evaluate fishing vessel accidents in Turkey, incorporating operational, mechanical, and environmental variables. Their study emphasized systemic failures and equipment risks. By contrast, the present study emphasizes worker perception and behavior, which are often underrepresented in FTA applications.
4.3. Institutional Implications
Currently, international conventions or domestic laws applicable to the aquaculture industry are highly insufficient, and the application of industrial accident compensation insurance is also limited. This necessitates institutional supplementation that establishes safety management guidelines specialized for the aquaculture industry and expands the scope of application of disaster compensation insurance.
Furthermore, the development of customized safety education programs considering the characteristics of fish farms is required. In addition to on-site practice-oriented education, the implementation of supportive policies is required—such as the provision of protective gear, the introduction of risk assessment systems, and regular safety inspections. These policies can contribute to the establishment of a safety culture in the aquaculture industry, and their practical effect on accident prevention can be expected.
In addition to regulatory and institutional limitations, broader social and organizational determinants must be considered. Informal employment structures, job insecurity, and limited institutional support influence risk perception and behavior at a systemic level. Moreover, foreign and migrant workers face additional risks due to language barriers, unstable employment, and limited access to safety training and support systems. Inclusive policies and multilingual training strategies are essential to ensure equitable safety outcomes in this sector.
Future research and policy efforts should seek to integrate these macro-level determinants with existing technical and organizational measures to promote more comprehensive and just safety management systems in aquaculture.
5. Conclusions
This study employed Fault Tree Analysis (FTA), the technique from the IMO’s Formal Safety Assessment (FSA) framework, to quantitatively examine accident risks in the aquaculture industry with a focus on human elements. Drawing on structured insurance data and field-based survey responses, it identified both individual and systemic factors that contribute to accidents, including deficiencies in organization at the farm site and facility and equipment factors.
The core contribution of this study lies in its novel application of quantitative FTA to the aquaculture sector—an area where safety research remains limited. While prior research has emphasized human error in capture fisheries, this study extends the focus to aquaculture and presents a structured methodology that integrates human factor frameworks into a risk prioritization model. This approach supports more evidence-driven decisions in safety planning.
Importantly, the study’s findings informed the development of three industry-specific safety manuals—covering land-based tank systems, cages, and seaweed farming—which provide actionable guidelines and SOPs for accident prevention. This reflects the study’s value beyond academic insight, demonstrating its contribution to policy and practice.
Future research should build upon this framework by integrating dynamic risk assessment techniques that capture time-varying operational conditions and by validating the findings across different aquaculture systems and geographical regions. Broader and more diverse samples will also improve the generalizability of the results and support the establishment of a robust, scalable safety management model for the aquaculture industry.
Author Contributions
Conceptualization, S.-H.K.; methodology, K.-J.R.; software, S.-H.L.; analysis, S.-H.K.; writing—original draft preparation, Y.-W.L.; writing—reviewing and editing, Y.-W.L.; supervision, S.-H.K. All authors have read and agreed to the published version of the manuscript.
Funding
This research was conducted as part of the “Development and demonstration of data platform for AI-based safe fishing vessel design (RS-2022-KS221571)” of the Ministry of Oceans and Fisheries.
Institutional Review Board Statement
Not applicable.
Informed Consent Statement
Not applicable.
Data Availability Statement
The data used to support the findings of this study are available from the corresponding author.
Conflicts of Interest
The authors declare no conflicts of interest.
Abbreviations
The following abbreviations are used in this manuscript:
| IMO | International Maritime Organization |
| FSA | Formal Safety Assessment |
| FTA | Fault Tree Analysis (FTA) |
References
- FAO. The State of World Fisheries and Aquaculture 2022; Food and Agriculture Organization of the United Nations: Rome, Italy, 2022; Available online: https://openknowledge.fao.org/handle/20.500.14283/cc0461en (accessed on 10 March 2024).
- ILO—International Labour Organization. C188—Work in Fishing Convention. Labour Standards. 2007. Volume 2007. Available online: https://normlex.ilo.org/dyn/nrmlx_en/f?p=NORMLEXPUB:12100:0::NO::P12100_ILO_CODE:C188 (accessed on 10 March 2024).
- IMO—International Maritime Organization. International Convention on Standards of Training, Certification and Watchkeeping for Fishing Vessel Personnel (STCW-F). 1995. Available online: https://www.imo.org/en/OurWork/HumanElement/Pages/STCW-F-Convention.aspx (accessed on 10 March 2024).
- IMO—International Maritime Organization. Cape Town Agreement (Explained). 2012. Available online: https://sway.cloud.microsoft/pGZcJtkSuHNxDzy5?ref=Link (accessed on 10 March 2024).
- Kim, H.; Koo, K.; Lim, H.; Kwon, S.; Lee, Y. Analysis of Fishing Vessel Accidents and Suggestions for Safety Policy in South Korea from 2018 to 2022. Sustainability 2024, 16, 3537. [Google Scholar] [CrossRef]
- Lincoln, J.M.; Lucas, D.L. Occupational fatalities in the United States commercial fishing industry, 2000–2009. J. Agromed. 2010, 15, 343–350. [Google Scholar] [CrossRef] [PubMed]
- Jensen, O.C.; Petursdottir, G.; Holmen, I.M.; Abrahamsen, A.; Lincoln, J. A review of fatal accident incidence rate trends in fishing. Int. Marit. Health 2014, 65, 47–52. [Google Scholar] [CrossRef] [PubMed]
- Laursen, L.H.; Hansen, H.L.; Jensen, O.C. Fatal occupational accidents in Danish fishing vessels 1989–2005. Int. J. Inj. Control. Saf. Promot. 2008, 15, 109–117. [Google Scholar] [CrossRef] [PubMed]
- Uğurlu, F.; Yıldız, S.; Boran, M.; Uğurlu, Ö.; Wang, J. Analysis of fishing vessel accidents with Bayesian network and chi-square methods. Ocean Eng. 2020, 198, 106956. [Google Scholar] [CrossRef]
- Akhtar, M.J.; Utne, I.B. Human fatigue’s effect on the risk of maritime groundings—A Bayesian Network modeling approach. Saf. Sci. 2014, 62, 427–440. [Google Scholar] [CrossRef]
- Li, K.X.; Yin, J.; Bang, H.S.; Yang, Z.; Wang, J. Bayesian network with quantitative input for maritime risk analysis. Transp. A 2014, 10, 89–118. [Google Scholar] [CrossRef]
- Kim, S.H.; Lee, S.H.; Ryu, K.J.; Lee, Y.W. Analysis of accidents of fishing vessels caused by human elements in Korean sea area. J. Mar. Sci. Eng. 2024, 12, 1564. [Google Scholar] [CrossRef]
- Zohorsky, P.J. Human Error in Commercial Fishing Vessel Accidents: An Investigation Using the Human Factors Analysis and Classification System. Ph.D. Dissertation, Old Dominion University, Norfolk, VA, USA, 2020. [Google Scholar]
- Obeng, F.; Domeh, V.; Khan, F.; Bose, N.; Sanli, E. Analyzing operational risk for small fishing vessels considering crew effectiveness. Ocean Eng. 2022, 249, 110512. [Google Scholar] [CrossRef]
- Lazakis, I.; Kurt, R.E.; Turan, O. Contribution of human factors to fishing vessel accidents and near misses in the UK. J. Ship Ocean Eng. 2014, 4, 245–261. [Google Scholar]
- Wu, Y.; Pelot, R.P.; Hilliard, C. The influence of weather conditions on the relative incident rate of fishing vessels. Risk Anal. An Int. J. Risk Anal. 2009, 29, 985–999. [Google Scholar] [CrossRef] [PubMed]
- Rezaee, S.; Pelot, R.; Ghasemi, A. The effect of extreme weather conditions on commercial fishing activities and vessel incidents in Atlantic Canada. Ocean Coast. Manag. 2016, 130, 115–127. [Google Scholar] [CrossRef]
- Zhang, Z.; Li, X.M. Global ship accidents and ocean swell-related sea states. Nat. Hazards Earth Syst. Sci. 2017, 17, 2041–2051. [Google Scholar] [CrossRef]
- Fry, J.P.; Ceryes, C.A.; Voorhees, J.M.; Barnes, N.A.; Love, D.C.; Barnes, M.E. Occupational Safety and Health in U.S. Aquaculture: A Review. J. Agromed. 2019, 24, 405–423. [Google Scholar] [CrossRef] [PubMed]
- Ramasamy, A.; Rajkumar, P.; Dandamudi, S. Occupational health problems and major risk factor profile of non-communicable diseases among workers in the aquaculture industry in Visakhapatnam. J. Fam. Med. Prim. Care 2022, 11, 3216–3220. [Google Scholar] [CrossRef]
- Thorvaldsen, T.; Kongsvik, T.; Holmen, I.M.; Størkersen, K.; Holen, S. Revisiting Occupational Health and Safety in Norwegian Fish Farming—Results from an Employee Survey. Aquaculture 2025, 603, 742441. [Google Scholar] [CrossRef]
- Ministry of Oceans and Fisheries. Fishermen and Fishing Vessel Accident Compensation Insurance Act; MOF: Sejong, Republic of Korea, 2004.
- Kim, I.-Y. A Study on the Indemnity System of Fishery Damage by Natural Disasters. J. Fish. Mar. Sci. Educ. 2014, 26, 1044–1057. [Google Scholar] [CrossRef]
- Lee, S.-H.; Kim, S.-H.; Ryu, K.-J.; Lee, Y.-W. Analysis of Risk Factors for Safety Accidents for Fisher Onboard Aquaculture Fisheries Management Vessel. J. Korean Soc. Fish. Ocean Technol. 2024, 60, 170–178. [Google Scholar] [CrossRef]
- IMO. Amendments to the Code for the Investigation of Marine Casualties and Incidents. Resolution A.884(21). Vols. 11–13. 2000. Available online: https://wwwcdn.imo.org/localresources/en/KnowledgeCentre/IndexofIMOResolutions/AssemblyDocuments/A.884(21).pdf (accessed on 12 February 2025).
- IMO. Guidelines for Formal Safety Assessment (FSA) for Use in the IMO Rule-Making Process. MSC/Circ.1023-MEPC/Circ.392. 2002, pp. 1–54. Available online: https://wwwcdn.imo.org/localresources/en/OurWork/HumanElement/Documents/1023-MEPC392.pdf (accessed on 7 March 2025).
- Rad, K.G. Application of domino theory to justify and prevent accident occurance in construction sites. IOSR J. Mech. Civ. Eng. IOSR-JMCE 2013, 6, 72–76. [Google Scholar]
- NIFS—National Institute of Fisheries Science. Fisheries. Guide for the Prevention of Occupational Accidents. 2024. Available online: https://www.nifs.go.kr/board/actionBoard0047List.do?MENU_ID=M0000179?MENU_ID=M0000179 (accessed on 10 March 2024).
- Sarbayev, M.; Yang, M.; Wang, H. Risk assessment of process systems by mapping fault tree into artificial neural network. J. Loss Prev. Process Ind. 2019, 60, 203–212. [Google Scholar] [CrossRef]
- KOSHA—Korean Occupational Safety Health Agency. Guide of Records and Classification for Industrial Accident; Korean Occupational Safety Health Agency: Ulsan, Republic of Korea, 2016; pp. 1–6.
| Disclaimer/Publisher’s Note: The statements, opinions and data contained in all publications are solely those of the individual author(s) and contributor(s) and not of MDPI and/or the editor(s). MDPI and/or the editor(s) disclaim responsibility for any injury to people or property resulting from any ideas, methods, instructions or products referred to in the content. |
© 2025 by the authors. Licensee MDPI, Basel, Switzerland. This article is an open access article distributed under the terms and conditions of the Creative Commons Attribution (CC BY) license (https://creativecommons.org/licenses/by/4.0/).


