1. Introduction
Flowerhorn cichlids are one of the most important economic ornamental fish species. They are popular worldwide due to their vibrant colors, unique body shapes, and captivating behavior [
1]. The beautiful appearance of these ornamental fish depends on proper nutrition to promote growth, coloration, and immunity [
2,
3]. Pigmentation or coloration of ornamental fish is an essential characteristic for world market acceptability, with carotenoids responsible for the pigmentation of several ornamental fish species [
4,
5]. Ornamental fish cannot biosynthesize carotenoids in their bodies and their coloration relies on a carotenoid-rich diet. Carotenoids are natural pigments that are present in various algae, plants, animals, and some bacteria [
6]. Carotenoids have excellent antioxidant properties and are used as feed supplements to enhance cell growth, immune systems, and disease resistance [
7]. These multifaceted functions make carotenoids indispensable for the well-being of ornamental fish. Incorporating carotenoid-rich diets in aquaculture practices could help to improve growth, survival, coloration, and disease resistance in commercial ornamental fish.
Fairy shrimp are small crustaceans (Anostraca) commonly found in temporary water bodies. They are popular live feed for freshwater aquaculture of ornamental fish because of their high nutritional value including proteins, amino acids, and essential fatty acids. Fairy shrimp contain high amounts of carotenoids [
8] and have been studied as a potential food source for fish [
9,
10] and shrimp [
11,
12] in aquaculture. Feeding fish and prawns with fairy shrimp improved the fecundity and hatching percentage of aquatic animals such as angel fish, green tailor fish, and cray fish (
Procambarus clarkii) [
13,
14]. Research suggests that fairy shrimp are a valuable food source in aquaculture [
15] and provide nutritional benefits to different aquatic organisms [
16,
17]. Many previous studies have focused on the use of live fairy shrimp but the development of fairy shrimp as meal in the diet has not been addressed. Fairy shrimp in formulated feeds for aquarium fish showed enhanced skin pigmentation. Dried fairy shrimp meal increased skin pigmentation and carotenoid deposition in flowerhorn cichlids [
18]. However, limited research has examined the effects of formulated feeds containing fairy shrimp meal components on antioxidant activity, hematological parameters, blood chemical composition, and immunity relating to the health of ornamental fish. The potential benefits and drawbacks of incorporating fairy shrimp into formulated feeds to enhance the health of ornamental fish need to be explored.
Therefore, this research investigated the impact of incorporating dried fairy shrimp meal in feed on the growth performance, skin pigmentation, antioxidant activity, hematological parameters, blood chemical composition, and immunity of flowerhorn cichlids following treatment with newly formulated feeds containing fairy shrimp. Economic data of the newly formulated feed were also analyzed.
2. Materials and Methods
2.1. Fish Preparation and Experimental Design
Healthy flowerhorn cichlids, Amphilophus citrinellus (Günther, 1864) × Cichlasoma trimaculatum (Günther, 1867), were obtained from a commercial fish farm in Khon Kaen Province, Thailand and acclimated for 2 weeks at the Division of Fisheries, Faculty of Technology, Mahasarakham University, Maha Sarakham, Thailand. After acclimatization, the fish with an initial weight of 18.88 to 19.85 g were randomly transferred into 36 tanks (76 × 155 × 96.5 cm3) containing 40 L of dechlorinated tap water and divided into four experimental groups with nine replicates. During the feeding trial, the fish were fed twice daily with a feeding rate of 5% biomass per day throughout the 60-day experimental period. The tank water was exchanged every day (10%) to remove the remaining feed from the previous day by siphoning and the water volume was replaced. Water quality was maintained throughout the feeding trial (water temperature 28 ± 2 °C; dissolved oxygen ≥ 7.0 mg/L; pH 7.2–8.1; total ammonia nitrogen levels < 0.2 mg/L).
2.2. Preparation of Tested Diets
Four equal-nitrogenous (40% crude protein) and equal-energetic (428.51 Kcal/100 g) experimental diets were formulated by substituting 0% (FS0—control), 10% (FS10), 20% (FS20), and 30% (FS30) of fish meal protein with fairy shrimp protein. Fairy shrimp,
Branchinella thailandensis, was received from Swed Thai Trading Co., Ltd., Samut Prakan, Thailand.
B. thailandensis contains protein 64.65%, lipid 7.57%, carbohydrate 16.24%, fiber 5.12%, and ash 6.12% [
8]. The diets were formulated with fish meal, fairy shrimp meal, soybean meal, wheat flour, corn meal, squid liver meal, red yeast, soybean oil, squid liver oil, and premix.
The ingredients were pressed through a 1 mm mesh and mixed. The pellets were dried in a hot air oven (UF750, Memmert, Schwabach, Germany) at 40 °C for 24 h and stored in bags in a freezer at −20 °C until used. Proximate analyses of the diets were performed using the standard methods of the Association of Official Analytical Chemists (AOAC) [
19]. The formulation and basic nutrient composition of the experimental diets are given in
Table 1.
2.3. Growth Performance Parameters
Every 15 days and at the end of the experiment, the fish were individually anesthetized in a clove oil solution (0.2 mL/L water) for 10 min. The total number and individual body length and weight of each fish were measured using an electronic balance and a vernier caliper to estimate the biometric indices. The survival rate, growth performance, and feed utilization of fish fed the test diets were determined according to the following formulae: survival rate (SR; %) = (number of survived fish/initial number of fish) × 100; weight gain (WG; g) = final body weight–initial body weight; specific growth rate (SGR; % d−1) = 100 × [(Ln (final body weight) − Ln (initial body weight))/duration]; average daily gain (ADG; %) = (final body weight − initial body weight)/duration; feed conversion ratio (FCR) = apparent feed intake/weight gain.
2.4. Skin Color Measurement
Skin coloration was measured in the skin zones on both lateral body sides of all fish. Measurements were recorded at the end of the feeding trial using a Chroma Meter (Chroma Meter CR-400, Konica Minolta, Osaka, Japan). The L*, a*, and b* parameters were measured based on the International Commission on Illumination (CIE) (CIE, 1976):
L* = lightness, where dark = 0 and white = 100;
a* = redness, where positive values = red and negative values = green;
b* = yellowness, where positive values = yellow and negative values = blue.
Chroma and hue angle (◦Hue) were calculated from a* and b* according to the following equations. Hue (H°ab) represents the dominant wavelength of a color; it is calculated using the H°ab = tan
−1(b*/a*) but if a* < 0 then H°ab = 180 + tan
−1(b*/a*). Chroma (C*) represents the colorfulness or saturation of a color and is calculated using the a* and b* values. C* = (a*
2 + b*
2)
1/2 [
20].
2.5. Total Carotenoid Analysis
The samples were dried in a hot air oven (UF750, Memmert, Schwabach, Germany) at 45 °C for at least 6 h and then ground to a powder using an electric homogenizer. Each sample was weighed to an accuracy of 0.5 g. Carotenoids were liberated from the samples by homogenization and suspension in 5 mL of acetone according to the previous methods [
21] The supernatant was collected after centrifuging at 5000 rpm for 5 min, evaporated (rotary evaporator, RC900, KNF Neuberger GmbH, Freiburg im Breisgau, Germany) at 40 °C, and then dissolved in petroleum ether. The sample was saponified with 0.5 mL 60% KOH in the dark for 2 h. Carotenoids were extracted by partitioning in petroleum ether. The top layer was removed into another tube using a glass pipette. Then, 0.5 g of anhydrous sodium sulfate was added to the tube and left to stand for 15 min to absorb any residual water in the solution. Total carotenoid concentration was then measured for absorbance at 450 nm wavelength using a GENESYS™ 20 visible spectrophotometer (Thermo Fisher Scientific, Waltham, MA, USA) and the total carotenoid concentration was calculated.
2.6. Proximate Composition
Crude protein, crude lipid, moisture, fiber, and ash of the feed and the experimental fish were determined according to the methods of the Association of Official Analytical Chemists [
19]. Moisture content was analyzed by oven drying at 105 °C (Memmert, Schwabach, Germany) until constant weight. Crude protein content (N × 6.25) was determined by the Kjeldahl method using an Auto Kjeldahl System (Buchi B324/K-437, Flawil, Switzerland). Crude lipid content was measured by hexane extraction using SOXTERM (Gerhardt GmbH, Königswinter, Germany). Ash content was determined by incineration in a muffle furnace at 550 °C for 7 h.
2.7. Blood Biochemical Analysis
Blood samples were collected and sent to the Veterinary Central Lab, Khon Kaen District, Khon Kaen 40000, Thailand for blood chemical analysis. For the blood chemistry parameters, the assays were run on an ABX Pentra 400 Clinical Chemistry Analyzer (HORIBA Medical, Montpellier, France). Each of the assays used was the standard kit developed for the auto-analyzer. Tests were performed for globulin, total protein, blood urea nitrogen (BUN), alanine aminotransferase (ALT), aspartate aminotransferase (AST), alkaline phosphatase (ALP), and cholesterol. Globulin was calculated by subtracting the value of albumin from the total protein.
2.8. Hematological Analysis
Total red blood cell (RBC) and white blood cell (WBC) counts were obtained using a standard Neubauer hemocytometer chamber. The hematocrit (Ht) was determined by filling hematocrit capillary tubes. The Ht values were recorded using a centrifuge combo-reader. Hemoglobin (Hb) concentration was measured by a lysing reagent kit (ABX reagent, Horiba, France) and used for erythrocyte lysis and cyanide-free determination of hemoglobin. The hemoglobin was released, and all the heme irons were oxidized and stabilized. The resulting complexes were quantified by spectrophotometry with a wavelength of 550 nm using a hematology analyzer (ABX Micros EVS 60, Horiba, Montpellier, France).
2.9. Innate Immune Parameters
Serum lysozyme activity was determined by the turbidimetric method based on the lysis of the lysozyme-sensitive Gram-positive bacterium
Micrococcus lysodeikticus (Sigma Aldrich, St. Louis, MO, USA) following the method in [
22]. The serum lysozyme activity was measured and expressed as U/mL. Briefly, a 25 µL aliquot of serum was added to 100 μL of the bacterial suspension (3.0 mg/mL in 0.05 M PBS pH 6.4), and the absorbance was measured at 450 nm after 30 s and 180 s (iMark™ Microplate Absorbance Reader, Bio-Rad Laboratories, Hercules, CA, USA).
The total myeloperoxidase (MPO) content present in the serum was measured [
23,
24], with slight modifications. Briefly, aliquots of 20 μL of serum were diluted with PBS in 96-well plates. Then, 35 μL of 20 mM 3,3′-5,5′-tetramethyl benzidine hydrochloride (Sigma, USA) and 5 mM of H
2O
2 were added. The color change reaction was stopped after 2 min by adding 35 μL of 4 M H
2SO
4. Finally, the OD was read at 450 nm (iMark™ Microplate Absorbance Reader, Bio-Rad Laboratories, Hercules, CA, USA).
2.10. Antioxidant Enzymes Activity and Lipid Peroxidation
Superoxide dismutase (SOD) activity was evaluated [
24]. Briefly, 20 μL of serum was added to 940 μL of sodium carbonate buffer and 40 μL of epinephrine (30 mmol/L dissolved by adding 30 μL of HCL, Sigma, USA). The inhibition of epinephrine auto-oxidation in the alkaline medium to adrenochrome was recorded after 30 and 90 s at 480 nm using an iMark™ Microplate Absorbance Reader, Bio-Rad Laboratories, Hercules, CA, USA. A control was prepared using 960 μL of sodium carbonate buffer and 40 μL of epinephrine. The percent of inhibition (%) = 100 − ((ΔA control − ΔA sample/ΔA control) × 100). SOD activity in serum = % inhibition × 3.75.
Lipid peroxidation in terms of malondialdehyde (MDA) was determined by measuring the amount of thiobarbituric acid reactive substances (TBARS) [
25]. The MDA concentration was measured using a GENESYS™ 20 Visible Spectrophotometer (Thermo Fisher Scientific, Dreieich, Germany) at 532 nm.
2.11. Economic Analysis of Experimental Diets
At the end of the experiment, an economic analysis was conducted to evaluate the financial feasibility of feeding flowerhorn cichlids with diets containing different levels of fairy shrimp meal. The analysis was performed in Thai Baht (THB) and Euro (EURO) using standard economic principles. The economic conversion ratio (ECR) assesses the feed cost efficiency using the following equation:
The diet price was calculated based on the cost of individual feed ingredients in each formulated diet. This economic assessment provided insights into the cost-effectiveness and profitability of incorporating fairy shrimp meal into ornamental fish diets.
2.12. Statistical Analysis
Data for different treatments were tested for normality using a one-way analysis of variance (ANOVA) followed by Duncan’s post hoc test for multiple comparisons among the treatments. The significance level was set at p < 0.05. The handling of data that do not meet normal distribution or homogeneity of variance needs to be addressed.
4. Discussion
Incorporating fairy shrimp into the diet of flowerhorn cichlids did not result in significant differences in growth performance, survival rate, feed utilization, and proximate composition compared to the control group. All the experimental diets were formulated to contain a consistent protein level at approximately 40% while maintaining a stable energy content of 425.57–431.22 Kcal/100 g. As a result, all fish received comparable protein and energy intakes which play an important role in the growth and development of living organisms [
26], leading to no significant variations in growth performance or nutritional composition across treatments. These findings suggested that fairy shrimp meal effectively replaced fish meal in flowerhorn cichlid diets without compromising nutrient composition and energy balance. Incorporating fairy shrimp into pelleted diets did not affect the growth rate, survival rate, and chemical composition of flowerhorn cichlids but produced optimal color enhancement.
In the ornamental fish industry, carotenoids are commonly incorporated into farmed fish diets as a pigmentation source to enhance the desirable coloration of cultured ornamental species. Carotenoids represent a diverse group of pigments naturally synthesized by plants, algae, bacteria, fungi, and crustaceans [
27,
28]. Fairy shrimp are freshwater crustaceans and contain a high number of carotenoids, particularly astaxanthin, a red pigment that serves as an effective natural color enhancer for ornamental fish.
B. thailandensis contain a high total carotenoid content of up to 254.41 µg g
−1, with astaxanthin, canthaxanthin, and beta-carotene comprising the total carotenoids [
8]. These findings indicated that inclusion of fairy shrimp meal in the diet enhanced carotenoid deposition in fish tissue. The highest accumulation occurred in fish fed the FS30 diet, suggesting that fairy shrimp meal is an effective natural pigment source for improving coloration in flowerhorn cichlids. When flowerhorn cichlids consumed
B. thailandensis, the red coloration of their skin was visibly enhanced. The increase in fish skin color deposition may depend on the type of carotenoid. These findings concurred with previous studies on flowerhorn cichlids, reporting similar pigmentation enhancement effects [
16]. Similarly with the previous study, fairy shrimp supplementation improved skin coloration in goldfish (
Carassius auratus) without adversely affecting growth performance [
29]. The high carotenoid content in fairy shrimp also influenced carotenoid accumulation within the fish body. Our results indicated that pelleted diets containing fairy shrimp meal exhibited a higher carotenoid content than the control diets, leading to greater carotenoid accumulation in fish that consumed fairy shrimp-enriched feed. This result aligned with previous research reporting that flowerhorn cichlids fed with fairy shrimp-enriched diets exhibited significantly higher carotenoid concentrations [
16]. Similar findings have also been reported in giant freshwater prawns,
Macrobrachium rosenbergii, where fairy shrimp supplementation led to increased carotenoid accumulation [
12]. Carotenoids play an important role in modifying skin coloration and achieving optimal pigmentation [
30] when incorporated into the diet. Carotenoids influence various physiological processes including antioxidant activity and immune function and contribute to physiological well-being by boosting the antioxidant defense system and strengthening immunity [
31]. Carotenoids also play a protective role in mitigating stress-related conditions [
32], making them an essential dietary component for maintaining fish health.
Serum blood biochemical analysis is a crucial tool for evaluating the physiological functions and overall health status of aquatic animals, as it provides insights into various metabolic processes, organ function, stress levels, and potential disease states by examining different components within the blood, making it a valuable method for monitoring aquatic animal health in research and aquaculture settings [
33]. The ALT and AST are key indicators of liver function. These enzymes are found in liver cells which leak into the blood stream when the liver cells are damaged [
34]. ALT and AST exhibited significantly lower levels in the FS30 group compared to the control, suggesting a potential positive effect on liver health. The significant decrease in AST and ALT levels was attributed to the large number of carotenoids produced by fairy shrimp [
8]. Supplementing fish diet with carotenoids can reduce stress and lower AST and ALT activities [
35]. A BUN test is performed to see how well the kidneys are working; it measures the amount of urea nitrogen in your blood. If the kidneys are not able to remove urea from the blood normally, the BUN level rises. Blood urea nitrogen (BUN) indicates kidney health [
36]. This indicates that diets incorporating fairy shrimp had no toxic effects in the liver and kidney, as evidenced by the decrease in AST and ALT and the absence of significant changes in BUN.
Protein level is a commonly measured blood parameter in fish health. Blood proteins are involved in biological functions including maintaining osmotic pressure, pH regulation, transporting various metabolites, and playing an important role in fish humoral immunity. Levels of total proteins may hence provide insights into the nutritional, immune, or health status of fishes [
35]. Proteins also play a role in blood clotting and endogenous antibody production, and globulin, also used as a raw material for producing antibodies that destroy pathogens (antibodies), plays an important role in the body’s defense mechanism [
37]. In this study, total protein and globulin levels showed an increasing trend in fish fed fairy shrimp-incorporated diets, suggesting potential immune-enhancing effects. Although these differences were not statistically significant, the observed trends indicate that fairy shrimp incorporation may contribute to improved immune responses without adversely affecting other blood biochemical parameters. Similarly, blood cholesterol levels did not exhibit notable differences among the treatment groups, indicating that the incorporation of
B. thailandensis meal at varying levels had no impact on cholesterol metabolism in flowerhorn cichlids.
Blood parameters can be reliable indicators for fish health and immune health [
38]. Hematological parameters are impacted by dietary nutrition and environmental stressors and are often used to monitor fish health and physiological states. The complete blood cell count (CBC) can be used to monitor the health status of fish in response to changes related to nutrition in fish [
39]. Our findings suggested that dietary incorporation with fairy shrimp meal, particularly at higher inclusion levels (FS20 and FS30), positively influenced hematological parameters such as red blood cell (RBC) count, hemoglobin, and hematocrit levels, indicating enhanced oxygen transport capacity in flowerhorn cichlids. The hematological profiles revealed an increase in white blood cell (WBC) count, neutrophils, and lymphocytes in fish fed with fairy shrimp meal compared to the control group, suggesting improved immune response. This study is the first to report that incorporating fairy shrimp as a dietary ingredient positively affected the hematological profile of fish. The observed immunostimulatory effects were attributed to the high carotenoid content in fairy shrimp, which plays a crucial role in enhancing immune function in fish.
Our findings concurred with previous studies demonstrating that carotenoid-rich diets improve hematological parameters in various fish species, including common carp (
Cyprinus carpio) [
40], striped catfish (
Pangasianodon hypophthalmus) [
41], goldfish (
Carassius auratus) [
42], and Nile tilapia (
Oreochromis niloticus) [
43]. Similarly, [
44] reported that Asian seabass,
Lates calcarifer, displayed significant enhancements in hematological indices (RBC count, hemoglobin, hematocrit, and WBC count) when fed various diets with elevated doses of carotenoids throughout the feeding. Similar previous studies reported that dietary carotenoid supplementation enhanced WBC, neutrophil, and lymphocyte levels, leading to improvement in fish immune response. Consistent with our results, fish fed diets rich in carotenoids exhibited a significant increase in RBC counts, hemoglobin levels, and hematocrit values compared to a control diet. These findings indicated that the beneficial effects of carotenoids on hematological parameters were dose-dependent, contributing to the activation of non-specific immunity in flowerhorn cichlids.
Non-specific immune enzymes, such as lysozyme and myeloperoxidase (MPO), play crucial roles in the innate immune system of fish by providing defense against pathogens [
45]. Lysozymes are a group of molecules involved in host protection against bacterial invasion [
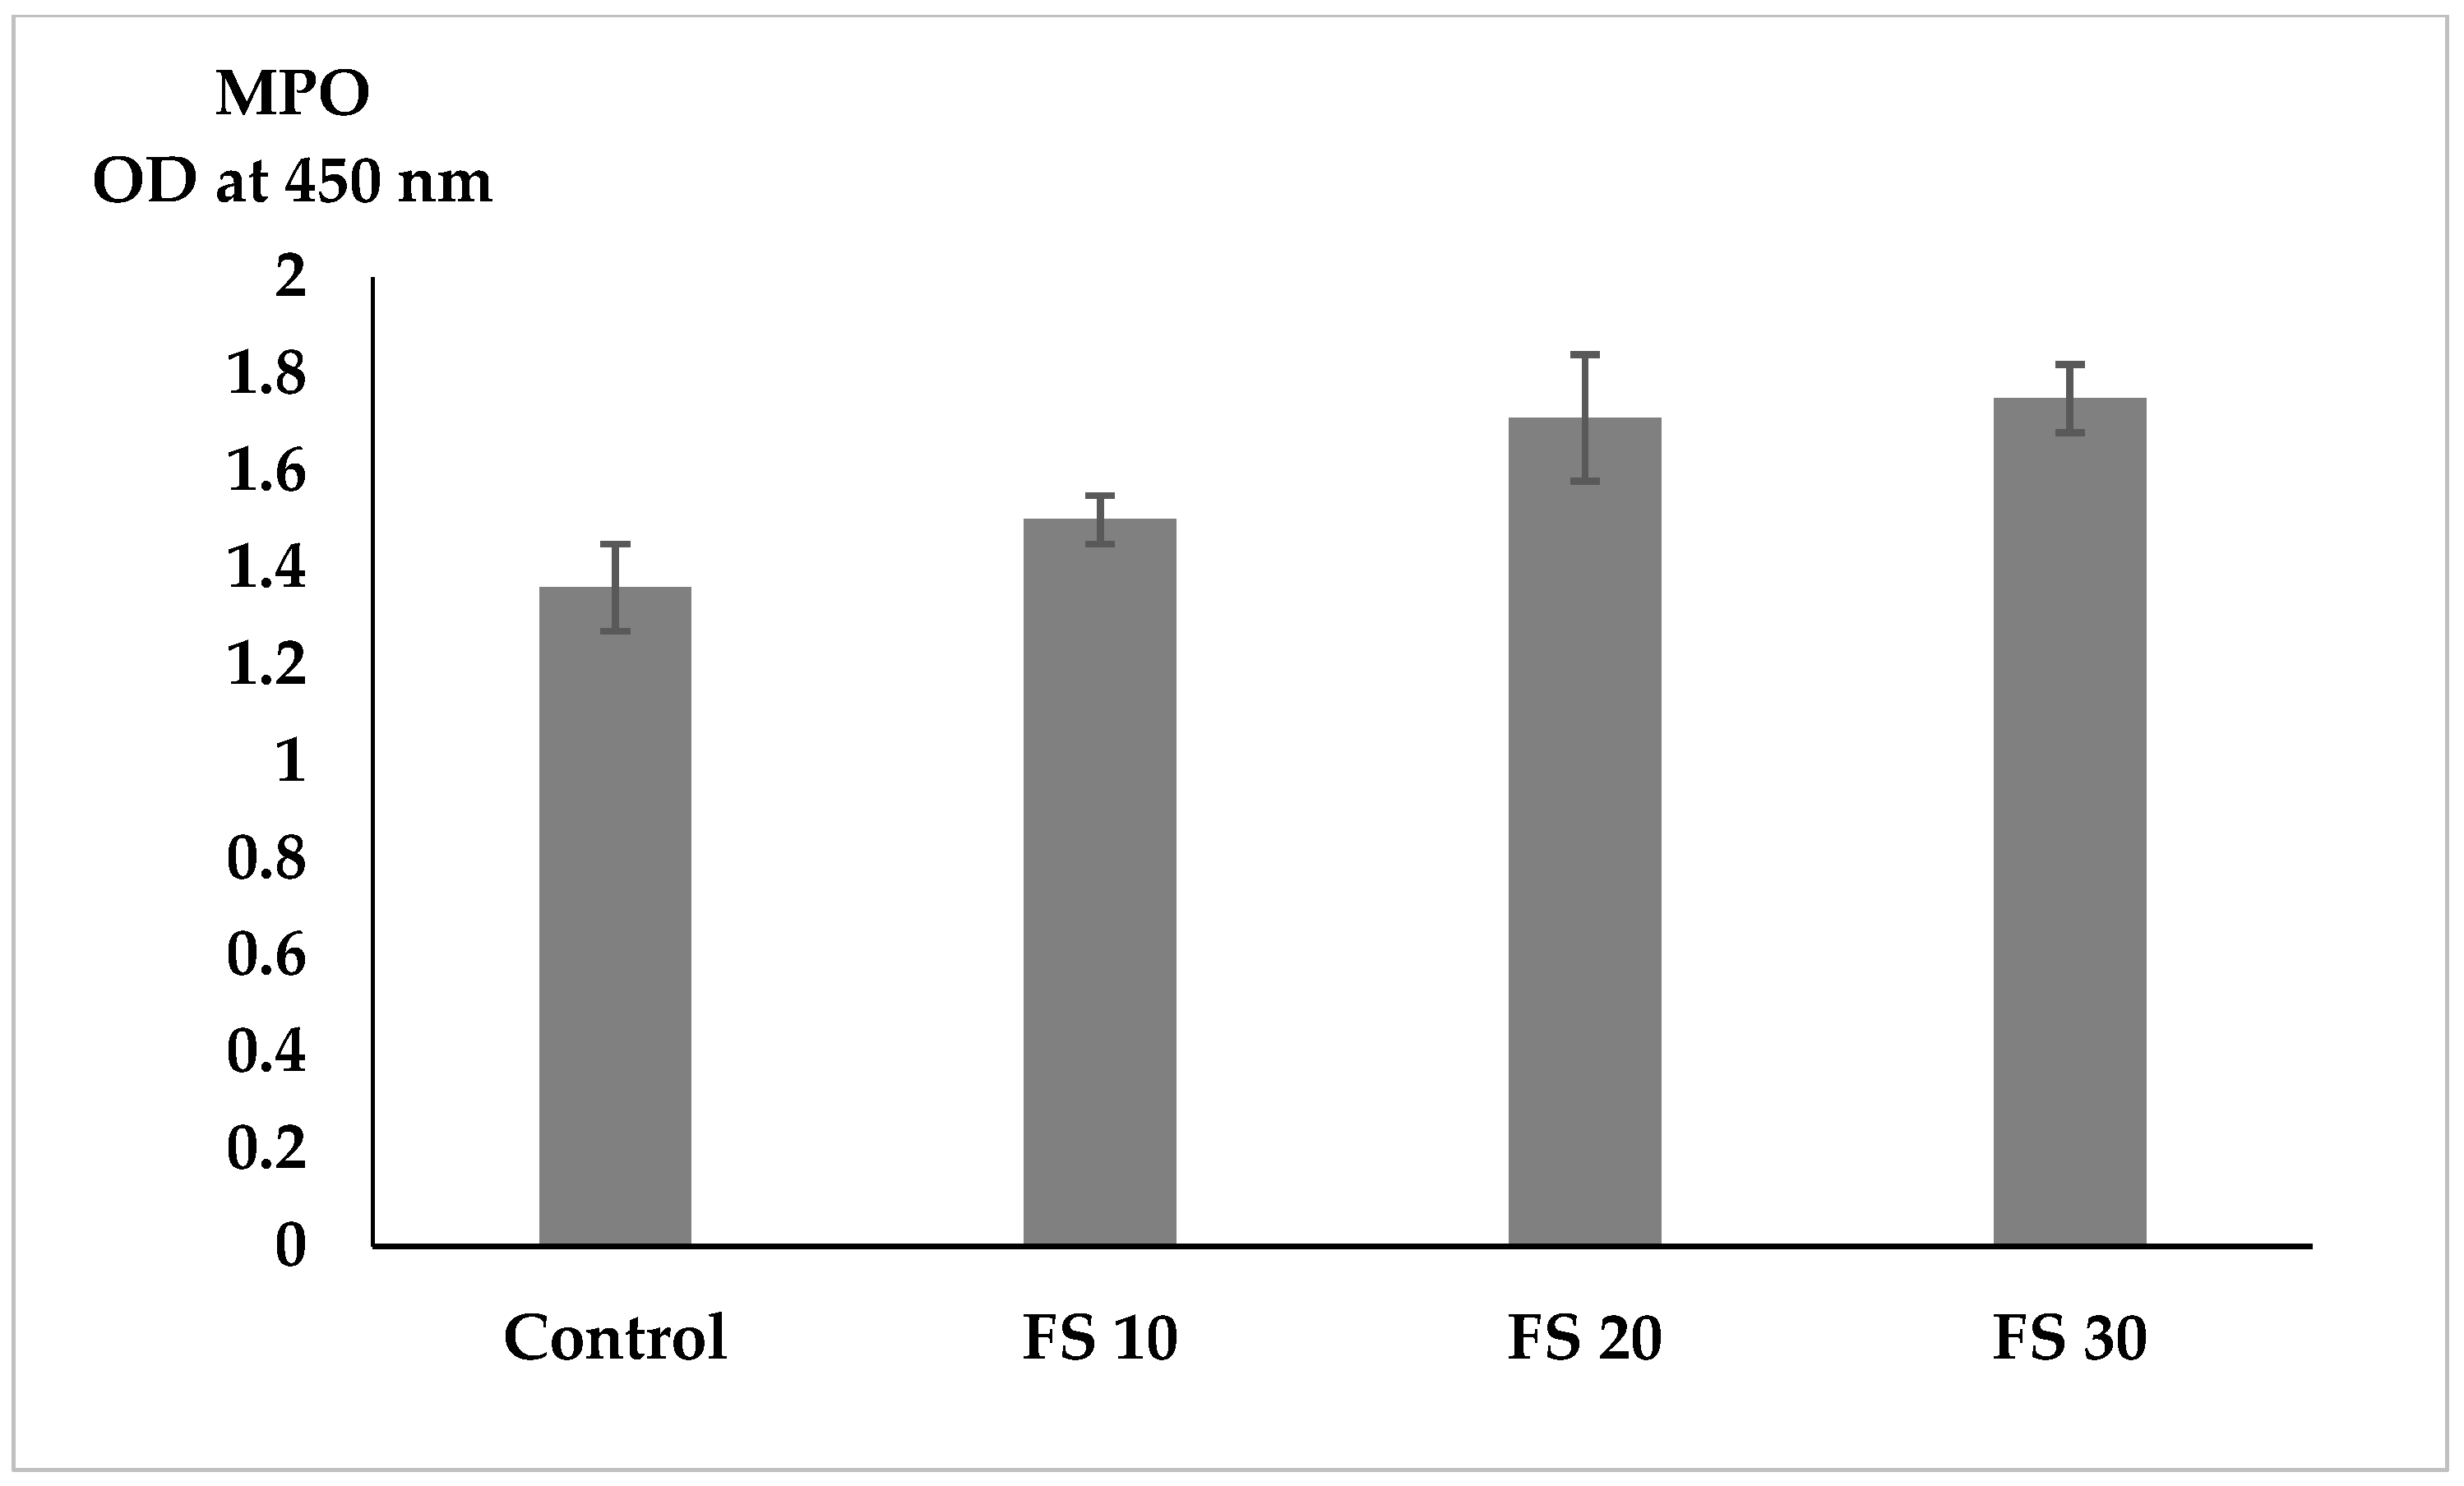
46]. Our results indicated that lysozyme activity significantly increased in fish fed fairy shrimp meal, suggesting that the inclusion of fairy shrimp meal enhances non-specific immune responses in flowerhorn cichlids. MPO activity increased levels of fairy shrimp meal, but the differences were not statistically significant.
MPO is a key enzyme involved in the oxidative burst mechanism, which contributes to the elimination of pathogens [
47]. The observed trend of increasing MPO activity in fish fed fairy shrimp meal suggested the improvement of the immune function, even though the statistical significance was not reached. The enhanced lysozyme and MPO activity in fish fed fairy shrimp meal may be attributed to its high carotenoid content, which has been reported to function as an immunostimulant in various fish species. Previous studies have demonstrated that dietary carotenoids can enhance the lysozyme level in
Labeo rohita fish [
48], dwarf chameleon fish (
Badis badis) [
49], and goldfish (
Carassius auratus) [
42]. On the other hand, MPO activity did not show any differences in this investigation. These findings supported the hypothesis that fairy shrimp meal supplementation positively affects the innate immune system by stimulating the activity of non-specific immune enzymes. The results suggested that incorporating fairy shrimp meal in the diet of flowerhorn cichlids improves their non-specific immune response, likely due to the immunostimulatory effects of carotenoids and other bioactive compounds present in fairy shrimp.
Superoxide dismutase (SOD) is an enzyme involved in the fish antioxidant defense system, which protects cells from damage by reactive oxygen species (ROS). SOD is a key component of a fish’s antioxidant defense system [
45]. It protects fish from stress-induced oxidative damage [
50,
51]. Hence, higher SOD activity indicates a stronger antioxidant defense capability. These findings indicated that higher inclusion levels of fairy shrimp meal in the diet enhance the antioxidant capacity of flowerhorn cichlids, likely due to the carotenoid content and other bioactive compounds present in fairy shrimp. This evaluated the activity of SOD as an indicator of the antioxidant response in flowerhorn cichlids fed different levels of fairy shrimp meal. The results demonstrated a significant increase in SOD activity in fish fed FS30 compared to the control group, while fish fed FS10 and FS20 exhibited a non-significant increase. The observed enhancement in SOD activity at higher dietary levels of fairy shrimp meal suggested an improved antioxidant defense system in flowerhorn cichlids, due to the high carotenoid content in fairy shrimp. The previous report demonstrated that the suitable level of carotenoids in the diet may increase SOD activity in Nile tilapia (
Oreochromis niloticus) [
52].
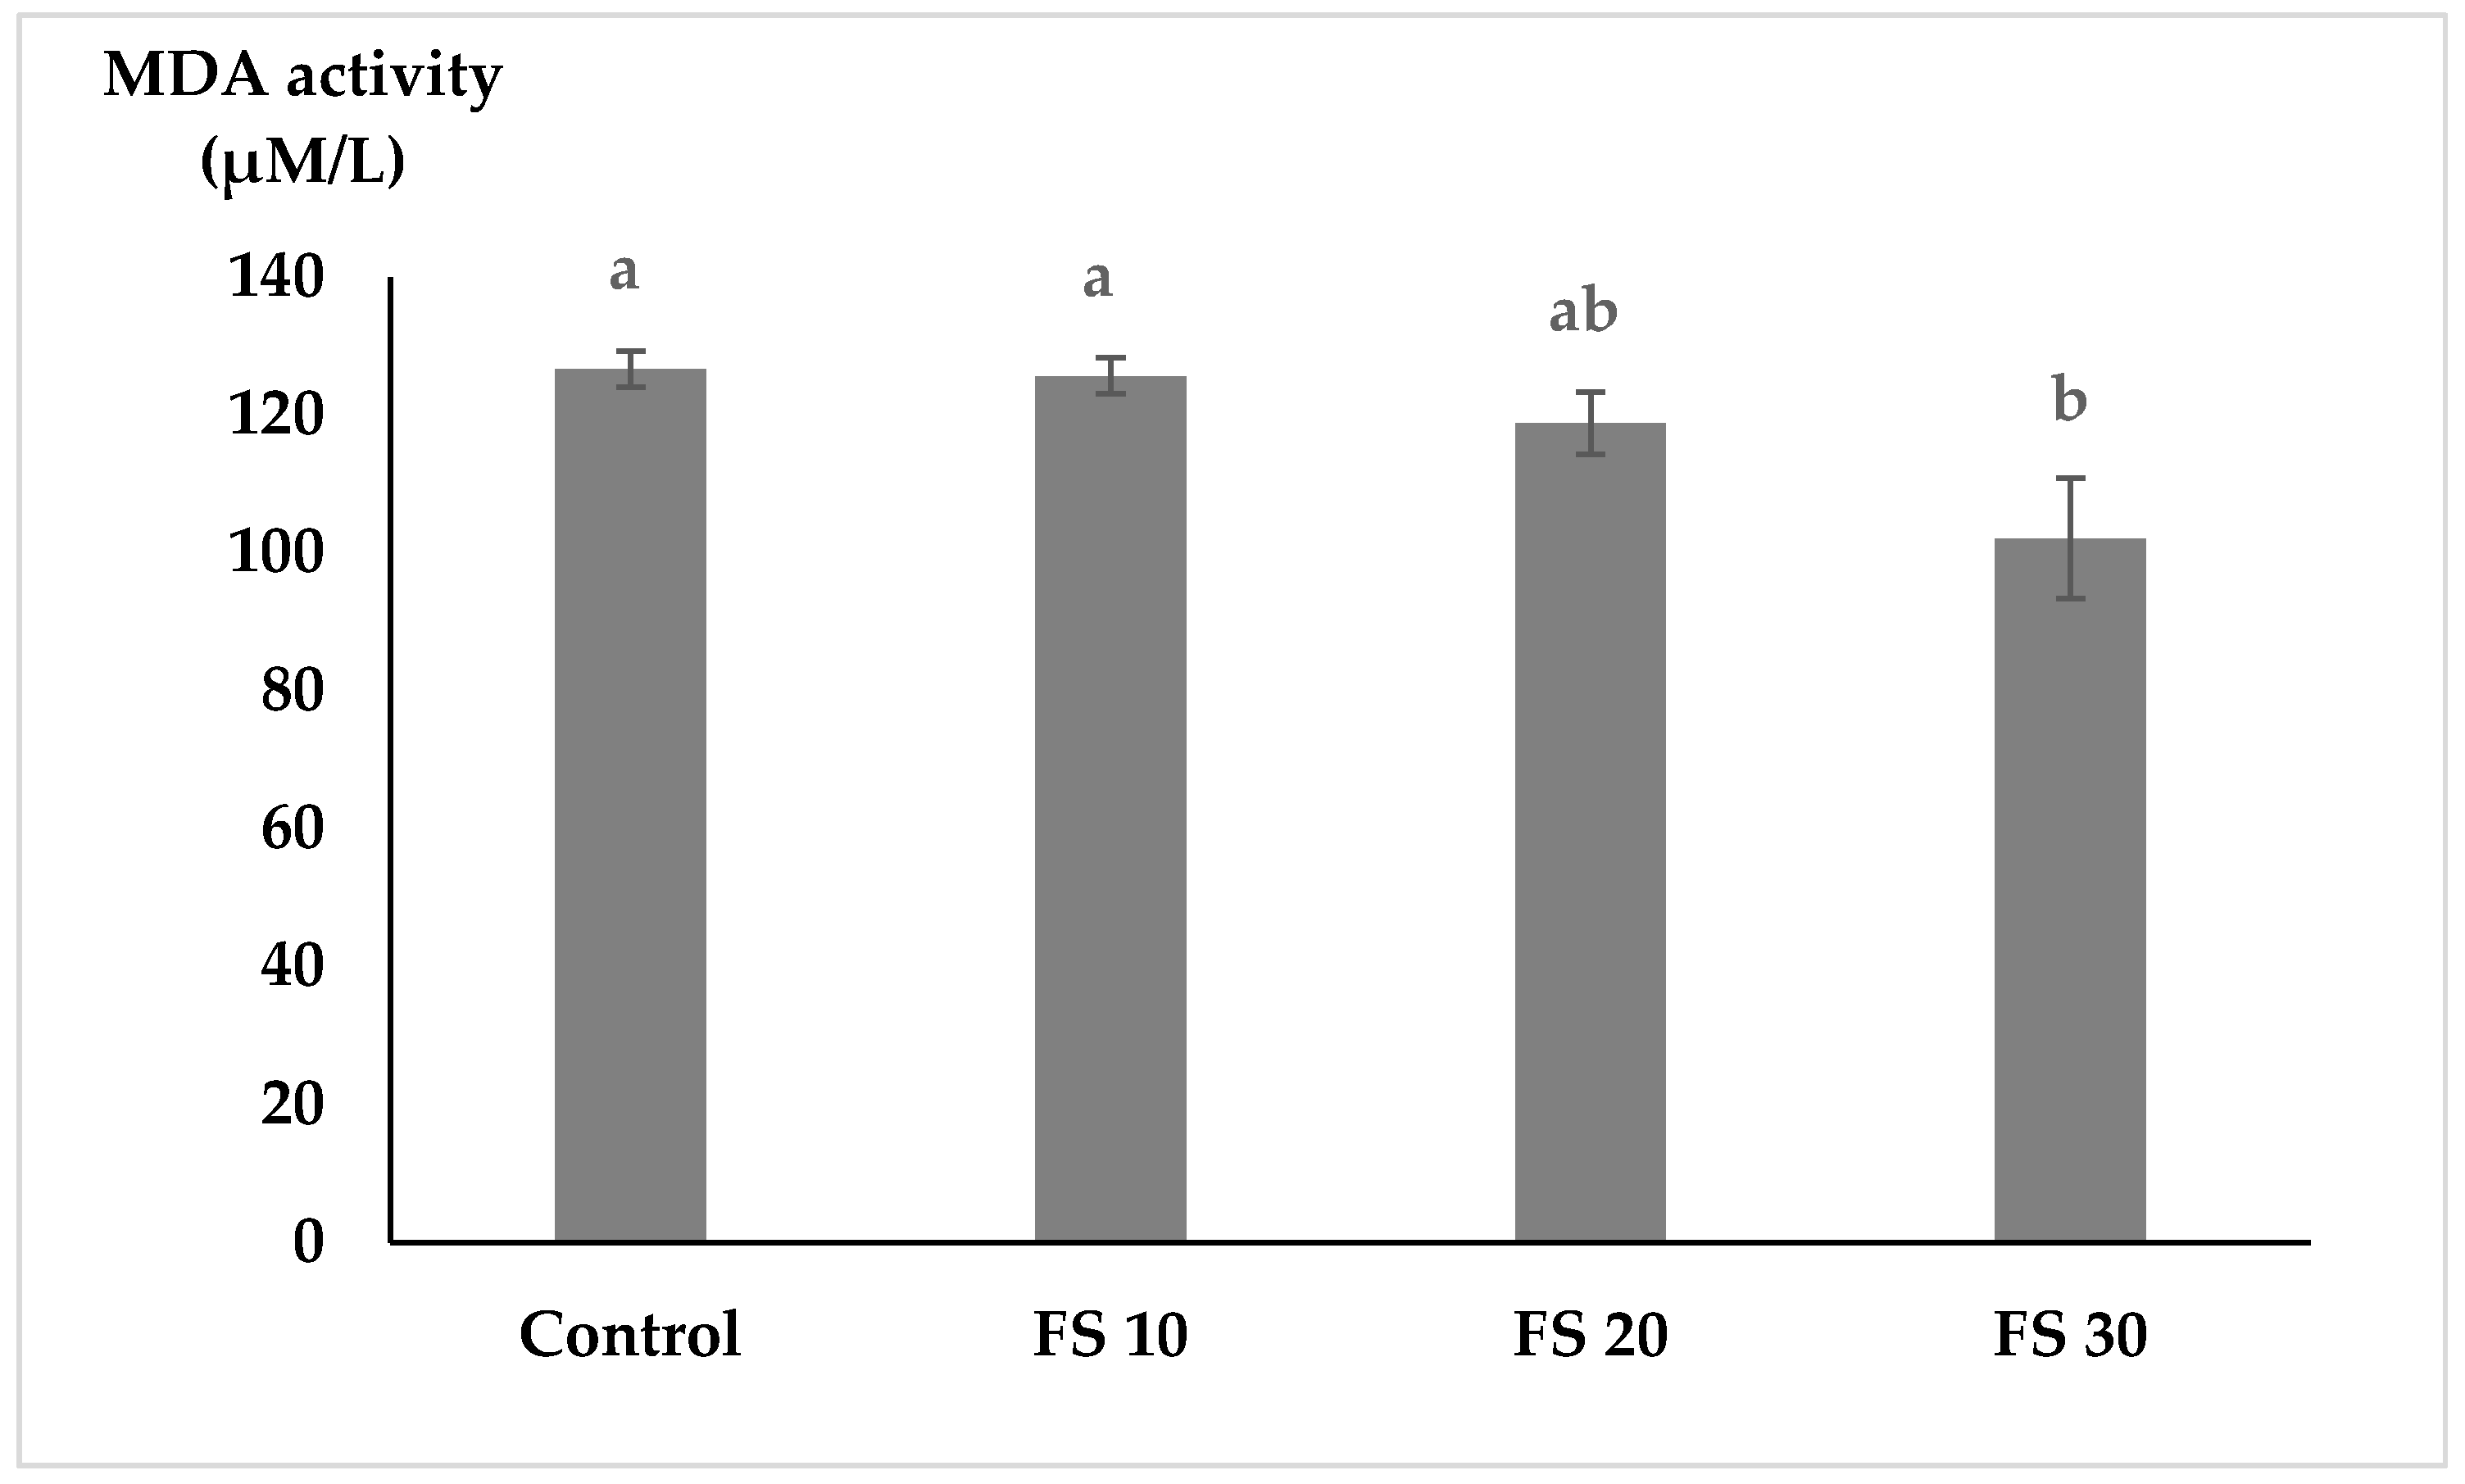
MDA levels, indicative of lipid peroxidation and oxidative stress, significantly reduced in fish fed FS30, with a decreasing trend observed in fish fed FS10 and FS20. Lipid peroxidation occurs in response to oxidative stress, giving rise to unsaturated aldehydes like malondialdehyde (MDA). MDA has been used to assess the effect of experimental stress induced in fish [
53,
54]. A lower MDA level reduces the oxidative damage to cellular membranes, further supporting the antioxidant potential of fairy shrimp meal. The results suggested that fairy shrimp meal supplementation enhanced the antioxidant defense system in flowerhorn cichlids, likely due to its high carotenoid content and bioactive compounds. The increased SOD activity and reduced MDA levels indicated that fairy shrimp meal effectively mitigated oxidative stress, contributing to improved fish health and physiological performance.
The inclusion of fairy shrimp in the diet of flowerhorn cichlids enhanced coloration, increased carotenoid pigment accumulation, stimulated antioxidant activity, and boosted the immune function. However, its widespread adoption as a pigmentation enhancer and immune-boosting feed additive requires economic feasibility considerations. The cost of using fairy shrimp as a replacement for fishmeal must be evaluated to determine its market affordability. The production costs of experimental diets containing 10–30% fairy shrimp were compared with the control diet. The results showed that the diet with the highest fairy shrimp inclusion (30%) had the highest production cost, reaching 24.08 EUR/kg. Currently, commercially available flowerhorn cichlid feed is priced at 30.86 EUR/kg (from a survey of market price). Therefore, using fairy shrimp as both a protein source and a natural pigmentation enhancer in ornamental fish feed is economically viable. A formulation containing 30% fairy shrimp, which yielded the most significant pigmentation enhancement and immune-stimulating effects, can be commercially produced at a cost-effective price while ensuring the profitability for manufacturers. Thus, incorporating fairy shrimp into pelleted diets for flowerhorn cichlids is a highly suitable approach that should be considered by feed producers and aquaculture enterprises. However, further research is recommended to comprehensively evaluate the formulated feed in comparison to commercial diets, particularly in terms of growth performance, pigmentation efficacy, and overall cost-effectiveness, to determine its practical applicability and economic viability.


 and
and 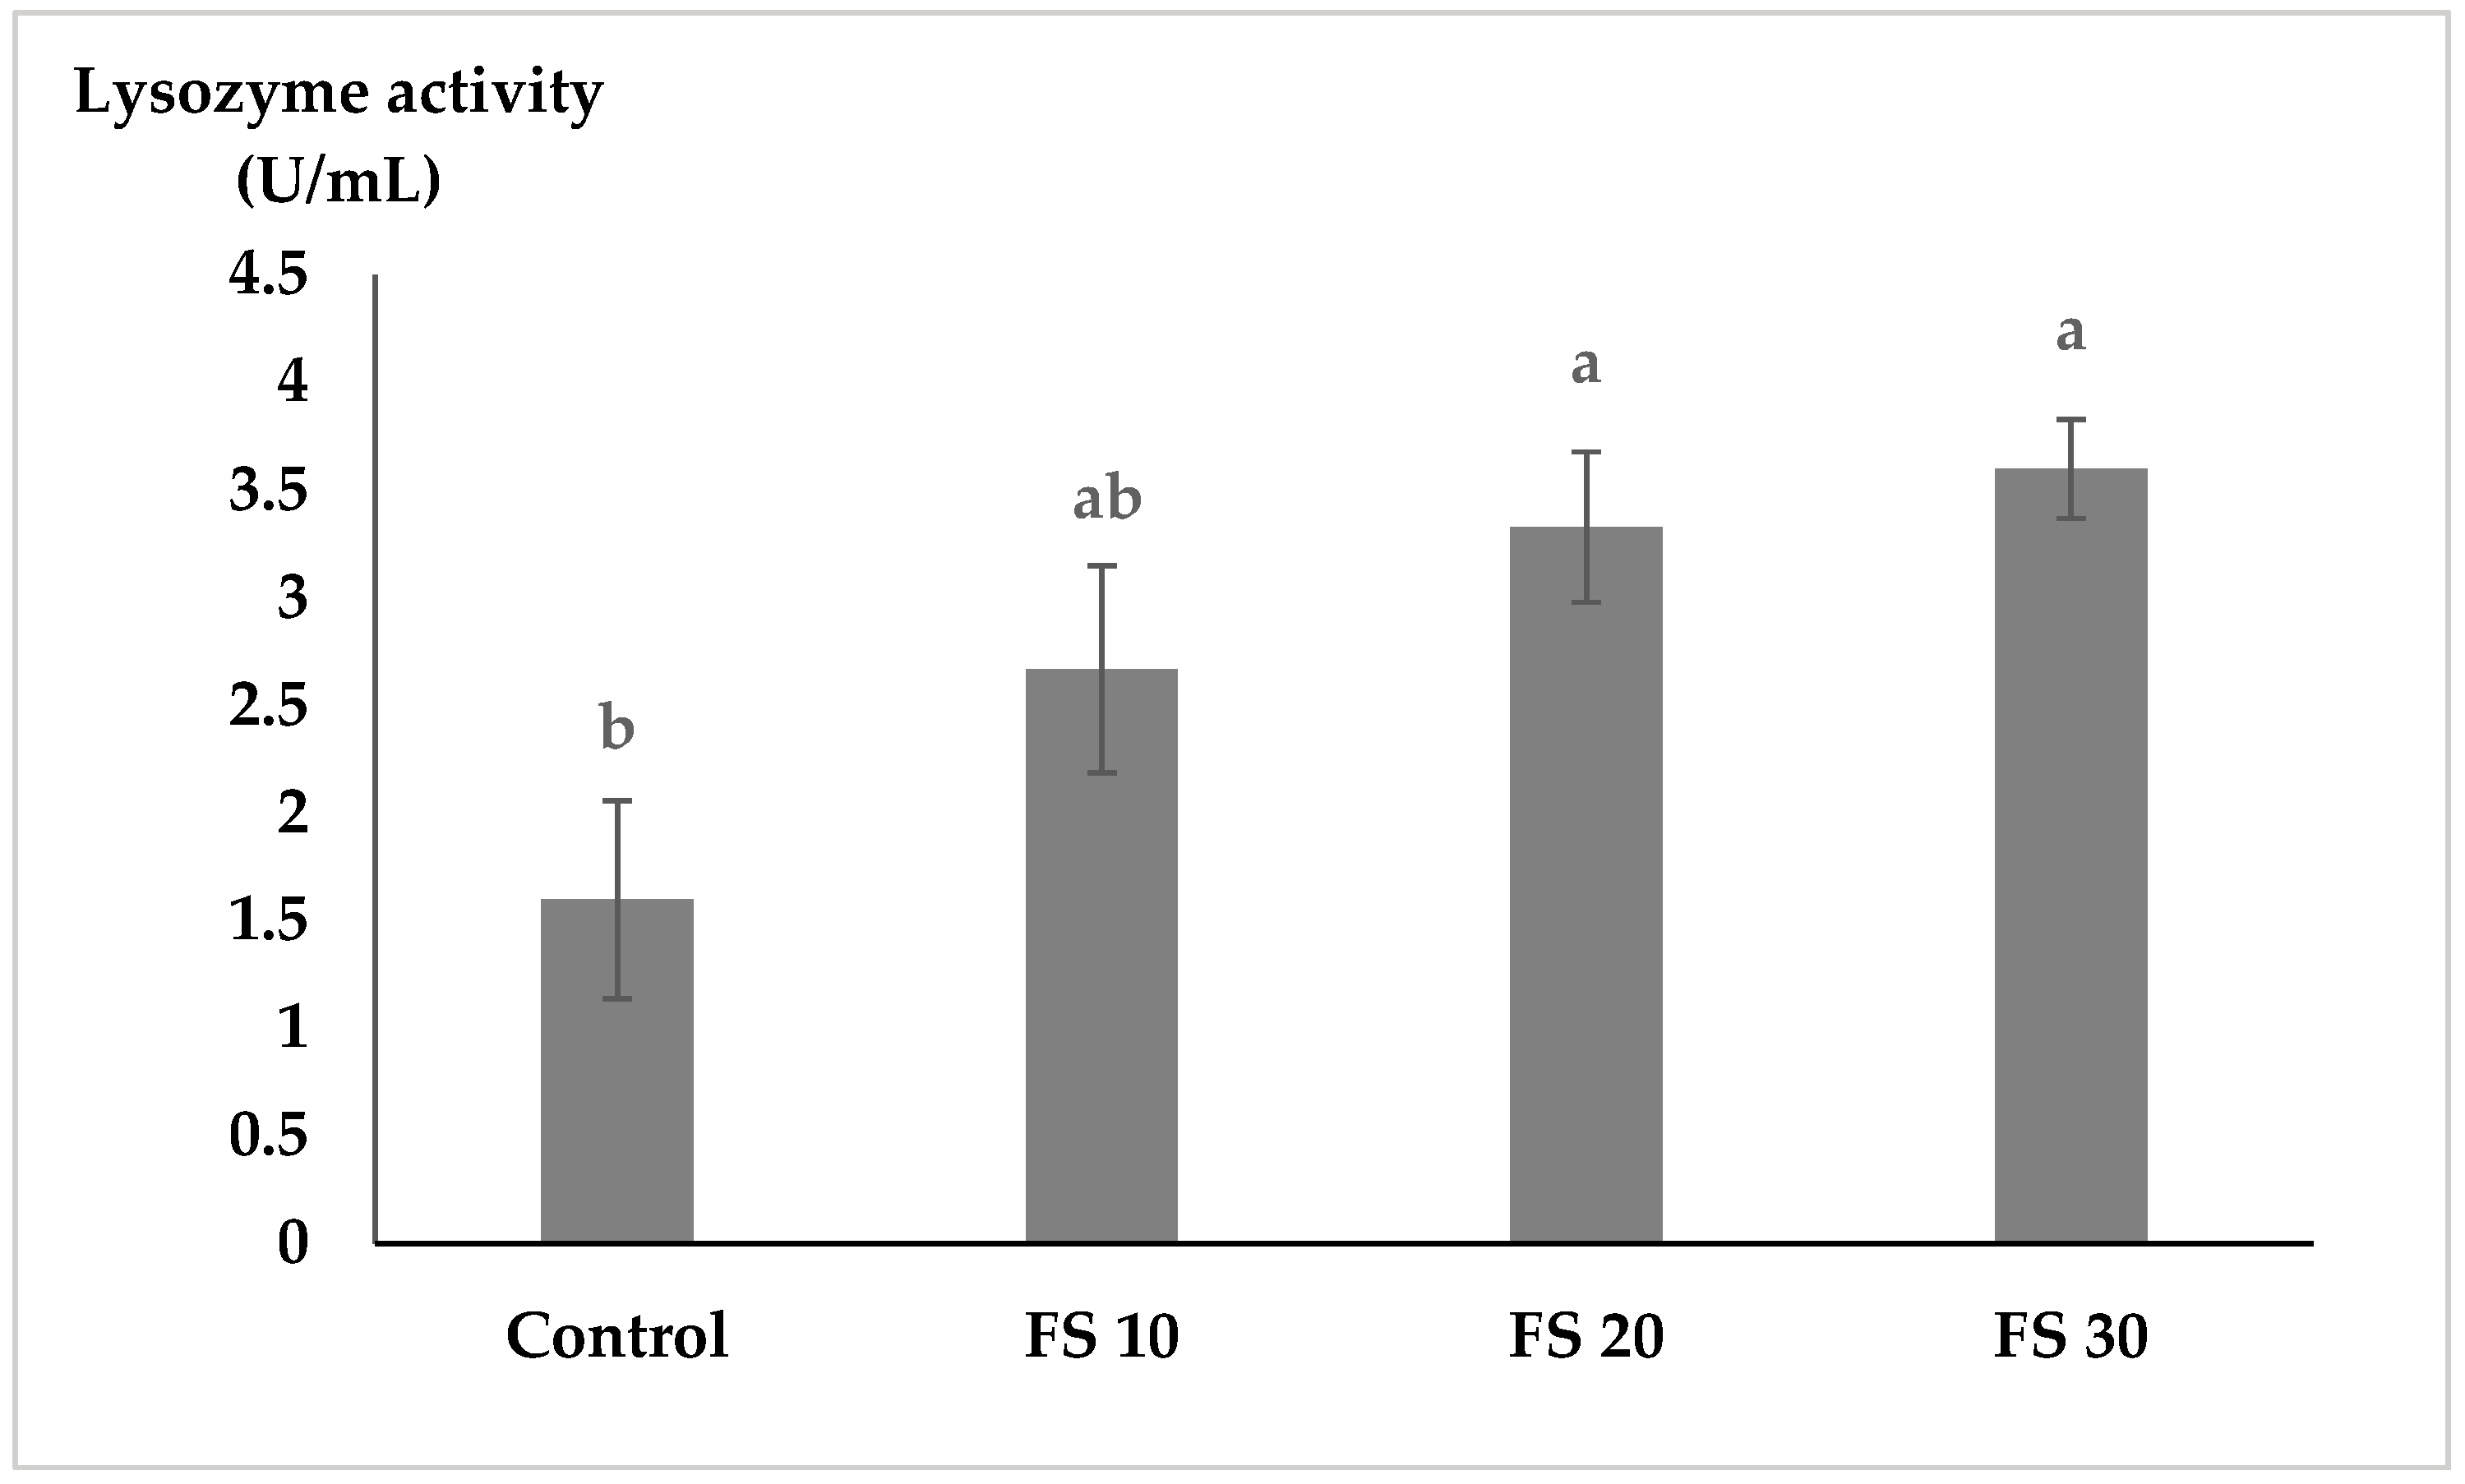

