Article

Size-Selective Harvesting Effects on Reproductive Investment in Marine Medaka (Oryzias melastigma)

Deep Sea and Polar Fisheries Research Center and Key Laboratory of Mariculture, Ministry of Education, Ocean University of China, Qingdao 266003, China
*
Author to whom correspondence should be addressed.
Fishes 2025, 10(3), 112; https://doi.org/10.3390/fishes10030112
Submission received: 27 January 2025 / Revised: 27 February 2025 / Accepted: 1 March 2025 / Published: 4 March 2025
(This article belongs to the Section Biology and Ecology)

Abstract

Long-term selective fishing pressure often leads to miniaturization, smaller size, and early sexual maturity in many commercial fish species. To adapt, these species increase energy allocations toward maturation and reproduction, which can reduce population productivity and recruitment. However, how different fishing pressures affect reproductive investment and energy allocation between growth and reproduction remains unclear. In this study, we designed three size-selective harvesting strategies—large, random, and small harvests—to examine their effects on the growth and reproductive investment of marine medaka (Oryzias melastigma). We analyzed changes in length, weight, and gonad weight across different harvest times. Results showed that the “large harvest” group allocated more energy to reproduction, leading to miniaturization and earlier maturation, while the “small harvest” group focused more on growth, resulting in larger fish at the same age. This study provides experimental evidence on how size-selective harvesting alters reproductive investment in fish populations, offering valuable insights for the sustainable exploitation of fishery resources.
Key Contribution: This study provides experimental evidence on how size-selective harvesting strategies impact reproductive investment and energy allocation in marine medaka, offering valuable insights for sustainable fishery resource management.

1. Introduction

Life history theory explains the trade-offs in energy allocation between growth, reproduction, and survival [1]. Studies on energy transfer in fish explore the relationship between energy allocation and environmental factors, helping to understand how energy is distributed within populations and how these changes under varying conditions [2,3]. Reproductive investment, which includes the energy, time, and resources allocated to gonad maturation, gamete production, and reproduction, plays a crucial role in species survival and evolution [4]. Energy allocation in fish varies across different life history stages, influencing growth, development, and reproduction [5,6,7]. Fish prioritize energy for somatic growth and development before reaching sexual maturity, after which energy is increasingly allocated to reproductive processes, such as gonadal development, gamete production, and behaviors associated with spawning [8]. However, this energy allocation strategy is not fixed and is influenced by external factors that affect both individual phenotypes and population dynamics. Temperature, a key environmental factor, accelerates metabolic rates, resulting in earlier sexual maturity and smaller body sizes. This phenomenon has been observed in populations of Eurasian perch (Perca fluviatilis) and striped bass (Morone saxatilis), where warmer conditions enhance reproductive investment at the expense of growth potential [9,10]. Moreover, temperature influences gamete quality and spawning timing, altering the reproductive success of populations [11]. Oxygen availability is an important factor that affects energy allocation. Hypoxic zones, caused by eutrophication or reduced mixing in stratified waters, create low-oxygen conditions. These conditions cause physiological stress, forcing fish to use more energy for basic metabolism [12,13]. As a result, less energy is available for growth and reproduction. Salinity fluctuations and ocean acidification further shape energy allocation, with species in variable-salinity environments expending more energy on osmoregulation, and acidified conditions affect sensory and behavioral functions, disrupting energy strategies [14,15,16]. Energy allocation models are used to predict optimal life history strategies, considering reproductive costs relative to body size, condition, and fishing mortality. These models improve predictions about how environmental changes and human impacts, such as fishing, affect key life history traits like maturation age, size, and fecundity. For example, energy allocation modeling in Atlantic cod (Gadus morhua) shows how environmental changes influence maturation and reproduction [17], and similar models in Atlantic bluefin tuna (Thunnus thynnus) guide targeted conservation efforts by stimulating growth, maturation, and reproductive strategies [18]. Studies in wild lake trout (Salvelinus namaycush) show that slower somatic growth in females is linked to gonadal weight at spawning, with more energy directed towards reproduction during sexual maturation [19]. Biphasic growth models have been used to compare reproductive investment in cutlassfish (Trichiurus japonicus), revealing differences in intraspecific life history strategies [20], while new growth functions analyze trade-offs between somatic growth and reproduction [21]. As a species with a long reproductive life, this will undoubtedly lead to changes in its lifespan, which will, in turn, affect population dynamics [22]. Environmental factors and fishing pressure are shown to significantly affect fish life history traits, demonstrating the importance of considering these factors in models for commercial fishing management [23,24,25,26].
Fishing can impact the community structure of species [27] and alter the life history traits of fish under long-term fishing pressure [28]. Numerous studies have shown that harvesting strategies can lead to changes in body size and weight, and even induce evolutionary changes in fish populations [29,30,31,32]. In commercial fisheries, size-selective harvesting is common, as the value of fish is often linked to their size, leading to the preference for harvesting larger fish to maximize economic returns [33]. Over time, this strategy causes the target fish population to become smaller and younger, potentially leading to severe stock depletion, lower earnings for fishermen, and population collapse. Size-selective harvesting drives phenotypic evolution by influencing life history processes [34]. For example, in Atlantic cod, increased fishing pressure resulted in a larger number of smaller, earlier-maturing individuals, with the age at maturity decreasing as fishing pressure from trawling increased [35]. At the same time, reduced hatching rates and smaller size at maturity have indirectly contributed to a decrease in Atlantic cod life expectancy, from 6 to 4 years, and a 25% to 30% reduction in annual population growth [36]. While size-selective harvesting influences maturation, reproductive investment, and growth, energy allocation between reproduction and growth is crucial. Age at maturity and body size are directly related to these trade-offs [37]. Fast-growing, short-lived fish often allocate more energy to reproduction, enhancing fecundity to maintain populations, which aligns with the r-selection strategy—producing many offspring at the expense of individual growth and size [38,39]. In contrast, fish that experience less fishing pressure or those subjected to harvesting pressures favoring growth tend to allocate more energy toward somatic growth and fewer offspring, reflecting the K-selection strategy, which involves investing in fewer offspring with greater energy directed toward growth and survival [40]. Overfishing can push populations into an r-strategy-like approach, resulting in earlier maturation and higher reproductive output, which may support short-term reproduction but harm long-term population stability and recovery.
Selective fishing pressures can rapidly induce evolutionary changes in fish populations, particularly in traits such as size, growth rates, and genetic characteristics. For example, in the Atlantic silverside (Menidia menidia), a heavily fished population initially produced high catches. However, due to its short lifespan, the effects of fishing quickly resulted in slower growth rates and smaller body sizes in subsequent generations [41,42,43]. Conversely, populations subjected to smaller harvests showed faster growth and larger body sizes. This illustrates how size-selective harvesting can drive evolutionary changes. Similarly, in zebrafish (Danio rerio), five generations of size-selective harvesting resulted in earlier sexual maturity, smaller body sizes, and increased reproductive investment, with genetic alterations observed at specific functional loci [34,44]. In guppies (Poecilia reticulata), three generations of size-selective harvesting also led to significant genetic changes in body size-related loci, providing further evidence of fisheries-induced evolution (FIE) [45]. Despite these changes in phenotypic traits, neutral microsatellite markers showed no variation, indicating that selective fishing induces genetic evolution at specific loci, not broad genetic drift. These findings underscore the complex interplay between phenotypic plasticity and genetic adaptation in response to fishing pressures [31]. However, previous studies have focused on phenotypic traits or genetic changes, and there has been limited exploration of how selective fishing affects reproductive investment. This gap highlights the need for further research on how reproductive strategies shift under selective fishing pressures, which is critical for improving our understanding of fishery dynamics and enhancing management strategies.
In this study, we used marine medaka (Oryzias melastigma) to examine how different size-selective harvesting strategies, including large harvest, random harvest, and small harvest, affect reproductive investment (Figure 1). Marine medaka is a small fish species with an adult body length of approximately 2 to 4 cm and a short lifespan of 2 to 4 years [46]. They reach sexual maturity within two to three months. Under a controlled photoperiod, they spawn daily, with the eggs being large and transparent [47], making them ideal for observing fecundity in laboratory experiments. We analyzed changes in body size and gonad weight at various ages and assessed how these factors reflect energy allocation between growth and reproduction. The main objectives were to (1) determine whether size-selective harvesting leads to differences in reproductive investment and (2) explore its effects on energy allocation for growth and reproduction. Our findings provide experimental evidence on how size-selective harvesting influences reproductive investment in fish populations, offering valuable insights for sustainable fishery management and resource development.

2. Materials and Methods

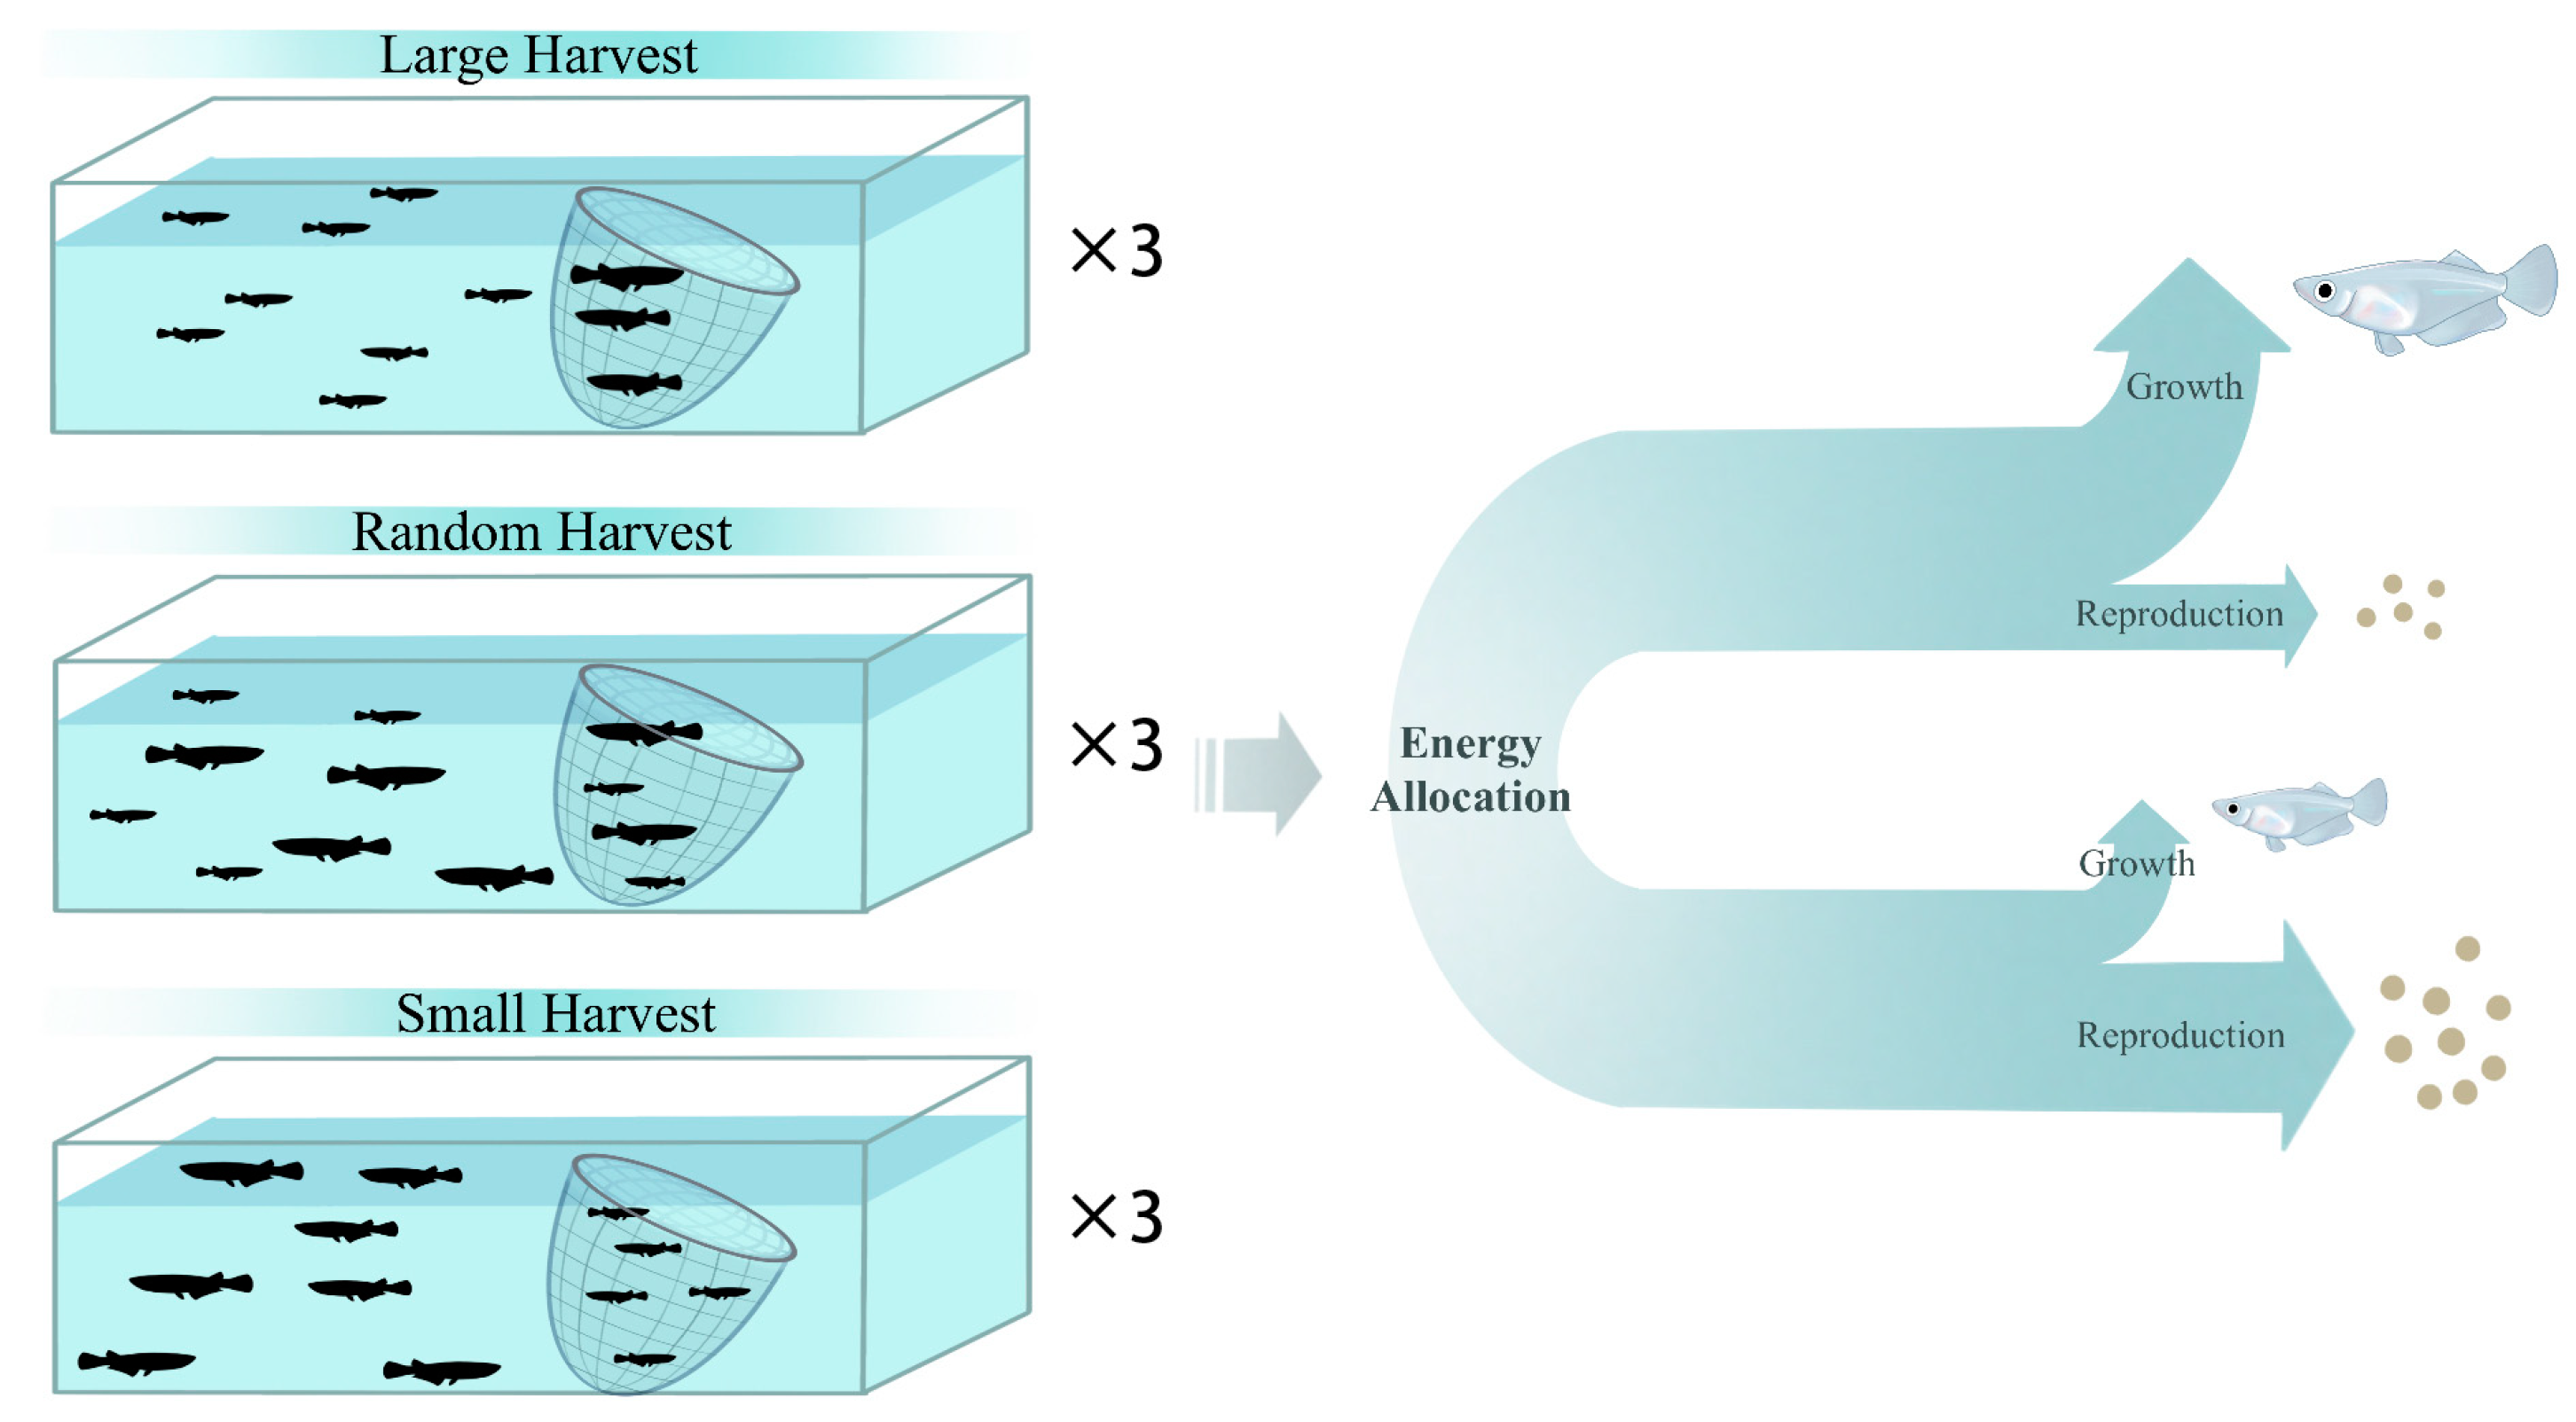
2.1. Experimental Design

We selected marine medaka as our experimental species. Originally provided by the State Key Laboratory of Marine Environmental Sciences at Xiamen University, marine medaka has been maintained at Ocean University of China since 2016. Prior to the main experiment, we conducted two generations of breeding as a preliminary study to gather data and refine the experimental design. Sex differentiation in marine medaka is distinguishable based on the size of the anal fins, with females having shorter, more regular fins [48]. Sex differentiation can be reliably determined at 55 days post hatching, with the first spawning occurring around 70 days. In this study, we assumed that the onset of sexual maturity coincides with the ability to differentiate sexes and selected 40 days post hatching as the time point for harvesting. This corresponds to a period before the population reaches maturity. Size selection followed previous studies [41,49,50] and included three treatment groups: the largest 50% harvest (LH), a random 50% harvest (RH), and the smallest 50% harvest (SH). The remaining 50% of individuals in each group were used for reproduction and maintained for seven generations, with three replicates per group.
In our study, both juvenile and adult fish were maintained in a recirculating aquaculture system with a constant temperature of 26–28 °C and salinity of 30 ppt. The fish followed a 14:10 light–dark photoperiod and were fed twice daily with nauplii of brine shrimp (Artemia sinica). Eggs and larvae were placed in Petri dishes and incubated at 30 °C under 5000 lx illumination, also following a 14:10 light–dark photoperiod. They were initially fed cooked egg yolk powder. Once the larvae reached their first feeding stage, they were transferred to the aquaculture system.

2.2. Data Measurement

2.2.1. Body Size Measurement

The body length and body weight of marine medaka were measured at 30, 40, 45, 50, 55, 60, and 70 days of age. At each time point, 10 medaka were randomly selected from each of the nine groups, totaling 70 medaka per group. The body length of each fish was recorded by photographing it, followed by measuring its total length using a standard-calibrated fish measuring system to ensure accuracy. Weight was determined using an analytical balance with a precision of 0.0001 g. Each fish was weighed separately, removed from the recirculating aquaculture system, and placed into a designated box for weighing and photographing. No anesthetics were used during this process to minimize stress and damage to the fish. These measurements allowed us to track the growth of marine medaka over time, comparing differences in both body size and growth rate under the different harvesting strategies.

2.2.2. Gonadal Weight

The euthanasia procedure was carried out after measuring body length and weight. At 40 days of age, 10 marine medaka from each group were randomly selected and euthanized using an overdose of tricaine methanesulfonate (MS-222) at a concentration of 300 mg/L, in accordance with ethical guidelines for the humane treatment of animals. The fish were then dissected to examine their gonads. The gonads were classified as either mature (“M”) or immature (“I”). Gonad weight was measured using an analytical balance with a precision of 0.0001 g (1/10,000). The same procedure was repeated at 45, 50, 55, 60, and 70 days of age, with 10 fish from each group being dissected at each time point. Gonad weight and developmental stage were recorded, allowing for a comparison of gonad weight changes across different harvesting strategies.
Before pooling the treatment groups (large harvest, LH; random harvest, RH; small harvest, SH), we tested whether the replicates within each treatment were similar and whether there was any significant effect of tank on the results. A statistical comparison was performed to assess the presence of a tank effect. The results of this analysis, which showed no significant tank effect, are provided in the supplementary file (Table S1). Based on these results, the data from each treatment group were pooled for subsequent analysis.

2.3. Calculation of Reproductive Investment

Growth models are usually expressed in a single differential form, and since the individual body weight (v) of a fish consists of the somatic weight (w) and the gonadal weight (g), the differential equation modeling the body weight (vt) of a marine medaka of day age (t) is
d v t = d w t + d g t
d w t = a w t α d t d g t
d g t = b w t β d t
where Equation (1) reflects the relationship between individual body weight and gonad weight in marine medaka. Equations (2) and (3) determine the energy allocation mechanism. In Equation (2), a w t α d t represents the rate of energy allocated to growth, where a is the mass-independent rate of energy allocation, and α is a coefficient that modulates the somatic growth rate. The second term, d g t , reflects the energy expenditure on gonadal growth.
In Equation (3), b w t β d t represents the amount of energy allocated to reproduction after sexual maturity, where b and β are coefficients that govern gonadal growth. b indicates the energy allocation rate to reproduction, while β adjusts the trajectory of gonadal growth, influencing the reproductive output. The parameters a, α, b, and β together determine the trajectory of body growth, which was estimated from experimentally measured data [20].
The relative energy allocated to gonadal growth can be defined by the ratio of Equation (3) to Equation (1) as follows:
r t = d g t d v t = b a w t β α { t τ }
where 0 ≤ rt < 1, indicating instantaneous relative reproductive investment, calculated using sexual maturity data. “t” represents the age at sexual maturity.
Also, integrating Equation (4) yields the formula for cumulative reproductive investment:
R t = τ t r s d s
where the quantity Rt ≥ 0 represents the energy allocated to reproduction up to age t.
The values for both instantaneous and cumulative reproductive investment were calculated based on a model expansion. The four parameters a, α, b, and β required for the model were estimated from measured data. The parameter estimation used a two-stage least-squares method (gradient matching). In the first stage, data smoothing was performed using loess locally weighted regression [51]. In the second stage, the squared error of the gradient (derivative) of the growth model was minimized. To quantify the uncertainty in the parameter estimates, 95% bootstrap confidence intervals were constructed using a bootstrap bias correction method, with 200 simulation iterations. The median of the bootstrapped values within the interquartile range was taken as the estimated values for the four parameters a, α, b and β. Instantaneous and cumulative reproductive investment were estimated at different time points using these parameter estimates, which allowed for the analysis of reproductive investment differences under various harvesting strategies. All analyses were performed in R 4.3.3.

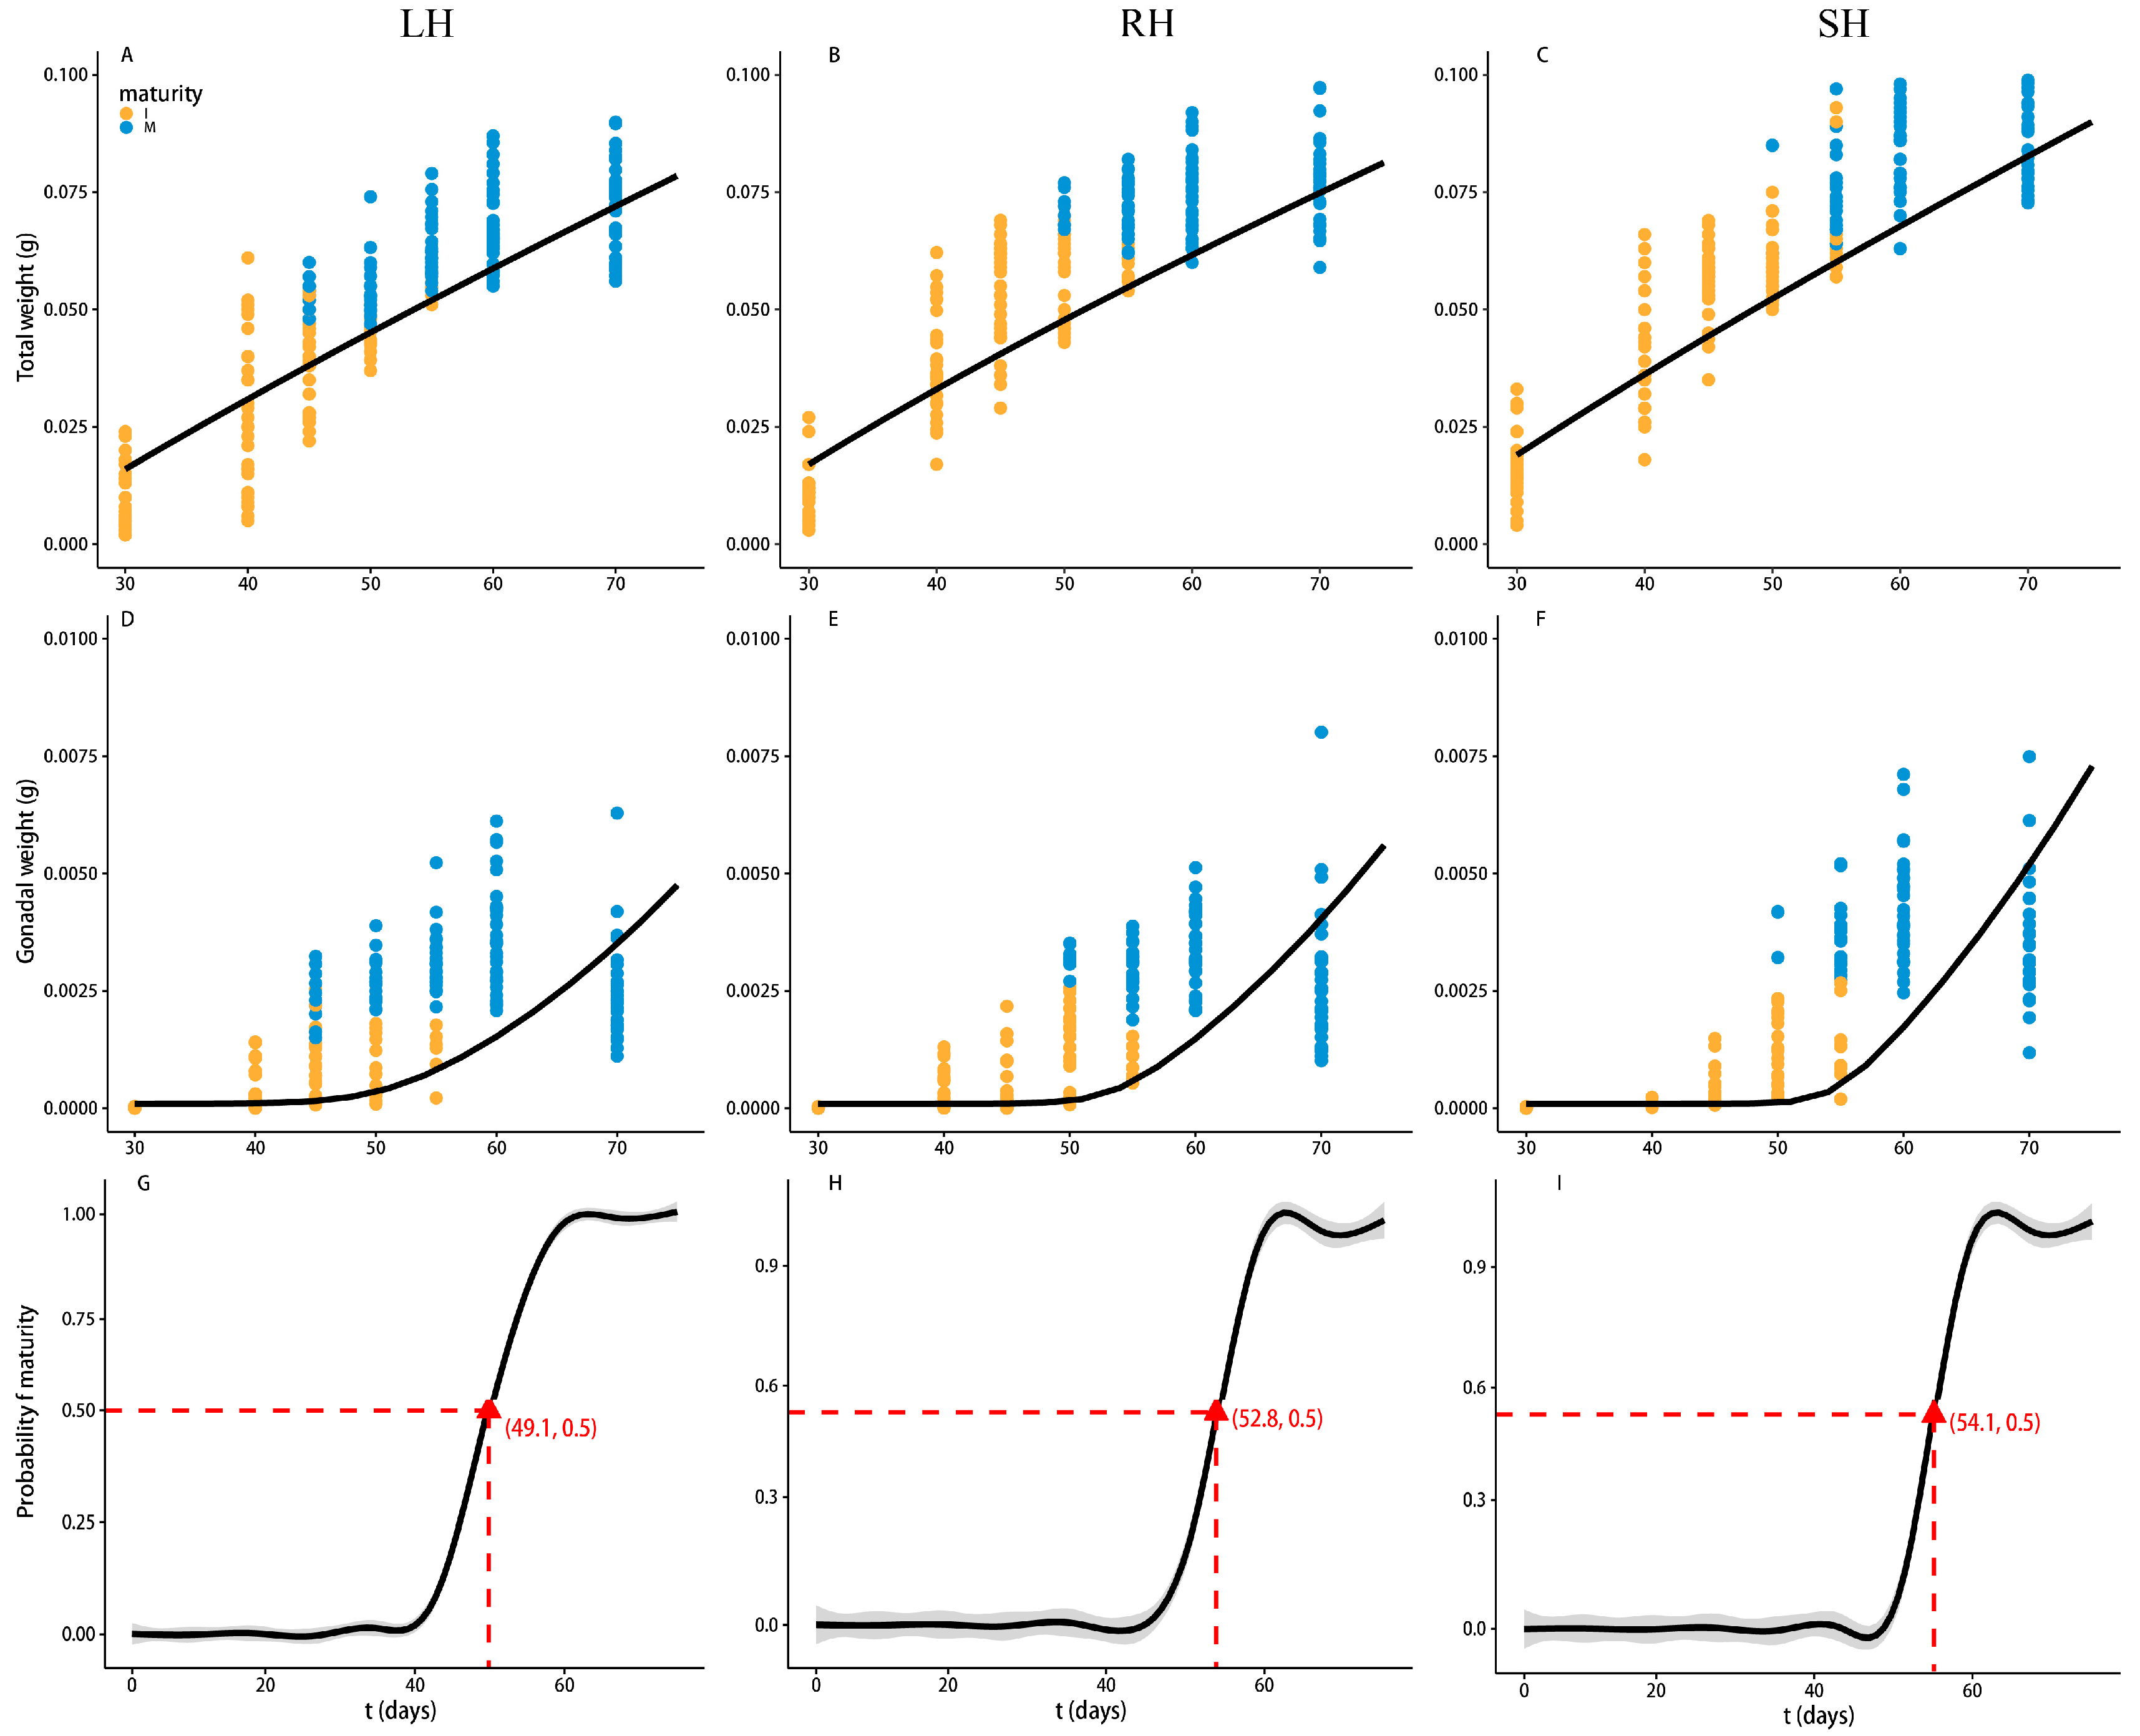
2.4. Maturity Probability

During growth, individuals allocate energy to reproduction, which reduces the rate of somatic cell growth [52]. While the age at maturity and cumulative reproductive investment can vary between individuals and even within the same population, for the purpose of data processing, we assume that the maturity probability is constant across individuals in the model due to the difficulty of obtaining individual-level observations from fishery data. The age at which 50% of individuals reach maturity was used as the reference for the age at maturity. The maturity probability Pt can be defined by the generalized additive model (GAM) [53].
l o g i t { P ( τ t ) } = log ( p t 1 p t ) = η t
where η t is a smoothed function of age t estimated by local regression techniques.
The estimated maturity probability is
P t ^ = 1 + e x p ( η t ^ ) 1
To model the maturity probability Pt, we used the GAM, which allows for non-linear relationships between the predictors and the response variable. The GAM was fitted using the gam package (version 1.22-5) in R 4.3.1. In this model, age was used as the independent variable, and the maturity probability Pt (the likelihood of an individual reaching maturity at a given age) was the dependent variable. The model was fitted with a smoothing function for age to capture the non-linear effect of age on maturity. The formula for the model is as follows:
P t = g a m ( M a t u r i t y   s A g e ,   d a t a = d a t a s e t )
where   s A g e represents the smooth term for age. This approach allows the model to estimate the age-related probability of maturity without assuming a fixed functional form for the relationship.

3. Results

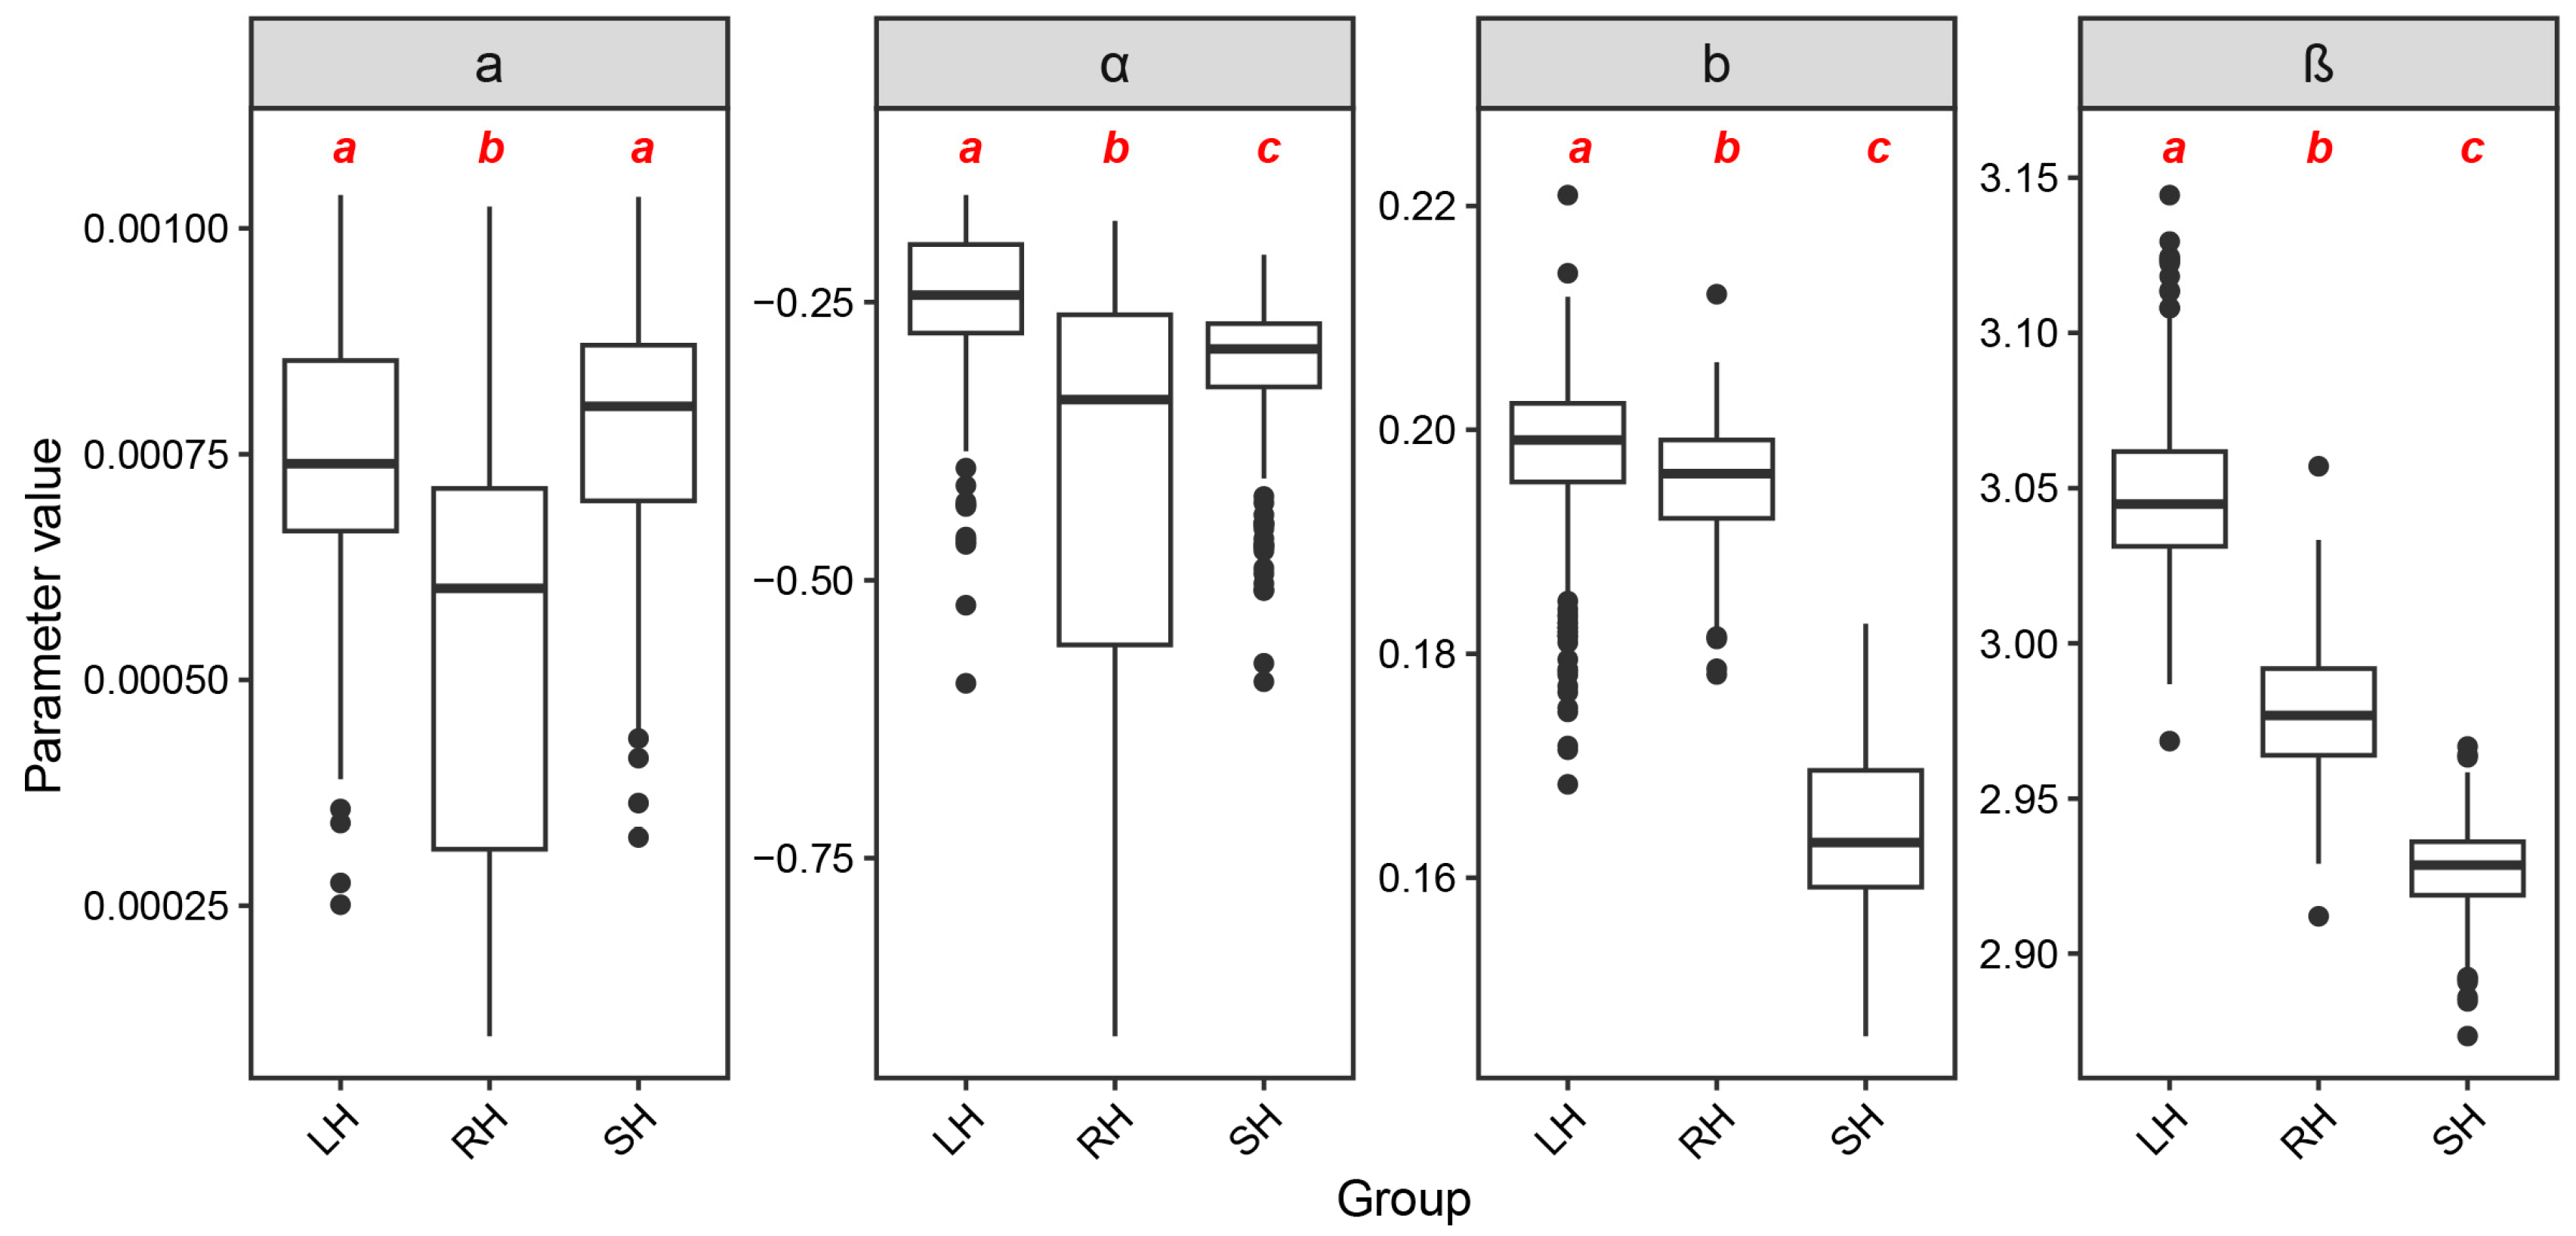
3.1. Parameter Estimation

The simulation runs provided parameter estimates that reflected the individual differences under the three harvesting strategies (Figure 2). The results of the simulation runs showed that the SH group had the highest a-value and the LH group had the highest α-value, indicating that the SH group allocated more energy to growth. Additionally, the LH group showed higher values for both b and β compared to the SH group, indicating that the LH group allocated more energy to reproduction.

3.2. Relationship Between Length and Weight of Marine Medaka Under Different Harvesting Strategies

The results of the length-weight relationship under different harvesting strategies showed that the “small harvest” group exhibited faster length-weight growth during the early growth stage, while the “large harvest” group showed slower growth. The difference between the groups was most pronounced during the immature stage. Specifically, when the fish length was less than 10 mm, the “small harvest” group grew faster, while the “large harvest” group grew slower (Figure 3).

3.3. Trends in Growth and Reproduction of Marine Medaka Under Different Harvesting Strategies

Trends in body length under different harvesting strategies showed that the average body length of the LH group was the smallest and that of the SH group was the largest under different harvesting times (Figure 4). At 30 days of age, the LH group was 13.4% smaller than the SH group. This difference increased to 16.4% at 40 days and 16.6% at 45 days, and then it gradually decreased as the fish aged, with a 7.0% difference at 55 days, 7.7% at 60 days, and 8.1% at 70 days. Moreover, before 45 days of age, the growth rate of body length in the LH group was lower compared to the SH group.
The trend in total body weight change under different harvesting strategies is shown in Figure 5A–C. Across different harvesting times, the average total body weight of the LH group was the lowest, while the SH group had the highest average body weight (Figure S1). In contrast, the trends in gonadal weight, shown in Figure 5D–F, revealed that the average gonadal weight of the LH group was higher than that of the SH group during the immature stage. However, during the mature stage, the average gonadal weight of the SH group exceeded that of the LH group (Figure S2). The maturation probability, presented in Figure 5G–I, indicated that all groups reached 100% maturation probability between 55 and 60 days of age, with the LH group maturing earlier than the SH group. At 50% maturity, the LH group reached maturity at 49.1 days, while the SH group reached it at 54.1 days. The RH group, as a reference, lies between the LH and SH groups, reaching sexual maturity at 52.8 days.

3.4. Differences in Reproductive Investment in Marine Medaka Under Different Harvesting Strategies

The results of instantaneous and cumulative reproductive investment under different harvesting strategies shown in Figure 6A indicate that the LH group had a higher instantaneous reproductive investment than the SH group before about 53 days of age. The instantaneous reproductive investment of the RH group was intermediate between the two groups. After about 53 days of age, the instantaneous reproductive investment of the SH group was higher than that of the LH group, and the instantaneous reproductive investment of the RH group was still between the two groups. Meanwhile, in Figure 6B, the cumulative reproductive investment of the LH group is slightly higher than that of the SH group before about 58 days of age, and the cumulative reproductive investment of the RH group is intermediate between the two groups. Thereafter, also with increasing age, the cumulative reproductive investment of the SH group is higher than that of the other two groups.

4. Discussion

This study investigates how different size-selective harvesting strategies—large harvest (LH), random harvest (RH), and small harvest (SH)—affect the growth, reproductive investment, and maturation of marine medaka. The SH strategy, by dividing more energy into growth during the early stages, resulted in larger fish at later ages, though it also delayed sexual maturity. On the other hand, the LH strategy accelerated maturation but led to smaller fish, as more energy was allocated to reproduction. These contrasting outcomes reveal the intricate balance between growth and reproduction shaped by harvesting pressure, providing important implications for fishery management and ecological protection.
The trade-off between the life history traits of fish and their ability to recover from size-selective fishing is essentially a result of the interplay between natural selection and human disturbance [26]. Size-selective harvesting disrupts populations by altering energy allocation between somatic growth (parameters a, α) and reproductive investment (b, β), ultimately reshaping their capacity to recover. By preferentially removing larger individuals, this practice reduces genetic diversity in size-related traits and destabilizes age/size structures, leaving populations vulnerable to environmental fluctuations [54,55]. In our study, we observed significant differences in growth and reproductive investment under size-selective harvesting strategies in marine medaka. Large harvest individuals suppressed somatic growth (a, α) but amplified gonadal development (b, β), prioritizing rapid reproduction over body size maintenance. Such shifts are not merely phenotypic. In guppies (Poecilia reticulata), three generations of size-selective fishing experiments have, for the first time, confirmed that targeted selection induces significant changes in genetic loci related to body size, leading to miniaturization and earlier sexual maturity [45]. These changes in reproductive timing and body size are closely linked to energy allocation strategies, as seen in parameters a (somatic growth) and α (somatic growth rate) as well as b (gonadal growth) and β (gonadal development trajectory) in our study, where reproductive investment shows greater responsiveness to size-selective pressure. Populations with rapid reproductive turnover, such as Peruvian anchovy (Engraulis ringens), leverage high larval output (b) to rebound within 2–4 years after disturbances [56,57]. However, species with delayed maturation and low reproductive frequency face severe recovery challenges [58,59]. These species typically follow a “quality strategy,” investing energy in long-term individual growth and resilience, as demonstrated by the SH group [60]. The New Zealand long-finned eel (Anguilla dieffenbachii) takes 35–40 years for females to reach sexual maturity, spawning millions of eggs per cycle [61]. Each 10% increase in adult fishing intensity extends the recovery period by 15–20 years, making recovery extremely challenging due to the threats posed by dams and pollution [62]. Increased reproductive investment can lead to the emergence of an evolutionary trap, where short-term juvenile recruitment rates rise, but adult reproductive efficiency declines. For example, North Atlantic cod reached sexual maturity earlier, from 6 to 4 years, and reduced in size by 30% due to a century of continuous size-selective fishing [63,64]. This resulted in a stable population with low biomass, highlighting the long-term consequences of size-selective pressures on both somatic growth (parameter a) and reproductive traits (parameters b and β), particularly as indicated by changes in reproductive output and body size.
Fishing significantly alters fish biological traits such as size and timing of sexual maturity, with different harvesting strategies influencing energy allocation. Three size-selective harvesting strategies led to distinct differences in the reproductive investment of marine medaka after seven generations. The LH group exhibited significant miniaturization and earlier sexual maturity, driven by higher instantaneous (rt) and cumulative (Rt) reproductive investment during early growth stages. This trade-off reflects the limited nature of energy, as allocating more energy to reproduction reduces energy available for growth. Such adaptations are consistent with r/K selection theory, where r-selected organisms prioritize early reproduction, smaller body size, and shorter lifespans to maximize fitness under intense harvesting pressure [26]. For example, in black rockfish (Sebastes melanops), individuals exposed to heavy fishing pressure matured at younger ages and smaller sizes [65]. Similarly, in Atlantic silverside, size-selective harvesting of larger individuals resulted in reduced body weight, slower growth rates, and higher reproductive allocation within just four generations [41]. In contrast, the SH group allocated more energy to somatic growth during early stages, resulting in larger body sizes and delayed sexual maturity. These findings align with observations in zebrafish (Danio rerio), where the LH group exhibited reduced asymptotic length and increased reproductive investment, while the SH group showed increased asymptotic length and slower reproductive maturation [34]. Another example can be seen in North Sea plaice (Pleuronectes platessa), where long-term size-selective harvesting led to significant changes in growth patterns and reproductive traits, favoring early reproduction and smaller mature sizes [66]. Such patterns illustrate the consistent impact of size-selective harvesting across different species, where populations under intense fishing pressure allocate energy toward reproduction to ensure recruitment before capture. These examples underscore the profound impact of size-selective harvesting on energy allocation strategies, driving populations toward early reproduction and increased reproductive investment. However, these adaptations come at a cost to somatic growth, resulting in smaller body sizes and reduced long-term population productivity. The clear trade-offs between growth and reproduction highlight the adaptive strategies fish populations employ to maximize fitness under different harvesting pressures, offering a deeper understanding of the mechanisms driving life history changes under size-selective harvesting.
Fishing is a complex process that involves many different strategies and approaches, but it is still selective in nature and is designed to capture species of higher economic value. A single fishing strategy can disrupt the energy allocation balance in fish populations, leading to trends such as precocious maturity and miniaturization [67,68]. These changes reduce offspring survival rates and adaptability, ultimately undermining the stability of population dynamics. Life history theory shows that the age of sexual maturity and body size are linked to how energy is allocated during growth and reproduction [69]. In our study, the LH group allocated more energy to reproduction in the early growth period, resulting in smaller individuals and earlier maturity. While earlier sexual maturity can lead to higher fecundity and faster reproduction [70,71], it also means less time for growth, leading to smaller fish and lower survival rates for future generations [41]. This highlights the importance of setting fishing strategies based on the timing of harvest and the life history characteristics of different species. For example, preferentially harvesting larger fish can accelerate reproduction but may also lead to smaller fish and earlier maturity [28,72,73]. Species such as striped bass, small yellow croaker (Larimichthys polyactis), and anchovy (Engraulis encrasicolus) have shown earlier sexual maturity and higher fecundity under prolonged fishing pressure, but this has resulted in decreased recruitment and increased fishing mortality [74,75,76,77]. Since different species have varying life history traits, fishing strategies should be adapted to match their reproductive timelines and maturity stages. At the same time, we recognize that sex-specific analysis could provide additional insights and will consider this approach in future studies with larger sample sizes. In many fisheries around the world, current management practices, such as setting minimum mesh sizes and seasonal fishing moratoriums, have been effective in protecting juvenile fish in single-species fisheries [78,79]. However, for multi-species systems, where species mature at different rates, these strategies may not provide adequate protection for all species [80]. To improve sustainability, fisheries management should consider life history data when setting harvest guidelines, tailoring strategies to the specific reproductive stages of different species. This will allow for the implementation of balanced, multi-species fishing strategies that help preserve fish populations and ecosystems.

5. Conclusions

Size-selective harvesting affects the reproductive investment and energy allocation of marine medaka, with different strategies influencing growth and reproduction. In the “large harvest” (LH) group, individuals allocated more energy to early reproduction, resulting in smaller body sizes and earlier sexual maturity, which helps maintain population balance. In contrast, the “small harvest” (SH) group prioritized growth during early stages, leading to larger fish and faster growth rates, with mature individuals being larger. This study provides insights into how different harvesting strategies alter reproductive investment and energy allocation in marine medaka, illustrating how fish populations adjust to maintain balance under harvesting pressures. These findings offer valuable implications for fishery management, aiding in the development of more effective and sustainable fishing strategies.

Supplementary Materials

The following supporting information can be downloaded at: https://www.mdpi.com/article/10.3390/fishes10030112/s1, Figure S1: Average body length, body weight, and gonadal weight at different harvesting times under different harvesting strategies; Figure S2: Boxplots of body length, total weight, and gonadal weight across different harvest strategies and maturity stages; Table S1: Significance test between repeated groups under different size-selective harvesting strategies; Table S2: Statistical comparison of Parameters a, α, b, and β under different size-selective harvesting strategies.

Author Contributions

Conceptualization, G.G., X.S. and P.S.; methodology, G.G., X.S., P.S., G.L. and W.D.; formal analysis, G.G. and X.S.; resources, P.S. and Y.T.; writing—original draft preparation, G.G. and X.S.; writing—review and editing, G.G., P.S., G.L., W.D. and Y.T.; visualization, G.L. and F.L.; supervision, P.S.; project administration, P.S.; funding acquisition, P.S. All authors have read and agreed to the published version of the manuscript.

Funding

This research was funded by the National Natural Science Foundation of China (32073027) and the Taishan Scholar Foundation of Shandong Province (tsqn202211052).

Institutional Review Board Statement

The authors declare that all applicable institutional, national, or international guidelines for the use and care of animals were strictly followed in the present study.

Informed Consent Statement

Not applicable.

Data Availability Statement

The data supporting the findings of this study are available from the corresponding author upon reasonable request.

Acknowledgments

We thank State Key Laboratory of Marine Environmental Science, Xiamen University (China), for providing the marine medaka. And we thank Xinxin Wang, Siqing Xu, Zhenlin Li, Zhiling Dong, and Congxian Chen for their important help with feeding the marine medaka and completing the experiment.

Conflicts of Interest

The authors declare no conflicts of interest.

References

  1. Zera, A.J.; Harshman, L.G. The Physiology of Life History Trade-Offs in Animals. Annu. Rev. Ecol. Syst. 2001, 32, 95–126. [Google Scholar] [CrossRef]
  2. McBride, R.S.; Somarakis, S.; Fitzhugh, G.R.; Albert, A.; Yaragina, N.A.; Wuenschel, M.J.; Alonso-Fernández, A.; Basilone, G. Energy Acquisition and Allocation to Egg Production in Relation to Fish Reproductive Strategies. Fish Fish. 2015, 16, 23–57. [Google Scholar] [CrossRef]
  3. Sokolova, I.M.; Frederich, M.; Bagwe, R.; Lannig, G.; Sukhotin, A.A. Energy Homeostasis as an Integrative Tool for Assessing Limits of Environmental Stress Tolerance in Aquatic Invertebrates. Mar. Environ. Res. 2012, 79, 1–15. [Google Scholar] [CrossRef]
  4. Ganias, K.; Kjesbu, O.S.; Lowerre-Barbieri, S.; Fuentes-Pardo, A.P.; Andersson, L.; Brosset, P. Reproduction of Marine Fishes. In Ecology of Marine Fish; Elsevier: Amsterdam, The Netherlands, 2025; pp. 143–159. [Google Scholar]
  5. Kamler, E. Early Life History of Fish: An Energetics Approach; Springer Science & Business Media: Berlin/Heidelberg, Germany, 2012; ISBN 978-94-011-2324-2. [Google Scholar]
  6. Birnie-Gauvin, K.; Bordeleau, X.; Cooke, S.J.; Davidsen, J.G.; Eldøy, S.H.; Eliason, E.J.; Moore, A.; Aarestrup, K. Life-History Strategies in Salmonids: The Role of Physiology and Its Consequences. Biol. Rev. 2021, 96, 2304–2320. [Google Scholar] [CrossRef]
  7. Roff, D.A. An Allocation Model of Growth and Reproduction in Fish. Can. J. Fish. Aquat. Sci. 1983, 40, 1395–1404. [Google Scholar] [CrossRef]
  8. Rijnsdorp, A.D.; van Damme, C.J.G.; Witthames, P.R. Ecology of Reproduction. In Flatfishes; John Wiley & Sons, Ltd.: Hoboken, NJ, USA, 2014; pp. 101–131. ISBN 978-1-118-50115-3. [Google Scholar]
  9. Niu, J.; Huss, M.; Vasemägi, A.; Gårdmark, A. Decades of Warming Alters Maturation and Reproductive Investment in Fish. Ecosphere 2023, 14, e4381. [Google Scholar] [CrossRef]
  10. Conroy, C.W.; Piccoli, P.M.; Secor, D.H. Carryover Effects of Early Growth and River Flow on Partial Migration in Striped Bass Morone Saxatilis. Mar. Ecol. Prog. Ser. 2015, 541, 179–194. [Google Scholar] [CrossRef]
  11. Alix, M.; Kjesbu, O.S.; Anderson, K.C. From Gametogenesis to Spawning: How Climate-Driven Warming Affects Teleost Reproductive Biology. J. Fish Biol. 2020, 97, 607–632. [Google Scholar] [CrossRef]
  12. Diaz, R.J.; Breitburg, D.L. The Hypoxic Environment. In Fish Physiology; Elsevier: Amsterdam, The Netherlands, 2009; Volume 27, pp. 1–23. ISSN 1546-5098. [Google Scholar]
  13. Pollock, M.S.; Clarke, L.M.J.; Dubé, M.G. The Effects of Hypoxia on Fishes: From Ecological Relevance to Physiological Effects. Environ. Rev. 2007, 15, 1–14. [Google Scholar] [CrossRef]
  14. Calow, P.; Forbes, V.E. How Do Physiological Responses to Stress Translate into Ecological and Evolutionary Processes? Comp. Biochem. Physiol. Part A Mol. Integr. Physiol. 1998, 120, 11–16. [Google Scholar] [CrossRef]
  15. Kreiss, C.M.; Michael, K.; Lucassen, M.; Jutfelt, F.; Motyka, R.; Dupont, S.; Pörtner, H.-O. Ocean Warming and Acidification Modulate Energy Budget and Gill Ion Regulatory Mechanisms in Atlantic Cod (Gadus morhua). J. Comp. Physiol. B 2015, 185, 767–781. [Google Scholar] [CrossRef] [PubMed]
  16. Melatunan, S.; Calosi, P.; Rundle, S.D.; Widdicombe, S.; Moody, A.J. Effects of Ocean Acidification and Elevated Temperature on Shell Plasticity and Its Energetic Basis in an Intertidal Gastropod. Mar. Ecol. Prog. Ser. 2013, 472, 155–168. [Google Scholar] [CrossRef]
  17. Holt, R.E.; Jørgensen, C. Climate Warming Causes Life-History Evolution in a Model for Atlantic Cod (Gadus morhua). Conserv. Physiol. 2014, 2, cou050. [Google Scholar] [CrossRef] [PubMed]
  18. Rooker, J.R.; Alvarado Bremer, J.R.; Block, B.A.; Dewar, H.; de Metrio, G.; Corriero, A.; Kraus, R.T.; Prince, E.D.; Rodríguez-Marín, E.; Secor, D.H. Life History and Stock Structure of Atlantic Bluefin Tuna (Thunnus thynnus). Rev. Fish. Sci. 2007, 15, 265–310. [Google Scholar] [CrossRef]
  19. Quince, C.; Abrams, P.A.; Shuter, B.J.; Lester, N.P. Biphasic Growth in Fish I: Theoretical Foundations. J. Theor. Biol. 2008, 254, 197–206. [Google Scholar] [CrossRef]
  20. Shimadzu, H.; Wang, H.-Y. Estimating Allometric Energy Allocation between Somatic and Gonadic Growth. Methods Ecol. Evol. 2022, 13, 407–418. [Google Scholar] [CrossRef]
  21. Folkvord, A.; Jørgensen, C.; Korsbrekke, K.; Nash, R.D.M.; Nilsen, T.; Skjæraasen, J.E. Trade-Offs between Growth and Reproduction in Wild Atlantic Cod. Can. J. Fish. Aquat. Sci. 2014, 71, 1106–1112. [Google Scholar] [CrossRef]
  22. Udupa, K.S.; Ganga, U.; Sobhana, K.S. Fishery and Biology of Cutlass Fishes from Indian Seas with Special Reference to the Largehead Hairtail Trichiurus Lepturus Linnaeus, 1758—A Review. Indian J. Fish. 2022, 69, 148–163. [Google Scholar] [CrossRef]
  23. Young, J.L.; Bornik, Z.B.; Marcotte, M.L.; Charlie, K.N.; Wagner, G.N.; Hinch, S.G.; Cooke, S.J. Integrating Physiology and Life History to Improve Fisheries Management and Conservation. Fish Fish. 2006, 7, 262–283. [Google Scholar] [CrossRef]
  24. Johnston, F.D.; Arlinghaus, R.; Dieckmann, U. Fish Life History, Angler Behaviour and Optimal Management of Recreational Fisheries. Fish Fish. 2013, 14, 554–579. [Google Scholar] [CrossRef]
  25. Rochet, M.-J. Short-Term Effects of Fishing on Life History Traits of Fishes. ICES J. Mar. Sci. 1998, 55, 371–391. [Google Scholar] [CrossRef]
  26. Heino, M.; Godø, O.R. Fisheries-Induced Selection Pressures in the Context of Sustainable Fisheries. Bull. Mar. Sci. 2002, 70, 639–656. [Google Scholar]
  27. Ohlberger, J.; Langangen, Ø.; Stige, L.C. Age Structure Affects Population Productivity in an Exploited Fish Species. Ecol. Appl. 2022, 32, e2614. [Google Scholar] [CrossRef] [PubMed]
  28. Fenberg, P.B.; Roy, K. Ecological and Evolutionary Consequences of Size-selective Harvesting: How Much Do We Know? Mol. Ecol. 2008, 17, 209–220. [Google Scholar] [CrossRef]
  29. Harvey, C.J.; Tolimieri, N.; Levin, P.S. Changes in Body Size, Abundance, and Energy Allocation in Rockfish Assemblages of the Northeast Pacific. Ecol. Appl. 2006, 16, 1502–1515. [Google Scholar] [CrossRef]
  30. Ricker, W.E. Changes in the Average Size and Average Age of Pacific Salmon. Can. J. Fish. Aquat. Sci. 1981, 38, 1636–1656. [Google Scholar] [CrossRef]
  31. Xi, X.; Sun, P.; Sun, R.; Tian, Y.; Heino, M. Size-Selective Harvesting Alters Biological Traits of Marine Medaka (Oryzias melastigma). Fish. Res. 2023, 266, 106775. [Google Scholar] [CrossRef]
  32. Zwanenburg, K.C.T. The Effects of Fishing on Demersal Fish Communities of the Scotian Shelf. ICES J. Mar. Sci. 2000, 57, 503–509. [Google Scholar] [CrossRef]
  33. Pellowe, K.E.; Leslie, H.M. Size-Selective Fishing Leads to Trade-Offs between Fishery Productivity and Reproductive Capacity. Ecosphere 2020, 11, e03071. [Google Scholar] [CrossRef]
  34. Uusi-Heikkilä, S.; Whiteley, A.R.; Kuparinen, A.; Matsumura, S.; Venturelli, P.A.; Wolter, C.; Slate, J.; Primmer, C.R.; Meinelt, T.; Killen, S.S.; et al. The Evolutionary Legacy of Size-Selective Harvesting Extends from Genes to Populations. Evol. Appl. 2015, 8, 597–620. [Google Scholar] [CrossRef]
  35. Jørgensen, C.; Ernande, B.; Fiksen, Ø. Size-selective Fishing Gear and Life History Evolution in the Northeast Arctic Cod. Evol. Appl. 2009, 2, 356–370. [Google Scholar] [CrossRef] [PubMed]
  36. Hutchings, J.A. Life History Consequences of Overexploitation to Population Recovery in Northwest Atlantic Cod (Gadus morhua). Can. J. Fish. Aquat. Sci. 2005, 62, 824–832. [Google Scholar] [CrossRef]
  37. Stearns, S.C. Trade-Offs in Life-History Evolution. Funct. Ecol. 1989, 3, 259–268. [Google Scholar] [CrossRef]
  38. Winemiller, K.O.; Rose, K.A. Why Do Most Fish Produce so Many Tiny Offspring? Am. Nat. 1993, 142, 585–603. [Google Scholar] [CrossRef]
  39. Yuan, R.; Hascup, E.; Hascup, K.; Bartke, A. Relationships among Development, Growth, Body Size, Reproduction, Aging, and Longevity—Trade-Offs and Pace-Of-Life. Biochemistry 2023, 88, 1692–1703. [Google Scholar] [CrossRef]
  40. Giesel, J.T. Reproductive Strategies as Adaptations to Life in Temporally Heterogeneous Environments. Annu. Rev. Ecol. Syst. 1976, 7, 57–79. [Google Scholar] [CrossRef]
  41. Conover, D.O.; Munch, S.B. Sustaining Fisheries Yields over Evolutionary Time Scales. Science 2002, 297, 94–96. [Google Scholar] [CrossRef] [PubMed]
  42. Conover, D.O.; Present, T.M.C. Countergradient Variation in Growth Rate: Compensation for Length of the Growing Season among Atlantic Silversides from Different Latitudes. Oecologia 1990, 83, 316–324. [Google Scholar] [CrossRef]
  43. Yamahira, K.; Conover, D.O. Intra- vs. interspecific latitudinal variation in growth: Adaptation to temperature or seasonality? Ecology 2002, 83, 1252–1262. [Google Scholar] [CrossRef]
  44. Uusi-Heikkilä, S.; Sävilammi, T.; Leder, E.; Arlinghaus, R.; Primmer, C.R. Rapid, Broad-scale Gene Expression Evolution in Experimentally Harvested Fish Populations. Mol. Ecol. 2017, 26, 3954–3967. [Google Scholar] [CrossRef]
  45. van Wijk, S.J.; Taylor, M.I.; Creer, S.; Dreyer, C.; Rodrigues, F.M.; Ramnarine, I.W.; van Oosterhout, C.; Carvalho, G.R. Experimental Harvesting of Fish Populations Drives Genetically Based Shifts in Body Size and Maturation. Front. Ecol. Environ. 2013, 11, 181–187. [Google Scholar] [CrossRef]
  46. Inoue, K.; Takei, Y. Asian Medaka Fishes Offer New Models for Studying Mechanisms of Seawater Adaptation. Comp. Biochem. Physiol. Part B Biochem. Mol. Biol. 2003, 136, 635–645. [Google Scholar] [CrossRef]
  47. Iwamatsu, T. Stages of Normal Development in the Medaka Oryzias latipes. Mech. Dev. 2004, 121, 605–618. [Google Scholar] [CrossRef]
  48. Im, J.H.; Gil, H.W.; Lee, T.H.; Kong, H.J.; Ahn, C.M.; Kim, B.S.; Kim, D.S.; Zhang, C.I.; Park, I.-S. Morphometric Characteristics and Fin Dimorphism between Male and Female on the Marine Medaka, Oryzias Dancena. Dev. Reprod. 2016, 20, 331–347. [Google Scholar] [CrossRef] [PubMed]
  49. Amaral, I.P.G.; Johnston, I.A. Experimental Selection for Body Size at Age Modifies Early Life-History Traits and Muscle Gene Expression in Adult Zebrafish. J. Exp. Biol. 2012, 215, 3895–3904. [Google Scholar] [CrossRef] [PubMed]
  50. Therkildsen, N.O.; Wilder, A.P.; Conover, D.O.; Munch, S.B.; Baumann, H.; Palumbi, S.R. Contrasting Genomic Shifts Underlie Parallel Phenotypic Evolution in Response to Fishing. Science 2019, 365, 487–490. [Google Scholar] [CrossRef]
  51. Cleveland, W.S.; Devlin, S.J. Locally Weighted Regression: An Approach to Regression Analysis by Local Fitting. J. Am. Stat. Assoc. 1988, 83, 596–610. [Google Scholar] [CrossRef]
  52. Speakman, J.R. The Physiological Costs of Reproduction in Small Mammals. Philos. Trans. R. Soc. B Biol. Sci. 2007, 363, 375–398. [Google Scholar] [CrossRef]
  53. Hastie, T.; Tibshirani, R. Generalized Additive Models: Some Applications. J. Am. Stat. Assoc. 1987, 82, 371–386. [Google Scholar] [CrossRef]
  54. Uusi-Heikkilä, S. Implications of Size-Selective Fisheries on Sexual Selection. Evol. Appl. 2020, 13, 1487–1500. [Google Scholar] [CrossRef]
  55. Petit-Marty, N.; Liu, M.; Tan, I.Z.; Chung, A.; Terrasa, B.; Guijarro, B.; Ordines, F.; Ramírez-Amaro, S.; Massutí, E.; Schunter, C. Declining Population Sizes and Loss of Genetic Diversity in Commercial Fishes: A Simple Method for a First Diagnostic. Front. Mar. Sci. 2022, 9, 872537. [Google Scholar] [CrossRef]
  56. Castillo, P.R.; Ñiquen, M.; Cruz, L.L.; Guevara-Carrasco, R.; Cuadros, G.; Castillo, P.R.; Ñiquen, M.; Cruz, L.L.; Guevara-Carrasco, R.; Cuadros, G. Migration Behavior of Anchoveta (Engraulis ringens) in the Northern Humboldt Current System between September 2019 and September 2020. Lat. Am. J. Aquat. Res. 2021, 49, 702–716. [Google Scholar] [CrossRef]
  57. Grant, W.; Bowen, B. Shallow Population Histories in Deep Evolutionary Lineages of Marine Fishes: Insights from Sardines and Anchovies and Lessons for Conservation. J. Hered. 1998, 89, 415–426. [Google Scholar] [CrossRef]
  58. Hilborn, R.; Amoroso, R.O.; Anderson, C.M.; Baum, J.K.; Branch, T.A.; Costello, C.; de Moor, C.L.; Faraj, A.; Hively, D.; Jensen, O.P.; et al. Effective Fisheries Management Instrumental in Improving Fish Stock Status. Proc. Natl. Acad. Sci. USA 2020, 117, 2218–2224. [Google Scholar] [CrossRef]
  59. Trochta, J.T.; Branch, T.A.; Shelton, A.O.; Hay, D.E. The Highs and Lows of Herring: A Meta-Analysis of Patterns and Factors in Herring Collapse and Recovery. Fish Fish. 2020, 21, 639–662. [Google Scholar] [CrossRef]
  60. Walker, B.H.; Abel, N.; Anderies, J.M.; Ryan, P. Resilience, Adaptability, and Transformability in the Goulburn-Broken Catchment, Australia. Ecol. Soc. 2009, 14, 12. [Google Scholar] [CrossRef]
  61. Burnet, A.M.R. Studies on the Ecology of the New Zealand Long-Finned Eel, Anguilla Dieffenbachii Gray. Mar. Freshw. Res. 1952, 3, 32–63. [Google Scholar] [CrossRef]
  62. Stuart, R.E.; Closs, G.P.; Lokman, P.M.; Jellyman, D. The Influence of Environmental Cues on the Activity of Silver Eels (Anguilla dieffenbachii) in Lake Manapouri, New Zealand. N. Z. J. Mar. Freshw. Res. 2019, 53, 169–181. [Google Scholar] [CrossRef]
  63. Jørgensen, T. Long-Term Changes in Age at Sexual Maturity of Northeast Arctic Cod (Gadus morhua L.). ICES J. Mar. Sci. 1990, 46, 235–248. [Google Scholar] [CrossRef]
  64. Köster, F.W.; Trippel, E.A.; Tomkiewicz, J. Linking Size and Age at Sexual Maturation to Body Growth, Productivity and Recruitment of Atlantic Cod Stocks Spanning the North Atlantic. Fish. Res. 2013, 138, 52–61. [Google Scholar] [CrossRef]
  65. Berkeley, S.A.; Hixon, M.A.; Larson, R.J.; Love, M.S. Fisheries Sustainability via Protection of Age Structure and Spatial Distribution of Fish Populations. Fisheries 2004, 29, 23–32. [Google Scholar] [CrossRef]
  66. Heino, M.; Pauli, B.D.; Dieckmann, U. Fisheries-Induced Evolution. Annu. Rev. Ecol. Evol. Syst. 2015, 46, 461–480. [Google Scholar] [CrossRef]
  67. Du, J.; Tian, H.; Xiang, Z.; Zhao, K.; Yu, L.; Duan, X.; Chen, D.; Xu, J.; Liu, M. Impact of the Fishing Ban on Fish Diversity and Population Structure in the Middle Reaches of the Yangtze River, China. Front. Environ. Sci. 2025, 12, 1530716. [Google Scholar] [CrossRef]
  68. Sloat, M.R.; Reeves, G.H. Individual Condition, Standard Metabolic Rate, and Rearing Temperature Influence Steelhead and Rainbow Trout (Oncorhynchus mykiss) Life Histories. Can. J. Fish. Aquat. Sci. 2014, 71, 491–501. [Google Scholar] [CrossRef]
  69. Stearns, S.C. Life-History Tactics: A Review of the Ideas. Q. Rev. Biol. 1976, 51, 3–47. [Google Scholar] [CrossRef]
  70. Blažek, R.; Polačik, M.; Reichard, M. Rapid Growth, Early Maturation and Short Generation Time in African Annual Fishes. EvoDevo 2013, 4, 24. [Google Scholar] [CrossRef]
  71. Sadovy, Y. The Threat of Fishing to Highly Fecund Fishes. J. Fish Biol. 2001, 59, 90–108. [Google Scholar] [CrossRef]
  72. Enberg, K.; Jørgensen, C.; Dunlop, E.S.; Varpe, Ø.; Boukal, D.S.; Baulier, L.; Eliassen, S.; Heino, M. Fishing-Induced Evolution of Growth: Concepts, Mechanisms and the Empirical Evidence. Mar. Ecol. 2012, 33, 1–25. [Google Scholar] [CrossRef]
  73. Jørgensen, C.; Holt, R.E. Natural Mortality: Its Ecology, How It Shapes Fish Life Histories, and Why It May Be Increased by Fishing. J. Sea Res. 2013, 75, 8–18. [Google Scholar] [CrossRef]
  74. Brown, S.C.; Giuliano, A.M.; Versak, B.A. Female Age at Maturity and Fecundity in Atlantic Striped Bass. Mar. Coast. Fish. 2024, 16, e10280. [Google Scholar] [CrossRef]
  75. Ferreri, R.; Genovese, S.; Barra, M.; Biagiotti, I.; Bourdeix, J.-H.; de Felice, A.; Gasparevic, D.; Hattab, T.; Iglesias, M.; Juretic, T.; et al. Variability in Size at Maturity of the European Anchovy (Engraulis encrasicolus) in the Mediterranean Sea. Mediterr. Mar. Sci. 2021, 22, 858–870. [Google Scholar] [CrossRef]
  76. Liu, Z.; Jin, Y.; Yang, L.; Yan, L.; Zhang, Y.; Xu, M.; Tang, J.; Zhou, Y.; Hu, F.; Cheng, J. Incorporating Egg-Transporting Pathways into Conservation Plans of Spawning Areas: An Example of Small Yellow Croaker (Larimichthys polyactis) in the East China Sea Zone. Front. Mar. Sci. 2022, 9, 941411. [Google Scholar] [CrossRef]
  77. Yan, L.; Jiang, Y.; Xu, Q.; Ding, G.; Chen, X.; Liu, M. Reproductive Dynamics of the Large Yellow Croaker Larimichthys crocea (Sciaenidae), A Commercially Important Fishery Species in China. Front. Mar. Sci. 2022, 9, 868580. [Google Scholar] [CrossRef]
  78. Shen, G.; Heino, M. An Overview of Marine Fisheries Management in China. Mar. Policy 2014, 44, 265–272. [Google Scholar] [CrossRef]
  79. Sun, M.; Li, Y.; Chen, Y. Unveiling Unselective Fishing in China: A Nationwide Meta-Analysis of Multispecies Fisheries. Fish Fish. 2023, 24, 142–158. [Google Scholar] [CrossRef]
  80. Newman, S.J.; Brown, J.I.; Fairclough, D.V.; Wise, B.S.; Bellchambers, L.M.; Molony, B.W.; Lenanton, R.C.J.; Jackson, G.; Smith, K.A.; Gaughan, D.J.; et al. A Risk Assessment and Prioritisation Approach to the Selection of Indicator Species for the Assessment of Multi-Species, Multi-Gear, Multi-Sector Fishery Resources. Mar. Policy 2018, 88, 11–22. [Google Scholar] [CrossRef]
Figure 1. Three size-selective harvesting strategies: large harvest (LH), random harvest (RH), and small harvest (SH). The energy allocation process is depicted with arrows leading from the fish to two outcomes: growth and reproduction. Each group is replicated three times.
Fishes 10 00112 g001
Figure 2. Boxplots showing the parameter values for a, α, b, and β under different harvesting strategies. Parameter a represents the baseline growth rate constant for somatic growth, α modulates the efficiency of energy conversion into somatic growth, b indicates the rate of energy allocated to gonadal growth after sexual maturity, and β adjusts the trajectory of gonadal development, affecting reproductive output. The boxplots represent the distribution of values for each parameter, with the box showing the interquartile range (IQR), the line within the box indicating the median, and the whiskers extending to the minimum and maximum values within 1.5 times the IQR. Outliers are depicted as individual points outside the whiskers. Statistical comparisons between groups (large harvest, LH; random harvest, RH; small harvest, SH) were conducted using ANOVA, with significance indicated by letters above the boxplots. Different letters (a, b, c) denote statistically significant differences between groups (p < 0.01). Groups sharing the same letter are not significantly different, while different letters indicate significant differences based on pairwise comparisons. For detailed statistical calculations and tests, refer to the supplementary file (Table S2).
Fishes 10 00112 g002
Figure 3. Relationship between body length (mm) and total weight (g) of marine medaka under three different harvesting strategies: large harvest (LH), random harvest (RH), and small harvest (SH). Immature individuals (I) are represented by yellow dots, while mature individuals (M) are represented by blue dots. A smooth curve is fitted to each group to highlight the overall trend in the length–weight relationship, with shaded areas representing the 95% confidence intervals.
Fishes 10 00112 g003
Figure 4. Trends in body length growth of marine medaka under different harvesting strategies. Immature individuals (I) are represented by filled circles (blue for large harvest, yellow for random harvest, red for small harvest), and mature individuals (M) are represented by filled triangles (blue for large harvest, yellow for random harvest, red for small harvest). Smooth curves with shaded areas representing confidence intervals are shown for each group.
Fishes 10 00112 g004
Figure 5. Growth and maturation probability curves for marine medaka. (A) Curves for total body weight (Vt) for the large harvest (LH) group. (B) Curves for total body weight (Vt) for the random harvest (RH) group. (C) Curves for total body weight (Vt) for the small harvest (SH) group. (D) Curves for gonad weight (gt) for the large harvest (LH) group. (E) Curves for gonad weight (gt) for the random harvest (RH) group. (F) Curves for gonad weight (gt) for the small harvest (SH) group. (G) Curves for maturation probability (Pt) for the large harvest (LH) group. (H) Curves for maturation probability (Pt) for the RH group. (I) Curves for maturation probability (Pt) for the small harvest (SH) group. In plots (GI), the red dashed lines indicate the estimated age at 50% probability of maturity (49.1 days for LH, 52.8 days for RH, and 54.1 days for SH). The blue and yellow points in (AF) represent mature and immature individuals, respectively. Smooth curves with shaded areas representing confidence intervals are shown for each group.
Fishes 10 00112 g005
Figure 6. Estimated reproductive investment for marine medaka under three different harvesting strategies: LH (blue), RH (yellow), and SH (red). (A) Estimated instantaneous reproductive investment. (B) Estimated cumulative reproductive investment over time.
Fishes 10 00112 g006
Disclaimer/Publisher’s Note: The statements, opinions and data contained in all publications are solely those of the individual author(s) and contributor(s) and not of MDPI and/or the editor(s). MDPI and/or the editor(s) disclaim responsibility for any injury to people or property resulting from any ideas, methods, instructions or products referred to in the content.

