Article

Sediment Deposition Impacts on Fish Migration in Vertical Slot Fishways

1
School of Hydraulic and Ocean Engineering, Changsha University of Science & Technology, Changsha 410114, China
2
Key Laboratory of Dongting Lake Aquatic Eco-Environmental Control and Restoration of Hunan Province, Changsha 410114, China
3
Key Laboratory of Water-Sand Sciences and Water Disaster Prevention of Hunan Province, Changsha 410114, China
4
School of Civil and Environmental Engineering, Hunan University of Technology, Zhuzhou 412007, China
*
Author to whom correspondence should be addressed.
Fishes 2025, 10(11), 590; https://doi.org/10.3390/fishes10110590 (registering DOI)
Submission received: 8 October 2025 / Revised: 5 November 2025 / Accepted: 13 November 2025 / Published: 17 November 2025
(This article belongs to the Section Biology and Ecology)

Abstract

Vertical slot fishways represent critical ecological migration facilitation structures and have been globally implemented to restore fish passage. However, most studies to date focus primarily on fishway hydraulics and fish behavior, with limited investigation into sediment deposition effects that may compromise functionality. To address this gap, we integrated physical modeling and numerical simulations to systematically analyze sediment deposition in a vertical slot fishway and its impacts on common carp upstream migration. Results indicate that sediment deposition raised fish vertical swimming positions by an average of 5.0 cm, thereby reducing pool activity space by 5.2–20.2%, altering flow patterns, and disrupting carp bottom-migration behavior. Consequently, carp exhibited increased exploratory behavior and directional uncertainty. Moreover, sediment-induced vertical vortices elevated fish energy consumption, decreasing upstream migration success from 89% to 48%. Multiple linear regression confirmed that average sediment deposition height significantly affects both migration rate and vertical swimming positions, whereas mean deposition slope demonstrates negligible influence. This study elucidates the multifaceted impacts of sediment deposition on fishway efficacy, providing a scientific basis for optimizing designs to enhance migration success and long-term functionality.
Key Contribution: Sediment deposition disrupts flow dynamics and reduces carp migration efficiency, with vertical sediment height critically impacting fish behavior; these findings inform the optimization of sustainable fishway design.

1. Introduction

The intensification of global water resources development has rapidly increased dam installations, vital for flood control, irrigation, and clean energy [1]. However, hydropower infrastructure fragments over 60% of rivers exceeding 500 km globally, with additional projects planned in biodiversity hotspots [2]. Such fragmentation disrupts longitudinal connectivity, impeding water, sediment, and aquatic organism movement [3] and obstructing fish migration. Consequently, ontogenetic cycles, habitats, behaviors, and population dynamics are adversely affected [4,5,6], spurring widespread dam retrofitting and removal initiatives [7]. As ecological connectivity solutions, fishways enable fish to navigate barriers for reproductive or feeding migration. These structures mitigate adverse ecological impacts of hydraulic projects, protect fish resources, maintain aquatic biodiversity, and facilitate genetic exchange [8,9].
The vertical slot fishway comprises a rectangular channel with partition sections on a sloped bed. Its principal merit lies in maintaining stable hydraulic characteristics despite variations in flow velocity or water depth [10], thereby ensuring widespread implementation [11]. Current research extensively covers fishway hydraulics and piscine behavior. Investigations have quantified pool dimensions and configurations [12,13,14], while flow-field analyses reveal predominantly two-dimensional motion in pool interiors, where vertical velocities are negligible compared to horizontal components. However, near vertical slots or at slopes exceeding 5%, vertical velocity contributions become significant [15,16]. Furthermore, researchers have documented fish migratory trajectories, aggregation zones, and morphological responses to hydrodynamic conditions [17,18,19], whereas others have statistically analyzed behavioral patterns [20,21,22]. Collectively, emphasis has centered on structural configurations and slope effects; nevertheless, sediment-induced alterations to fishway morphology and hydraulics remain minimally explored.
Sediment incursion from turbid flows degrades fishway hydraulics, impairing functionality. This elevates maintenance expenditures, threatens structural integrity, obstructs fish migration, and risks complete operational failure through blockages. Water-sediment dynamics in silt-laden rivers present persistent operational challenges, particularly from localized sedimentation during floods or reservoir sediment-flushing cycles [23]. The global consequences demand attention: Occasional flooding precipitated sediment accumulation in Seseragi Rocky Slope fishway, hampering vegetation and fish passage; Lincoln Street fishway experienced biodiversity decline after 2015 flood-deposited sands [24]; Taiwan’s sediment-choked waterways disabled existing fishways [25]; Hunan Yangtang Fishway, China’s erstwhile premier facility, was abandoned post-1987 due to flood-derived siltation [26]; Qinghai Lake’s Shaliu River fishway inlet siltation caused total dysfunction [27]. Consequently, sedimentation gravely compromises migration efficiency and can terminate fishway operation, highlighting critical research value. Despite this, sedimentation studies remain scarce. Existing work addresses flow-sediment interactions in vertical slot, rock-ramp, and fishbone designs [27,28,29,30], and sedimentation countermeasures including fishbone-system flushing, Denil-pass dredging baffles, and trapezoidal fishways [25,31,32]. Duguay et al. investigated how sediment deposition in a baffle tailrace influenced the migration behavior of juvenile fish [33]. While foundational studies have characterized sediment dynamics in diverse fishway types—from rock-ramp structures to Denil passes—a critical knowledge gap persists regarding vertical slot fishways. In addition, sedimentation also occurs in vertical slot fishways in practical applications (Figure 1). Existing studies have not been able to fully address its characteristics, causes and the extent of its impact on fish. This void directly impedes solutions for documented failures in high-sediment rivers, exemplified by the abandonment of China’s Yangtang Fishway [26] and functional collapse of Taiwan’s fishways [25]. Our research addresses this gap through physical and numerical modeling of sedimentation in vertical slot fishways, complemented by migration experiments that elucidate sand-water-fish interactions. These findings inform optimized designs to enhance fish passage efficacy.
The paper proceeds as follows: Section 2 details experimental and numerical methodologies; Section 3 presents carp migration patterns, hydraulic shifts, energy expenditure, and regression analyses; Section 4 discusses hydraulic-behavioral linkages and statistical outcomes; Key conclusions are synthesized in Section 5.

2. Materials and Methods

2.1. Experimental Setup

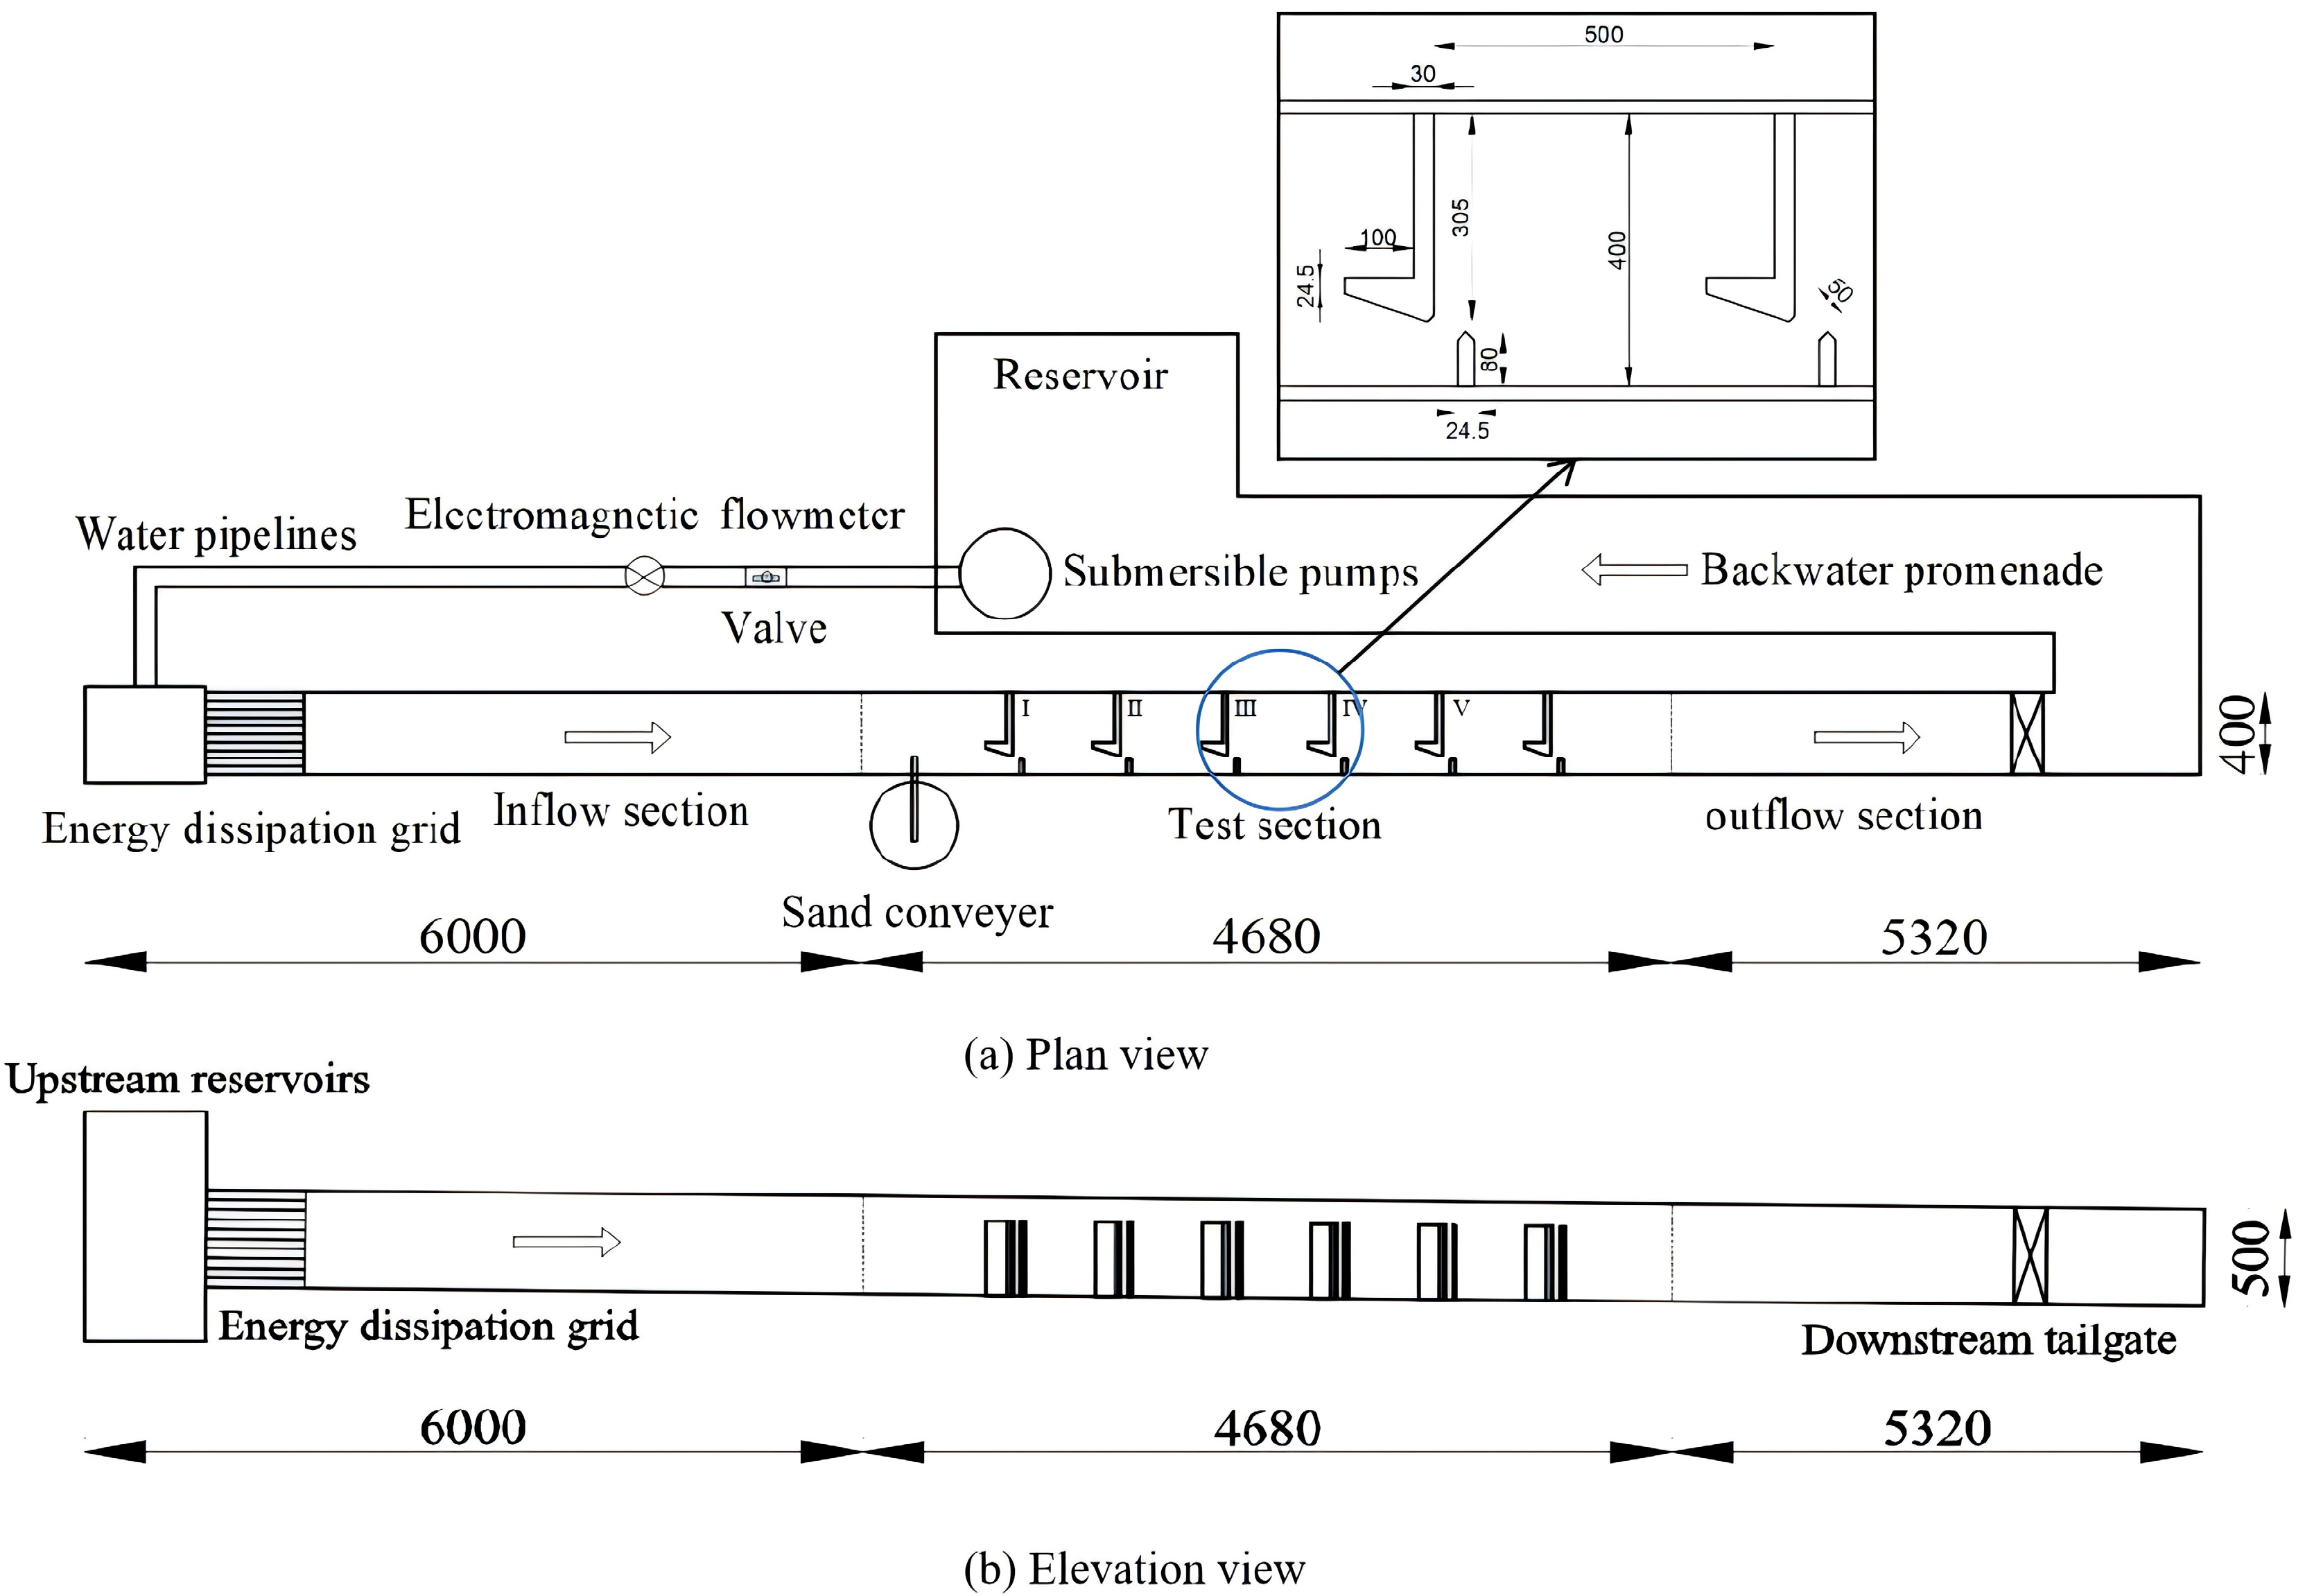
The experimental setup followed gravitational similarity criteria at a 1:6 geometric scale. A purpose-built flume was constructed for this study, incorporating a circulation pump, electromagnetic flowmeter, glass-walled channel, forebay structure, and reservoir (Figure 2). The flume dimensions measured 16.0 m (length) × 0.4 m (width) × 0.5 m (depth) with a 1% longitudinal slope, based on a vertical slot fishway from practical applications.
A controlled flow rate of 14.7 m3/h was maintained through the 6.0 m inflow section. An energy-dissipation grid was installed upstream to stabilize flow, while electromagnetic flowmeters and control valves enabled real-time flow monitoring along the pipeline. The 4.68 m test section contained five sequentially arranged fishway pools (designated I to V), each measuring 0.5 m in length and 0.4 m in width. All pools featured identical vertical slot widths of 0.05 m, yielding a pool length-to-width ratio of 5:4.
This study primarily adopted the Froude similarity criterion in model design to ensure dynamic similarity between gravity-dominated flow behavior and sediment transport processes. The model’s flow state was maintained within the fully developed turbulent zone to satisfy resistance similarity conditions. As the experiment focused on sediment deposition, the key step involved selecting appropriate model sand to achieve sediment settling similarity. This approach reduced scale distortion in sediment transport simulations, thereby enhancing the correlation between the model and prototype while improving the engineering applicability of experimental results.
Two operational conditions were analyzed: a sediment-free condition and a maximum sediment deposition condition. The topography data for the maximum sediment deposition condition were obtained using the USL-100 underwater laser 3D scanner.
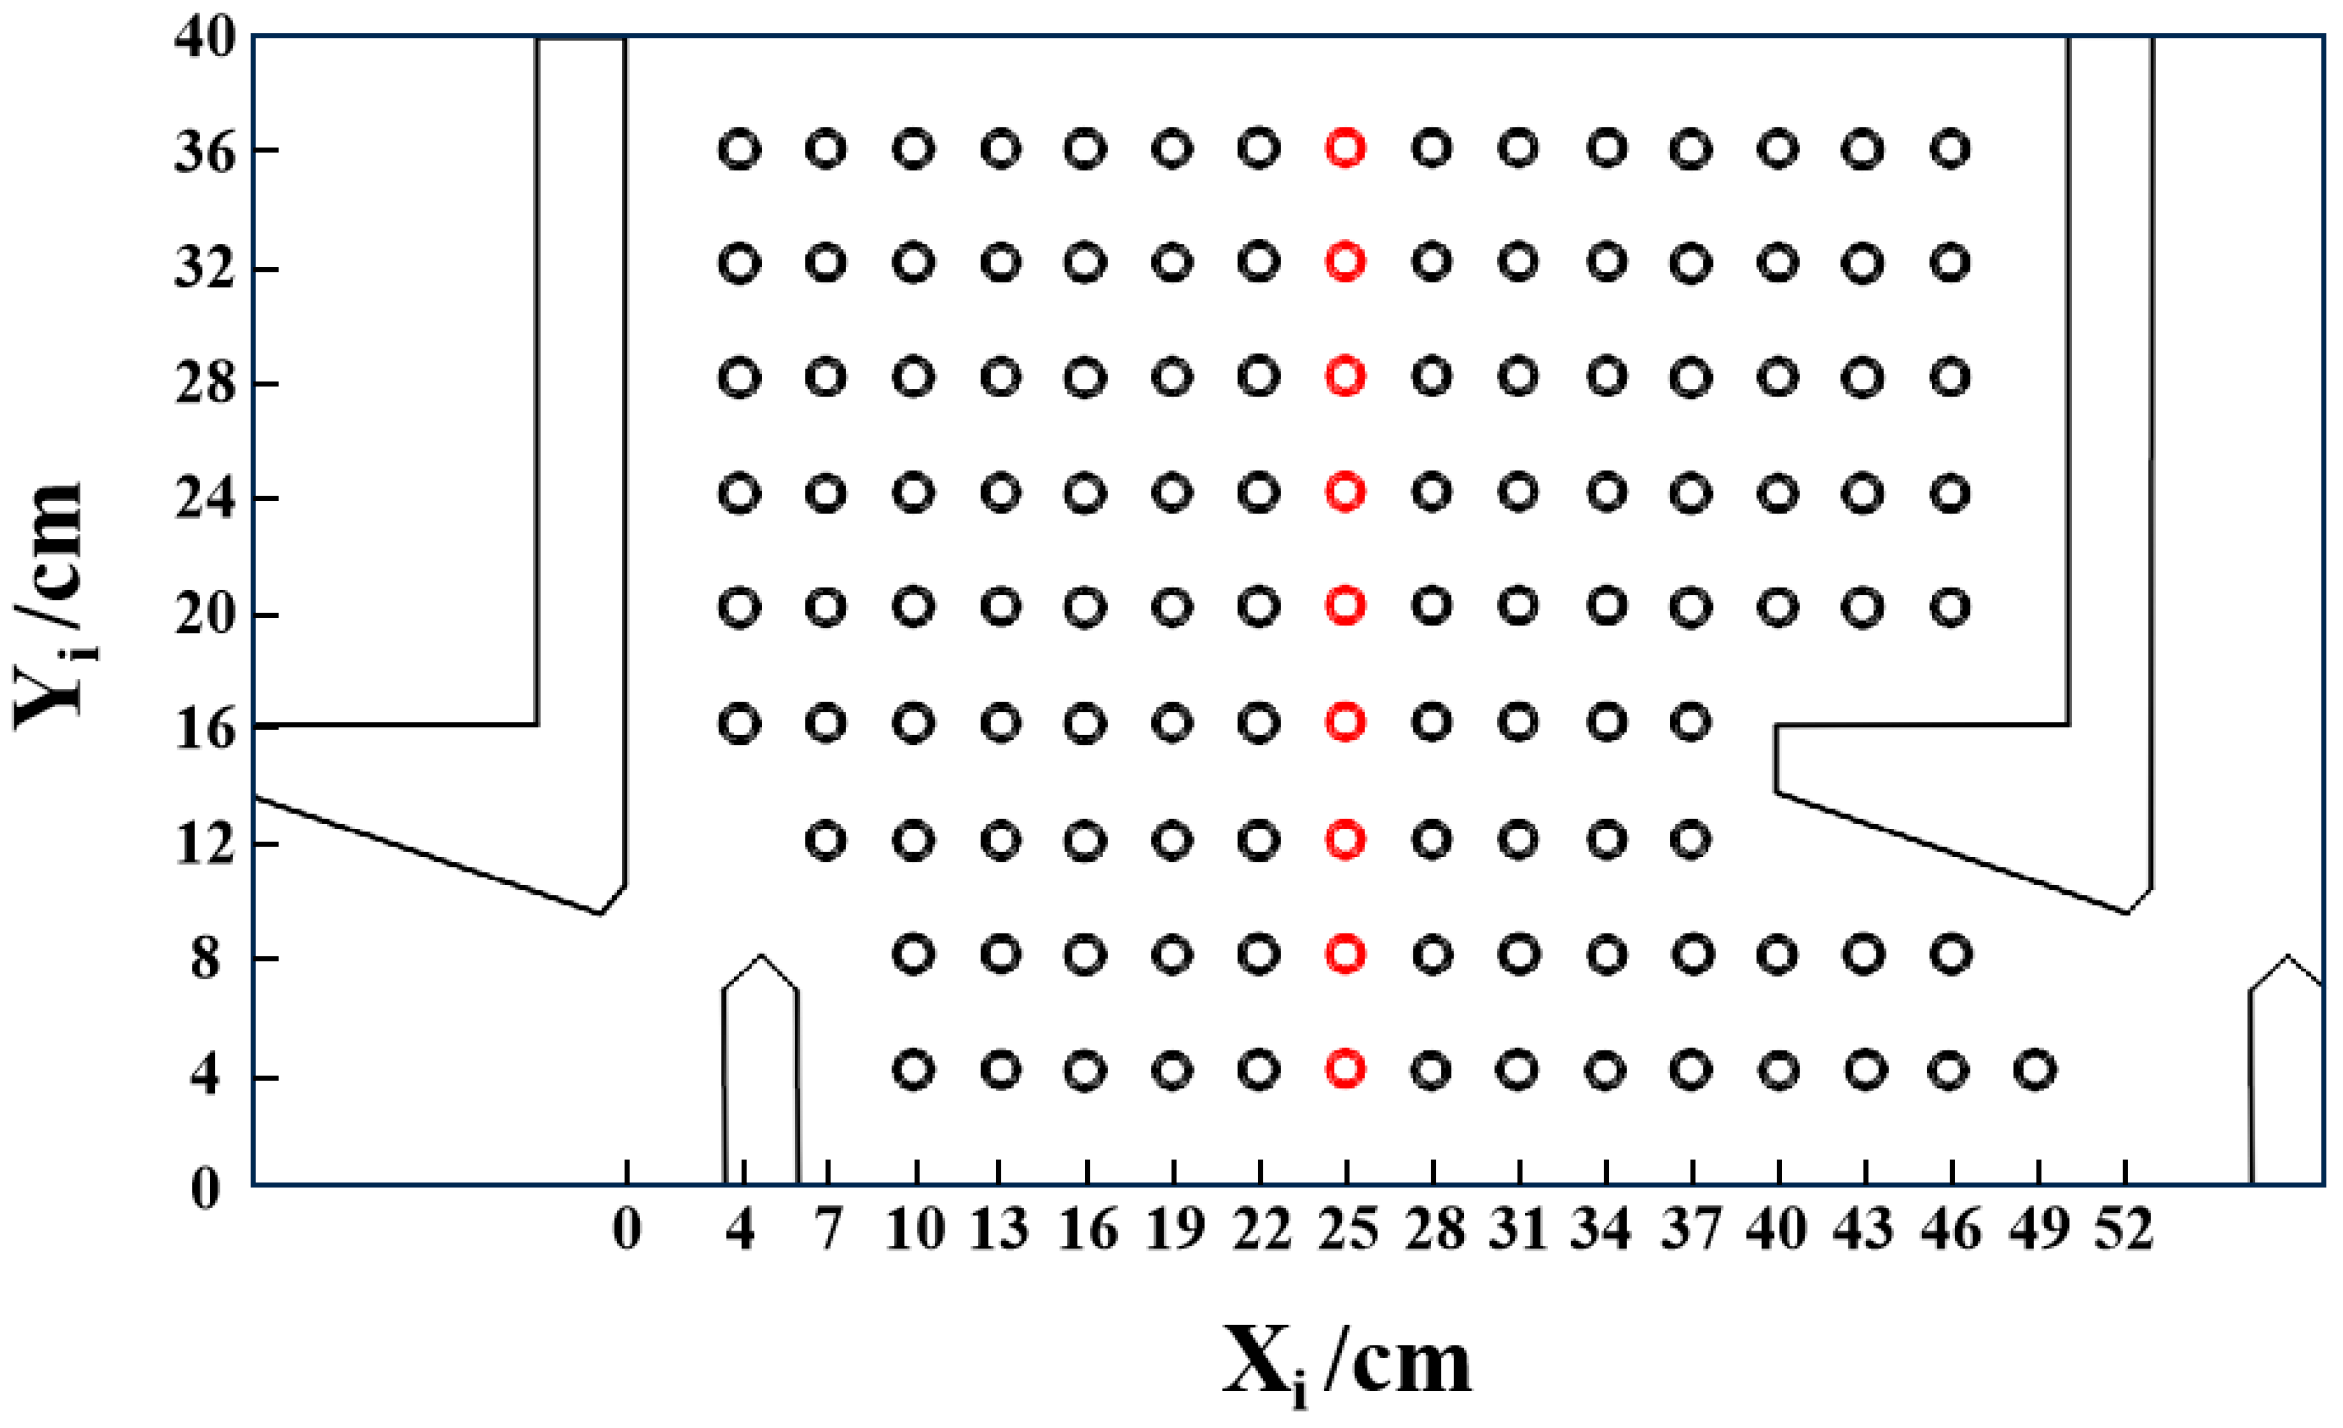
To minimize inflow and outflow interference in Pool III (central fishway position), velocity distributions at z = 12.5 cm depth were mapped using ADV. A Cartesian coordinate system was adopted with the X-axis parallel to flow direction, Y-axis vertical in the horizontal plane, and Z-axis vertical. Measurement points were established at 3.0 cm intervals along the X-axis (extending from 4.0 cm downstream of Pool III’s upstream baffle face) and at 4.0 cm intervals along the Y-axis (commencing 4.0 cm from sidewalls). The velocity point grid configuration is detailed in Figure 3.

2.2. Sediment Deposition Experiment

To characterize sediment deposition patterns in a vertical slot fishway and establish test conditions for carp migration experiments, initial sedimentation trials were conducted. Sediment sourced from the Yellow River’s riverbed (median particle size D50 = 0.172 mm) was introduced through a conveyance system comprising sand feeders, mixing apparatus, and pumps. First, the sediment output of the sand-feeding machine was calibrated. Before the experiment began, 1 kg of dry sediment and 60 L of clean water were added to the mixing tank to prepare the initial sediment concentration. During the experiment, the sediment feeding rate was controlled by adjusting the motor settings, while the water level in the mixing tank was maintained constant. The experiment lasted for 1 h, with water samples collected every 10 min using a siphon. These samples were then oven-dried and weighed. Based on the obtained data, sediment concentrations were calculated for the outlet of the sediment delivery pipe and the first slot of the fishway, with the measured inflow concentration of 2.61 g/L at the pipe decreasing to 0.36 g/L at the vertical slots due to settling.
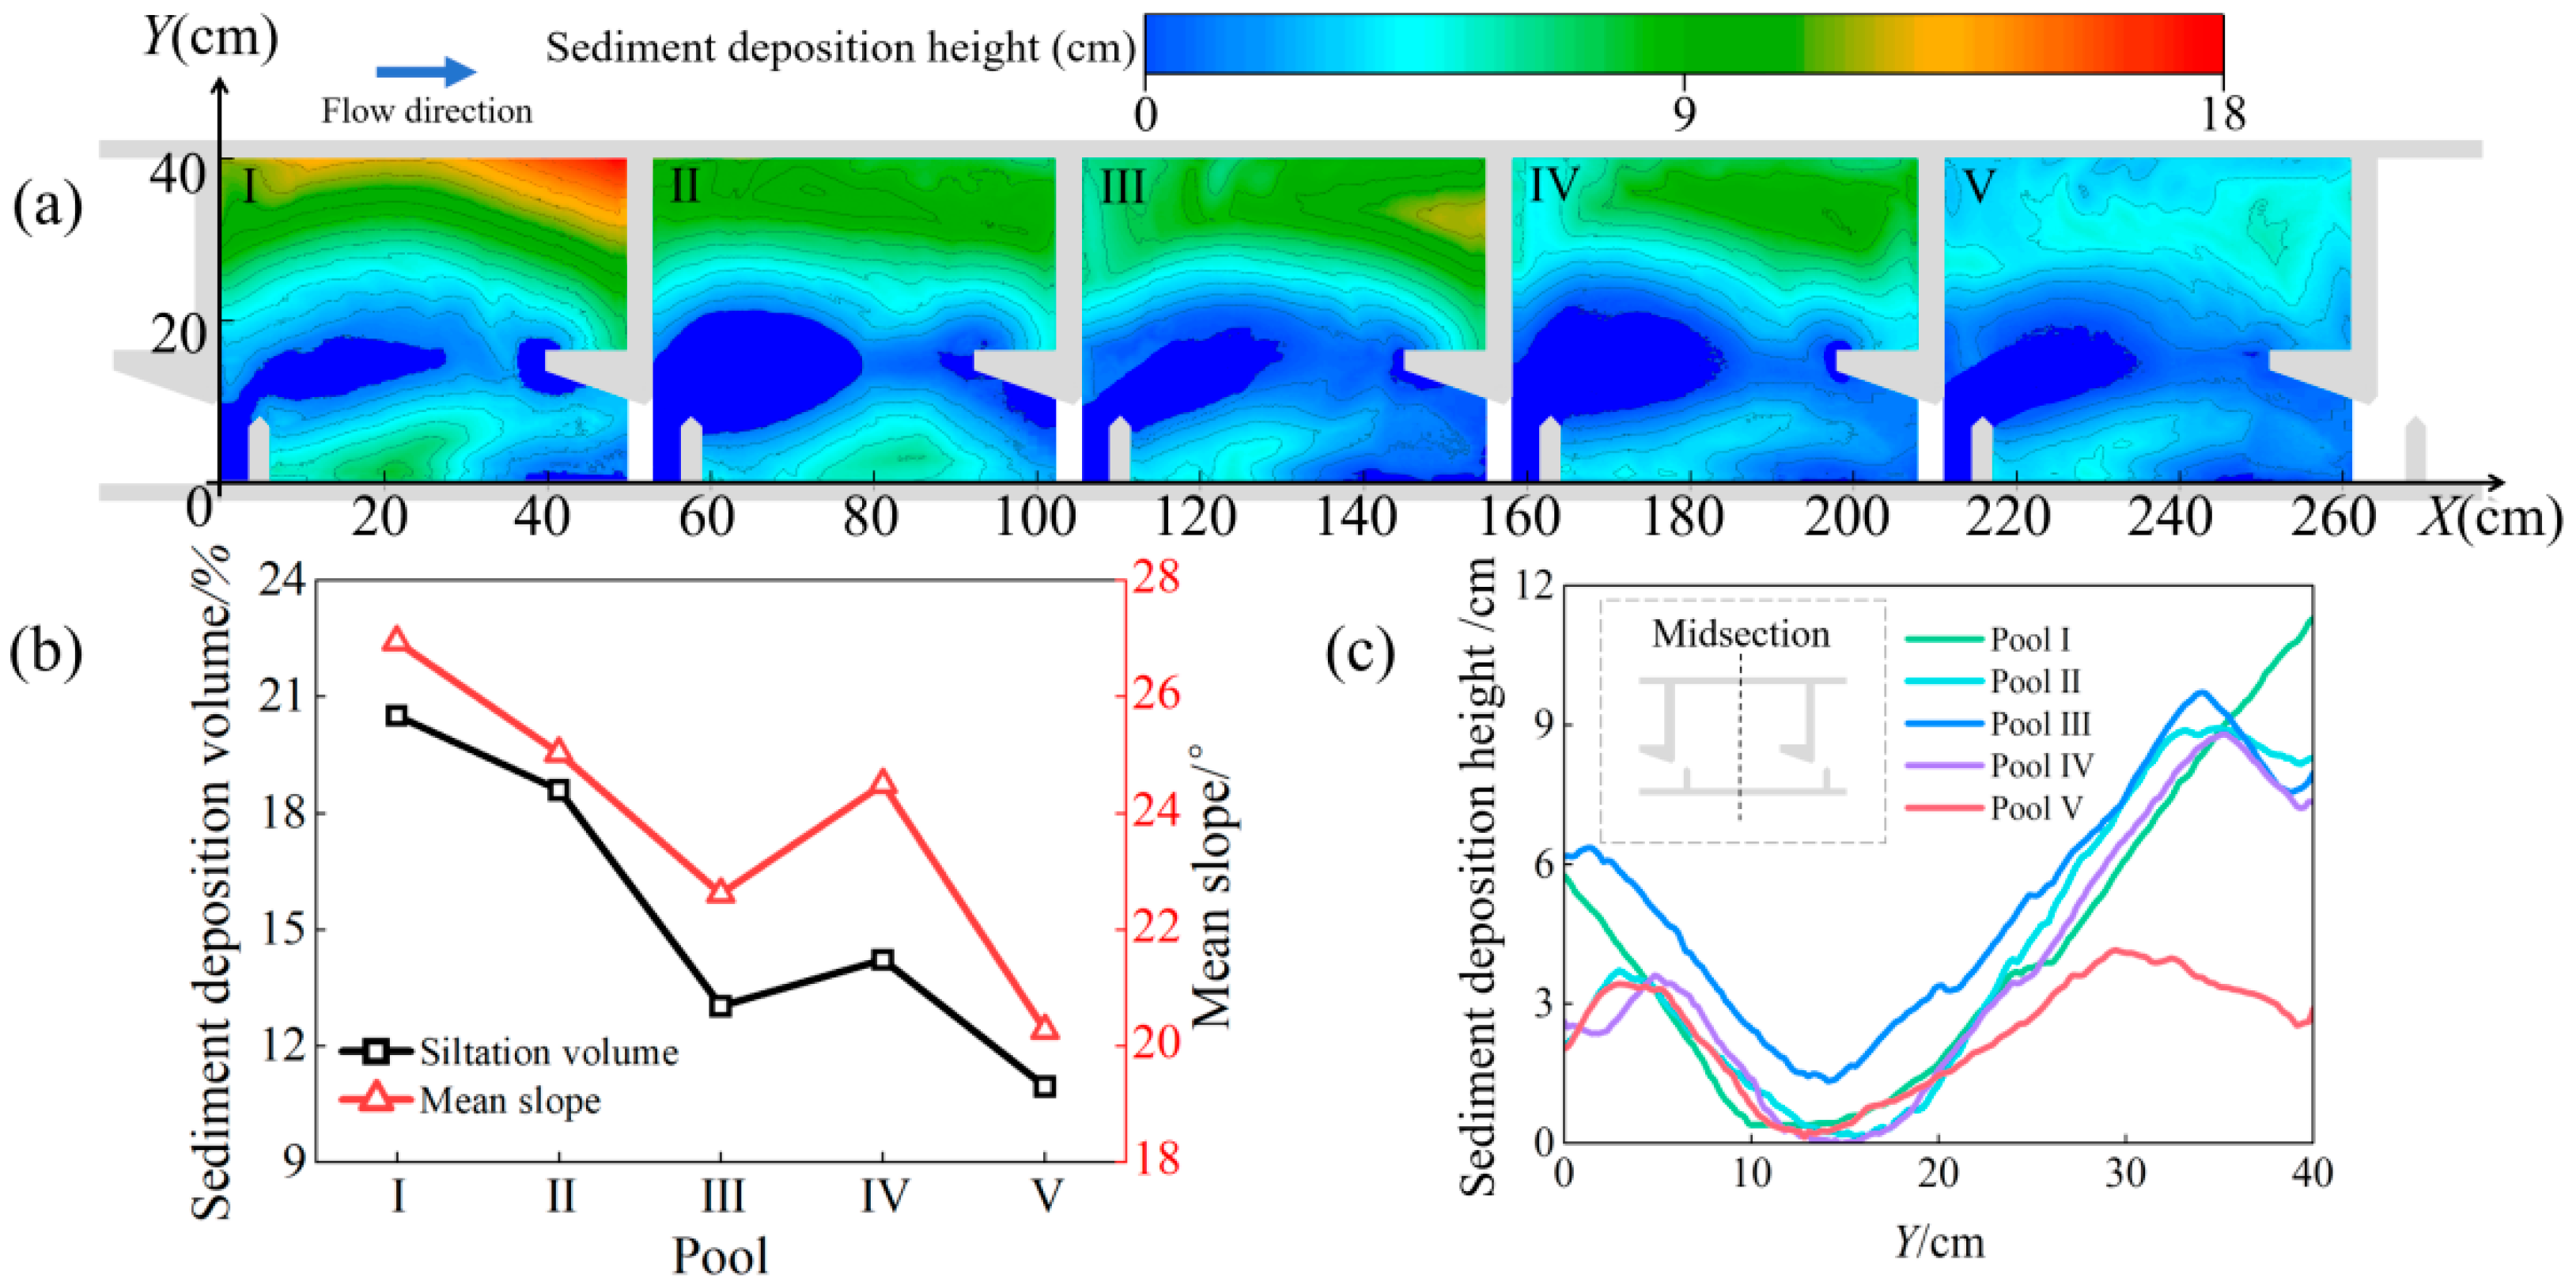
In the preliminary experiments, we measured the sediment deposition patterns over different durations. We found that when the accumulation duration reached 7.5 h, the sediment deposit had fully developed, its morphology stabilized, and it reached our preset, representative ‘maximum accumulation level’. Figure 4 illustrates sedimentation topography in fishway pools after 7.5 h of sediment deposition. To quantitatively evaluate deposition severity, three metrics were employed: mean slope, sediment deposition volume (calculated as the ratio of deposited sediment volume to total in-pool water volume at a steady-state water depth of 25.0 cm), and sediment deposition height. For enhanced structural characterization, sediment height variations were extracted along the Y-axis of each pool level.
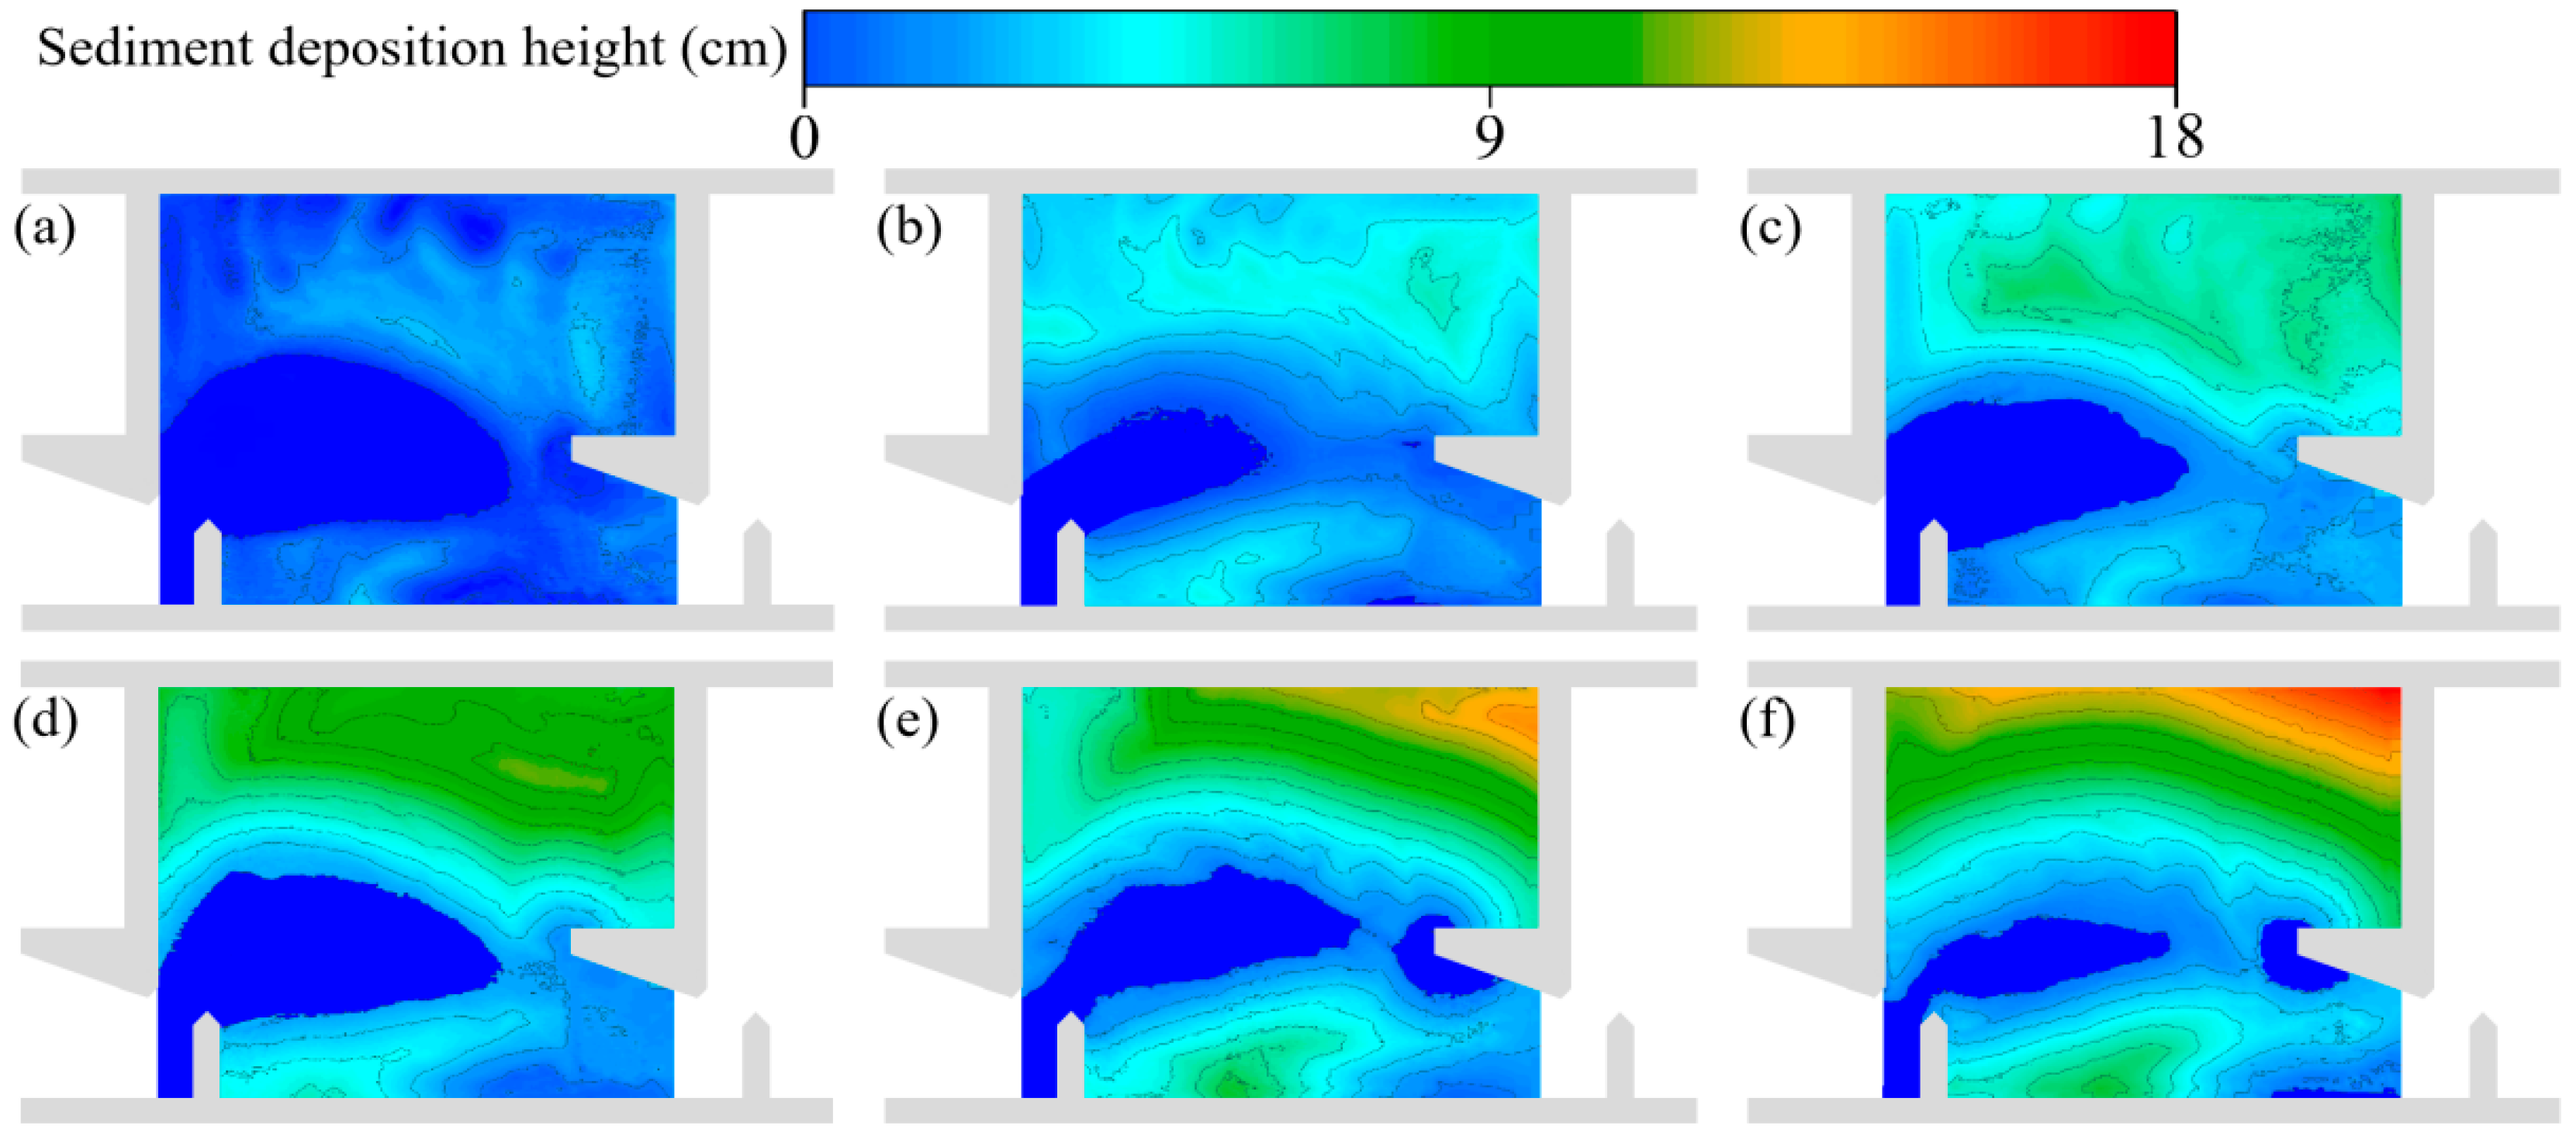
Through sediment deposition experiments, we obtained sedimented terrains with different deposition depths (maximum values) and selected six representative deposition states (Figure 5). Based on this, we present the characteristics under different sediment deposition conditions in Table 1. For migration trials, representative conditions were solidified to maintain identical sediment topography across all five pools. At the same time, in these simulations, in order to compare the sedimentation effects, the flow and average water depth in all scenarios are kept unchanged.

2.3. Fish Migration Experiment

Carp rank among the most widely distributed freshwater fish species globally, exhibiting notable environmental adaptability and physiological tolerance. Their selection as the experimental subject thus ensured experimental representativeness, data comparability, and procedural practicality. The first approach applied direct geometric scaling from the physical fishway model. Given that carp in natural rivers reach sexual maturity at an average length of 0.5 m [34], the target test length was calculated as 0.08 m based on the geometric scale. Alternatively, the second approach extrapolated test conditions using the prototype fishway’s maximum design discharge and empirical relationships [35], as shown in Equation (1).
V s = k L f
where Vs is the fish burst speed (m/s). v is the water speed (m/s). The dimensioned proportionality coefficient k (m1/2/s) has a value of 1.6 [11]. Lf is the fish body length (m).
Experimental carp swimming speeds exceeded the fishway’s maximum design discharge. The empirical formula indicated a minimum required body length of >0.06 m. Since both methods for determining fish length were compared, the larger criterion (geometric scaling result) was adopted. Consequently, juvenile carp with body lengths of 0.09 ± 0.01 m were selected. Specimens were sourced from a commercial fishery in Henan Province, China. Following physiological testing protocols, fish were acclimated for two weeks in a pond with biweekly 30% water changes. Dissolved oxygen levels were sustained >8 mg/L using supplementary oxygenation, while water temperature (22 ± 1 °C), oxygen concentration, and pH (7.6) were continuously monitored, meeting transient rearing standards.
One sediment-free control test and six sediment deposition treatments were conducted. Before each upstream migration trial, five randomly selected carp were introduced to the tailwater section for 20 min acclimation to flow conditions. Each configuration underwent ten experimental replicates. To prevent reuse bias, all fish were released into natural waterways post-trial. Based on Beamish [36], which established 20 min as the conservative threshold for sustained swimming performance, migration timing commenced immediately upon net removal. Successful passage was defined as movement from the downstream holding pool to the vertical slot within 20 min. Migration trajectories were recorded using four overhead and lateral cameras.
Furthermore, the energy expenditure distribution along carp migration trajectories within Pools II–IV was quantified using the methodology of Tan et al. [37]. This assessment compared energy consumption during upstream migration under two critical sediment conditions: non-deposited and maximally deposited beds, both at a controlled discharge of 14.7 m3/h and average water depth of 25 cm. The dominant hydrodynamic force acting on fish during upstream movement is flow resistance [38], expressed as:
f = 0.5 C d ρ A s u w u f 2
where C d is the resistance coefficient, composed of the friction coefficient C f and pressure coefficient C p . ρ is the water density, which is 103 kg/m3. A s is the wetted surface area of the fish, given by A s = α L f β where α and β are empirical coefficients (α = 0.465, β = 2.11), and L f is the fish length (with the average length of the experimental carp taken to be 0.09 m). u w is the flow velocity. u f is the swimming speed of the experimental fish, which can be calculated based on the average upstream migration time and the length of the upstream migration path.
According to Pettersson L B. and Brönmark C. [39], C d is calculated as:
C d = C f + C p 1.2 C f
C f = 0.074 Re f 0.2
where Re f is the Fish Reynolds number and can be expressed as:
Re f = ρ u f L f / μ
where μ is the dynamic viscosity of water. This experiment employs the Froude similarity criterion. Since gravity is the dominant force in the flow and sediment transport processes within the fishway, the Froude number is the key dimensionless parameter controlling flow similarity. Although the Reynolds number is also present in the model, its primary role is to assess the flow regime and ensure that both the model and the prototype satisfy the condition of fully developed turbulence, thereby guaranteeing resistance similarity. For the core physical processes investigated in this study, the Froude similarity criterion serves as the primary basis.
The upstream migration energy dissipation E of the fish body can be expressed as follows:
E = f u f

2.4. Numerical Model

The upstream migration energy dissipation E of the fish body can be expressed as follows: To characterize flow alterations induced by sediment deposition in a vertical slot fishway, subaquatic laser scanning captured high-resolution three-dimensional bed topography data. Hydrodynamic simulations were subsequently performed for both pre-sedimentation and post-sedimentation conditions. This experiment was conducted using Flow-3D v11.2 software. The computational framework solved the three-dimensional RANS equations discretized via finite difference methods, simulating the hydrodynamics of a standard VSF configuration. This analysis adopted the common assumption that fish movement negligibly perturbs the flow field. The governing equations are expressed as [40]:
Continuity equation:
ρ t + ( ρ u i ) x i = 0
Momentum equation:
( ρ u i ) t + ρ u i u j x j = P x i ρ g + x j μ + μ t u i x j + u j x i
where t is the time (s). ρ is the fluid density (kg/m3). u i and u j are the velocity components in each direction (m/s), i represents the x, y, z directions. P is the pressure (Pa). μ is the molecular viscosity coefficient (N·s/m2). μ t is the vortex viscosity coefficient.
The Renormalization Group (RNG) k-ε turbulence model was chosen because of its enhanced accuracy [41]. The equations of this model are as follows [40]:
The k-equation:
ρ k t + ρ u i k x i = x i μ + μ t σ k k x i + G k ρ ε μ t = ρ C μ k 2 ε G k = μ t u i x j + u j x i u i x j
The ε-equation:
ρ ε t + ρ u i ε x i = C ε 1 ε k G k C ε 2 ρ ε 2 k + x i μ + μ t σ ε ε x i
where k is the turbulence kinetic energy (m2/s2). C μ = 0.0845 . ε is the turbulent kinetic energy dissipation rate. σ k = σ ε = 1.39 . G k represents the turbulent kinetic energy generation term due to the mean velocity gradient, expressed as G k = u t ( u i x j + u j x i ) u i x j . C ε 1 and C ε 2 are empirical constants with C ε 1 = 1.42 and C ε 2 = 1.68 .
The optimized TruVOF method was employed to accurately track the free surface, thereby reducing the result file space and shortening the model convergence time, which is governed by the following equations:
a w t + u i a w x i = 0
where a w represents the volume fraction of water phase. When a w = 0 , the computational domain is completely filled with air phase. When a w = 1 , the computational domain is entirely filled with water. When 0 < a w < 1 , the computational domain contains both air and water.
The numerical model incorporated five continuous vertical slot fishway pools with 1.0 m upstream and downstream regions. Structured hexahedral grids exhibiting good convergence were employed. Pressure inlet and outlet boundaries were assigned to the fishway’s entrance and exit, respectively. The inlet and outlet water depths were defined as 0.30 m and 0.28 m, respectively. The model top was designated as a pressure boundary with a relative pressure of 0 Pa and a water volume fraction of 0. Both the sidewalls and bottom were implemented as no-slip boundaries. The initial water depth was set to 1.0 m to accelerate convergence. Model computations utilized the GMRES implicit solver with 0.001 s and 10−7 s initial and minimum time steps, respectively.
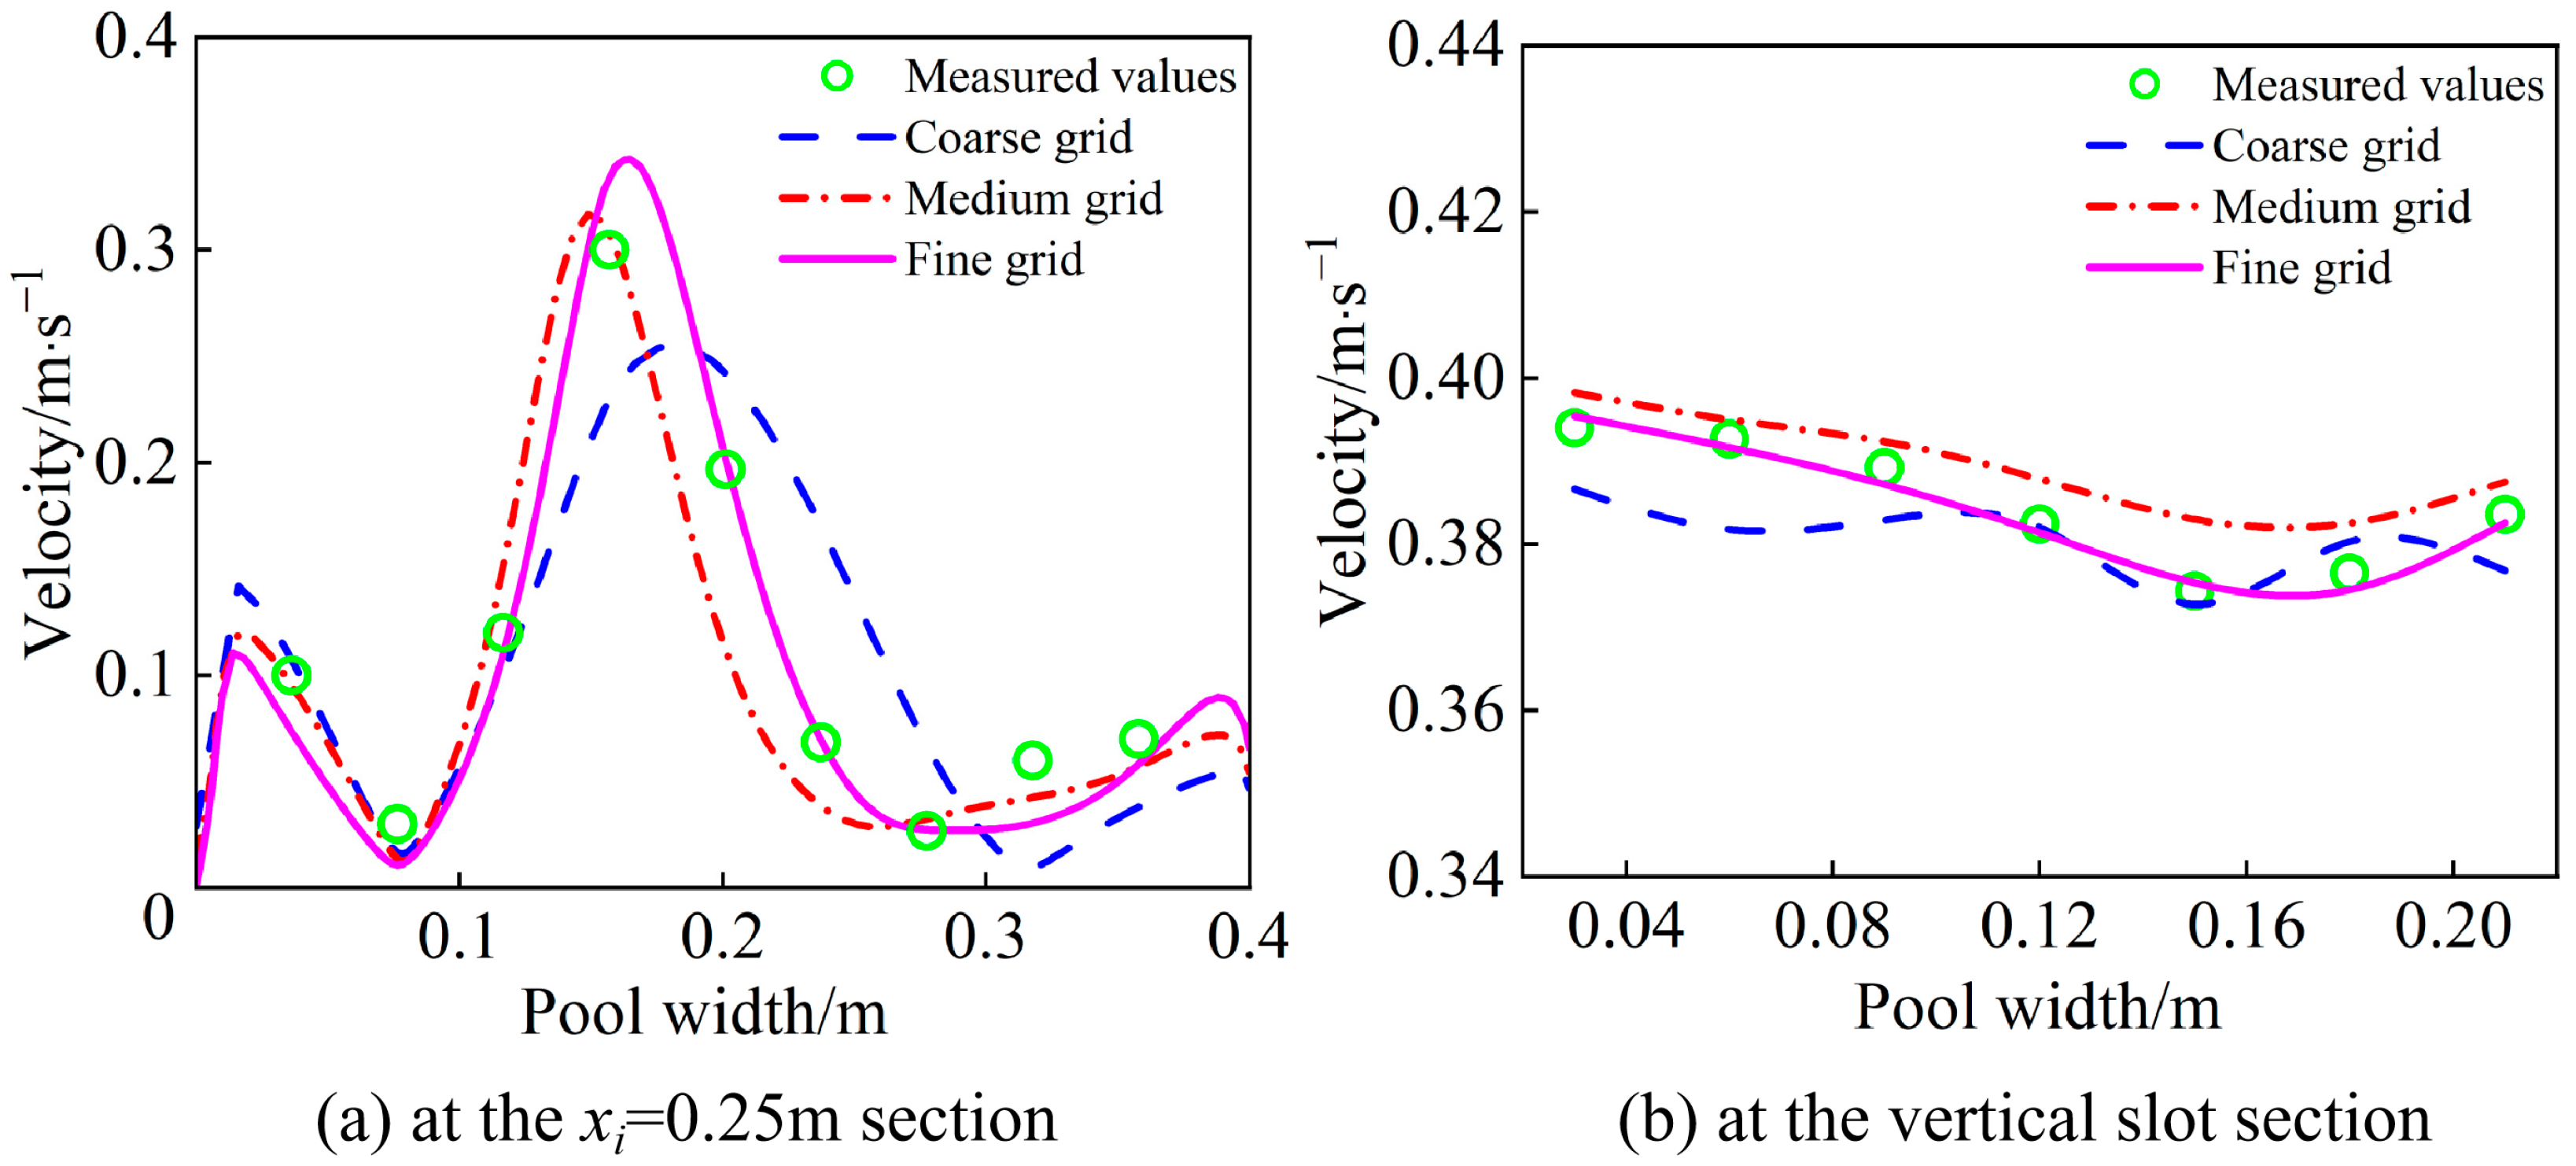
Coarse, medium, and fine grids were employed to verify computational grid independence without sediment deposition. Table 2 details their sizes and total cell counts, with consistent dimensions applied in all directions (x, y, z). The xi = 0.25 section line of Pool III was selected for comparative flow velocity verification (Figure 6). Results indicated nearly identical velocity distributions across grid resolutions. However, the coarse grid yielded lower accuracy, whereas the fine grid simulations more closely matched the measured data. Therefore, a fine grid resolution of 0.47 cm was adopted for numerical simulations.

3. Results

3.1. Carp Migration Situation

3.1.1. Upstream Migration Ratio and Duration

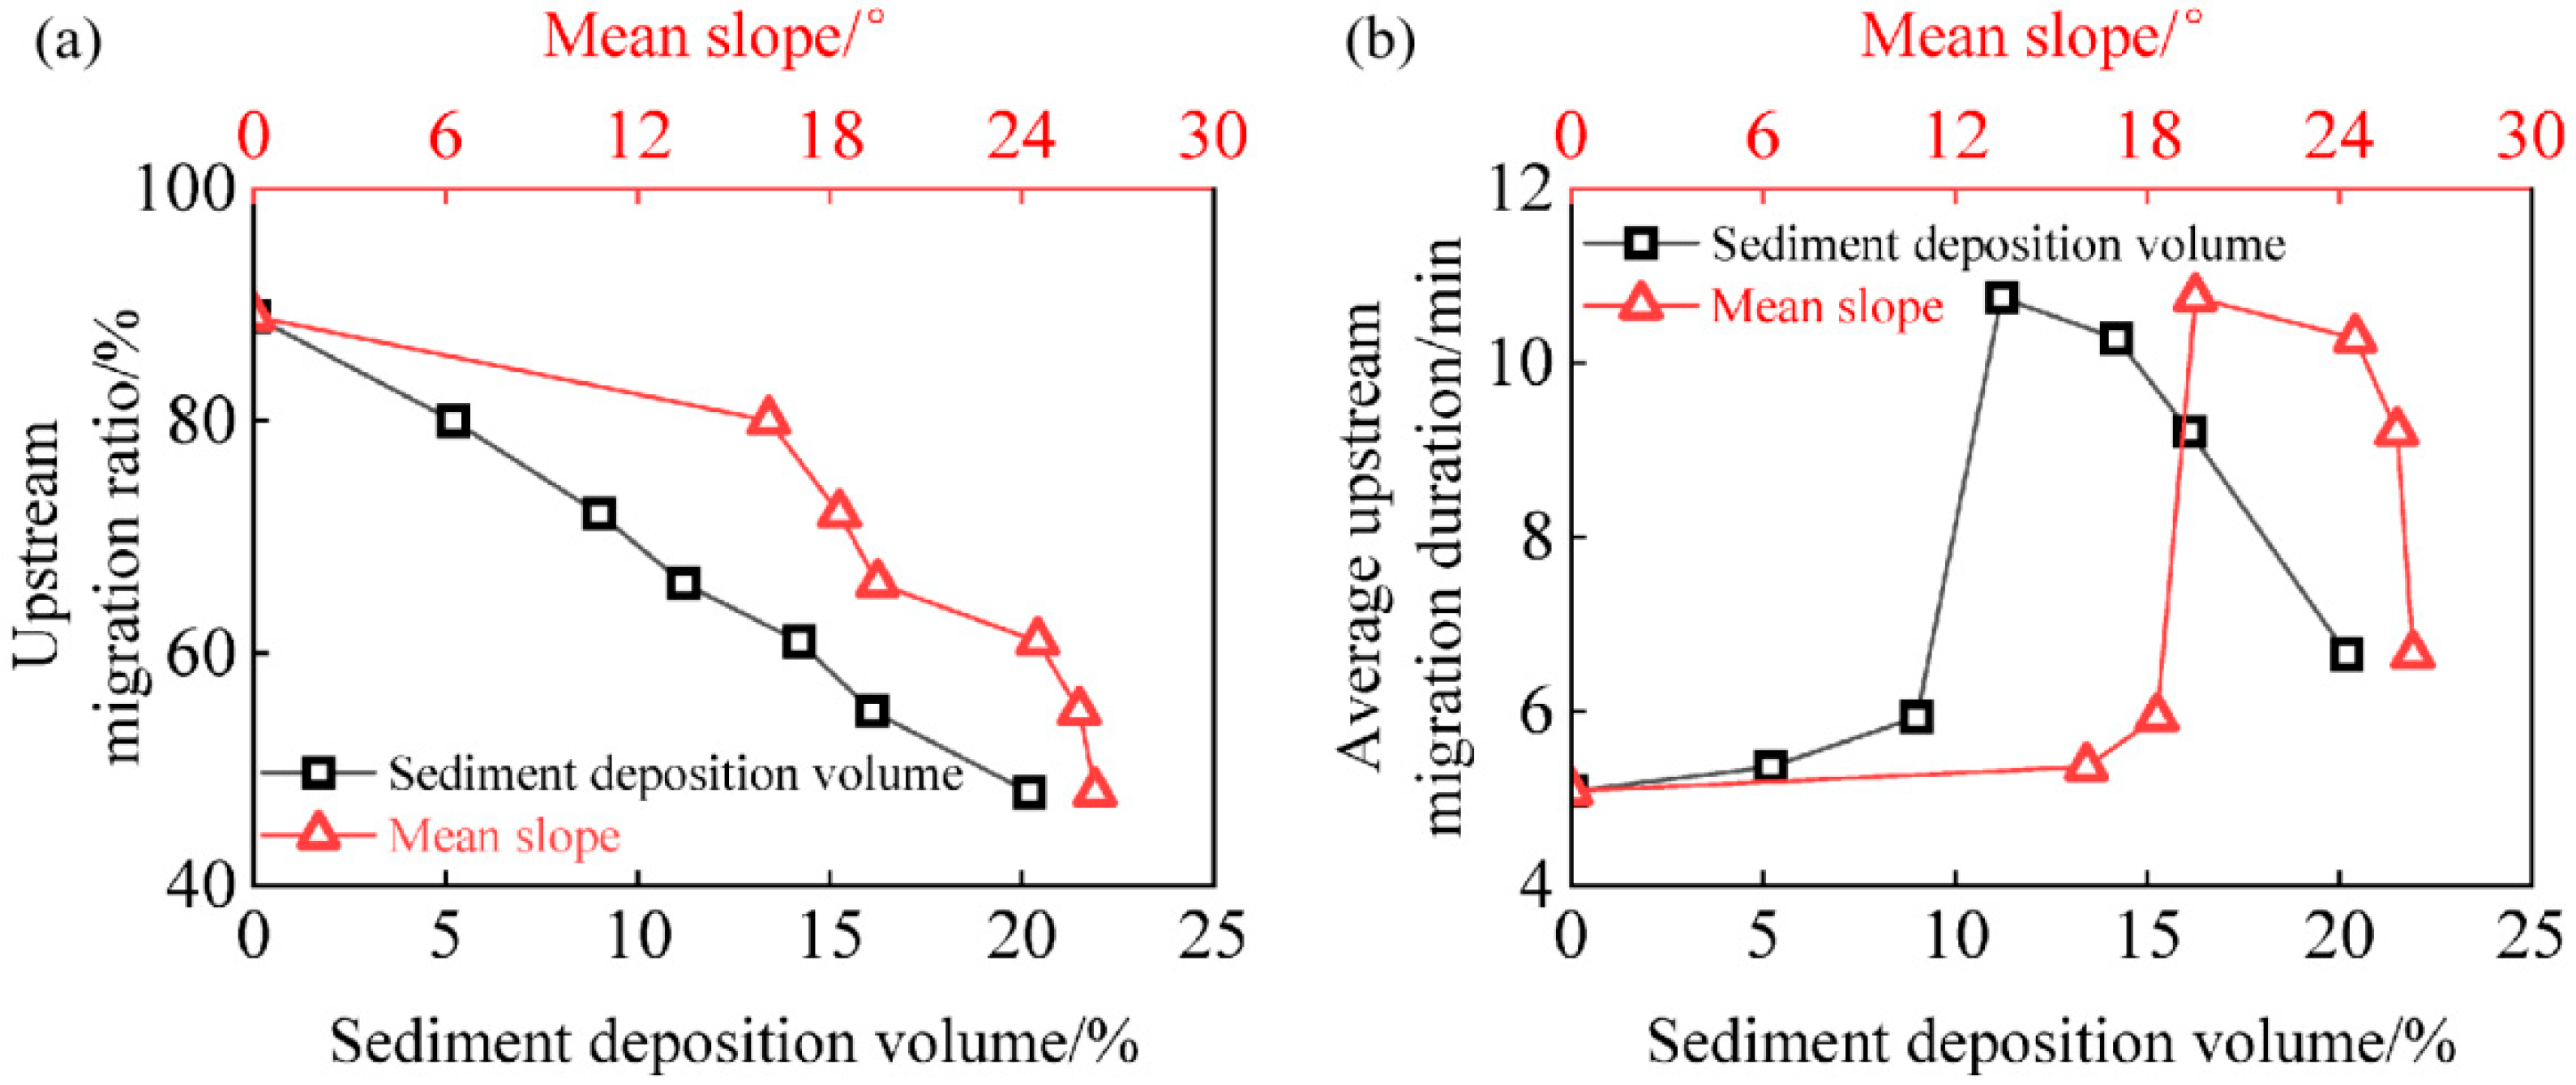
The upstream migration ratio represented the proportion of carp successfully migrating upstream relative to the total tested population. The average upstream migration duration was defined as the mean transit time for carp to pass through Pools I–V. Both metrics varied with changes in sediment deposition volume and mean slope (Figure 7).
The upstream migration ratio of carp exhibited a consistent inverse relationship with increasing sediment deposition and mean slope. Specifically, without sediment deposition, this ratio reached 89%. However, at 20.2% sediment deposition volume and 26.3° mean slope, the ratio declined to 48%. Conversely, average migration duration through Pools I–V demonstrated a unimodal trend, peaking at 10.75 min with a minimum of 5 min. The maximum duration occurred at 11.2% sediment deposition volume. Notably, when deposition exceeded this threshold, duration remained significantly elevated relative to sediment-free conditions but trended downward. This phenomenon may arise from deposition-induced flow velocity attenuation within pools, which reduces fish movement resistance in local low-velocity zones and consequently shortens passage time.

3.1.2. Migratory Characteristics in the Horizontal Direction

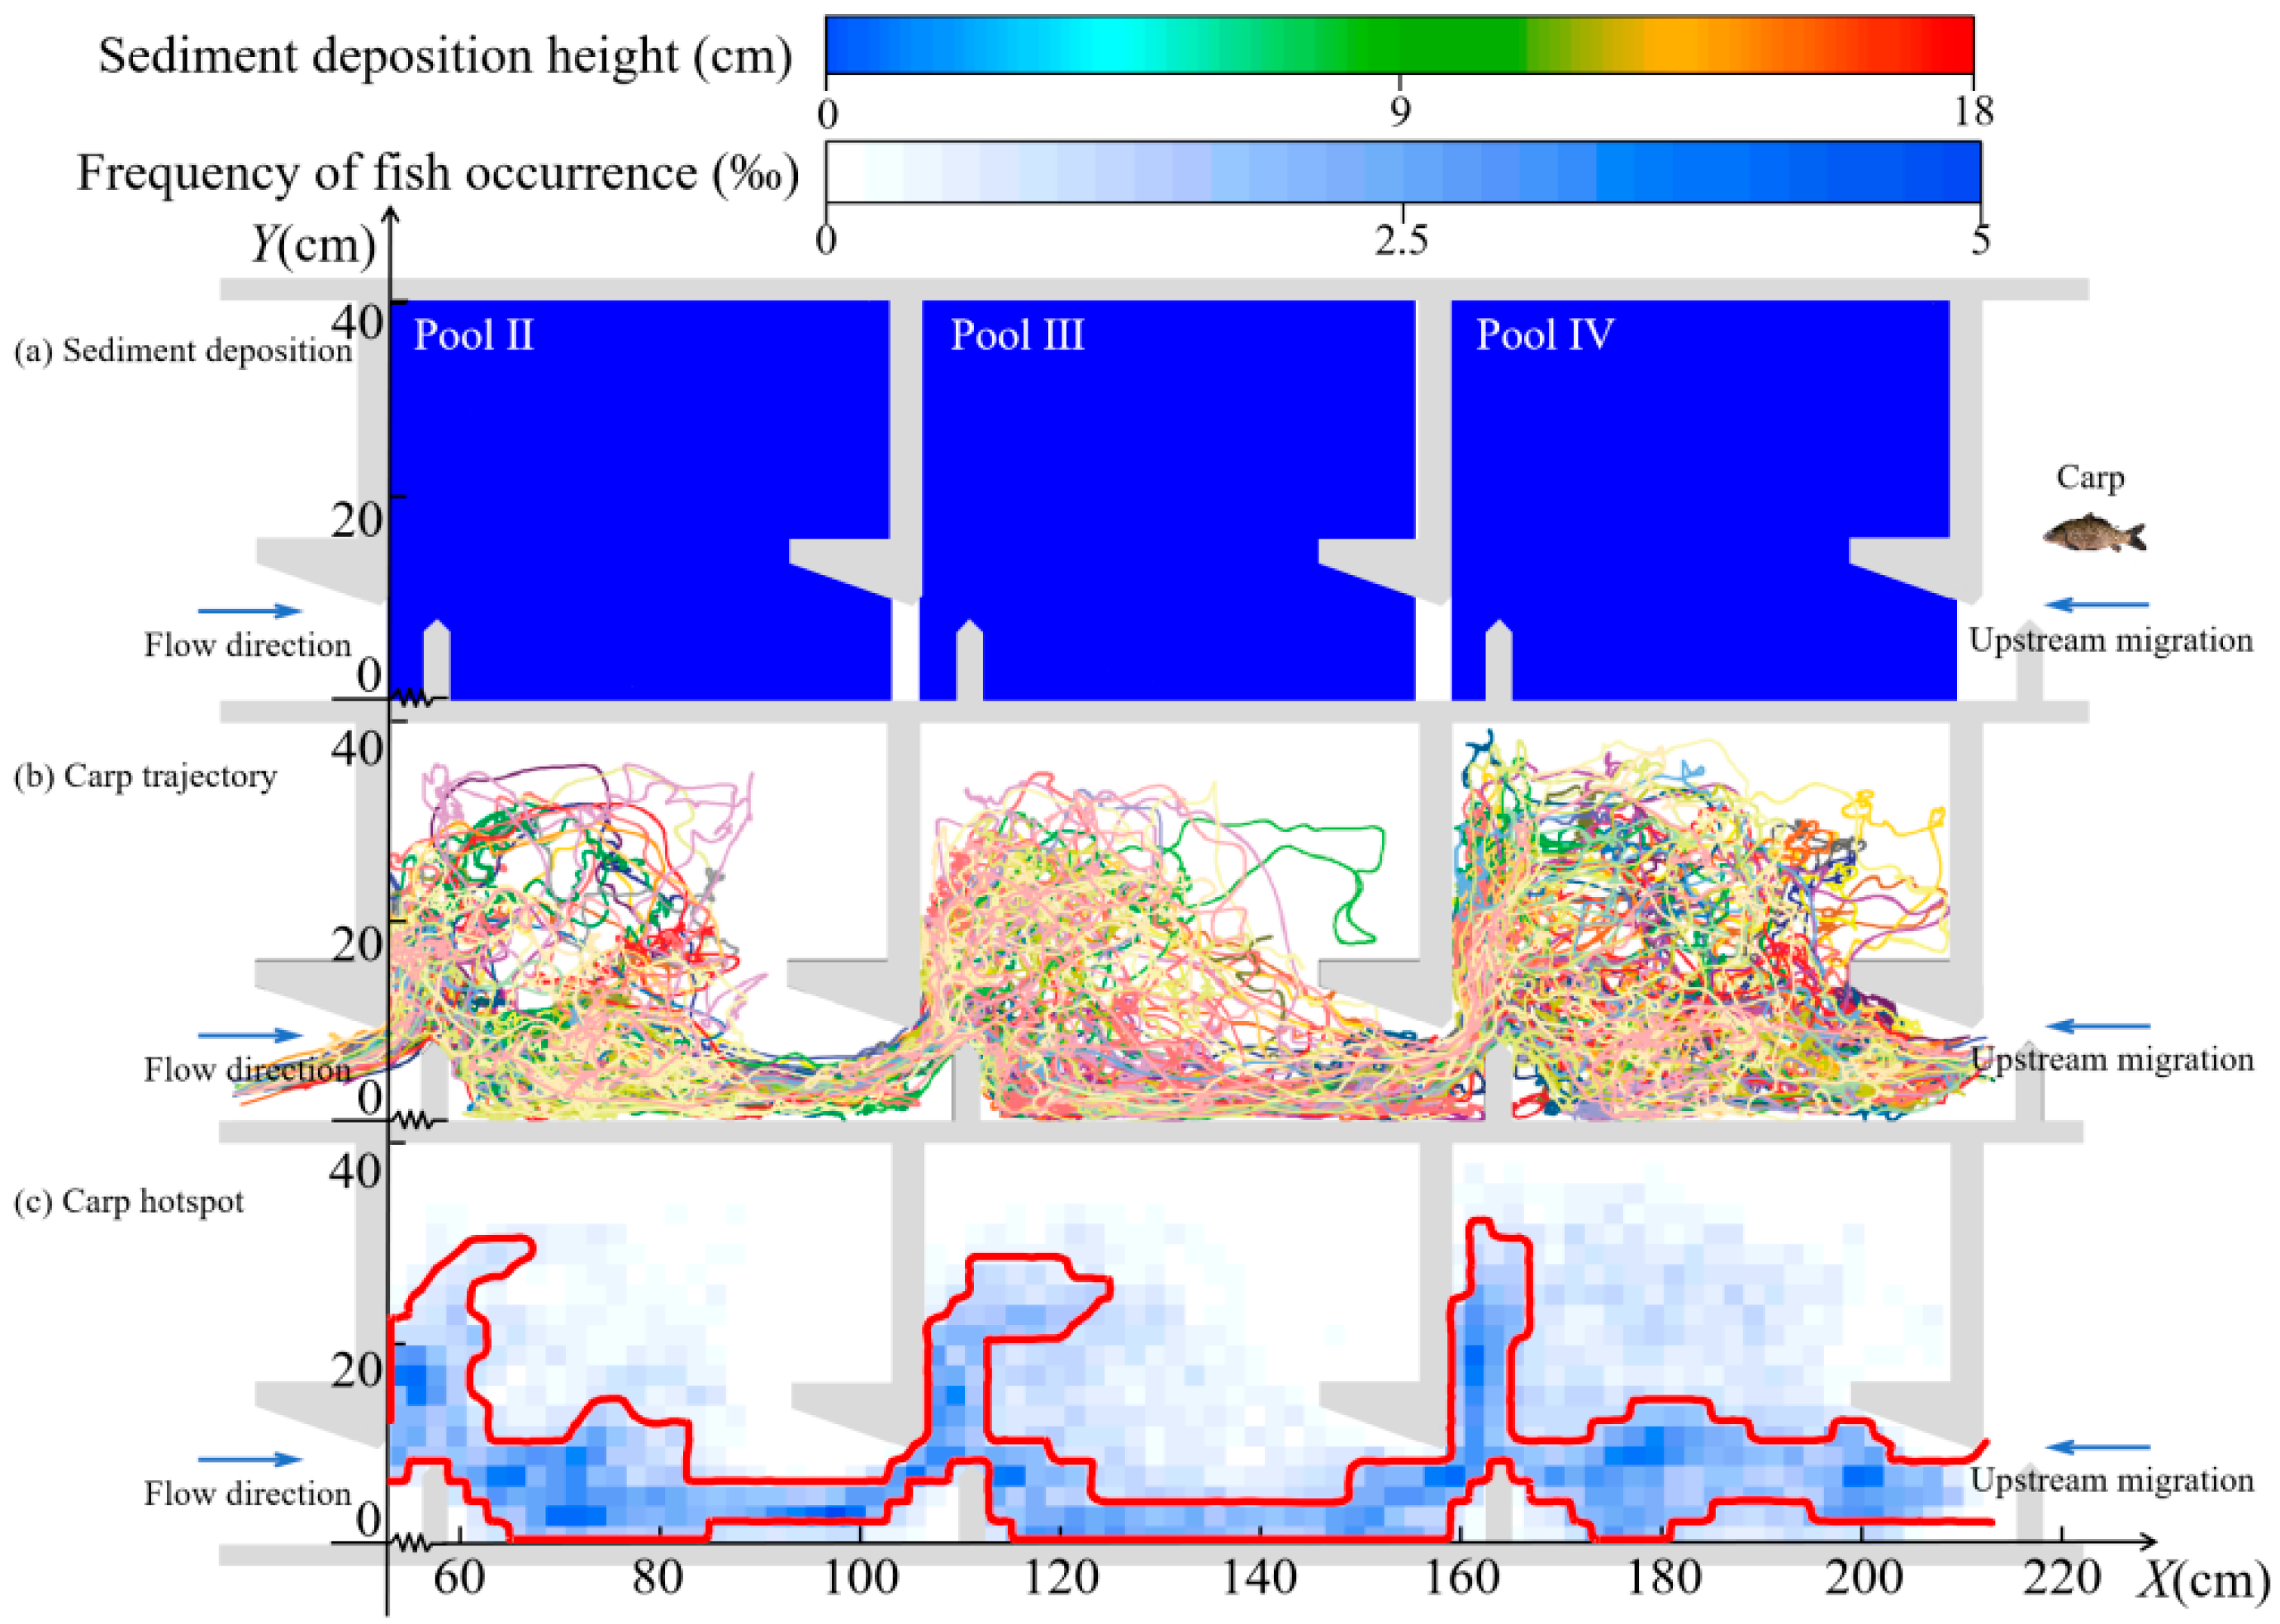
To analyze carp migration characteristics in Pools II, III, and IV, two boundary conditions, sediment-free and maximum deposition, were investigated. As flow-sensing specialists equipped with lateral lines, inner ears, and neuromasts [42], carp routinely avoid high-turbulence and high-velocity zones to conserve energy, preferentially selecting minimal-effort migration paths (Figure 8).
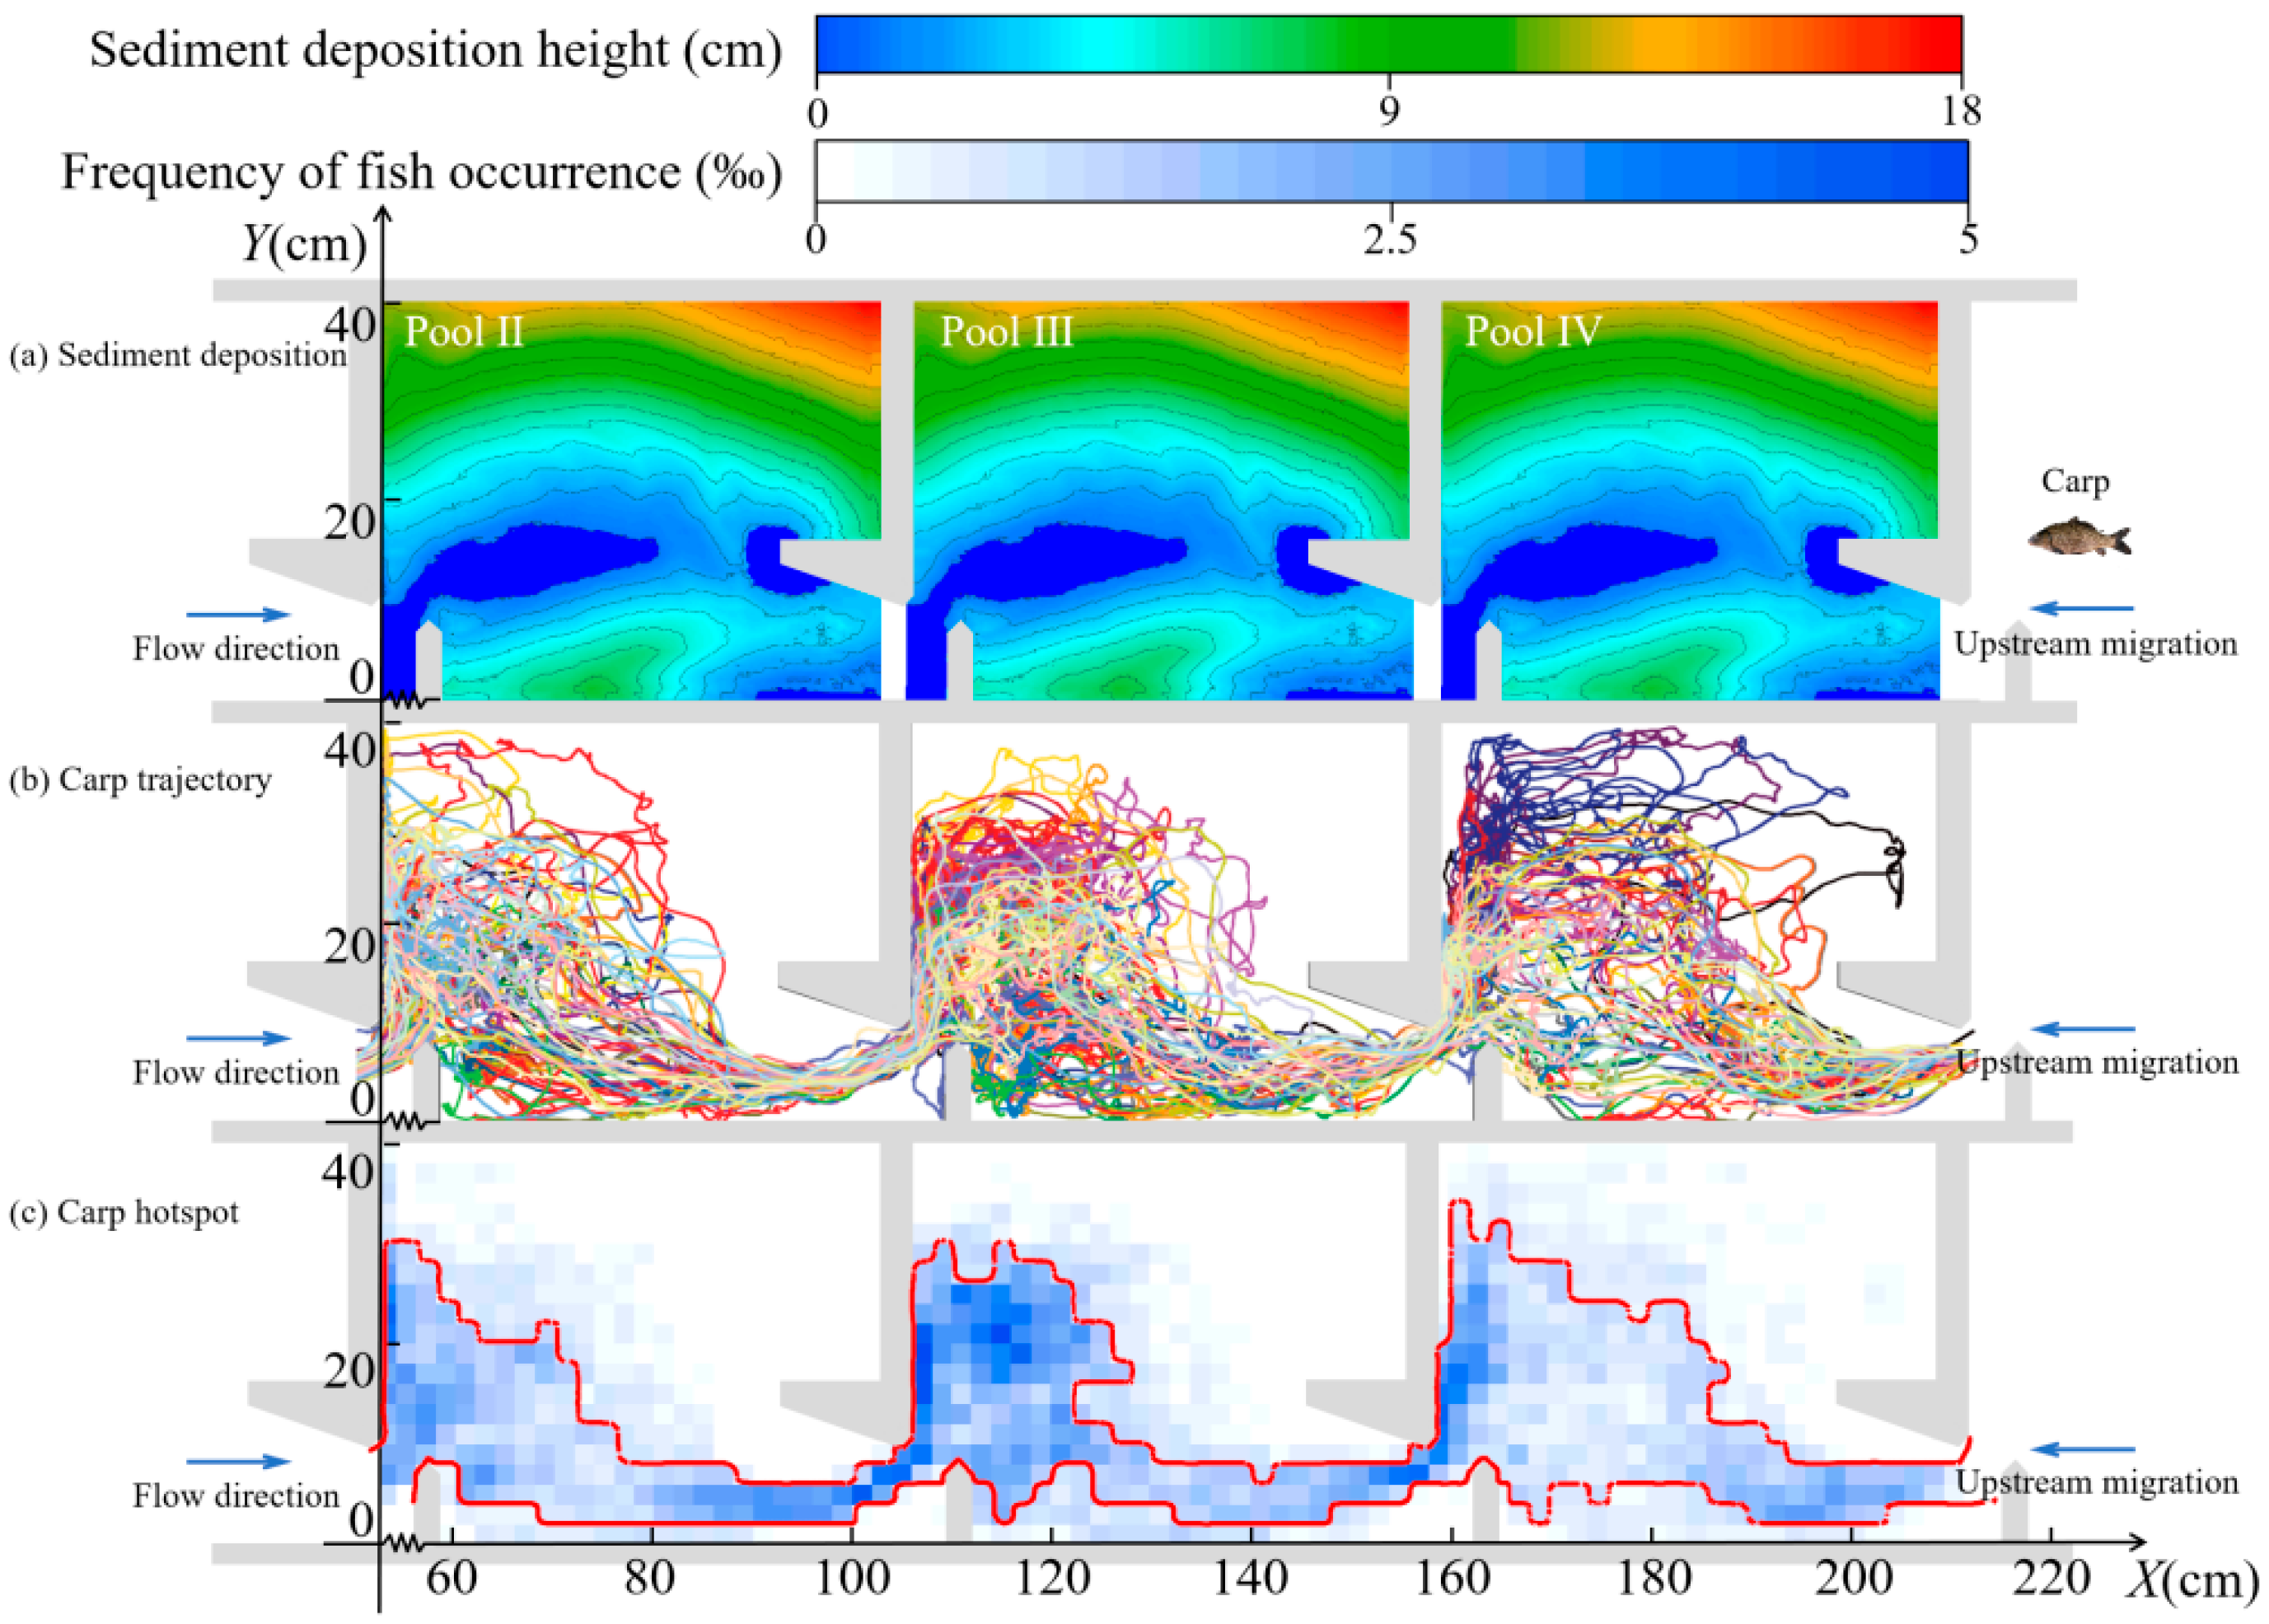
Under deposition-free conditions, carp frequency distributions in all three pools were similar, exhibiting strong aggregation behind baffles. Following sediment deposition, migration behavior shifted significantly: primary migration zones expanded while progressively diverging from pre-deposition patterns (Figure 9). Furthermore, spatial distributions across pools became statistically unstructured, indicating loss of consistent spatial preference.

3.1.3. Migratory Characteristics in the Vertical Direction

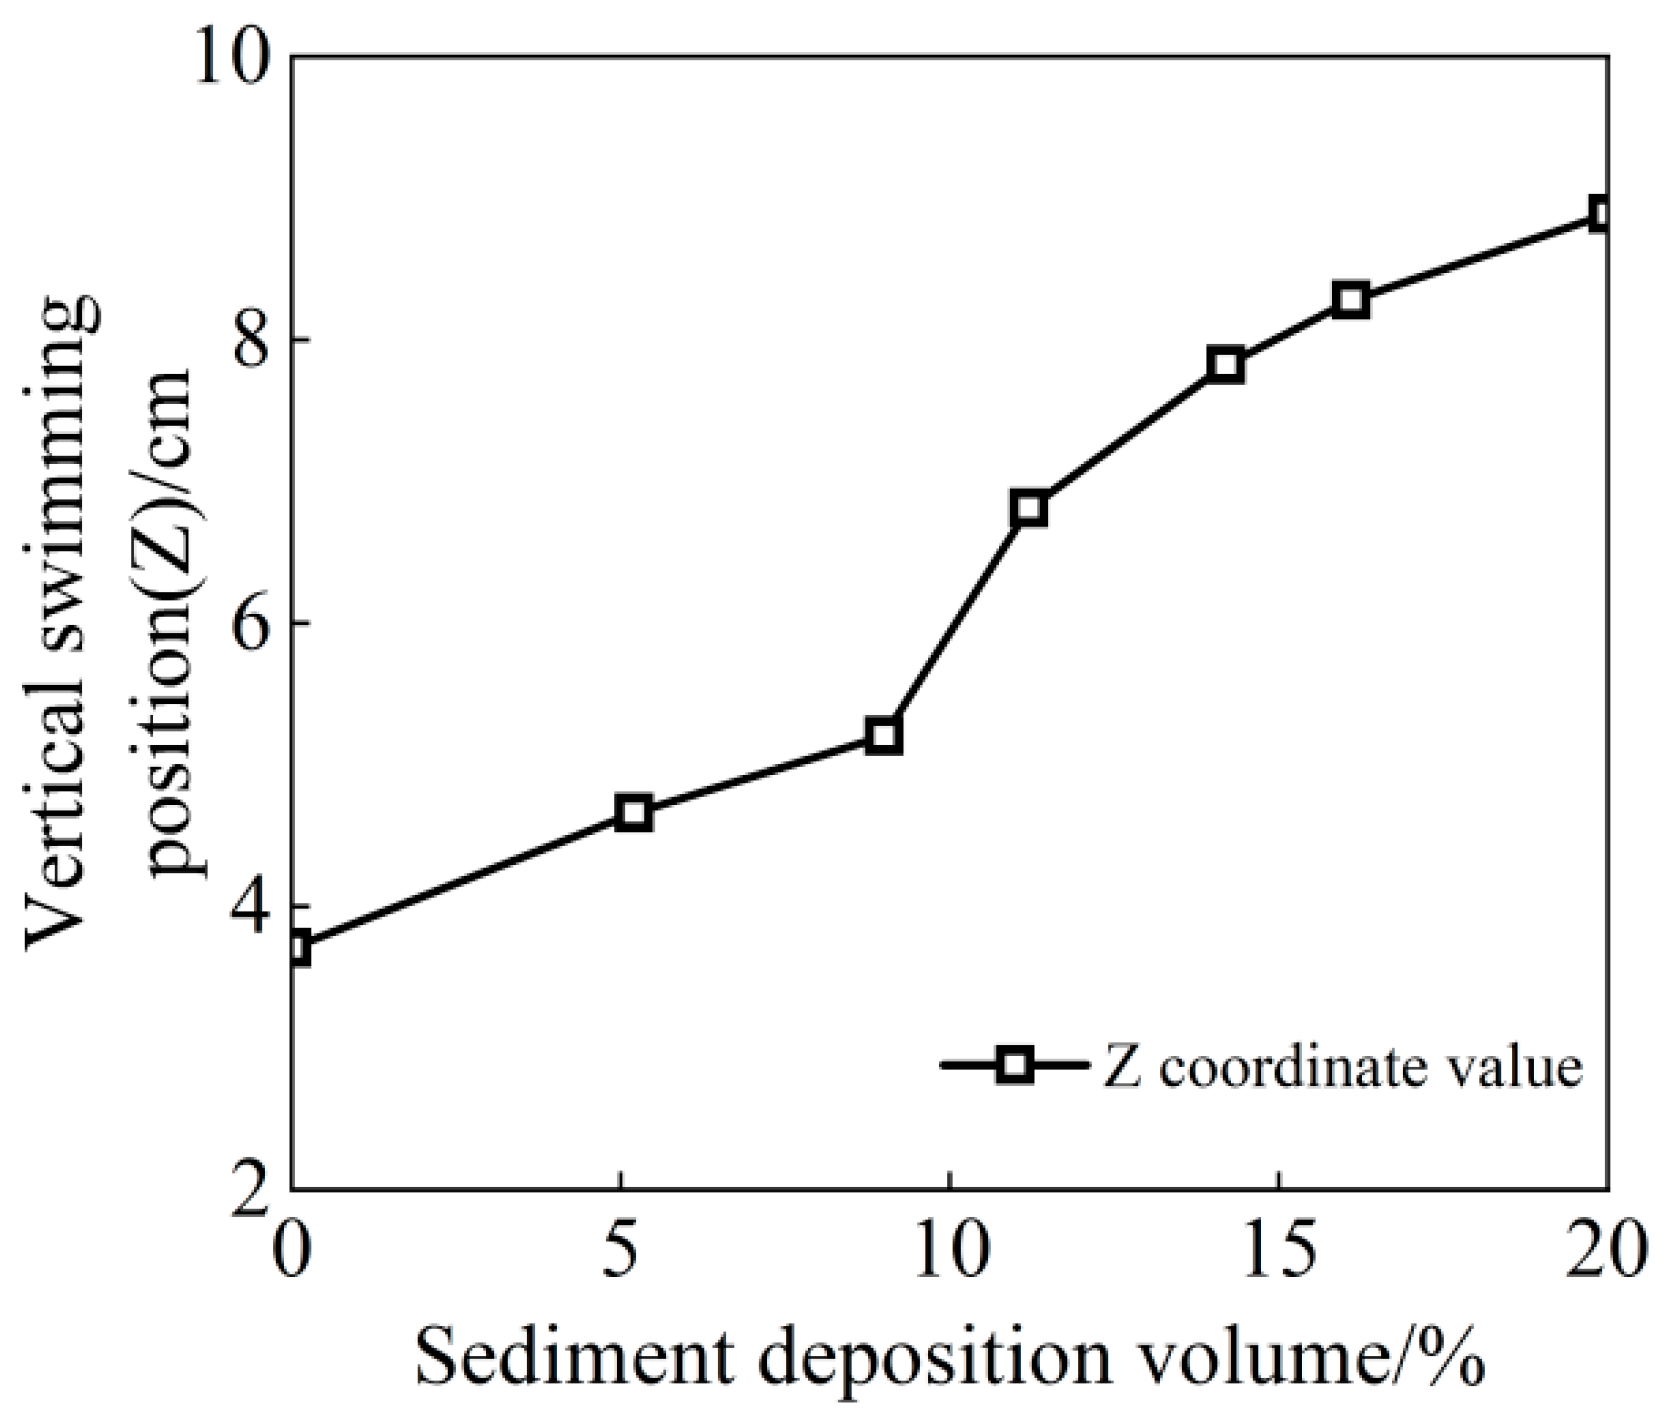
The average Z-coordinate of carp trajectories (Figure 10) quantified variation in vertical swimming position.
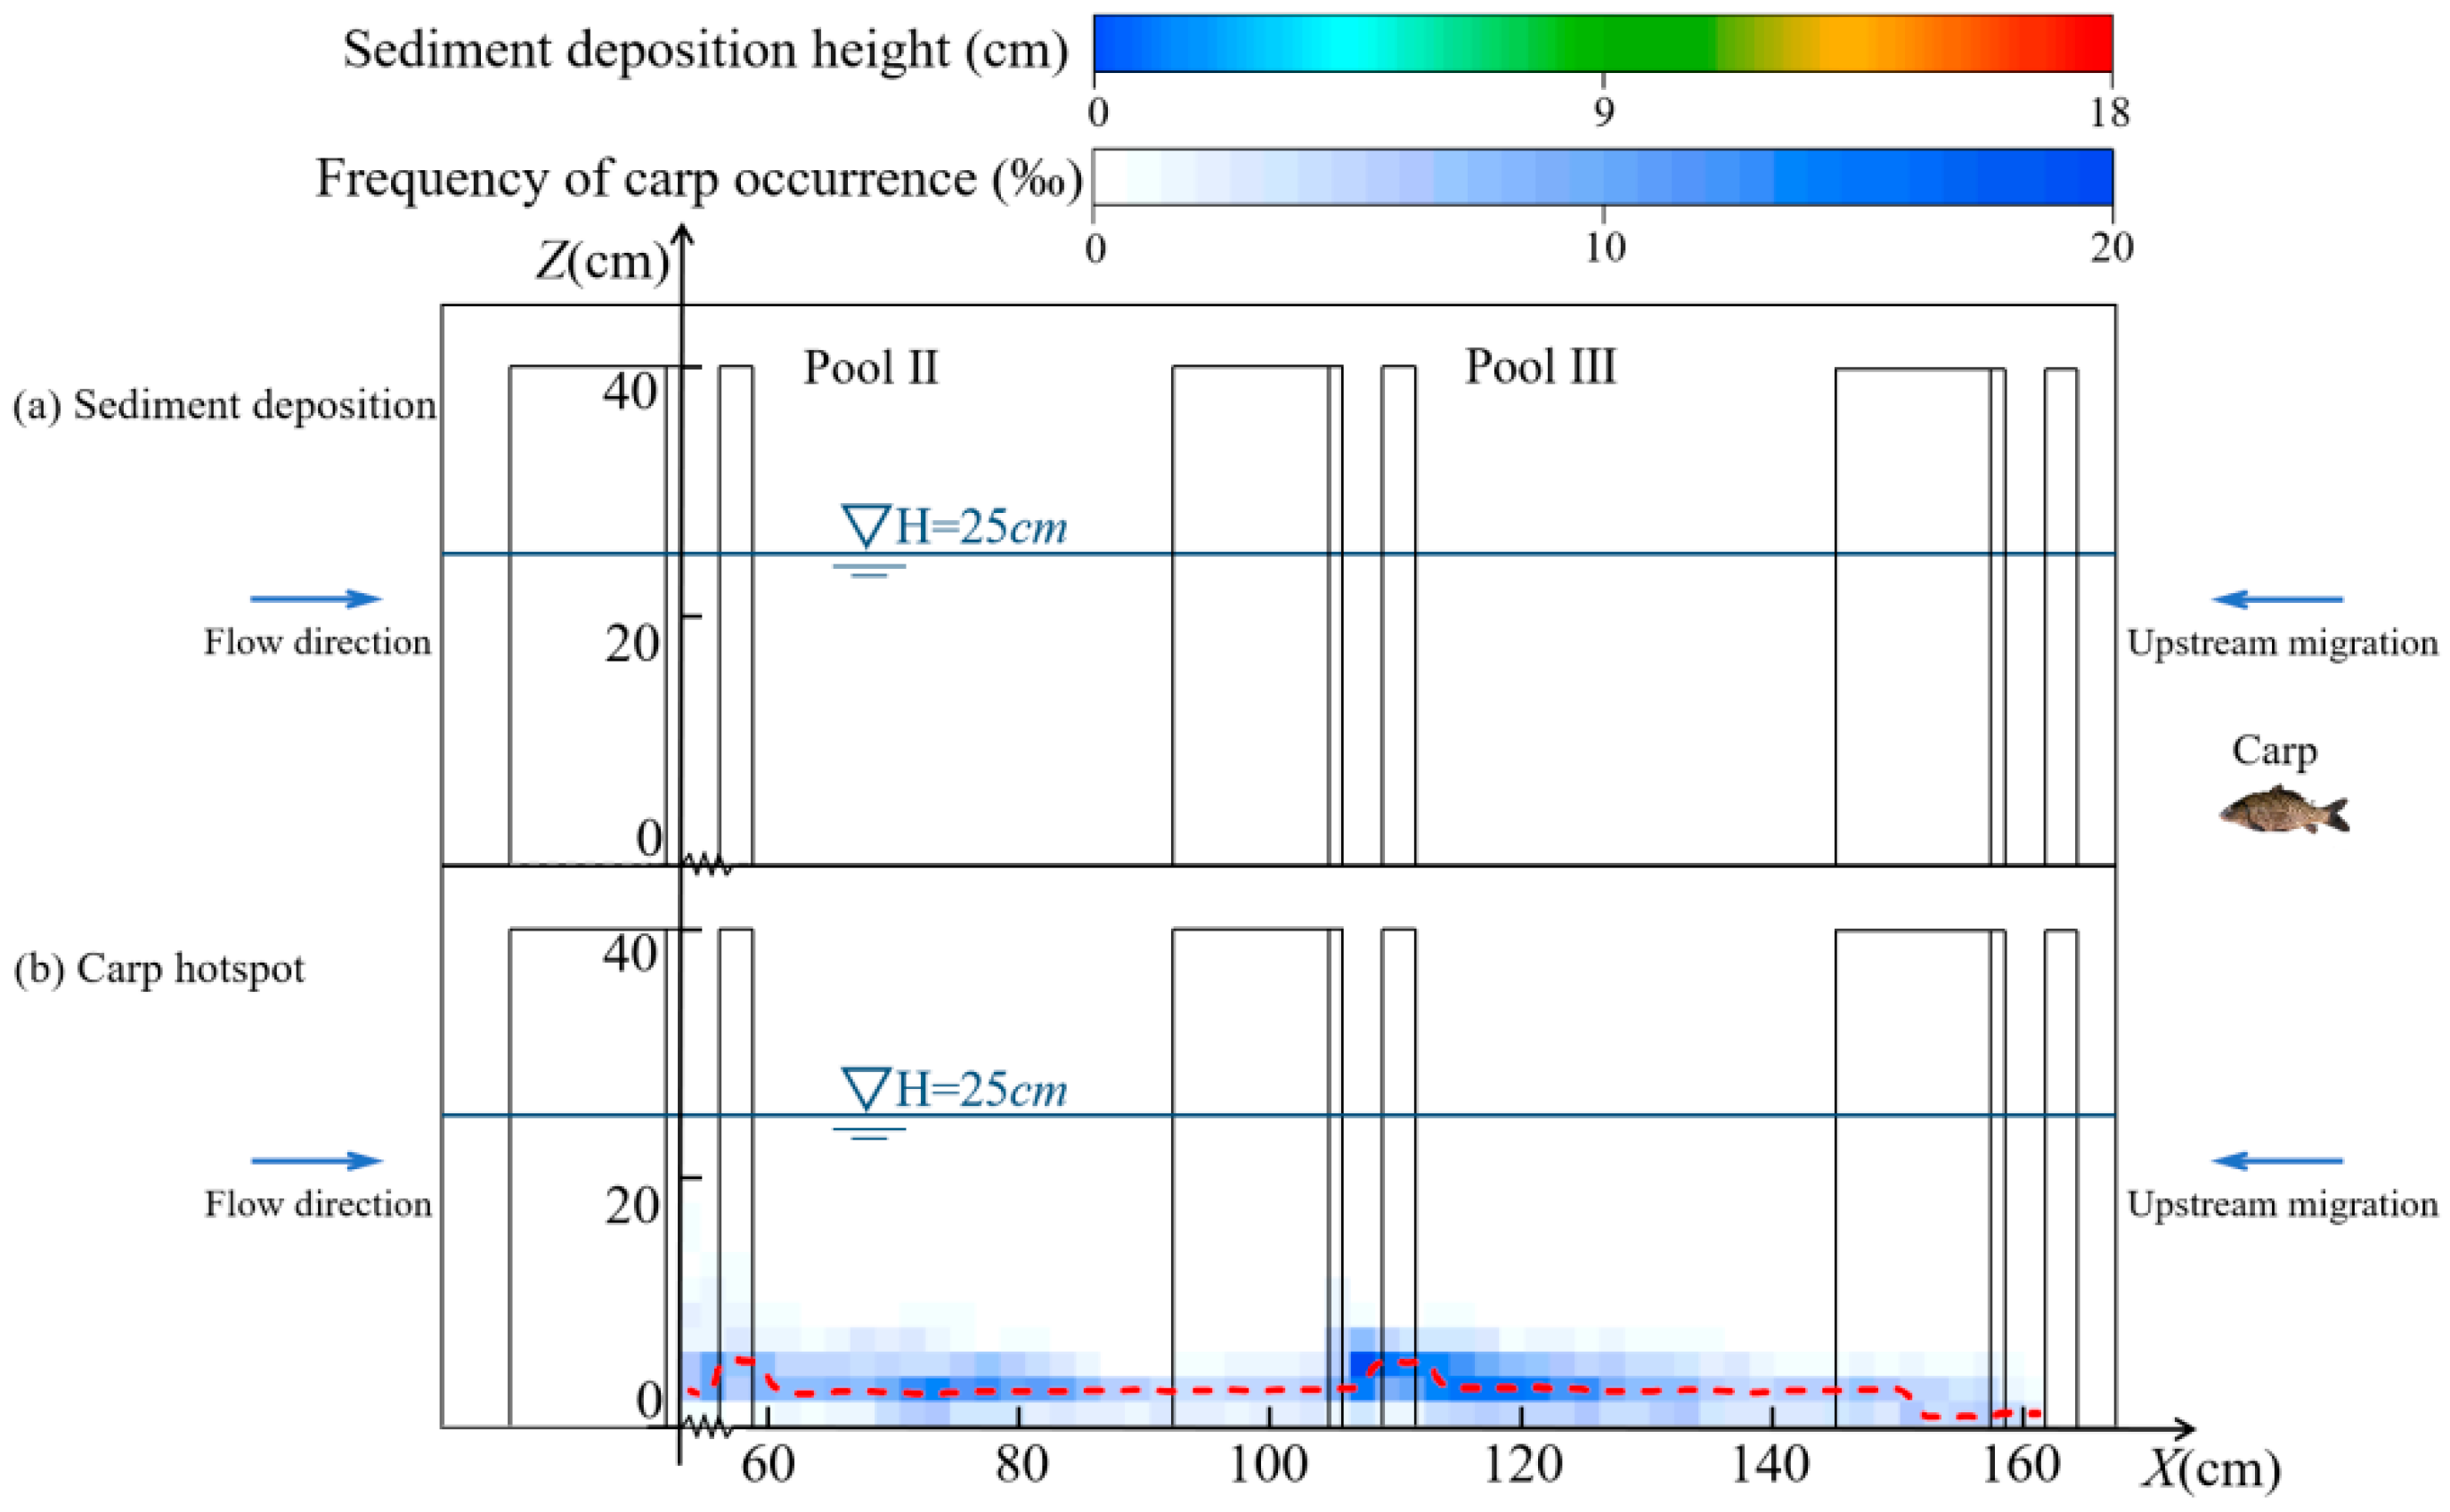
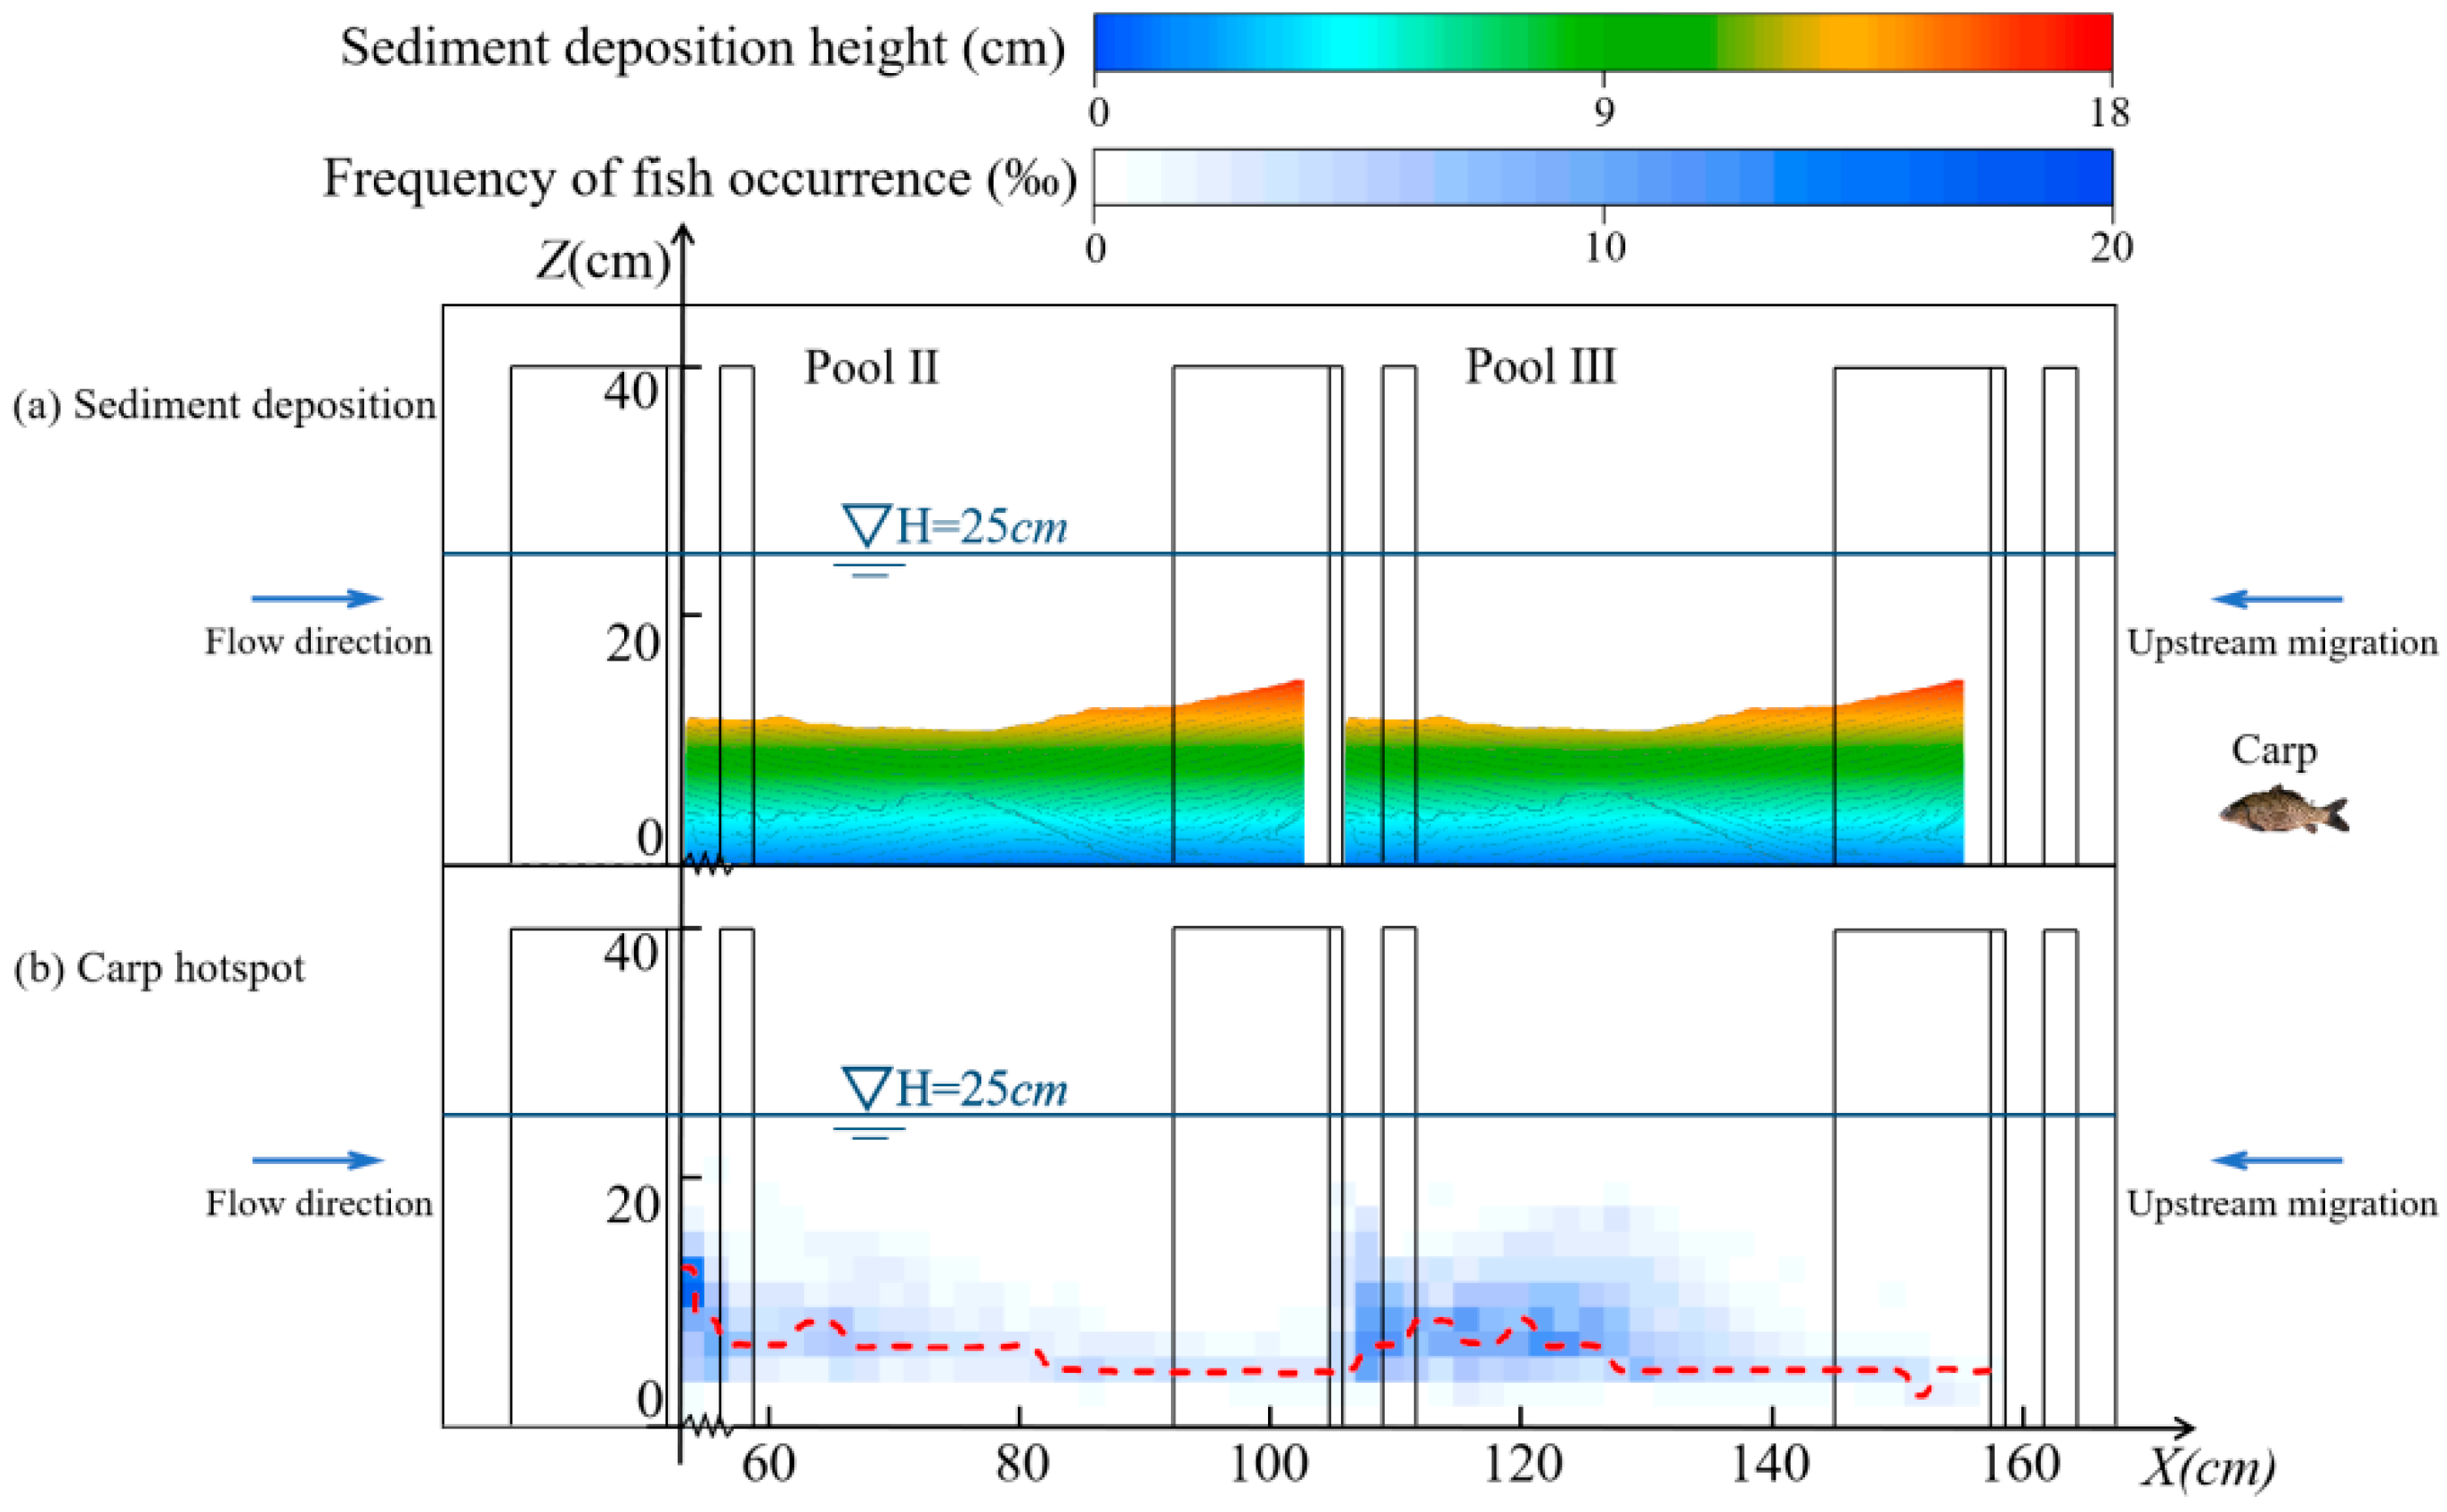
Figure 10 reveals that sediment-free conditions promoted strong benthic preference, with carp aggregating near z = 3.7 cm (immediately above the pool bed). Increasing sediment deposition triggered progressive upward displacement of trajectories. At maximum deposition, carp exhibited a mean vertical position increase of 5.2 cm relative to deposition-free baselines. This vertical redistribution is visually contextualized by trajectory comparisons in Figure 11 and Figure 12, where maximum sediment deposition induced the most significant bathymetric adaptation, particularly through expanded Z-direction mobility ranges.

3.2. Variation in Hydraulic Characteristics

Numerical simulations quantified hydrodynamic alterations induced by sediment deposition in the experimental pool. Comparative cases, no deposition versus and maximum deposition, were modeled at steady-state conditions (flow: 14.7 m3/h, depth: 25 cm), corresponding to observed carp swimming depths (z = 3 cm and 12 cm). Hydrodynamic analysis focused on the biologically relevant planes: near-bed (y = 7 cm, z = 3 cm) and mid-water (y = 7 cm, z = 12 cm).

3.2.1. Changes in the Horizontal Direction

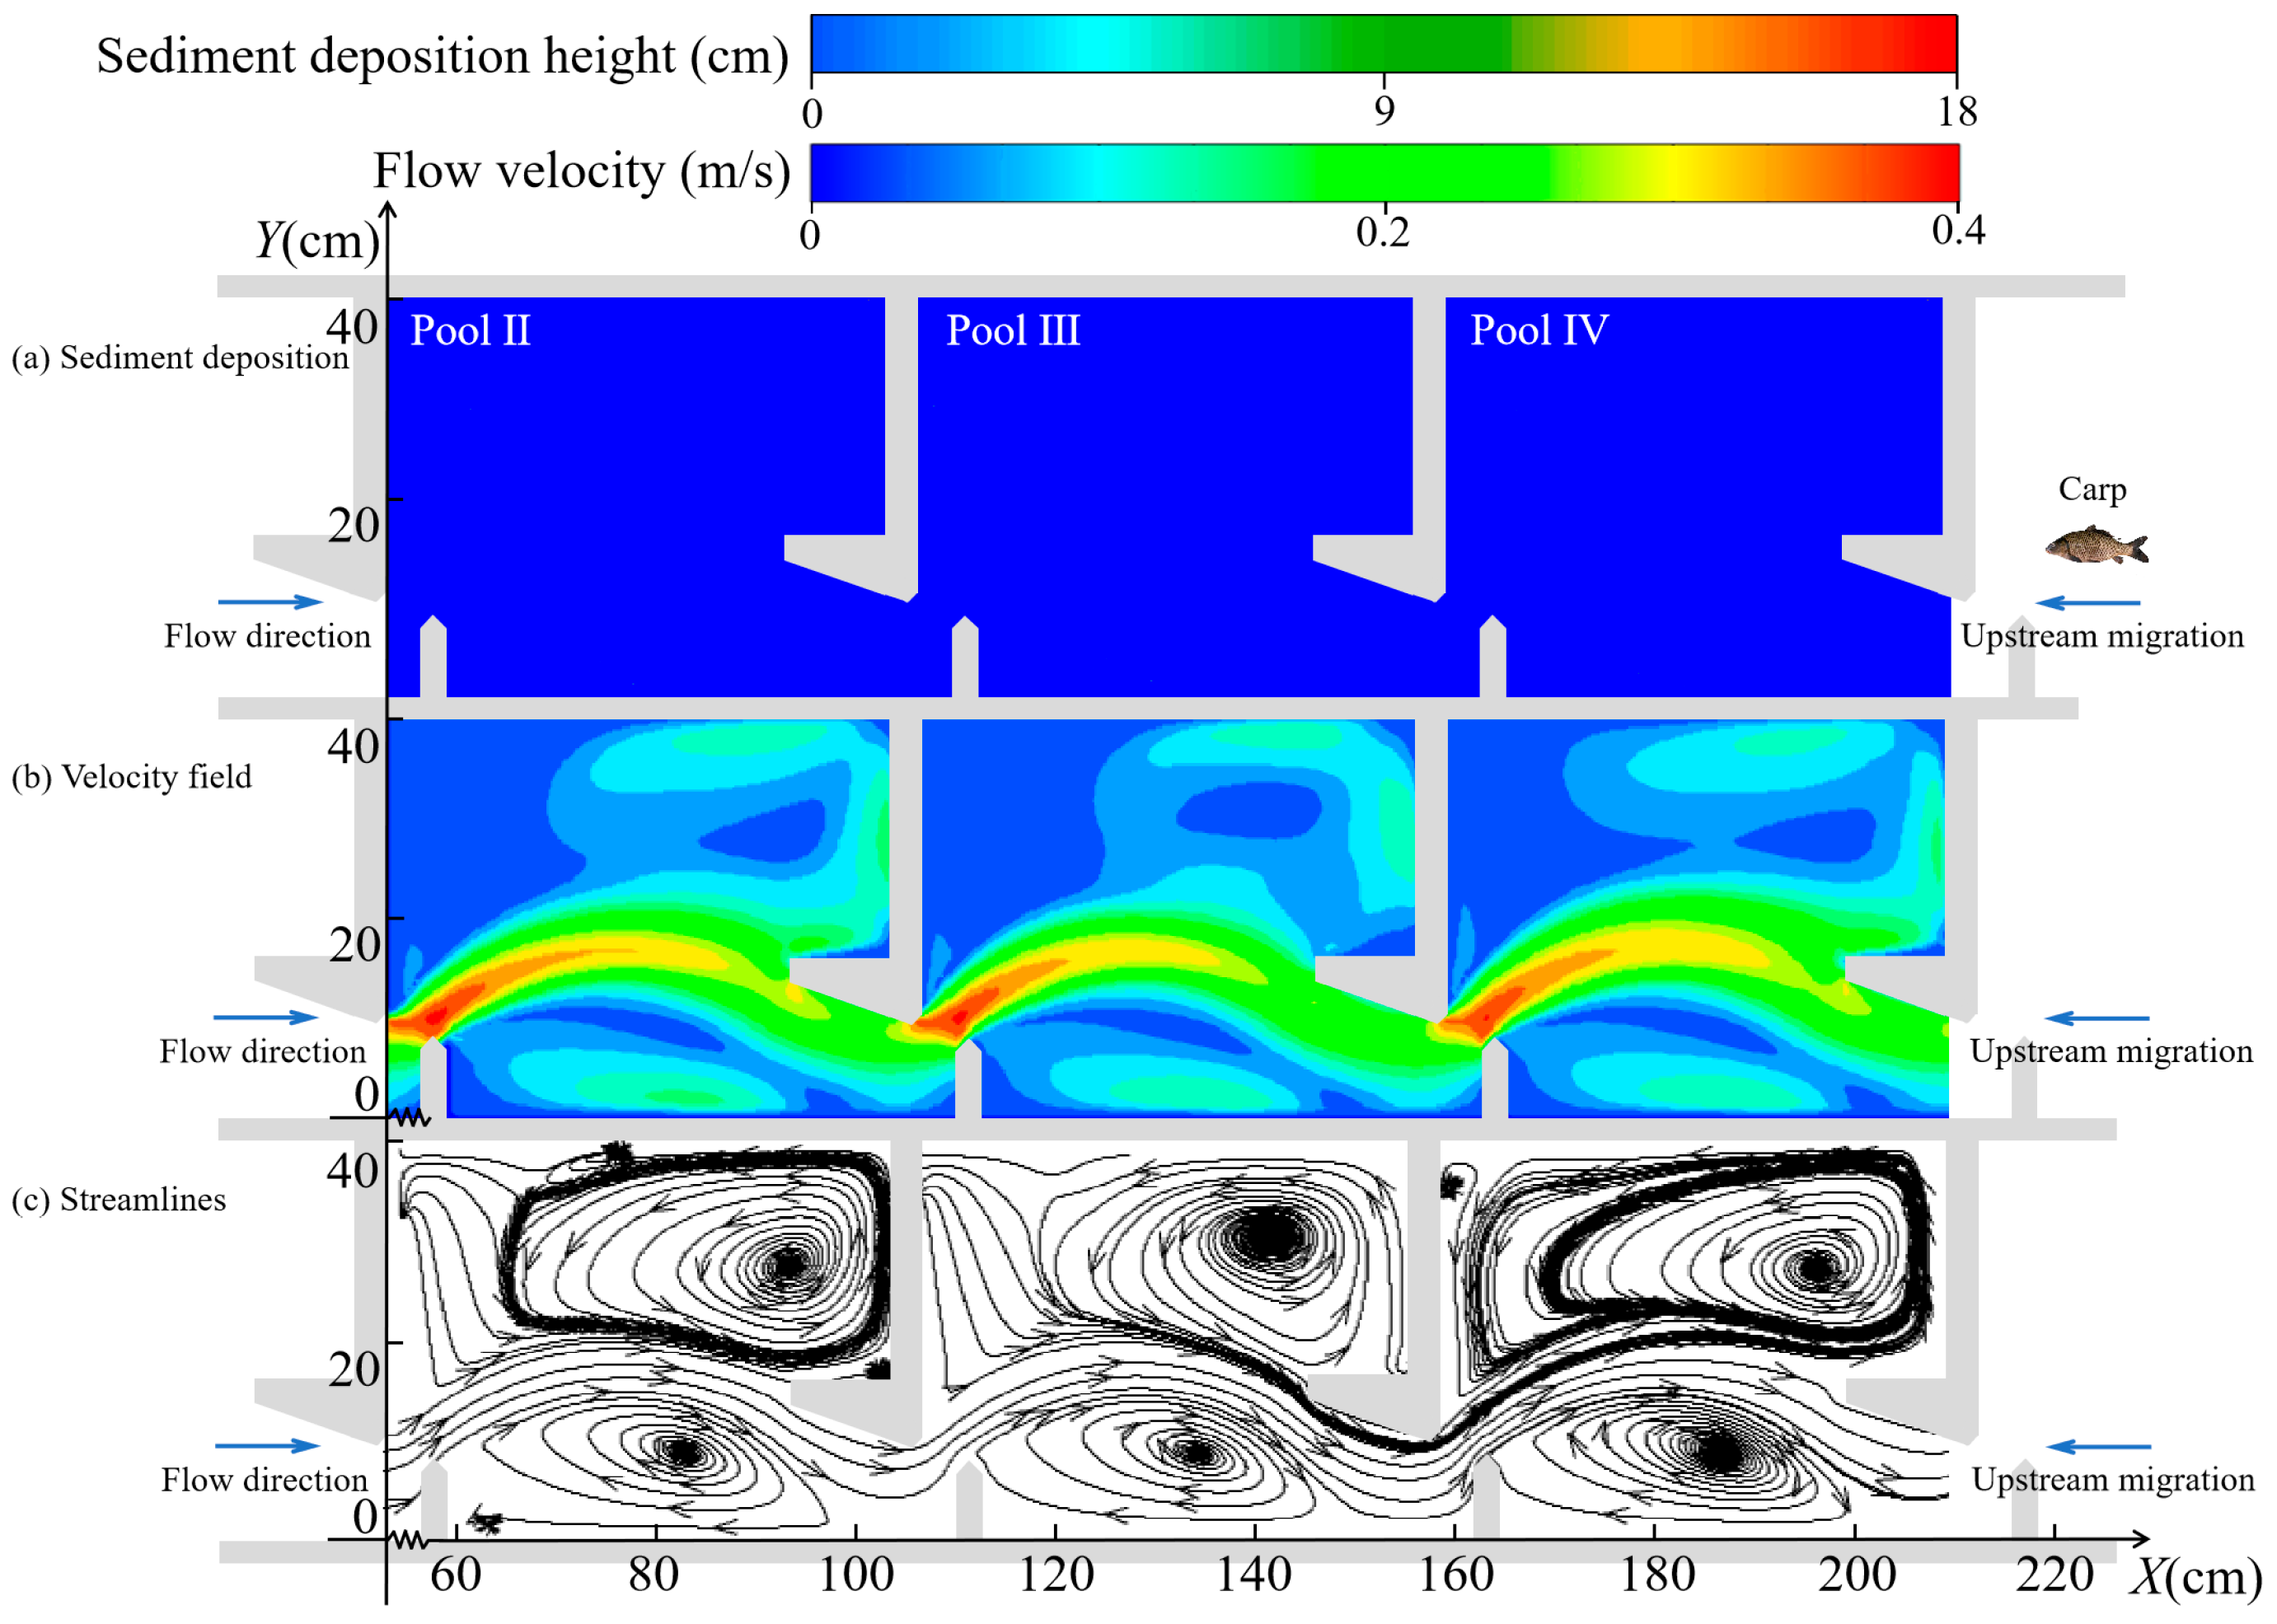
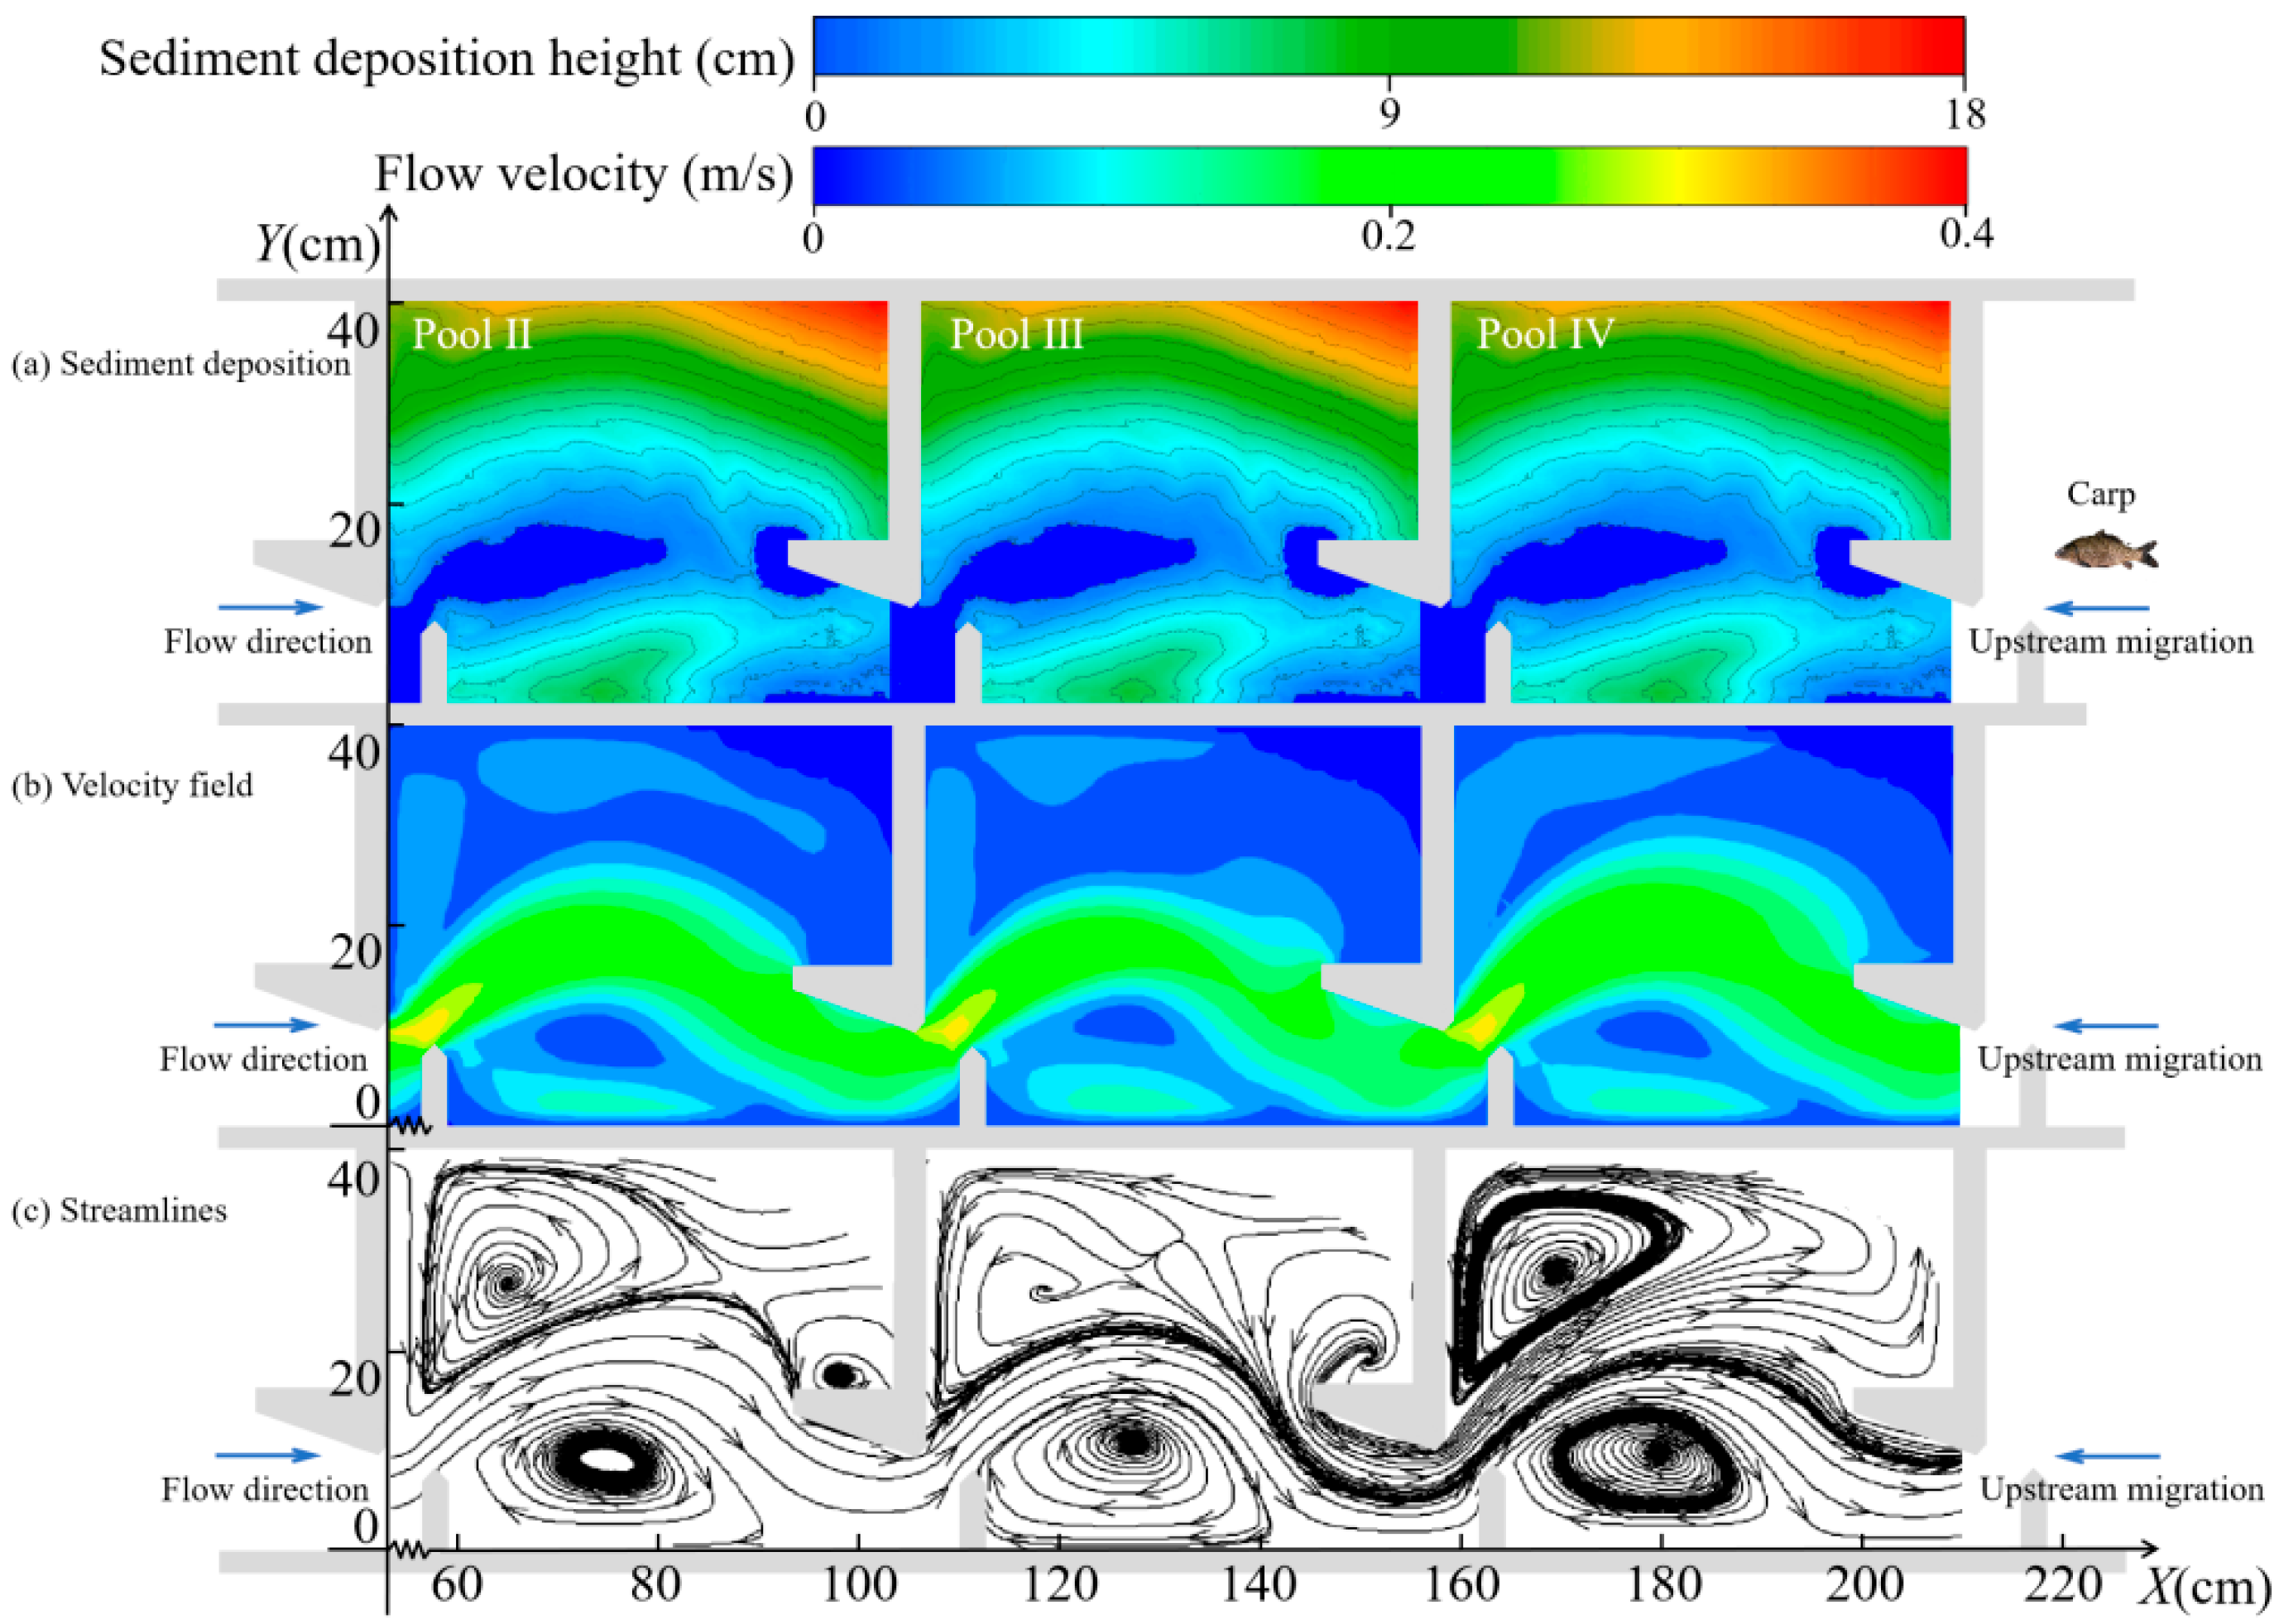
As illustrated in Figure 13, under sediment-free conditions, the hydraulic characteristics at the z = 3 cm cross-section revealed distinct flow structures. Upon traversing the vertical slot, water generated a primary flow region adjacent to the slot, while a recirculation region occupied both upper and lower pool margins. Flow velocity distributions in Pools II, III, and IV exhibited similar patterns, with peak velocities (~0.4 m/s) occurring near the vertical slot. Conversely, velocities within the recirculation region’s periphery were substantially lower. Correlating with Figure 8, fish consistently avoid high-velocity cores and therefore preferentially ascend Via downstream pool backwater zones.
However, in sediment-laden pools, velocity distributions become more uniform, consequently dispersing fish distributions. When deposition reached 15 cm (Figure 14), the recirculation region at z = 12 cm diminished in size and shifted leftward. Although Pools II–IV maintained comparable flow patterns, overall velocities decreased, reducing peak velocities in the primary flow region to 0.3 m/s.

3.2.2. Changes in the Vertical Direction

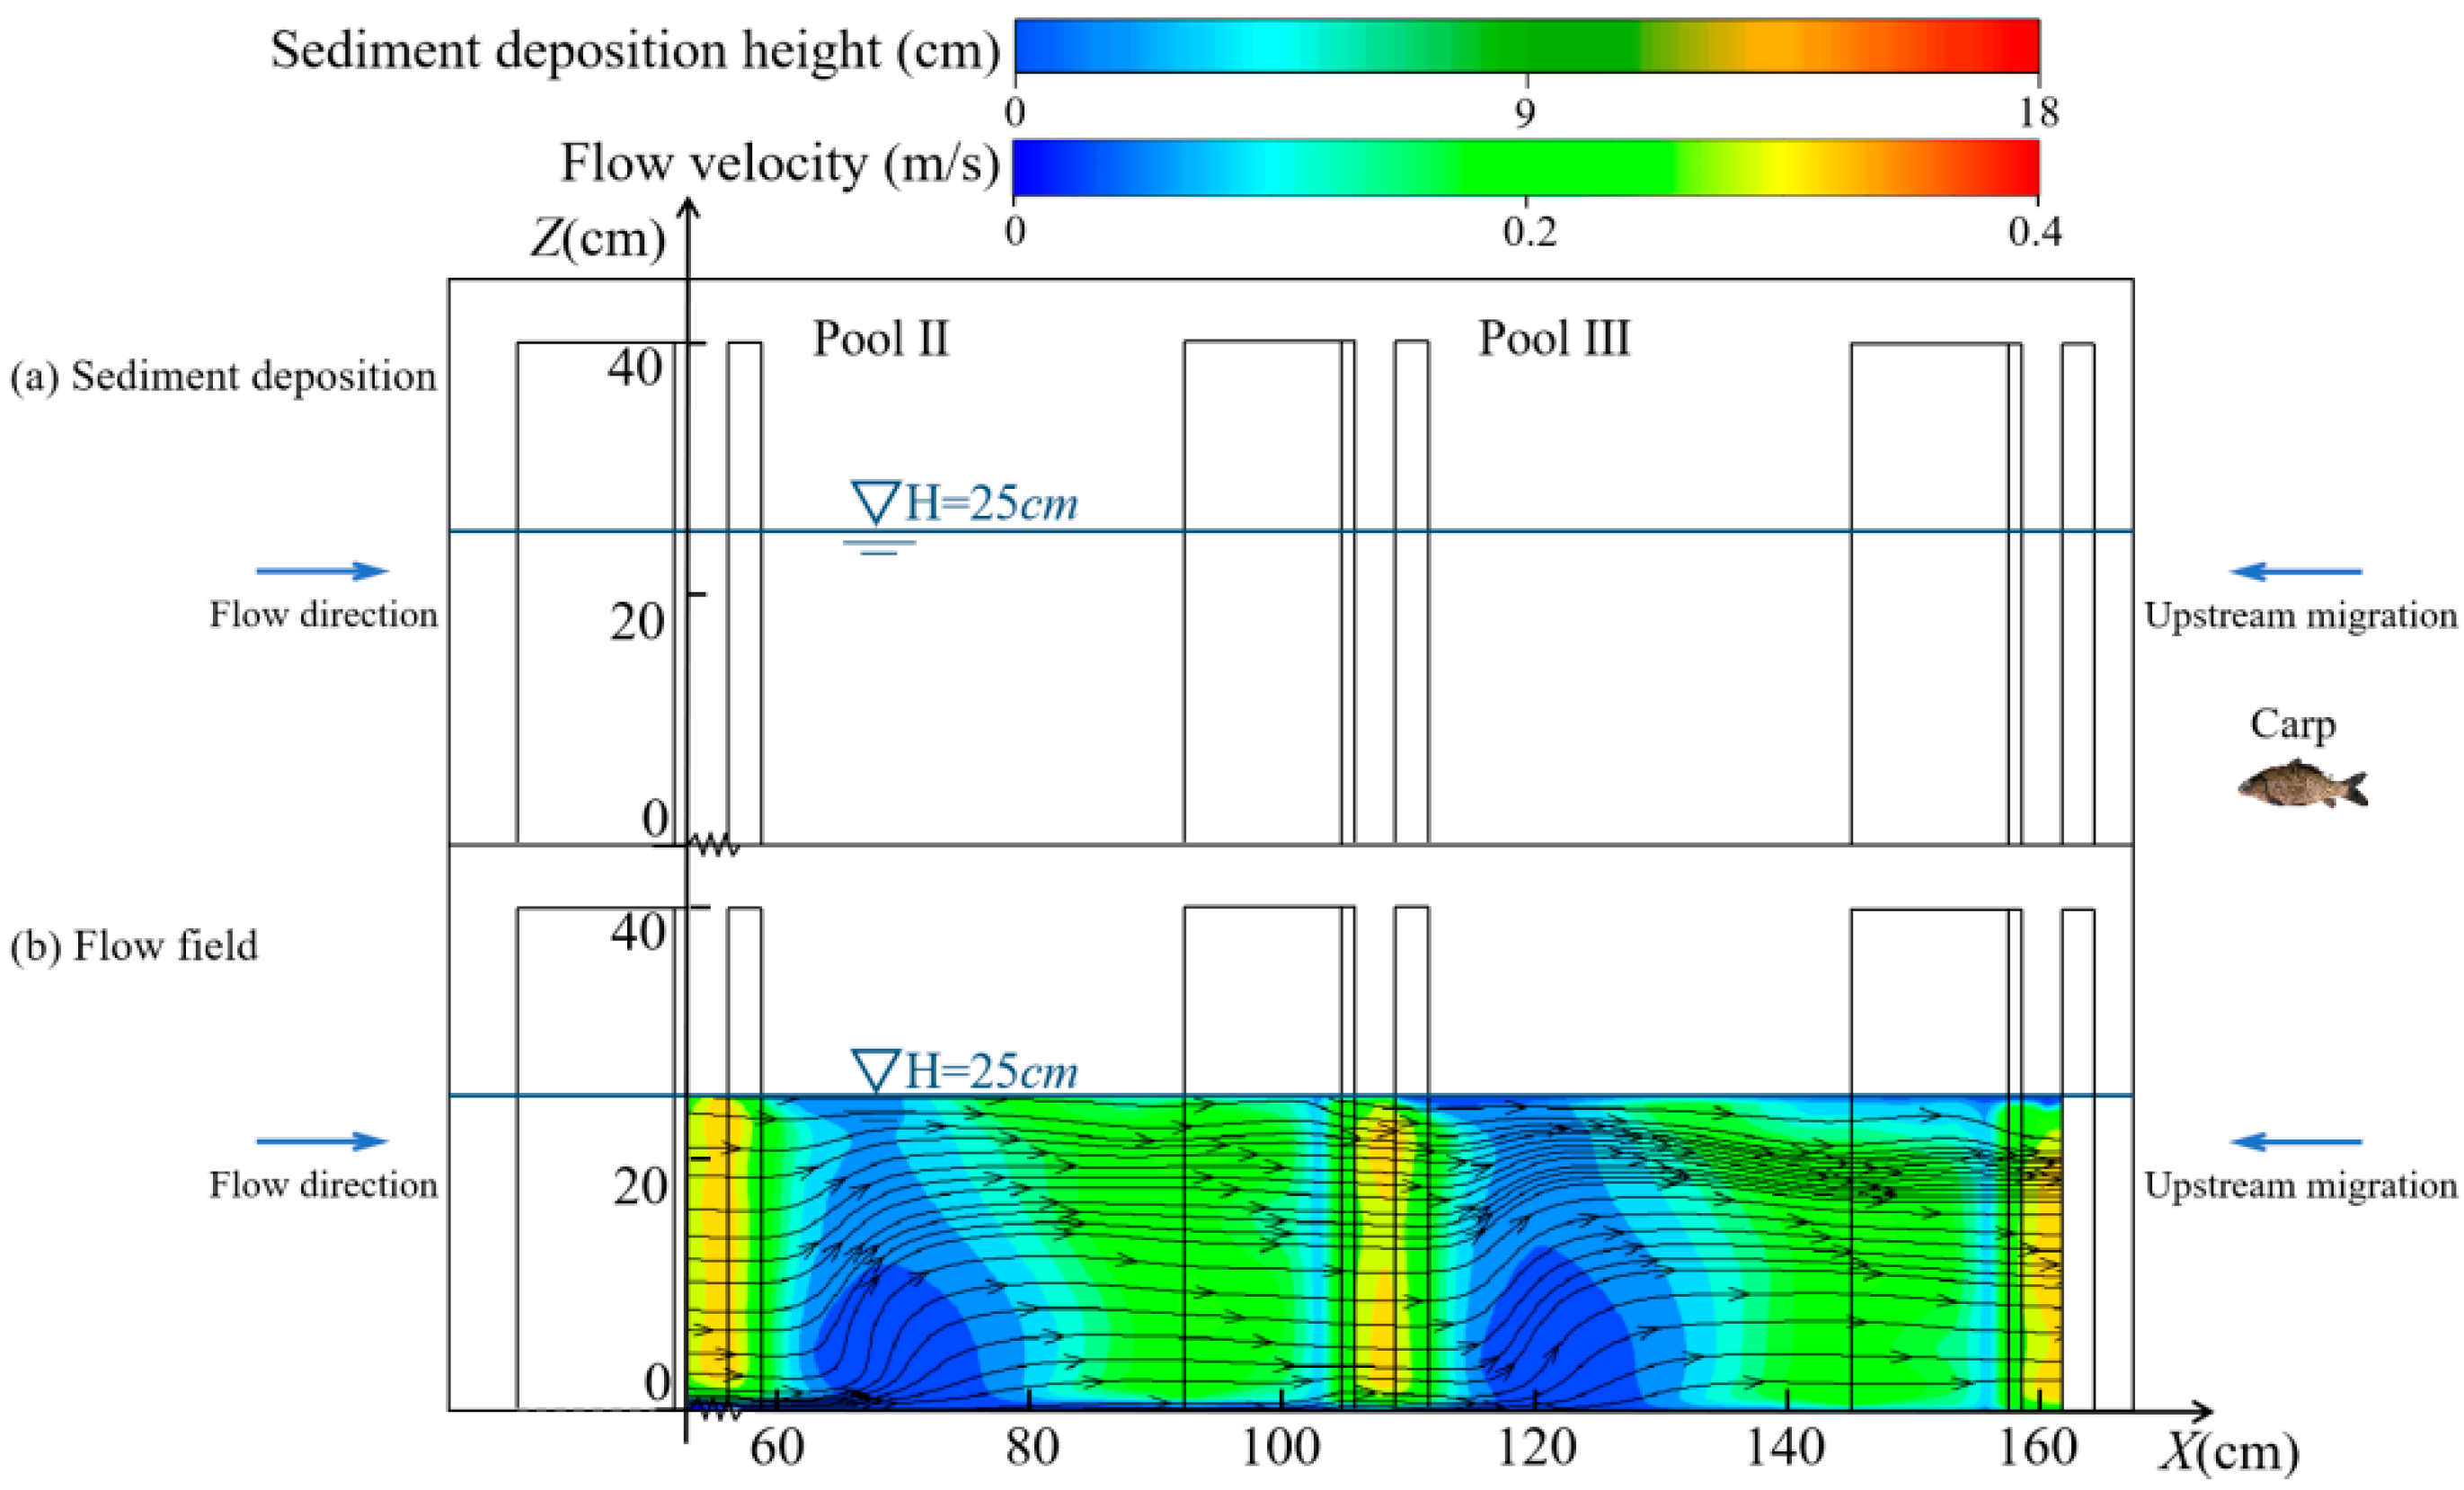
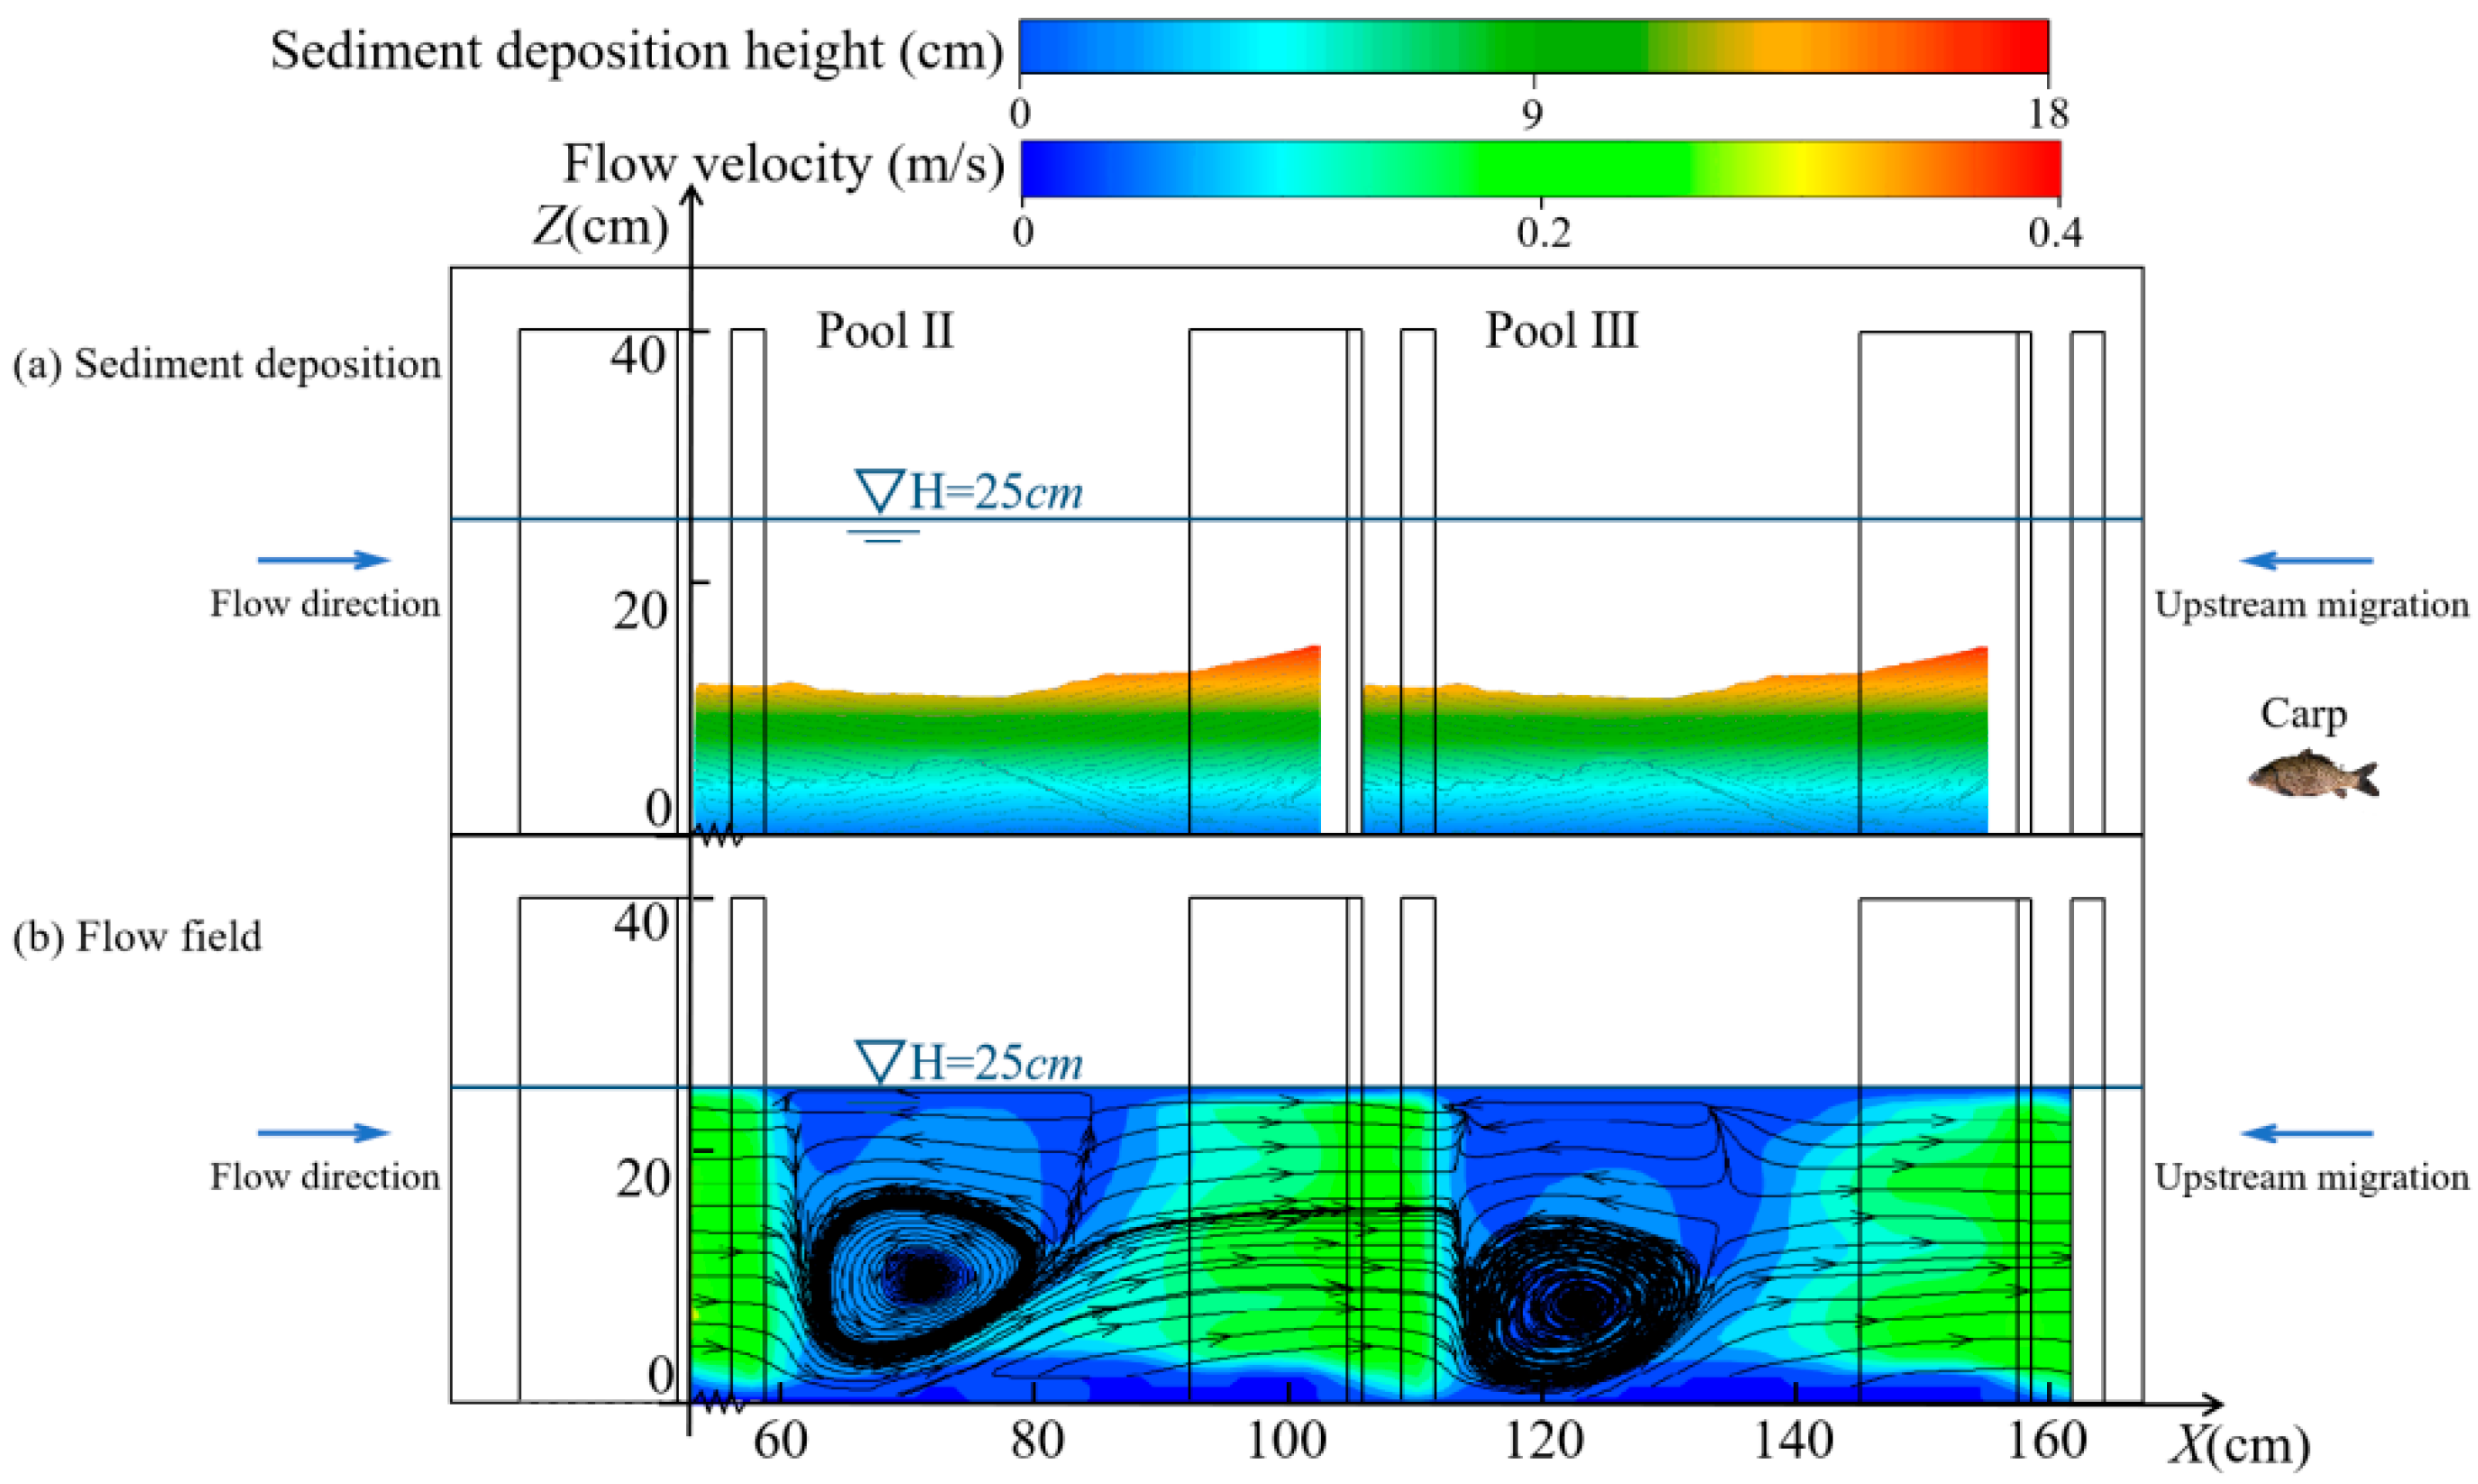
As shown in Figure 15 at the y = 7 cm cross-section, flow velocity distributions in Pools II and III before and after sediment deposition exhibited consistent patterns: velocities remained low in the central pool region (X-Z plane), while substantially higher velocities with maxima near the vertical slot were observed. Under sediment-free conditions, pool streamlines remained largely uniform and parallel. However, when maximum sediment deposition reached 15 cm (Figure 16), overall pool velocities decreased and a prominent clockwise vortex formed.

3.3. Energy Consumption of Carp Migration

Representative migration trajectories were selected for both flow conditions. Using the coordinates of carp upstream paths, flow velocity profiles along these migration routes within the X-Y planes of Pools II–IV were extracted (Figure 17). For both scenarios, theoretical flow resistance and potential energy consumption during migration were calculated using the aforementioned equations (Figure 18). Statistical comparisons of flow resistance and energy expenditure for carp under these conditions are presented in Table 3.
These results confirm progressively increasing energy consumption along carp migration paths. Under sediment-free conditions, mean hydrodynamic resistance along migration routes was 0.001 N, yielding cumulative energy expenditure of 2.4 × 10⁻³ J. Following 15 cm maximum sediment deposition (sediment-laden condition), mean resistance decreased to 8.0 × 10⁻⁴ N while cumulative energy consumption rose to 3.1 × 10⁻³ J. Sediment deposition reduced flow velocities and route-specific hydrodynamic resistance, yet paradoxically increased cumulative migration energy expenditure. Consequently, energy dissipation within the X-Y swimming plane does not principally govern reduced upstream migration rates.
As sediment deposition increased, clockwise eddies approximately 10 cm in diameter emerged within the pool’s X-Z plane. When fish encountered vortices comparable to their total body length, they exhibited disorientation and destabilization, thereby triggering pronounced energy expenditure [43]. Further, silt occupation reduced activity space, necessitating expanded Z-direction mobility and elevated swimming positions, ultimately conflicting with the carp’s natural benthic swimming behavior.

3.4. The Correlation Between the Upstream Trajectory and Hydraulic Factors

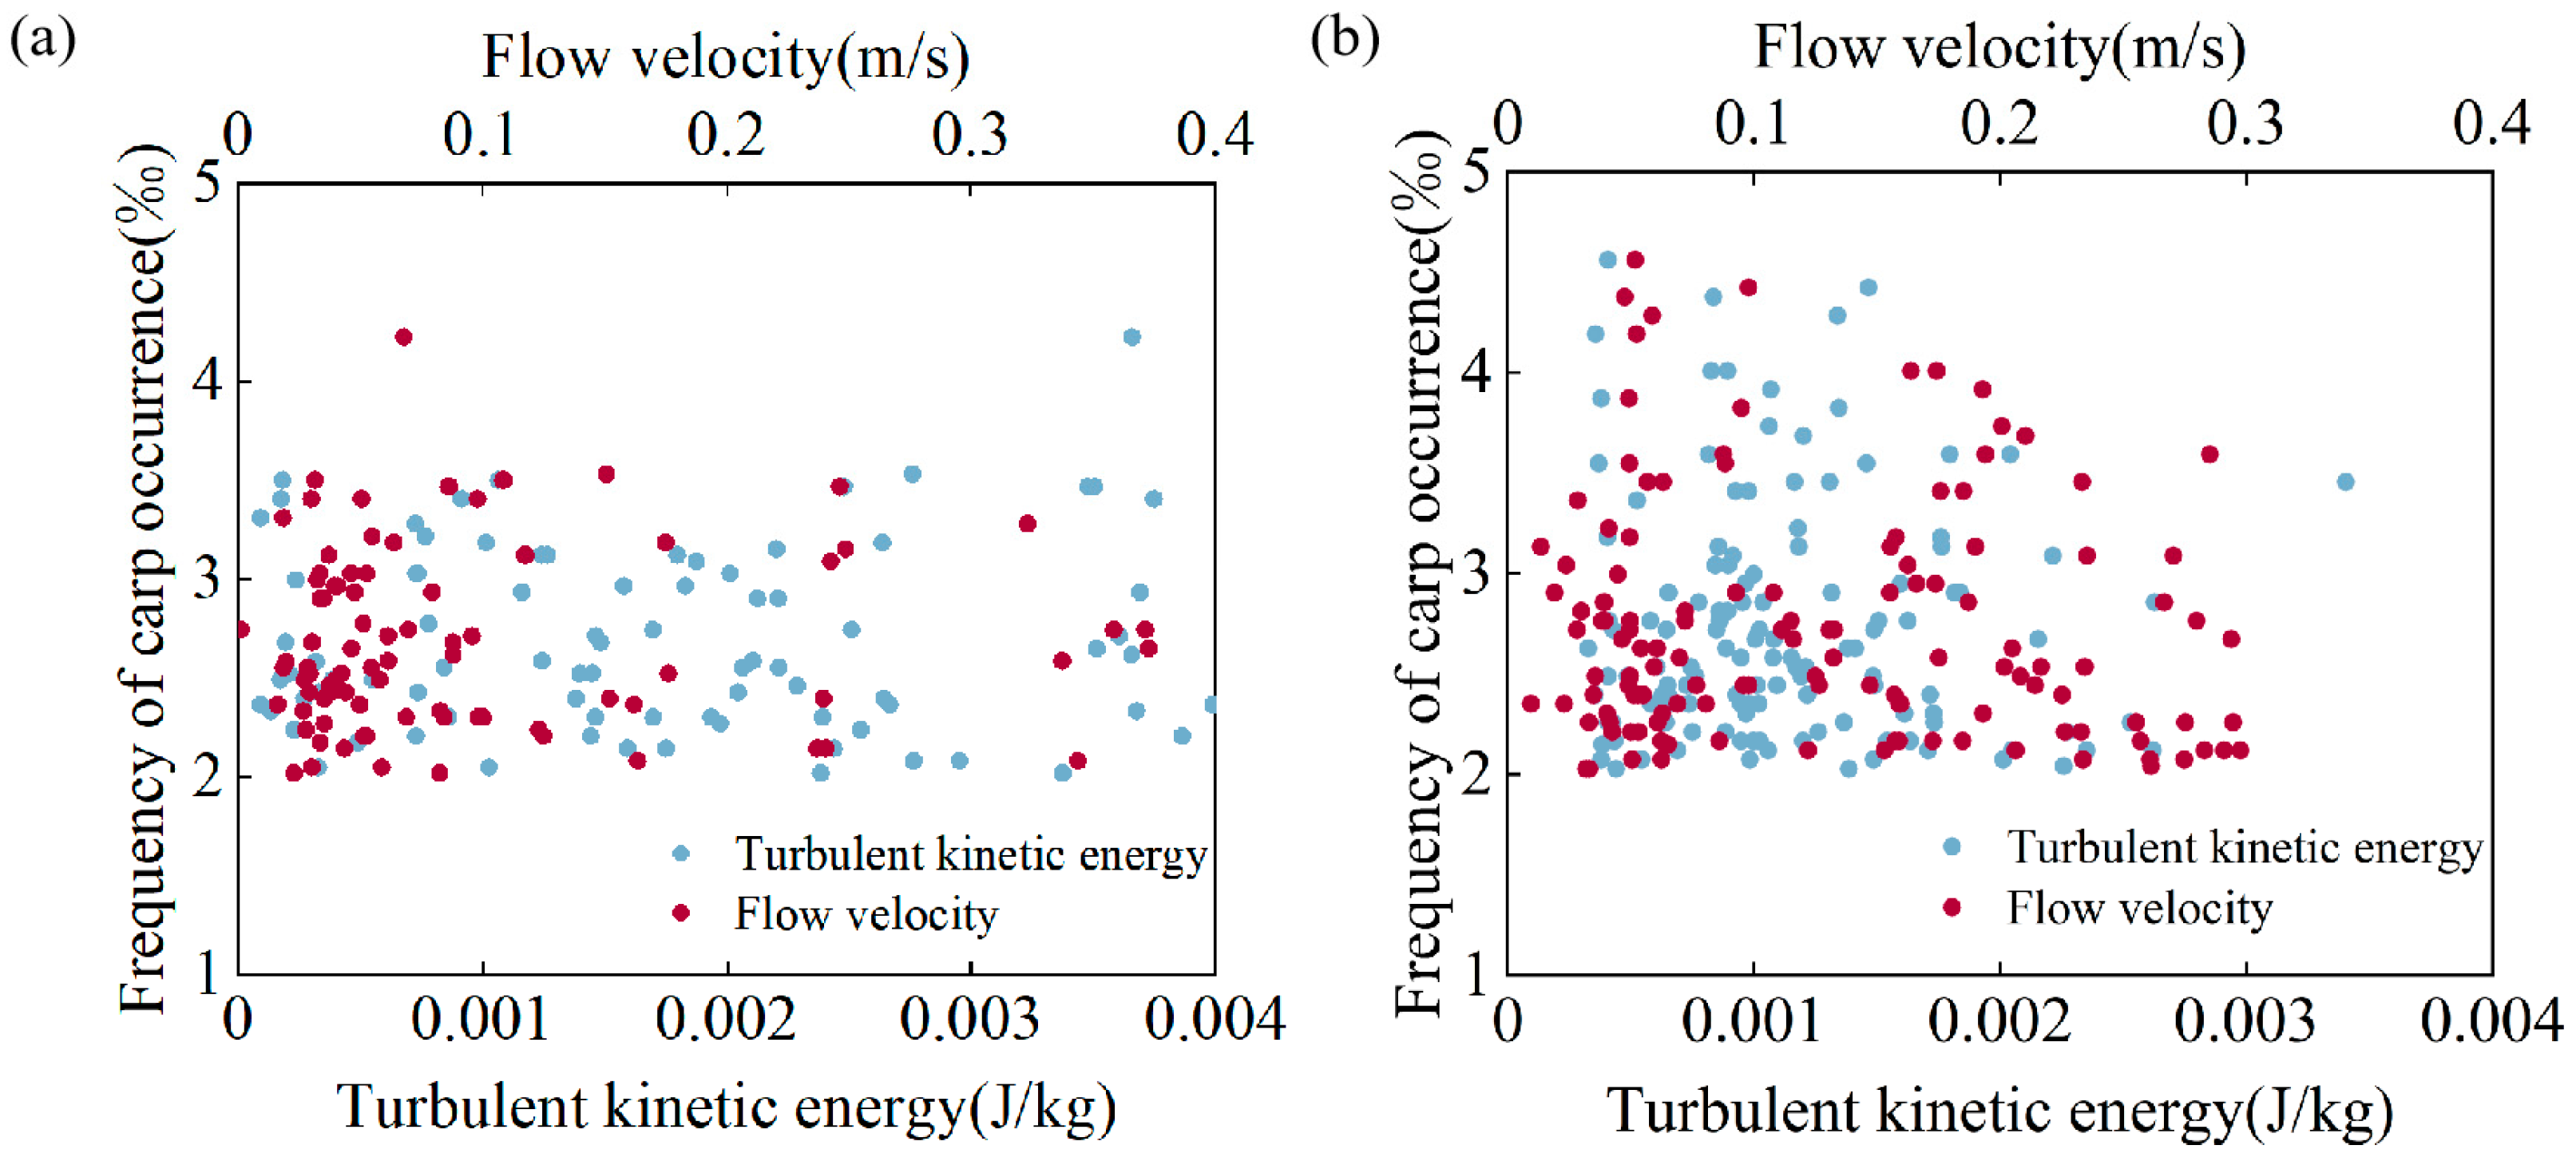
To ascertain the influence of hydraulic parameters on carp swimming kinematics, a spatial overlay of upstream migration hotspots (X-Y plane) with turbulence kinetic energy and flow velocity distributions was performed, enabling identification of hydraulic conditions corresponding to areas where carp occurrence frequency exceeded 2‰.
As shown in Figure 18a, carp predominantly occupied areas with TKE levels of 0–0.003 J/kg and flow velocities of 0.03–0.15 m/s under sediment-free conditions. Following increased sediment deposition (Figure 18b), this preference shifted to TKE ranges of 0.0004–0.002 J/kg and velocities of 0.013–0.3 m/s. To quantify correlations between carp movement patterns and hydraulic conditions, η correlation analysis was subsequently performed (Table 4).
Analysis demonstrated significantly strong associations between carp emergence frequency and hydraulic parameters under both sediment regimes. Phi coefficients for TKE and flow velocity exceeded 0.5, while Cramer’s V and Contingency Coefficient values approached 1.0, collectively indicating robust statistical dependence of fish occurrence on hydraulic conditions.
Scatter plot analyses confirmed preferential carp occurrence in low-velocity zones irrespective of sediment regime. While extant literature indicates general piscine avoidance of high-turbulence habitats, carp distributions under sediment-free conditions showed uniform dispersion across turbulence energy gradients. This anomaly suggests ambient turbulence intensities remained below ecological response thresholds, exerting negligible impact on swimming energetics. Post-deposition, however, carp exhibited significant affinity for low-turbulence zones, indicating suspended sediments elevate energy expenditure and drive active selection of hydraulically benign microhabitats.
Scatter plot analysis revealed that carp exhibited higher occurrence frequencies in low-velocity zones both before and after sediment deposition. Previous studies indicate that fish typically avoid high-turbulence regions; however, during sediment-free experiments, carp occurrence remained uniformly distributed across turbulence energy gradients. This pattern likely stems from turbulence energy levels being insufficiently impactful to impede carp swimming behavior. Following sediment deposition, carp distinctly shifted toward low-turbulence zones. This behavioral change is attributed to elevated energy expenditure imposed by suspended sediment, thereby motivating selection of habitats with reduced turbulence energy to conserve energy.

3.5. Multivariable Linear Regression Model

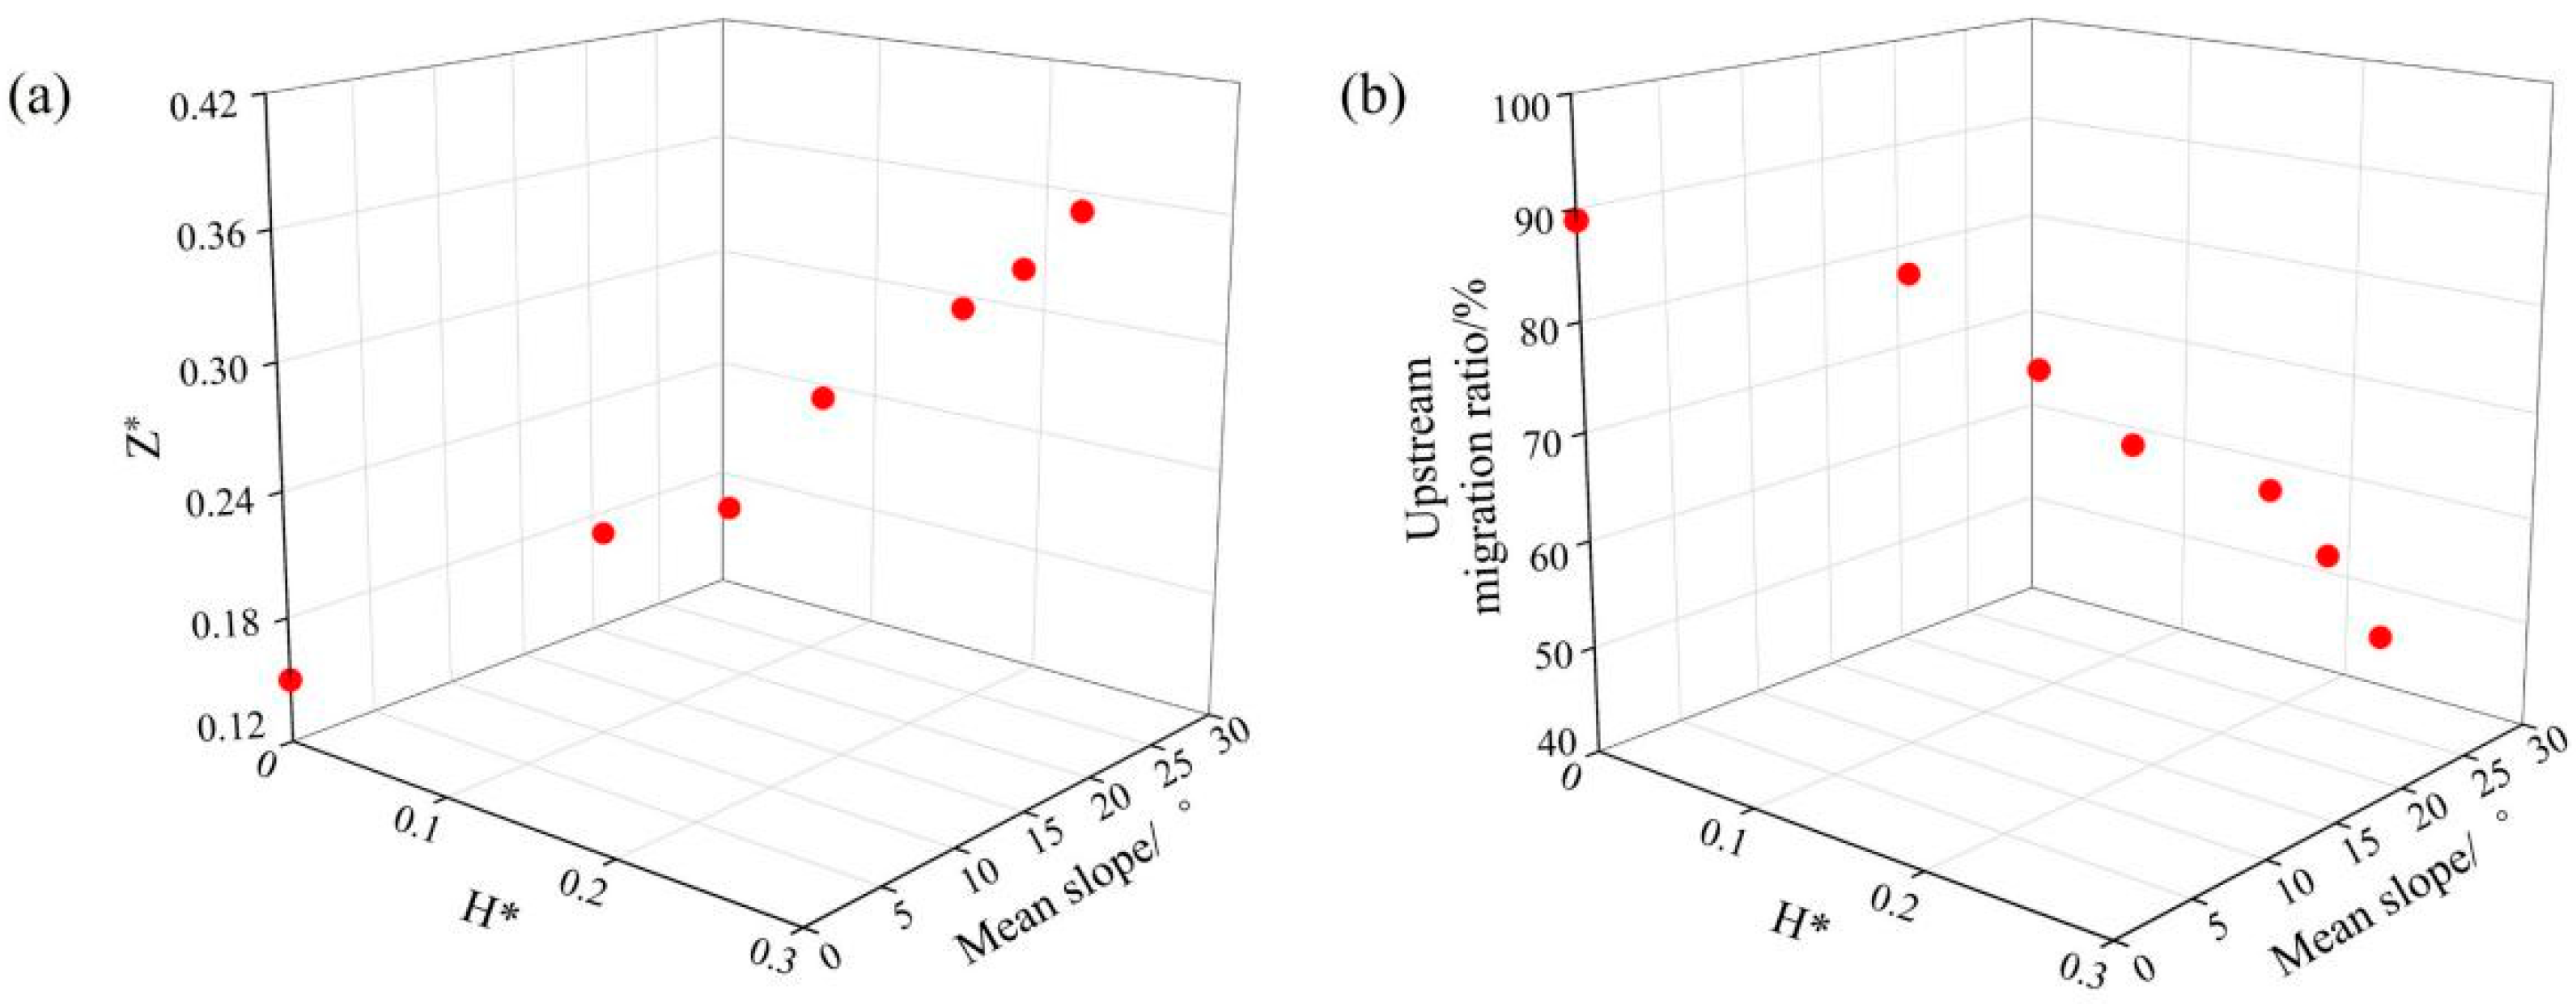
Scatter plots depicting relationships between the mean sediment deposition height/slope and upstream migration ratios (including Z-direction trajectory changes) revealed statistically significant linear correlations among independent and dependent variables, as established in Figure 19. The mean sediment deposition height was non-dimensionalized relative to water depth to derive the normalized parameter H*. Similarly, carp swimming positions along the vertical axis (Z-coordinates) were non-dimensionalized against water depth, yielding the normalized vertical position Z*.
To better evaluate and predict the influence of sediment deposition on the upstream migration ratio and swimming position (positive Z-axis direction) of carp in the fishway model, their respective linear regression models were obtained using multiple linear regression analysis. In the models, y1 denotes the carp migrating ratio, and y2 indicates Z* after the dimensionless Z-coordinate. x1 represents the mean sediment deposition height (after non-dimensionalization), and x2 denotes the mean slope of the silted terrain.
Model A:
y 1 = 88.997 148.63 x 1 0.077 x 2
Model B:
y 2 = 0.147 + 0.936 x 1 0.001 x 2
Table 5 shows that the coefficients of determination (R2) for models A and B were 0.996 and 0.983, respectively, indicating that mean sediment height and slope collectively explained 99.6% of the variation in upstream migration ratio and 98.3% of the variation in Z-axis trajectory displacement. Furthermore, the Durbin-Watson values for both models (1.225 and 2.651) suggest no significant residual autocorrelation. Table 6 additionally demonstrates that all VIF for independent variables in models A and B remained below 10, confirming negligible multicollinearity issues. Together, these tests affirm robust model fit performance.
Model results revealed that a 0.1-unit increase in H* reduced upstream migration ratio by 14.86% while shifting Z* by + 1.47 cm along the Z-axis. Conversely, each unit increase in silted terrain mean slope decreased migration ratio by 0.08% and displaced Z* by −0.1 cm vertically. Critically, Table 6 standardized coefficients analysis shows larger absolute Beta values for mean height in both models, signifying its greater influence on migration ratio and Z-axis position dynamics compared to the relatively minor impact of mean slope.

4. Discussions

4.1. Changes in Hydraulic Characteristics of the Pools

The flow regime within the vertical slot fishway is critical in determining its hydraulic performance [44]. Sedimentation-induced alterations in the bed morphology inevitably affect the flow structure inside the fishway, thereby impacting the upstream passage efficiency of fish. This study reveals that sediment deposition affects the hydraulic parameters of the fishway. The observed deposition patterns modify the boundary conditions within the pools, which, in turn, reshape the flow topology, altering the extent of the recirculation zone, vortex intensity, and velocity distribution in the core area. Flow velocity serves as a primary regulatory factor for sediment transport capacity [45], where its dynamic variations directly govern sediment transport processes within fishway pools. This study observed non-uniform sediment deposition distribution, notably concentrated in pool recirculation zones. Such deposition induces flow pattern spatial reorganization [46], manifesting as mainstream area expansion and recirculation zone contraction, ultimately forming an asymmetric flow field with vertically oriented vortex structures. Consequently, these morphological changes reduce recirculation zone area while attenuating mainstream flow velocities, cumulatively diminishing sediment transport capacity. Additionally, reduced velocities accelerate sedimentation in low-flow-velocity zones (e.g., recirculation zone peripheries) [47], heightening risks of progressive vertical-slot entrance blockages that obstruct migration pathways. Critically, this initiates a self-reinforcing positive feedback cycle: deposition → energy attenuation → accelerated deposition.

4.2. Changes in Fish Migration Behavior

During upstream migration, fish exhibit significant avoidance behavior in high-flow-rate and high-turbulent-kinetic-energy zones [48]. This mechanism primarily stems from locomotory instability and elevated energy expenditure under such conditions [49,50], compounded by impaired upstream path identification [13,51]. Sediment-induced hydrodynamic alterations further disrupt migration behavior: recirculation zone contraction reduces critical resting areas. Notably, fatigued fish preferentially utilize low-velocity recirculation zones for recovery [52] before re-entering the mainstream to continue ascent, highlighting this zone’s functional importance. However, post-deposition recirculation area shrinkage compromises rest-suspension capacity during migration, potentially forcing sustained high-effort swimming that elevates fatigue risk. Secondarily, altered flow-field characteristics impair hydrodynamic perception and path selection. Specifically, vertical-section vortices increase directional perception errors [53,54,55], causing migration path misidentification, increased upstream resistance, reorientation attempts, and elevated energy expenditure. Moreover, fish depend on lateral-line systems to detect flow. Structural flow imbalances between mainstream and recirculation zones can trigger migration route misjudgment and disorientation [56]. Critically, while TKE reduction decreases juvenile fish energy consumption, attenuated turbulence gradients weaken hydrodynamic directional cues, increasing navigation difficulty. Collectively, these interactions diminish fish passage efficiency. This paradoxically explains why reduced migration resistance can increase ascent duration and decrease passage success rates under certain conditions.
Owing to minimal vertical variation in water depth within vertical slot fishway pools and uniform vertical pressure distribution, migrating fish exhibit limited vertical behavioral adaptations in response to pressure changes [43]. Studies indicate that when the fishway slope is below 5%, hydraulic characteristics exhibit insignificant variation across depths, demonstrating distinct two-dimensional properties [57]. Moreover, fish predominantly utilize the bottom region of vertical slot fishways [58,59], consistent with our experimental observations. Under all upstream conditions, although high flow velocities occurred in the vertical slot region, carp trajectories were concentrated near the pool floor. This pattern resulted from the absence of sediment deposition and limited variation in effective water depth, thereby validating the observed trajectory characteristics of experimental fish in this study. However, sediment deposition significantly altered this behavioral pattern. A distinct clockwise vortex emerged in the X-Z plane flow field, provoking notable Z-direction displacement in carp swimming positions. Furthermore, the deposition not only constricted fish swimming space, but also reduced flow velocities and induced streamline disorganization within the pool. This disruption impairs the fish’s ability to perceive flow direction. Consequently, the carp’s preferred ascent path deviated from the energetically optimal route, diminishing migration efficiency.

4.3. Correlation and Multiple Linear Regression Analysis

Existing studies have demonstrated that even subtle variations in the macroscopic roughness or structural dimensions of a fishway can significantly alter its internal flow regime, thereby affecting fish swimming trajectories and energy expenditure [60,61]. In conjunction with the findings of this study, non-uniform sediment deposition creates asymmetric and heterogeneous flow environments across different pools of the fishway. To adapt to such dynamic conditions, fish may need to continuously adjust their swimming paths and strategies, which directly impacts the continuity of their passage through the fishway and the likelihood of successful upstream migration. Fish swimming behavior exhibits high maneuverability. By rationally allocating energy expenditure based on flow field distribution within the pool, fish adapt their swimming modes to surrounding hydraulic conditions, selecting energetically favorable paths to minimize hydraulic resistance and energy demands [62]. In the present study, correlation analysis between carp migration trajectories and hydraulic factors revealed that before and after sediment deposition, carp consistently favored low-velocity, low-turbulence zones to optimize energy conservation. However, under severe deposition conditions, although fish experienced reduced flow resistance, their backtracking rate decreased to 48%. This tension between energy conservation and hydraulic adaptability demonstrates sedimentation’s multifaceted impact on migration: deposition not only imposes physical barriers, but also reduces passage efficiency through increased flow complexity, diminished direction perception, and constrained behavioral adaptability [63]. Furthermore, multiple linear regression analyses quantified the effects of deposition parameters (thickness, spatial distribution) on carp upstream rates and vertical trajectories. Sediment thickness emerged as a significant negative predictor of upstream success, while differential behavioral responses to deposition parameters were observed. Notably, existing regression studies of fish behavior predominantly emphasize environmental variables like hydraulics, temperature, and dissolved oxygen [64], with limited attention to sedimentary factors. Consequently, this study provides empirical support for optimizing anti-sedimentation designs in fishways and establishing evidence-based dredging thresholds.

5. Conclusions

This study investigated sediment deposition effects on hydraulic characteristics and fish migration in vertical fishways through integrated carp migration experiments and numerical flow simulations. It strictly adhered to Froude similarity criteria in its model design. All dimensional results can be scaled to the prototype using established scaling ratios. Through this conversion, our model study quantitatively predicts performance metrics under real-world engineering conditions, providing direct data support and scientific basis for the design of actual engineering projects.
Post deposition, altered hydraulic conditions manifested as flow pattern disorganization within pools. Critically, the recirculation zone area contracted, while concurrently, the velocity field exhibited systemic attenuation. Specifically, maximum main-flow-zone velocity decreased by 25% relative to pre-deposition conditions, reducing flow sediment transport capacity.
Moreover, sediment accumulation inversely correlated with carp upstream migration rates. Post-deposition migratory behavior displayed notable disruptions: migration trajectories elongated, primary activity zones expanded, and upstream transit duration increased, thereby elevating energy expenditure and further depressing migration rates. Additionally, deposition altered carp bottom-orientation preferences, inducing upward-biased Z-direction trajectories.
Significantly, multiple linear regression analysis of deposition metrics (mean height H*, mean slope) against migration ratio and vertical position Z* confirmed H* exerts dominant influence on both response variables, whereas mean slope effects were negligible.
Conclusively, sediment deposition impedes carp migration; severe accumulation causes functional impairment. Future research should therefore elucidate coupled sediment-flow-fish interaction mechanisms to advance behavioral hydraulics theory, thereby optimizing fishway design and operation for ecological sustainability.

Author Contributions

Z.N.: Conceptualization, Methodology, Formal analysis, Writing—original draft. J.C.: Resources, Formal analysis, Writing—review and editing, Funding acquisition. C.J.: Conceptualization, Supervision. Y.L.: Data curation, Writing—review and editing. T.D.: Visualization, Writing—review and editing. Y.C.: Writing—review and editing. B.D.: Writing—review and editing. W.M.: Writing—review and editing. All authors have read and agreed to the published version of the manuscript.

Funding

This study was financially supported by the National Natural Science Foundation of China (Grant No. 52271257), the Natural Science Foundation of Hunan Province (Grant No. 2022JJ10047) and the Technological Innovation Project of Quanmutang Reservoir Engineering (Grant No. 2022430119001440).

Institutional Review Board Statement

The animal study protocol was approved by Changsha University of Science and Technology (Approval Date: 23 October 2025).

Informed Consent Statement

Not applicable.

Data Availability Statement

Data are contained within the article.

Acknowledgments

The authors thank all the students and staff who contributed to and supported the entire study and anonymous peer reviewers who provided constructive critique.

Conflicts of Interest

The authors declare that they have no known competing financial interests or personal relationships that could have appeared to influence the work reported in this paper.

Abbreviations

The following abbreviations are used in this manuscript:
ADVAcoustic Doppler Velocimetry
RANSReynolds-averaged Navier–Stokes
VSFVirtual Switch Framework
TruVOFTrue Volume of Fluid
GMRESGeneralized Minimal Residual
TKETurbulent Kinetic Energy
VIFVariance Inflation Factors

References

  1. Mao, X. Review of fishway research in China. Ecol. Eng. 2018, 115, 91–95. [Google Scholar] [CrossRef]
  2. He, F.; Zarfl, C.; Tockner, K.; Olden, J.D.; Campos, Z.; Muniz, F.; Svenning, J.-C.; Jähnig, S.C. Hydropower impacts on riverine biodiversity. Nat. Rev. Earth Environ. 2024, 5, 755–772. [Google Scholar] [CrossRef]
  3. Verhelst, P.; Reubens, J.; Buysse, D.; Goethals, P.; Van Wichelen, J.; Moens, T. Toward a roadmap for diadromous fish conservation: The Big Five considerations. Front. Ecol. Environ. 2021, 19, 396–403. [Google Scholar] [CrossRef]
  4. Li, M.; Shi, X.; Jin, Z.; Ke, S.; Lin, C.; An, R.; Li, J.; Katopodis, C.; Ne, L. Behaviour and ability of a cyprinid (Schizopygopsis younghusbandi) to cope with accelerating flows when migrating downstream. River Res. Appl. 2020, 37, 1168–1179. [Google Scholar] [CrossRef]
  5. Wu, H.; Chen, J.; Xu, J.; Zeng, G.; Sang, L.; Liu, Q.; Yin, Z.; Dai, J.; Yin, D.; Liang, J.; et al. Effects of dam construction on biodiversity: A review. J. Clean. Prod. 2019, 221, 480–489. [Google Scholar] [CrossRef]
  6. Yang, X.; Shi, H.; Liu, X.; Ou, Y.; Liu, X.; Li, M.; Yuan, Q. Effect of total dissolved gas supersaturation on the passage behavior of silver carp (Hypophthalmichthys molitrix) and ya-fish (Schizothorax prenanti) through an experimental vertical slot fishway. Ecotoxicol. Environ. Saf. 2024, 277, 116370. [Google Scholar] [CrossRef] [PubMed]
  7. Barbarossa, V.; Schmitt, R.J.P. Strategic restoration-development mitigates tradeoffs between hydropower and fish habitat fragmentation in the Mekong. One Earth 2024, 7, 1096–1107. [Google Scholar] [CrossRef]
  8. Katopodis, C.; Cai, L.; Johnson, D. Sturgeon survival: The role of swimming performance and fish passage research. Fish. Res. 2019, 212, 162–171. [Google Scholar] [CrossRef]
  9. Bravo Córdoba, F.; García-Vega, A.; Fuentes-Pérez, J.; Celestino, L.; Makrakis, S.; Sanz-Ronda, F. Bidirectional connectivity in fishways: A mitigation for impacts on fish migration of small hydropower facilities. Aquat. Conserv. Mar. Freshw. Ecosyst. 2023, 33, 549–565. [Google Scholar] [CrossRef]
  10. Chorda, J.; Maubourguet, M.M.; Roux, H.; Larinier, M.; Tarrade, L.; David, L. Two-dimensional free surface flow numerical model for vertical slot fishways. J. Hydraul. Res. 2010, 48, 141–151. [Google Scholar] [CrossRef]
  11. Li, G.; Sun, S.; Liu, H.; Zheng, T. Schizothorax prenanti swimming behavior in response to different flow patterns in vertical slot fishways with different slot positions. Sci. Total Environ. 2021, 754, 142142. [Google Scholar] [CrossRef] [PubMed]
  12. Rajaratnam, N.; Vinne, G.; Katopodis, C. Hydraulics of Vertical Slot Fishways. J. Hydraul. Eng. 1986, 112, 909–927. [Google Scholar] [CrossRef]
  13. Marriner, B.A.; Baki, A.B.M.; Zhu, D.Z.; Cooke, S.J.; Katopodis, C. The hydraulics of a vertical slot fishway: A case study on the multi-species Vianney-Legendre fishway in Quebec, Canada. Ecol. Eng. 2016, 90, 190–202. [Google Scholar] [CrossRef]
  14. Rajaratnam, N.; Katopodis, C.; Solanki, S. New design for vertical slot fishways. Can. J. Civ. Eng. 2011, 19, 402–414. [Google Scholar] [CrossRef]
  15. Khan, L. A three-dimensional computational fluid dynamics (CFD) model analysis of free surface hydrodynamics and fish passage energetics in a vertical-slot fishway. N. Am. J. Fish. Manag. 2006, 26, 255–267. [Google Scholar] [CrossRef]
  16. Sanagiotto, D.; Rossi, J.; Lauffer, L.; Bravo, J. Three-dimensional numerical simulation of flow in vertical slot fishways: Validation of the model and characterization of the flow. RBRH 2019, 24, e20. [Google Scholar] [CrossRef]
  17. Liao, L.; Chen, M.; An, R.; Li, J.; Tang, X.; Yan, Z. Identifying three-dimensional swimming corridors for fish to match their swimming characteristics under different hydropower plant operations: Optimization of entrance location for fish-passing facilities. Sci. Total Environ. 2022, 822, 153599. [Google Scholar] [CrossRef] [PubMed]
  18. Sun, L.; Liao, L.; Chen, M.; Li, J.; An, R. Relation between fish morphological differentiation and pressure drag difference. Ecol. Indic. 2023, 156, 111071. [Google Scholar] [CrossRef]
  19. Liao, L.; Li, J.; Chen, M.; An, R. Effects of hydraulic cues in barrier environments on fish navigation downstream of dams. J. Environ. Manag. 2024, 365, 121495. [Google Scholar] [CrossRef]
  20. Katopodis, C.; Williams, J.G. The development of fish passage research in a historical context. Ecol. Eng. 2012, 48, 8–18. [Google Scholar] [CrossRef]
  21. Li, G.; Sun, S.; Zhang, C.; Liu, H.; Zheng, T. Evaluation of flow patterns in vertical slot fishways with different slot positions based on a comparison passage experiment for juvenile grass carp. Ecol. Eng. 2019, 133, 148–159. [Google Scholar] [CrossRef]
  22. Plesiński, K.; Bylak, A.; Radecki-Pawlik, A.; Mikołajczyk, T.; Kukuła, K. Possibilities of fish passage through the block ramp: Model-based estimation of permeability. Sci. Total Environ. 2018, 631–632, 1201–1211. [Google Scholar] [CrossRef]
  23. Schenk, L.; Bragg, H. Sediment transport, turbidity, and dissolved oxygen responses to annual streambed drawdowns for downstream fish passage in a flood control reservoir. J. Environ. Manag. 2021, 295, 113068. [Google Scholar] [CrossRef]
  24. Pennock, C.; Bender, D.; Hofmeier, J.; Travis, J.; Waters, R.; Weaver, V.; Gido, K. Can fishways mitigate fragmentation effects on Great Plains fish communities? Can. J. Fish. Aquat. Sci. 2017, 75, 121–130. [Google Scholar] [CrossRef]
  25. Chen, S.C.; Wang, S.C.; Tfwala, S.S. Hydraulics driven upstream migration of Taiwanese indigenous fishes in a fish-bone-type fishway. Ecol. Eng. 2017, 108, 179–193. [Google Scholar] [CrossRef]
  26. Guo, J.; Rui, J.L. Question and Suggestion on Fishway Construction in China: Lesson Learned from the Operation of Yangtang Lock Fishway. Water Power 2010, 36, 8–10+19. [Google Scholar] [CrossRef]
  27. Wu, X.C.; Shi, J.Q. Construction and management of fish passage on Shaliu River adjacent to Qinghai Lake based on ecological restoration. Trans. Chin. Soc. Agric. Eng. 2014, 30, 130–136. [Google Scholar] [CrossRef]
  28. Chang, W.Y.; Lien, H.C.; Lee, L.C.; Tsai, W.F.; Lai, J.S.; Tan, Y.C.; Guo, W.D. Simulations of 3D flow and sediment transport in a fishway. In Proceedings of the 19th IASTED International Conference on Modelling and Simulation, Québec City, QC, Canada, 26–28 May 2008; ACTA Press: Anaheim, CA, USA, 2008; pp. 187–192. Available online: https://dl.acm.org/doi/10.5555/1722520.1722556 (accessed on 7 October 2025).
  29. Mumot, J.; Tymiński, T. Hydraulic research of sediment transport in the vertical slot fish passes. J. Ecol. Eng. 2016, 17, 143–148. [Google Scholar] [CrossRef]
  30. Tymiński, T.; Xia, J.-X.; Mumot, J.; Karpowicz, D. Sedimentation of load in a step-pool rock ramp fishway with biotechnical embedded elements. Meteorol. Hydrol. Water Manag. 2017, 5, 35–42. [Google Scholar] [CrossRef]
  31. Yasuda, Y.; Ohnishi, T.; Ohtsu, I. Flow Characteristics of Pool-Type Fishway with Trapezoidal Section. In Advances in Water Resources & Hydraulic Engineering, Proceedings of the 16th IAHR-APD Congress and 3rd Symposium of IAHR-ISHS, Nanjing, China, 20–23 October 2008; Altinakar, M., Kokpinar, M.A., Darama, Y., Yegen, I., Harman, I.Y., Eds.; Springer: Berlin/Heidelberg, Germany, 2009; pp. 345–352. [Google Scholar] [CrossRef]
  32. Cong, J.; Cui, D.; Yu, F.; Wang, J.Y.; Xie, L.Q. Hydromechanical analysis of desilting mechanism of ecological arc-shaped baffle fishway. Adv. Mater. Res. 2012, 511, 154–158. [Google Scholar] [CrossRef]
  33. Duguay, J.; Foster, B.; Lacey, J.; Castro-Santos, T. Sediment infilling benefits rainbow trout passage in a baffled channel. Ecol. Eng. 2018, 125, 38–49. [Google Scholar] [CrossRef]
  34. Hu, Q.; Miao, J.S.; Li, S.Z.; Liu, C.L.; Su, X.H. Study on the Growth Characteristics of Carp in Jili Lake. Xinjiang Farm Res. Sci. Technol. 2018, 41, 28–30. [Google Scholar]
  35. Katopodis, C.; Gervais, R. Fish Swimming Performance Database and Analyses; Canadian Science Advisory Secretariat: Ottawa, ON, Canada, 2016. [Google Scholar]
  36. Beamish, F.W.H. 2—Swimming Capacity. Fish Physiol. 1978, 7, 101–187. [Google Scholar] [CrossRef]
  37. Tan, J.; Liu, Z.; Wang, Y.; Wang, Y.; Ke, S.; Shi, X. Analysis of Movements and Behavior of Bighead Carps (Hypophthalmichthys nobilis) Considering Fish Passage Energetics in an Experimental Vertical Slot Fishway. Animals 2022, 12, 1725. [Google Scholar] [CrossRef]
  38. Snyder, R.J. Physiological Ecology of Pacific Salmon. Trans. Am. Fish. Soc. 1996, 125, 819–820. [Google Scholar] [CrossRef]
  39. Pettersson, L.B.; Brönmark, C. Energetic consequences of an inducible morphological defence in crucian carp. Oecologia 1999, 121, 12–18. [Google Scholar] [CrossRef]
  40. FLOW-3D®, Version 2023R1; Software for Computational Fluid Dynamics; Flow Science, Inc.: Santa Fe, NM, USA, 2023.
  41. Quaresma, A.L.; Romão, F.; Branco, P.; Ferreira, M.T.; Pinheiro, A.N. Multi Slot Versus Single Slot Pool-Type Fishways: A Modelling Approach to Compare Hydrodynamics. Ecol. Eng. 2018, 122, 197–206. [Google Scholar] [CrossRef]
  42. Northcutt, R.G. Evolution of Gnathostome Lateral Line Ontogenies. Brain Behav. Evol. 1997, 50, 25–37. [Google Scholar] [CrossRef] [PubMed]
  43. Silva, A.T.; Katopodis, C.; Santos, J.M.; Ferreira, M.T.; Pinheiro, A.N. Cyprinid Swimming Behaviour in Response to Turbulent Flow. Ecol. Eng. 2012, 44, 314–328. [Google Scholar] [CrossRef]
  44. Yan, X.; Jin, J.; Zheng, T.; Sun, S.; Dai, H.; Dai, L.; Shi, K. The Effect of Rectifier Baffles on the Flow Regime of 180° Turning Pools in Vertical Slot Fishways. Sustainability 2023, 15, 10498. [Google Scholar] [CrossRef]
  45. Zheng, J.; Li, R.J.; Yu, Y.H. Sediment Carrying Capacity and Sediment Flux of Nearshore Water-Sediment Interface. Acta Oceanol. Sin. 2014, 36, 136. [Google Scholar] [CrossRef]
  46. Camnasio, E.; Erpicum, S.; Orsi, E.; Pirotton, M.; Schleiss, A.J.; Dewals, B. Coupling Between Flow and Sediment Deposition in Rectangular Shallow Reservoirs. J. Hydraul. Res. 2013, 51, 535–547. [Google Scholar] [CrossRef]
  47. Tao, J.; Tan, X.; Yang, Z.; Wang, X.; Cai, Y.; Qiao, Y.; Chang, J. Fish Migration Through a Fish Passage Associated with Water Velocities at the Changzhou Fishway (Pearl River, China). J. Appl. Ichthyol. 2014, 31, 72–76. [Google Scholar] [CrossRef]
  48. Liao, J.C. A Review of Fish Swimming Mechanics and Behaviour in Altered Flows. Philos. Trans. R. Soc. B 2007, 362, 1973–1993. [Google Scholar] [CrossRef] [PubMed]
  49. Silva, A.T.; Bærum, K.M.; Hedger, R.D.; Baktoft, H.; Fjeldstad, H.-P.; Gjelland, K.Ø.; Økland, F.; Forseth, T. The Effects of Hydrodynamics on the Three-Dimensional Downstream Migratory Movement of Atlantic Salmon. Sci. Total Environ. 2020, 705, 135773. [Google Scholar] [CrossRef]
  50. Hoover, A.P.; Tytell, E. Decoding the Relationships between Body Shape, Tail Beat Frequency, and Stability for Swimming Fish. Fluids 2020, 5, 215. [Google Scholar] [CrossRef]
  51. Shi, X.T.; Deng, X.Y.; Chen, X.L.; Jiang, Y.Q.; Wang, Y.; Hu, X.; Tan, J.J. Simulation of the Upstream Behavior of Schizothorax wangchiachii in Vertical Slot Fishway. Trans. Chin. Soc. Agric. Eng. 2025, 41, 175–184. [Google Scholar] [CrossRef]
  52. Li, M.; An, R.; Chen, M.; Li, J. Evaluation of Volitional Swimming Behavior of Schizothorax prenanti Using an Open-Channel Flume with Spatially Heterogeneous Turbulent Flow. Animals 2022, 12, 752. [Google Scholar] [CrossRef]
  53. Tritico, H.M.; Cotel, A.J. The Effects of Turbulent Eddies on the Stability and Critical Swimming Speed of Creek Chub (Semotilus atromaculatus). J. Exp. Biol. 2010, 213, 2284–2293. [Google Scholar] [CrossRef]
  54. Wu, Z.; Yang, Z.Y.; Shi, X.T.; Jiang, Y.Q.; Chen, L.; Jin, Z.J. The Reentry Behavior and Its Relationship with Hydraulic Conditions During Upstream Migration of Schizothorax o’connori. Chin. J. Ecol. 2019, 38, 3382–3393. Available online: https://www.cje.net.cn/CN/Y2019/V38/I11/3382 (accessed on 7 October 2025).
  55. Shen, C.Y.; Yang, R.G.; Shi, X.T.; Wang, M.M.; He, S.H. Vortex Identification Based on the Liutex Method and Its Effect on Fish Passage Upstream. J. Hydrodyn. 2024, 36, 130–141. [Google Scholar] [CrossRef]
  56. Tan, J.; Gao, Z.; Dai, H.; Yang, Z.; Shi, X. Effects of turbulence and velocity on the movement behaviour of bighead carp (Hypophthalmichthys nobilis) in an experimental vertical slot fishway. Ecol. Eng. 2019, 127, 363–374. [Google Scholar] [CrossRef]
  57. Wu, S.; Rajaratnam, N.; Katopodis, C. Structure of Flow in Vertical Slot Fishway. J. Hydraul. Eng. 1999, 125, 351–360. [Google Scholar] [CrossRef]
  58. Guiny, E.; Ervine, D.A.; Armstrong, J. Hydraulic and Biological Aspects of Fish Passes for Atlantic Salmon. J. Hydraul. Eng. 2005, 131, 542–550. [Google Scholar] [CrossRef]
  59. Fuentes-Pérez, J.F.; Eckert, M.; Tuhtan, J.A.; Ferreira, M.T.; Kruusmaa, M.; Branco, P. Spatial preferences of Iberian barbel in a vertical slot fishway under variable hydrodynamic scenarios. Ecol. Eng. 2018, 125, 131–142. [Google Scholar] [CrossRef]
  60. Zheng, T.; Tu, C.; Huang, W.; Ren, W.; Li, G.; Liu, H. Testing Three Vertical Slot Fishway Configurations for a Chinese Endemic Fish. J. Hydraul. Eng. 2023, 149, 04023025. [Google Scholar] [CrossRef]
  61. Ouyang, L.; Li, D.; Cui, S.; Wu, X.; Liu, Y.; Han, X.; Zhou, S.; Xu, G.; Tu, X.; Chen, K.; et al. Fish Swimming Behavior and Strategies Under Different Hydrodynamic Conditions in Fishways with Various Vertical Slot Configurations. Fishes 2025, 10, 415. [Google Scholar] [CrossRef]
  62. Koed, A.; Thorstad, E.B. Long-term effect of radio-tagging on the swimming performance of pikeperch. J. Fish Biol. 2001, 58, 1753–1756. [Google Scholar] [CrossRef]
  63. Cao, C.; Fan, Z.; Wang, Y.; Liu, X.; Shi, H.; Yang, Y. Effects of continuous exposure to total dissolved gas supersaturation on swimming ability and recovery in grass carp (Ctenopharyngodon idella). Ecol. Freshw. Fish 2021, 31, 578–589. [Google Scholar] [CrossRef]
  64. Huang, Y.; Pang, R.; Li, X.; Li, W.; Yang, Z.; Wang, D.; Dong, K. Ecology Health Evaluation System Based on Fish Movement Behavior Response. Water 2023, 15, 4066. [Google Scholar] [CrossRef]
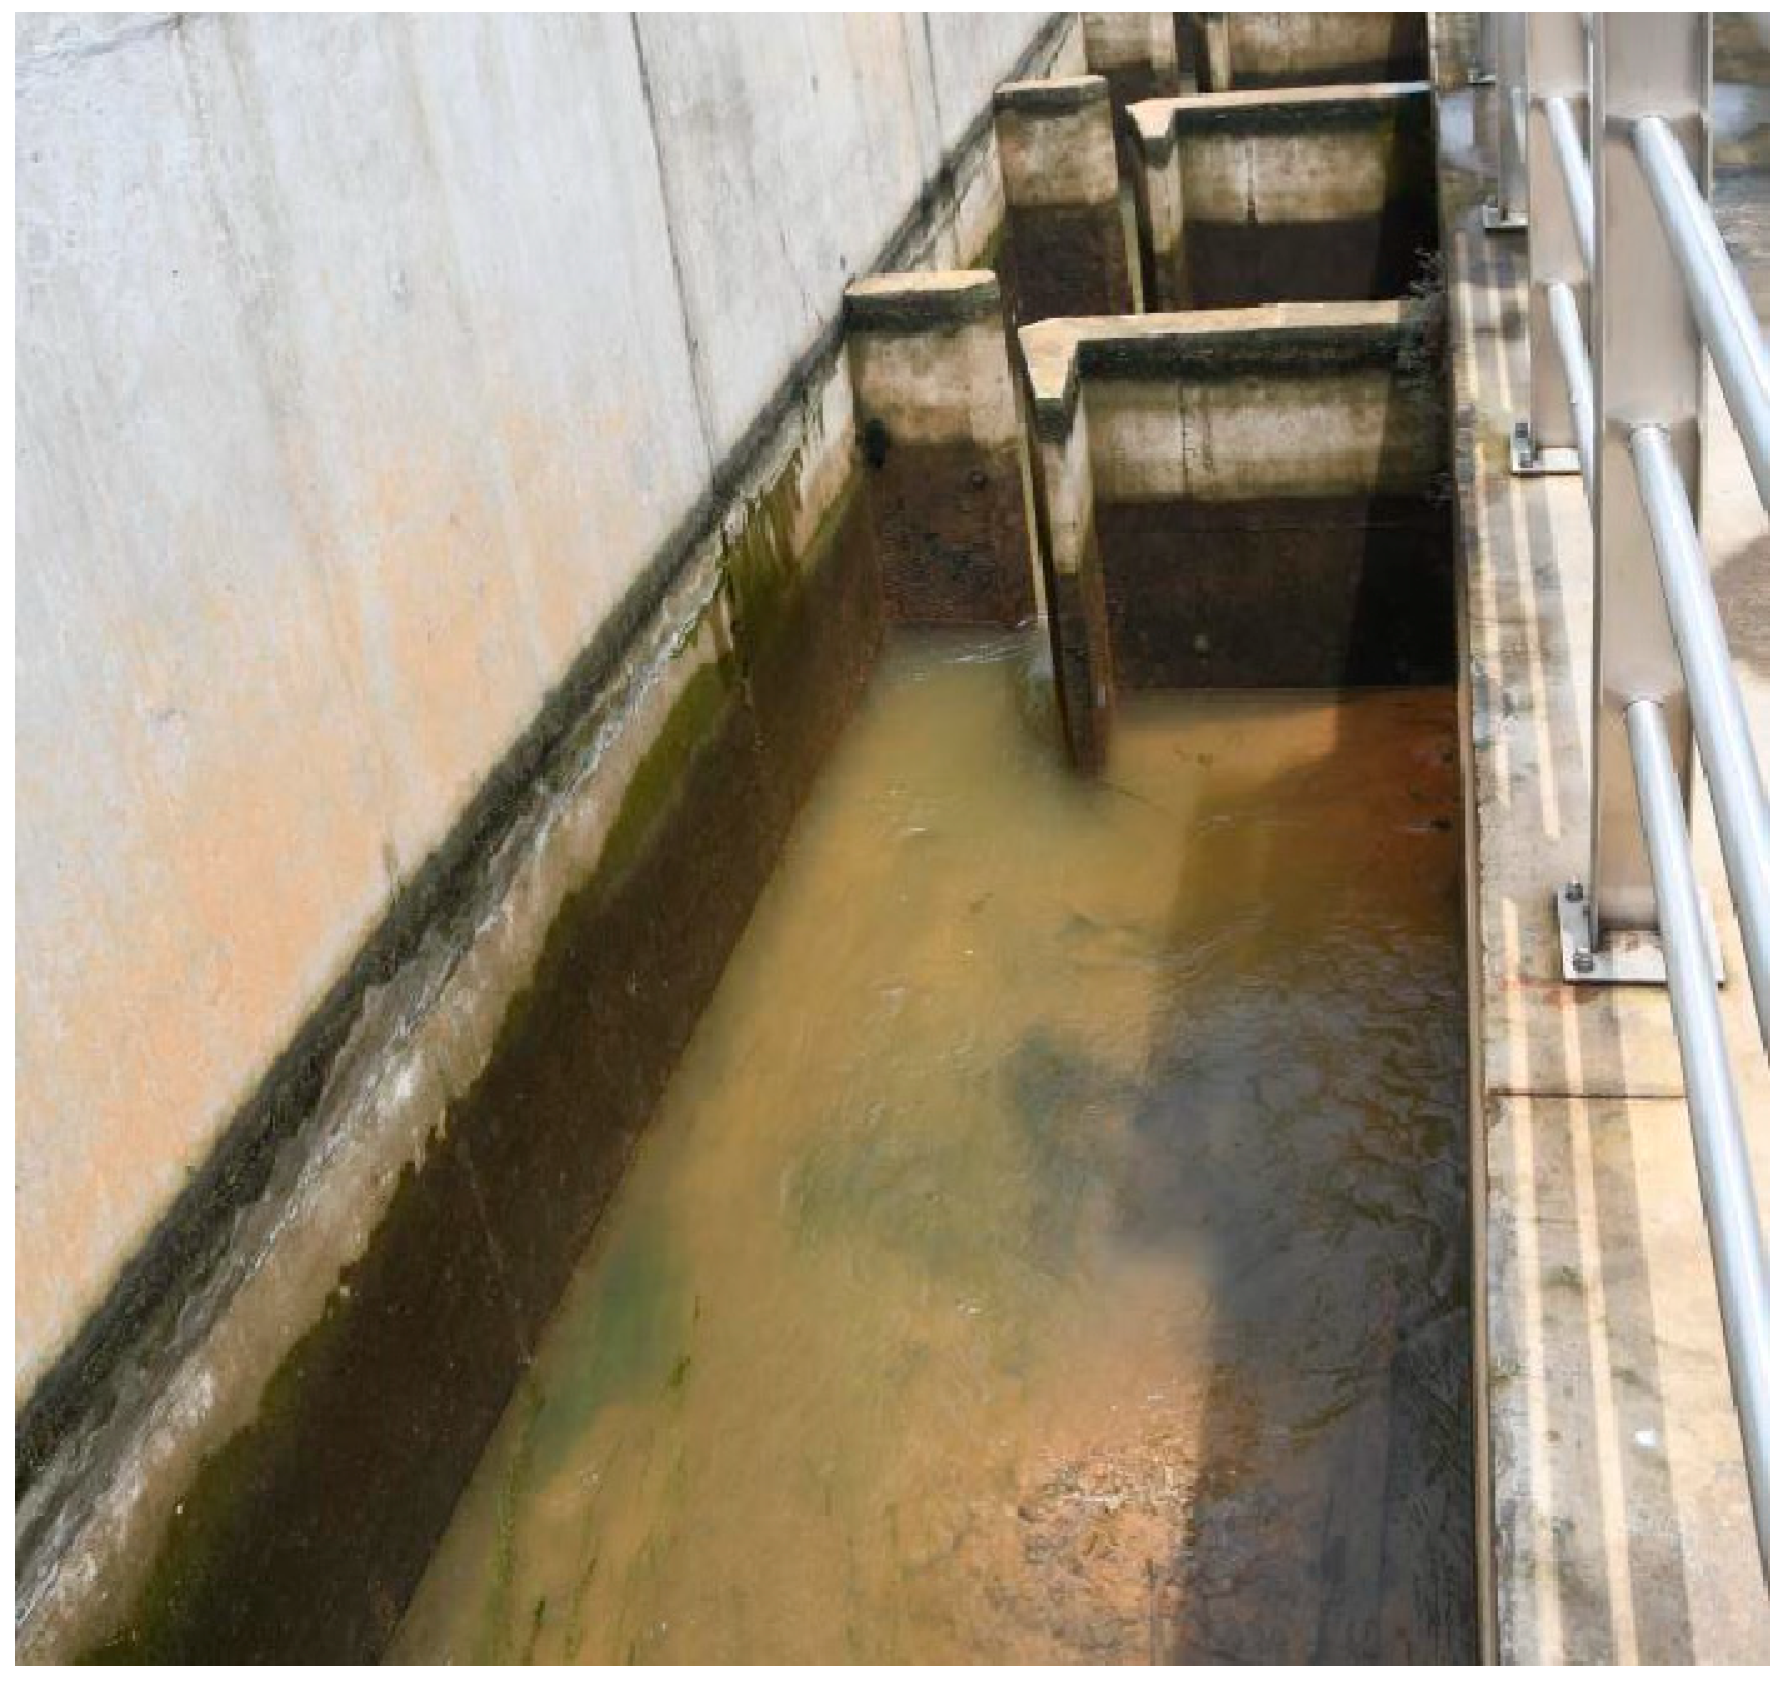
Figure 1. Possible sediment deposition pattern at vertical slot fishway in practical applications.
Fishes 10 00590 g001
Figure 2. Physical model layout (Unit: mm). The blue circle denotes Pool III.
Fishes 10 00590 g002
Figure 3. Layout of the measuring point of the Pool III. Red dots represent verification points.
Fishes 10 00590 g003
Figure 4. Sediment deposition after 7.5 h operation (Q = 14.7 m3/h, h = 25.0 cm): (a) Deposition height per pool; (b) Mean slope and deposition volume per pool; (c) Profile height variation along pool midsections.
Fishes 10 00590 g004
Figure 5. Six sediment deposition conditions with maximum heights: (a) 3 cm, (b) 5 cm, (c) 7 cm, (d) 10 cm, (e) 13 cm, (f) 15 cm.
Fishes 10 00590 g005
Figure 6. Velocity profile comparison at xi = 0.25 m and vertical slot sections.
Fishes 10 00590 g006
Figure 7. (a) The Relationship between upstream migration ratio and sediment deposition characteristics; (b) The relationship between upstream migration duration and sediment deposition characteristics.
Fishes 10 00590 g007
Figure 8. Carp migration trajectories (X-Y plane; Q = 14.7 m3/h, h = 25 cm, no sediment): (a) Pool deposition height; (b) Individual trajectories, Lines of different colors represent distinct fish movement tracks; (c) Fish occurrence frequency (%), red lines represent the main migration path.
Fishes 10 00590 g008
Figure 9. Carp migration trajectories (X-Y plane; Q = 14.7 m3/h, h = 25 cm, max height = 15 cm): (a) Pool deposition height; (b) Individual trajectories, Lines of different colors represent distinct fish movement tracks; (c) Fish occurrence frequency (%), red lines represent the main migration path.
Fishes 10 00590 g009
Figure 10. Carp swimming position adjustment to sediment deposition (X-Z plane).
Fishes 10 00590 g010
Figure 11. Carp migration (X–Z plane; Q = 14.7 m3/h, h = 25 cm, no sediment): (a) Pool deposition height; (b) Occurrence frequency (%), red lines represent the characteristic trajectory.
Fishes 10 00590 g011
Figure 12. Carp migration (X-Z plane; Q = 14.7 m3/h, h = 25 cm, max height = 15 cm): (a) Pool deposition height; (b) Occurrence frequency, red lines represent the characteristic trajectory.
Fishes 10 00590 g012
Figure 13. Flow field at z = 3 cm (Q = 14.7 m3/h, h = 25 cm, no sediment): (a) Pool deposition height; (b) Velocity field; (c) Flow streamlines, arrows represent direction.
Fishes 10 00590 g013
Figure 14. Flow field at z = 3 cm (Q = 14.7 m3/h, h = 25 cm, max height = 15 cm): (a) Pool deposition height; (b) Velocity field; (c) Flow streamlines, arrows represent direction.
Fishes 10 00590 g014
Figure 15. Flow field at y = 7 cm (Q = 14.7 m3/h, h = 25 cm, no sediment): (a) Pool deposition height; (b) Velocity field and streamlines.
Fishes 10 00590 g015
Figure 16. Flow field at y = 7 cm (Q = 14.7 m3/h, h = 25 cm, max height = 15 cm): (a) Pool deposition height; (b) Velocity field and streamlines.
Fishes 10 00590 g016
Figure 17. (ac) represent the flow distribution, flow resistance, and energy consumption of the carp along their migration trajectory under conditions of no sediment deposition and a maximum sediment deposition height of 15 cm, respectively.
Fishes 10 00590 g017
Figure 18. Frequency distribution of carp occurrence vs.: (a) Turbulence energy and velocity (no sediment); (b) Turbulence energy and velocity (max height = 15 cm).
Fishes 10 00590 g018
Figure 19. (a) The upstream migration ratio and mean height, mean slope; (b) The swimming position in z-direction and mean heigh, mean slope.
Fishes 10 00590 g019
Table 1. Condition setting table.
ConditionsSediment Deposition Height (cm)Sediment Deposition Volume (%)Mean Slopes (°)
100.00.0
235.216.1
359.018.3
4711.219.5
51014.224.5
61316.125.8
71520.226.3
Table 2. Grid independence verification.
GridCoarse GridMedium GridFine Grid
Grid size/cm1.000.600.47
Total number of grids1,103,5205,029,84610,646,064
Average relative error9%5%2%
Table 3. Flow resistance and carp energy consumption.
Deposition ConditionsAverage Water Flow Resistance (N)Cumulative Energy Consumption (J)
No sediment deposition1.0 × 10−32.4 × 10⁻³
Maximum sediment deposition8.0 × 10−43.1 × 10⁻³
Table 4. Correlation between fish occurrence frequency and hydraulic factors.
Deposition ConditionsVariablesNominal by Nominal
Phi CoefficientCramer’s VContingency Coefficient
No sediment depositionVelocity6.5320.9960.988
TKE6.1870.9940.987
Maximum sediment depositionVelocity6.6480.9910.989
TKE6.3780.9510.988
Table 5. Model summary.
ModelR2Adjusted R2Std. Error of the EstimateDurbin-Watson
Model A0.9960.9950.9812231.225
Model B0.9830.9740.012812.651
Table 6. Coefficients.
ModelBStd. ErrorBetatToleranceVIF
Model A(Constant)88.9771.967/45.237//
Mean height−148.63021.732−0.949−6.8390.1705.874
Mean slope−0.0770.217−0.049−0.3530.1705.874
Model B(Constant)0.1470.013/11.618//
Mean height0.9360.1391.0746.7180.1705.874
Mean slope−0.0010.001−0.092−0.5740.1705.874
Disclaimer/Publisher’s Note: The statements, opinions and data contained in all publications are solely those of the individual author(s) and contributor(s) and not of MDPI and/or the editor(s). MDPI and/or the editor(s) disclaim responsibility for any injury to people or property resulting from any ideas, methods, instructions or products referred to in the content.