1. Introduction
In recent years, with the rise of concepts such as “AI fisheries” and “fishery informatization,” the application of computer vision technology in tasks such as fish identification, counting, and tracking has demonstrated significant potential, becoming a key technological direction for promoting the modernization and transformation of the fisheries industry. In pelagic fisheries, tuna is an important species targeted by longline fisheries. However, traditional fishery management models are facing severe challenges. For a long time, catch monitoring in longline fisheries has primarily relied on manual records by crew members [
1]. This method is not only inefficient and costly but also suffers from issues of subjectivity, susceptibility to misreporting and underreporting, leading to data reliability problems [
1]. The error rate in manually recorded catch quantities can even range between 20% and 30% [
2]. Such inaccuracies struggle to meet the stringent requirements of modern fishery management for real-time data, accuracy, and transparency. Therefore, to achieve reliable fishing data and scientific conservation of fishery resources, it is crucial to provide automated technical support for “precise fishing monitoring” and “sustainable fishery resource management” in longline fisheries.
Against this backdrop, automated fish counting and tracking technology has become a key link in fishery informatization. Recent related research has shown diversified development in both methods and application scenarios, offering insightful solutions to complex problems encountered in practical fishery monitoring, such as occlusion, motion blur, target overlap, and counting reliability. These technologies can be broadly summarized into two main approaches: counting based on current images and counting based on historical records. They advance automated fish statistics from static and dynamic dimensions, respectively. Early fish counting research primarily used machine learning methods, with the core goal of counting the number of fish in the current frame. For example, studies [
3,
4] employed Gaussian Mixture Models (GMMs) [
5] for background modeling on video sequences to separate moving fish bodies, followed by morphological processing, feature extraction, and matching of the extracted foreground regions to ultimately achieve fish detection and counting. While such traditional machine learning-based methods offered certain advantages in execution speed, their reliance on manual feature extraction and problem-specific feature engineering resulted in significant limitations in accuracy and generalization capability [
6].
In recent years, with the development of deep learning technologies, fish counting research has gradually shifted towards data-driven approaches. Existing work can be categorized into two main routes: one is counting based on the current frame, and the other is counting based on historical records. Counting methods based on the current frame focus on estimating the number of fish from a single image, commonly used in scenarios like aquaculture tanks or fish trays. The core challenge lies in handling adhesion, overlap, and stacking between fish bodies. This category mainly includes two technical paths: one uses object detectors to localize fish and counts the number of bounding boxes to achieve counting; the other uses density map regression to directly predict the number of fish. Object detection methods exhibit stronger adaptability to complex backgrounds and are easier to extend for multi-category counting, but they perform poorly when dealing with dense and overlapping fish schools. To address this, some studies have focused on improving detection performance: for instance, ref. [
7] introduced optical flow information to assist YOLOv5n [
8] in determining fish motion states to enhance its counting ability; ref. [
9] enhanced YOLOv4t’s [
10] capability for detecting small targets to mitigate counting deviations caused by fry adhesion; other research, such as [
11], used instance segmentation technology, assigning instance labels to each pixel to directly distinguish and segment individual fish, significantly improving counting accuracy in stacking and adhesion scenarios. Density map regression methods perform better in handling overlapping and dense fish schools, but their regression accuracy is susceptible to background interference and they are not convenient for directly extending to classified counting. To improve regression accuracy, ref. [
12] focused on enhancing the network’s feature representation capability; refs. [
13,
14] addressed the issue of uneven density distribution, with [
13] proposing a new network structure to improve adaptability to density variations, and [
14] adopting a hierarchical regression strategy to reduce the impact of uneven density distribution on predictions.
The counting route based on historical records focuses on tallying the total number of fish that have appeared in the scene over a period of time. This strategy is typically applied in dynamic scenes such as fishways on dams and fishing vessel decks. Its core idea is to achieve continuous tracking of the same target and stable counting triggers. Key challenges include handling occlusion, avoiding repeated counts, defining effective counting region, and balancing the algorithm’s real-time performance and robustness in complex environments. Depending on the application scenario, the technical focus also varies significantly. In dam fishway scenarios, counting is a typical bidirectional task, requiring separate records of fish numbers moving upstream and downstream. This type of research focuses on enhancing the detection capability of algorithms in underwater blurry, low-contrast environments and addressing adhesion between fish. For example, ref. [
15] set a counting line in the center of the frame combined with an improved YOLOv5 and DeepSORT [
16] algorithm for directional counting, focusing on enhancing the network’s ability to recognize fish deformation and posture changes; while [
17] focused on lightweight design, using a self-developed lightweight network combined with DeepSORT and a counting line mechanism to improve system operational efficiency while ensuring accuracy. In fishing vessel deck scenarios, research pays more attention to the real-time performance, occlusion resistance, and system stability of the method. Ref. [
18] used Mask R-CNN [
19] for instance segmentation to obtain finer catch representations, alleviating occlusion interference, and associated the same object across consecutive frames by setting spatial thresholds as a lightweight tracking strategy, avoiding the high computational cost of complex multi-object tracking algorithms, ultimately counting targets meeting temporal persistence conditions. Ref. [
20] set two collision lines to form a buffer gate mechanism to reduce counting errors caused by occlusion. It is important to note that without limiting the counting trigger region, fish re-entering the frame can easily lead to repeated counts; relying solely on a single collision line trigger usually only counts targets moving in specific directions, leading to insufficient coverage in spacious region. Ref. [
21] research indicates that setting a closed counting region helps to limit the trigger position, improve detection coverage, and effectively reduce counting errors. Furthermore, to reduce occlusion interference, some studies optimized the camera perspective and system structure. Ref. [
22] placed the camera at a higher position, using a near-vertical top-down view to reduce crew occlusion, and combined region counting with the ByteTrack algorithm [
23] for counting; ref. [
24] also followed this approach, installing the camera directly above the fish landing region for vertical shooting, and using a dual-queue structure to coordinate ByteTrack and region counting detection, further improving counting accuracy and system stability.
Although existing research has made significant progress in fish detection, adhesion handling, counting trigger mechanism design, and target tracking in complex scenes, proposing various strategies to mitigate the impact of occlusion on counting, studies specifically aimed at improving counting robustness and tracking stability in practical multi-occlusion environments like fishing vessel decks are still lacking. Therefore, this paper proposes an uncertainty label-driven method for counting tuna catches on fishing vessel decks, specifically optimized for the complex occlusion environment caused by crew operations. The method mainly includes the following four aspects:
- (1)
Setting a closed polygonal counting region to replace traditional single or double-line trigger mechanisms, ensuring effective coverage and counting of catches moving in all directions, improving detection coverage, and reducing under-counting.
- (2)
Introducing an “uncertainty” label mechanism, assigning this label to tuna targets that are difficult to classify clearly, and adopting a low-priority counting strategy in the post-processing stage, providing a safe transitional state for triggering counts, thereby enhancing the counting robustness of the system in occluded and blurry scenarios.
- (3)
Improving the ByteTrack multi-object tracking algorithm by introducing spatio-temporal consistency-based ID continuation mechanisms and anti-label jitter strategies, enhancing the stability of target IDs and classification labels under occlusion, and reducing identity switches and misjudgments caused by occlusion.
- (4)
Optimizing the detection model structure by integrating the architectures of YOLOv10 and YOLOv8 and introducing the C2f-RepGhost module to further improve model efficiency while maintaining the detection accuracy of YOLOv8, making it more suitable for real-time catch counting scenarios.
2. Materials and Methods
2.1. Data Collection and Preprocessing
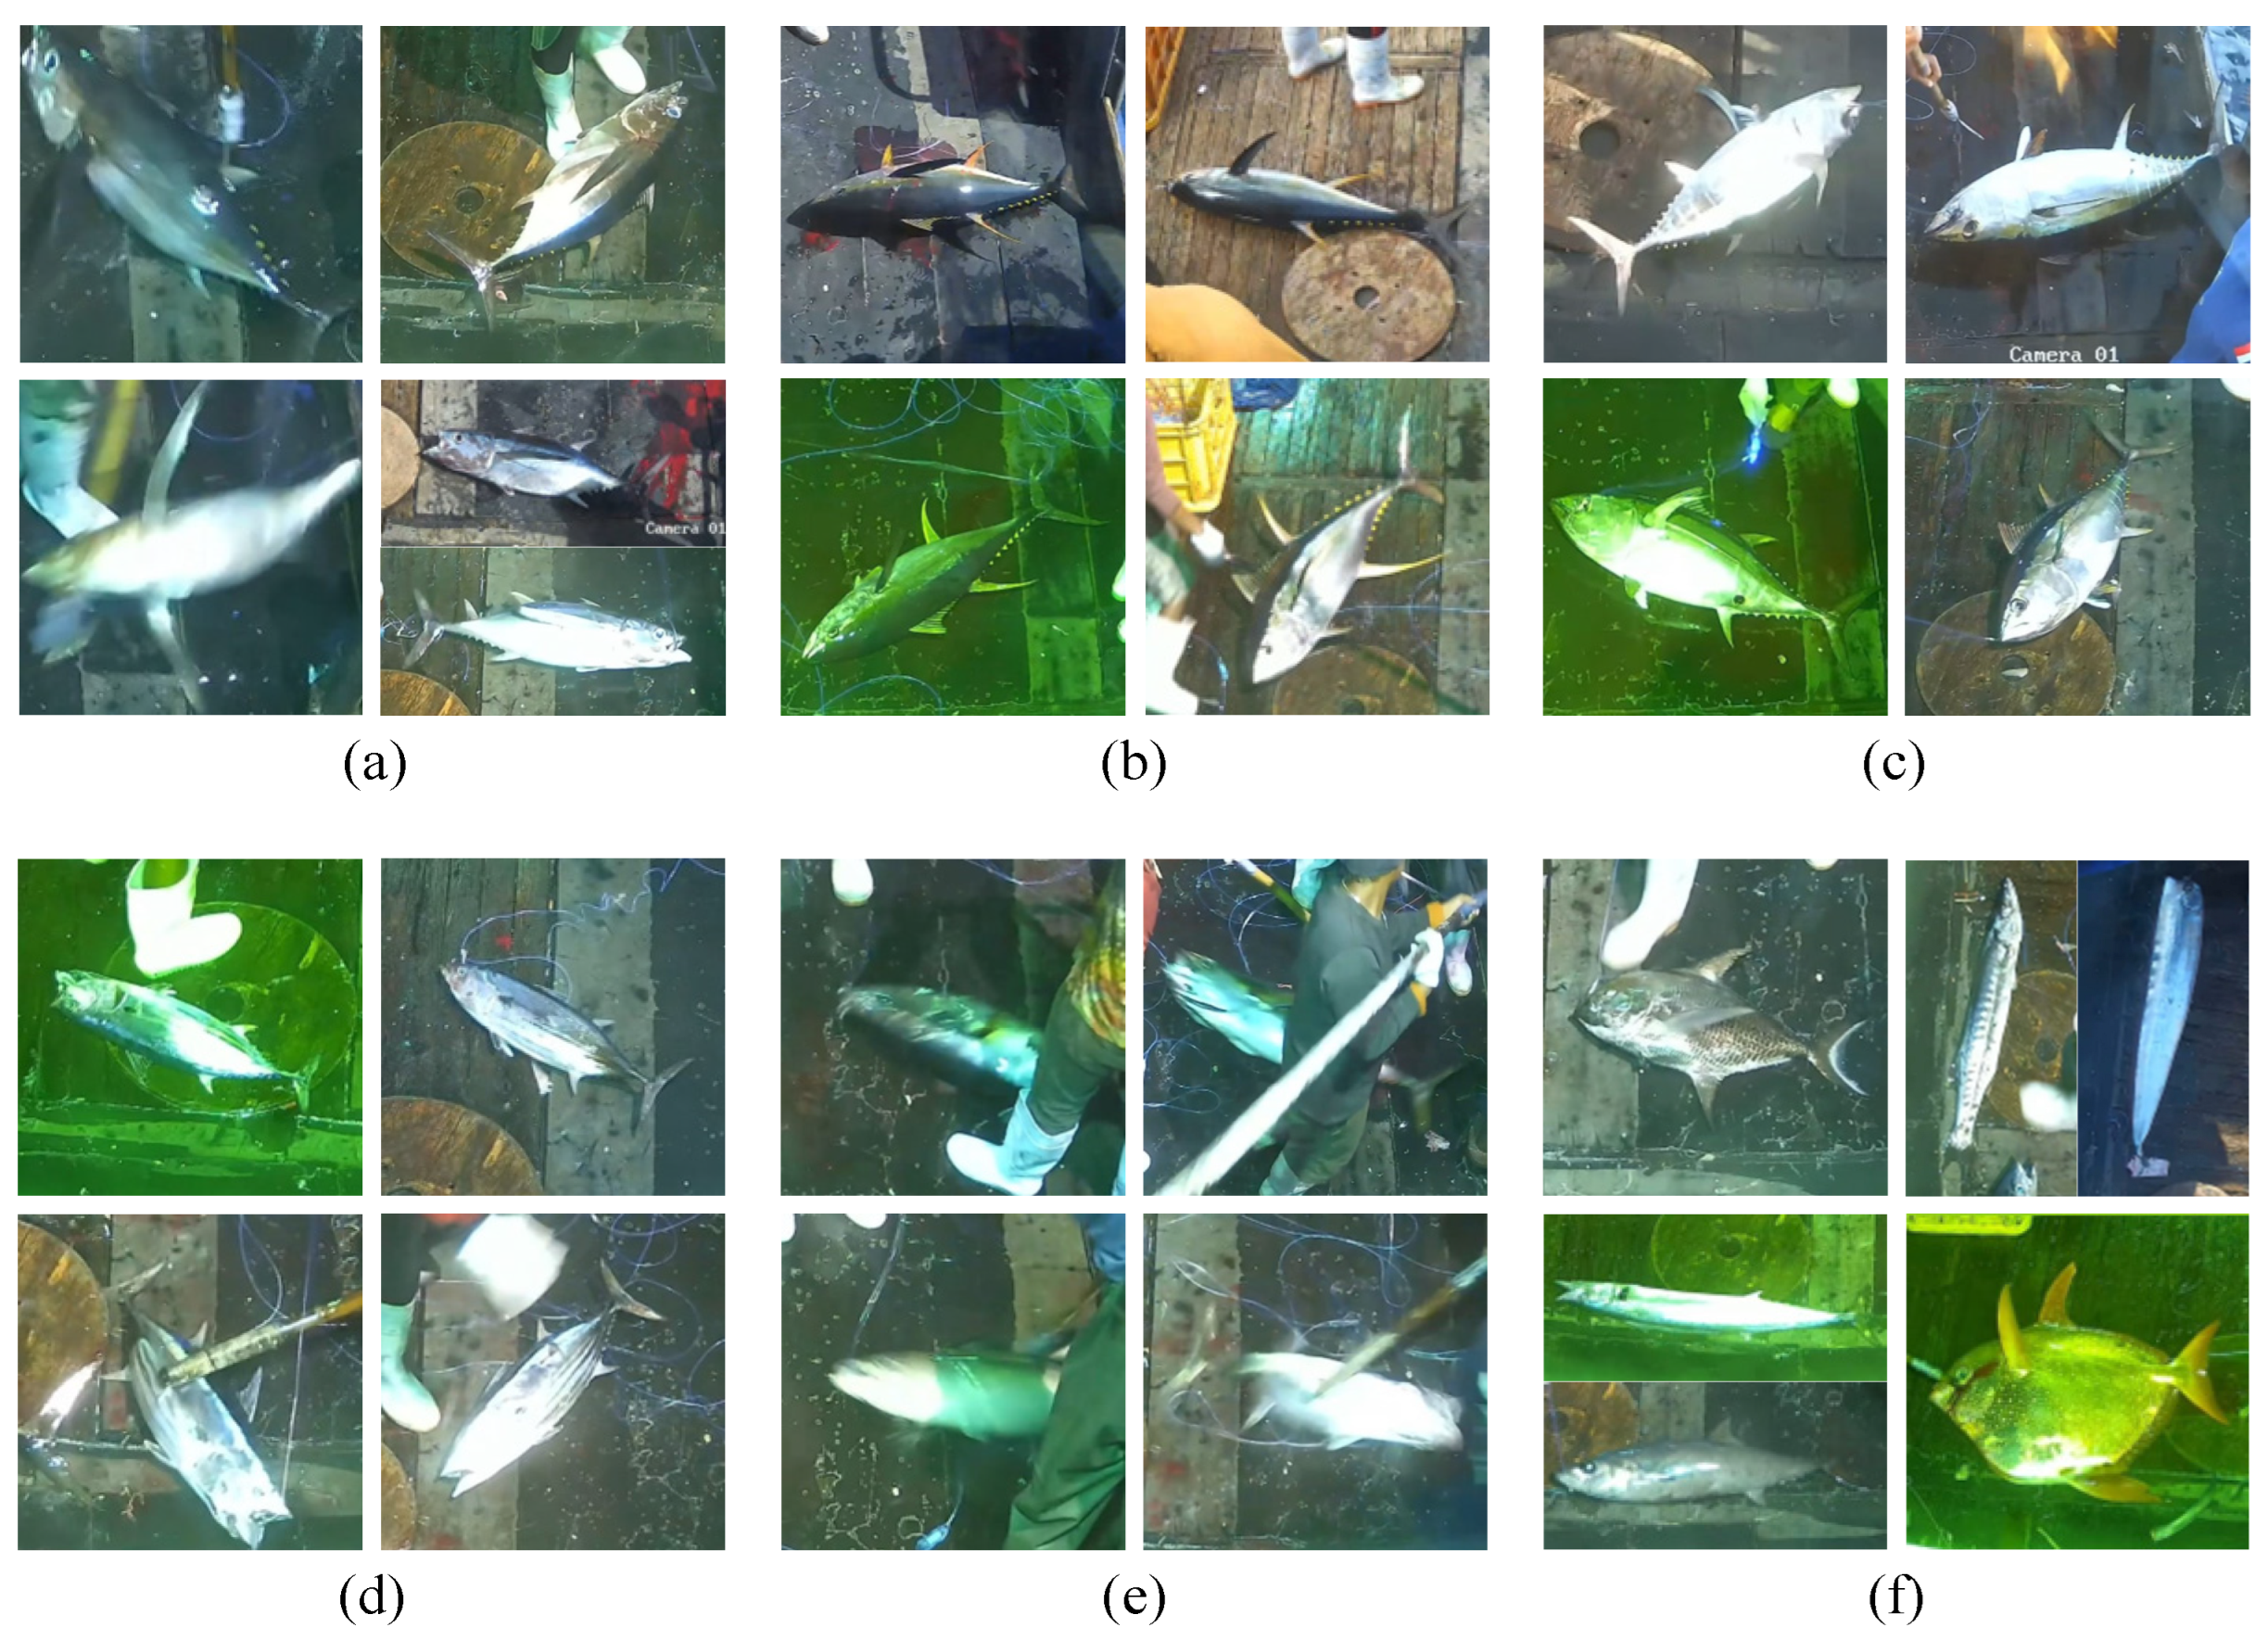
The tuna longline hauling operation typically requires coordinated efforts from four to five crew members. The workflow mainly includes hauling the line, retrieving the catch using long hooks (requiring multiple crew members for large fish, while smaller fish are quickly swung aboard), and hook removal. This scenario poses four major challenges for visual recognition models: severe occlusion, motion blur, intermittent occlusion with motion anomalies, and morphological changes of the catch. To address the problem of severe feature loss in catches caused by these challenges, this study established an annotation system comprising six categories. This includes four target tuna species categories—albacore, yellowfin, bigeye, and skipjack—along with two special auxiliary categories: “uncertainty” for individuals identifiable as tuna but whose specific species cannot be determined due to occlusion or motion blur, and “others” for all non-target fish species. Typical examples of the six labels are shown in
Figure 1.
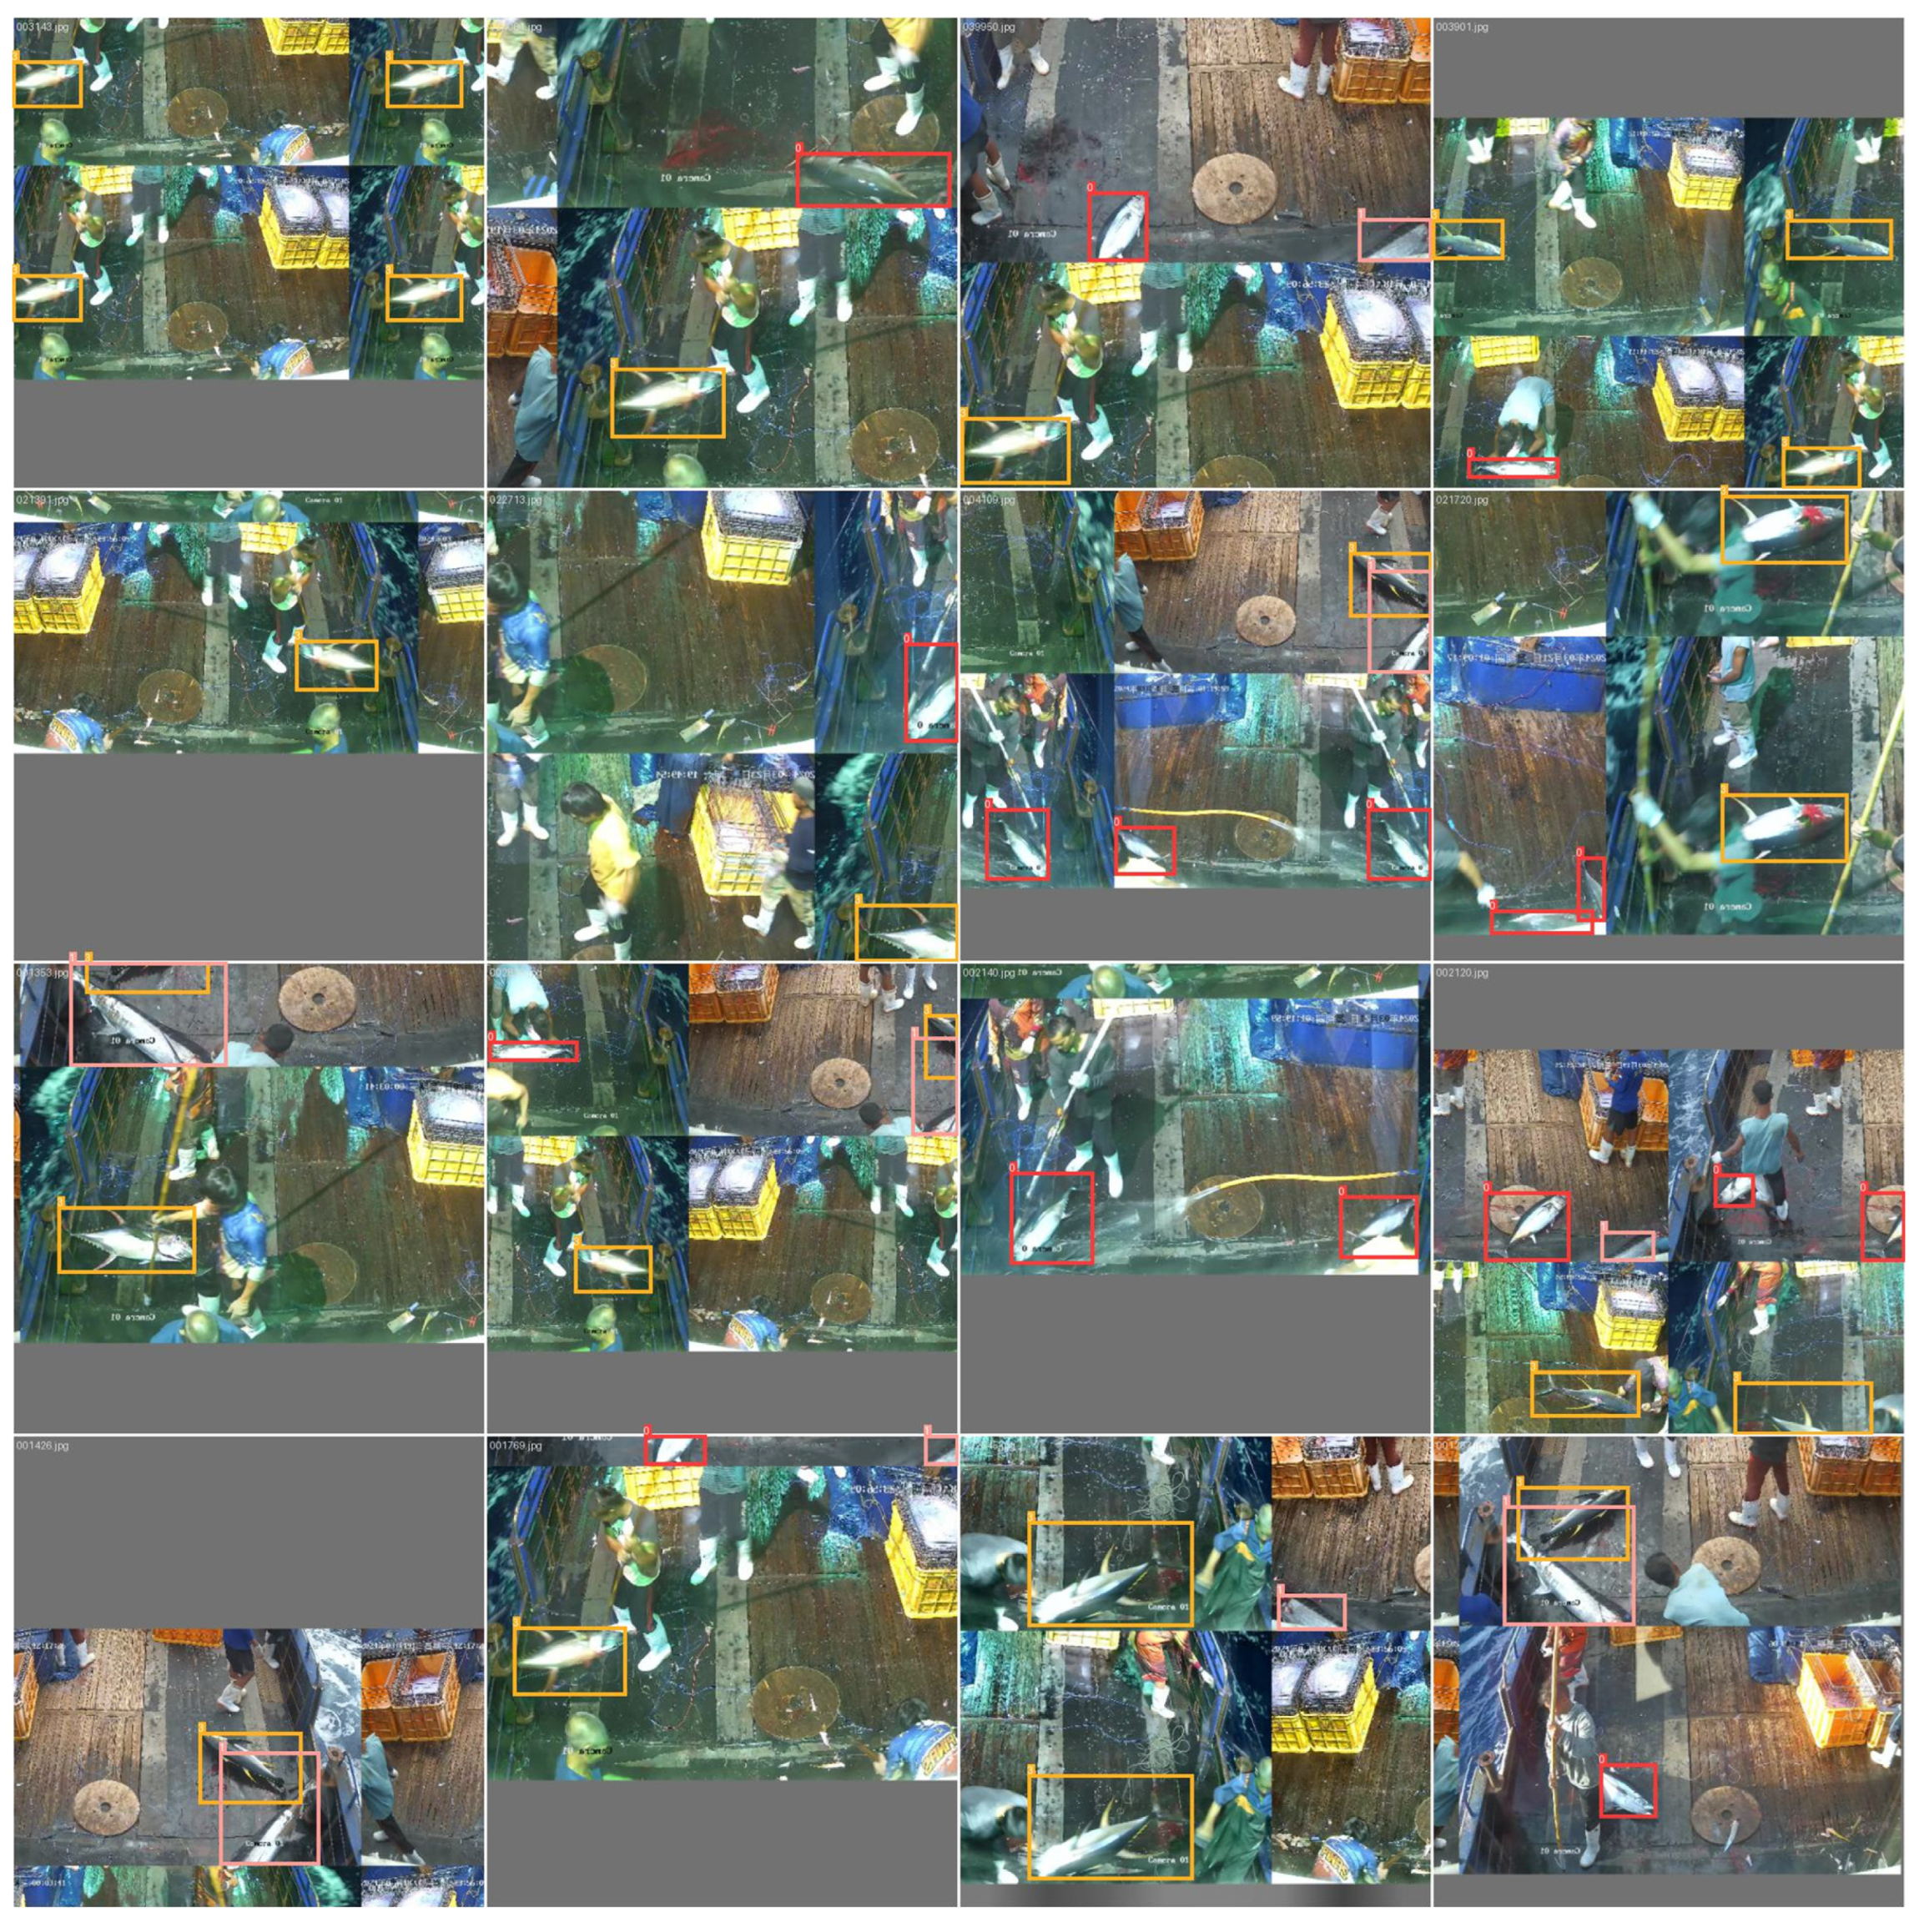
The data for this study were provided by Jinghai Group, collected from the South Pacific region (6°49′40.3″ S, 155°15′52.7″ E) using a Hikvision DS-2CD3T66WDV3-I3 Starlight-level 6-megapixel POE network camera (Hangzhou Hikvision Technology Co., Ltd., Hangzhou, China). The collection lasted for one month. Through systematic preprocessing of the original video data, a total of 6832 valid images were obtained, containing the following annotated samples: 4577 albacore tuna, 2126 yellowfin tuna, 83 bigeye tuna, 85 skipjack, along with 1176 instances of the “uncertainty” and 1619 instances of the “others”.
The preprocessing pipeline primarily consisted of the following steps: First, the original video footage was edited to remove useless segments where no tuna was caught, retaining only key video clips showing the complete capture of the catch. Second, using the FFmpeg tool [
25], images were extracted every 10 frames from the edited videos to form a preliminary image set, avoiding high similarity between consecutive images. Subsequently, with the help of the annotation tool X-Anylabeling [
26], the fish catches in the images were annotated with bounding boxes and classification labels, generating annotation files in JSON format. Finally, the annotation files were converted into TXT label files in YOLO format, randomly split into a training set (5472 images) and a validation set (1360 images) in an 80:20 ratio, and the corresponding YAML dataset configuration file was generated, thereby completing the construction of the entire dataset.
2.2. Specific Region Species Counting
Aiming at the complex working environment of fishing vessel decks characterized by large spaces and frequent occlusions, this study specifically designed a counting scheme based on a closed polygonal region to effectively achieve automated classification and counting of catches. This scheme was inspired by region counting methods used for measuring relative density [
8]. The boundaries of this region cover key regions on the deck—including the fish landing opening where catches are brought aboard, and all potential boundary points where catches might leave the monitored field of view. Compared to single collision line-based counting trigger methods, this closed design possesses the characteristic of enabling triggers for catches crossing the region boundary from any direction indiscriminately.
In terms of counting logic design, this study established a simple bidirectional triggering mechanism for this polygonal region. Since the fish landing opening is located inside the region, the initial position where a catch is detected by the neural network is inside the region. When the system, through object detection and tracking algorithms, identifies a catch target moving from inside the region to outside, it judges that the catch has completed an existing action, and the system increments the counter for its corresponding classification. This process corresponds to the real-world scenario where the catch is moved out of the working region after being handled by the crew. On the other hand, to address abnormal situations such as target rebound or temporary retreat that may occur in practice, the system also incorporates a reverse judge’s logic: when a target is detected moving from outside the region back inside, the counter for the corresponding classification is decremented. This “increment-on-exit/decrement-on-entry” approach helps resolve the issue of duplicate counting caused by catches lingering near the boundary or exhibiting anomalous movement. At the output level, the system ultimately tallies the net quantity of each type of catch that has traversed from inside to outside the counting region. This value is the net output result obtained by summing all valid exit counts and subtracting invalid counts caused by re-entries.
2.3. Plug-and-Play ByteTrack Enhancement for Persistent Tracking
Although the counting logic based on crossing the boundaries of the counting region is clear in principle, its implementation heavily relies on the continuity of target trajectories near these boundaries. However, the dense occlusion environment on fishing vessel decks is highly prone to cause target detection loss, which is the key reason for disrupting trajectory continuity. Simultaneously, even for detected occluded targets, their confidence is often lower than that of normal targets. Therefore, it is imperative to adopt a differentiated tracking strategy capable of distinguishing and processing high-confidence and low-confidence detection boxes.
Mainstream multi-object tracking algorithms such as ByteTrack [
23] and BoTSORT [
27] both employ strategies that segment detection sets into high and low confidence levels and apply different processing methods. They have demonstrated excellent performance on public datasets like MOT17 [
28] and MOT20 [
29]. In terms of algorithm selection, although BoTSORT’s introduction of a motion camera compensation module improved the MOTA metric by 0.2 on the MOT17 dataset, its computational overhead increased significantly (FPS dropped from ByteTrack’s 29.6 to 4.5) [
27]. Considering the stringent real-time requirements and highly constrained computational resources of fishing vessel edge devices, ByteTrack was selected as the baseline algorithm for this study due to its superior efficiency-accuracy balance.
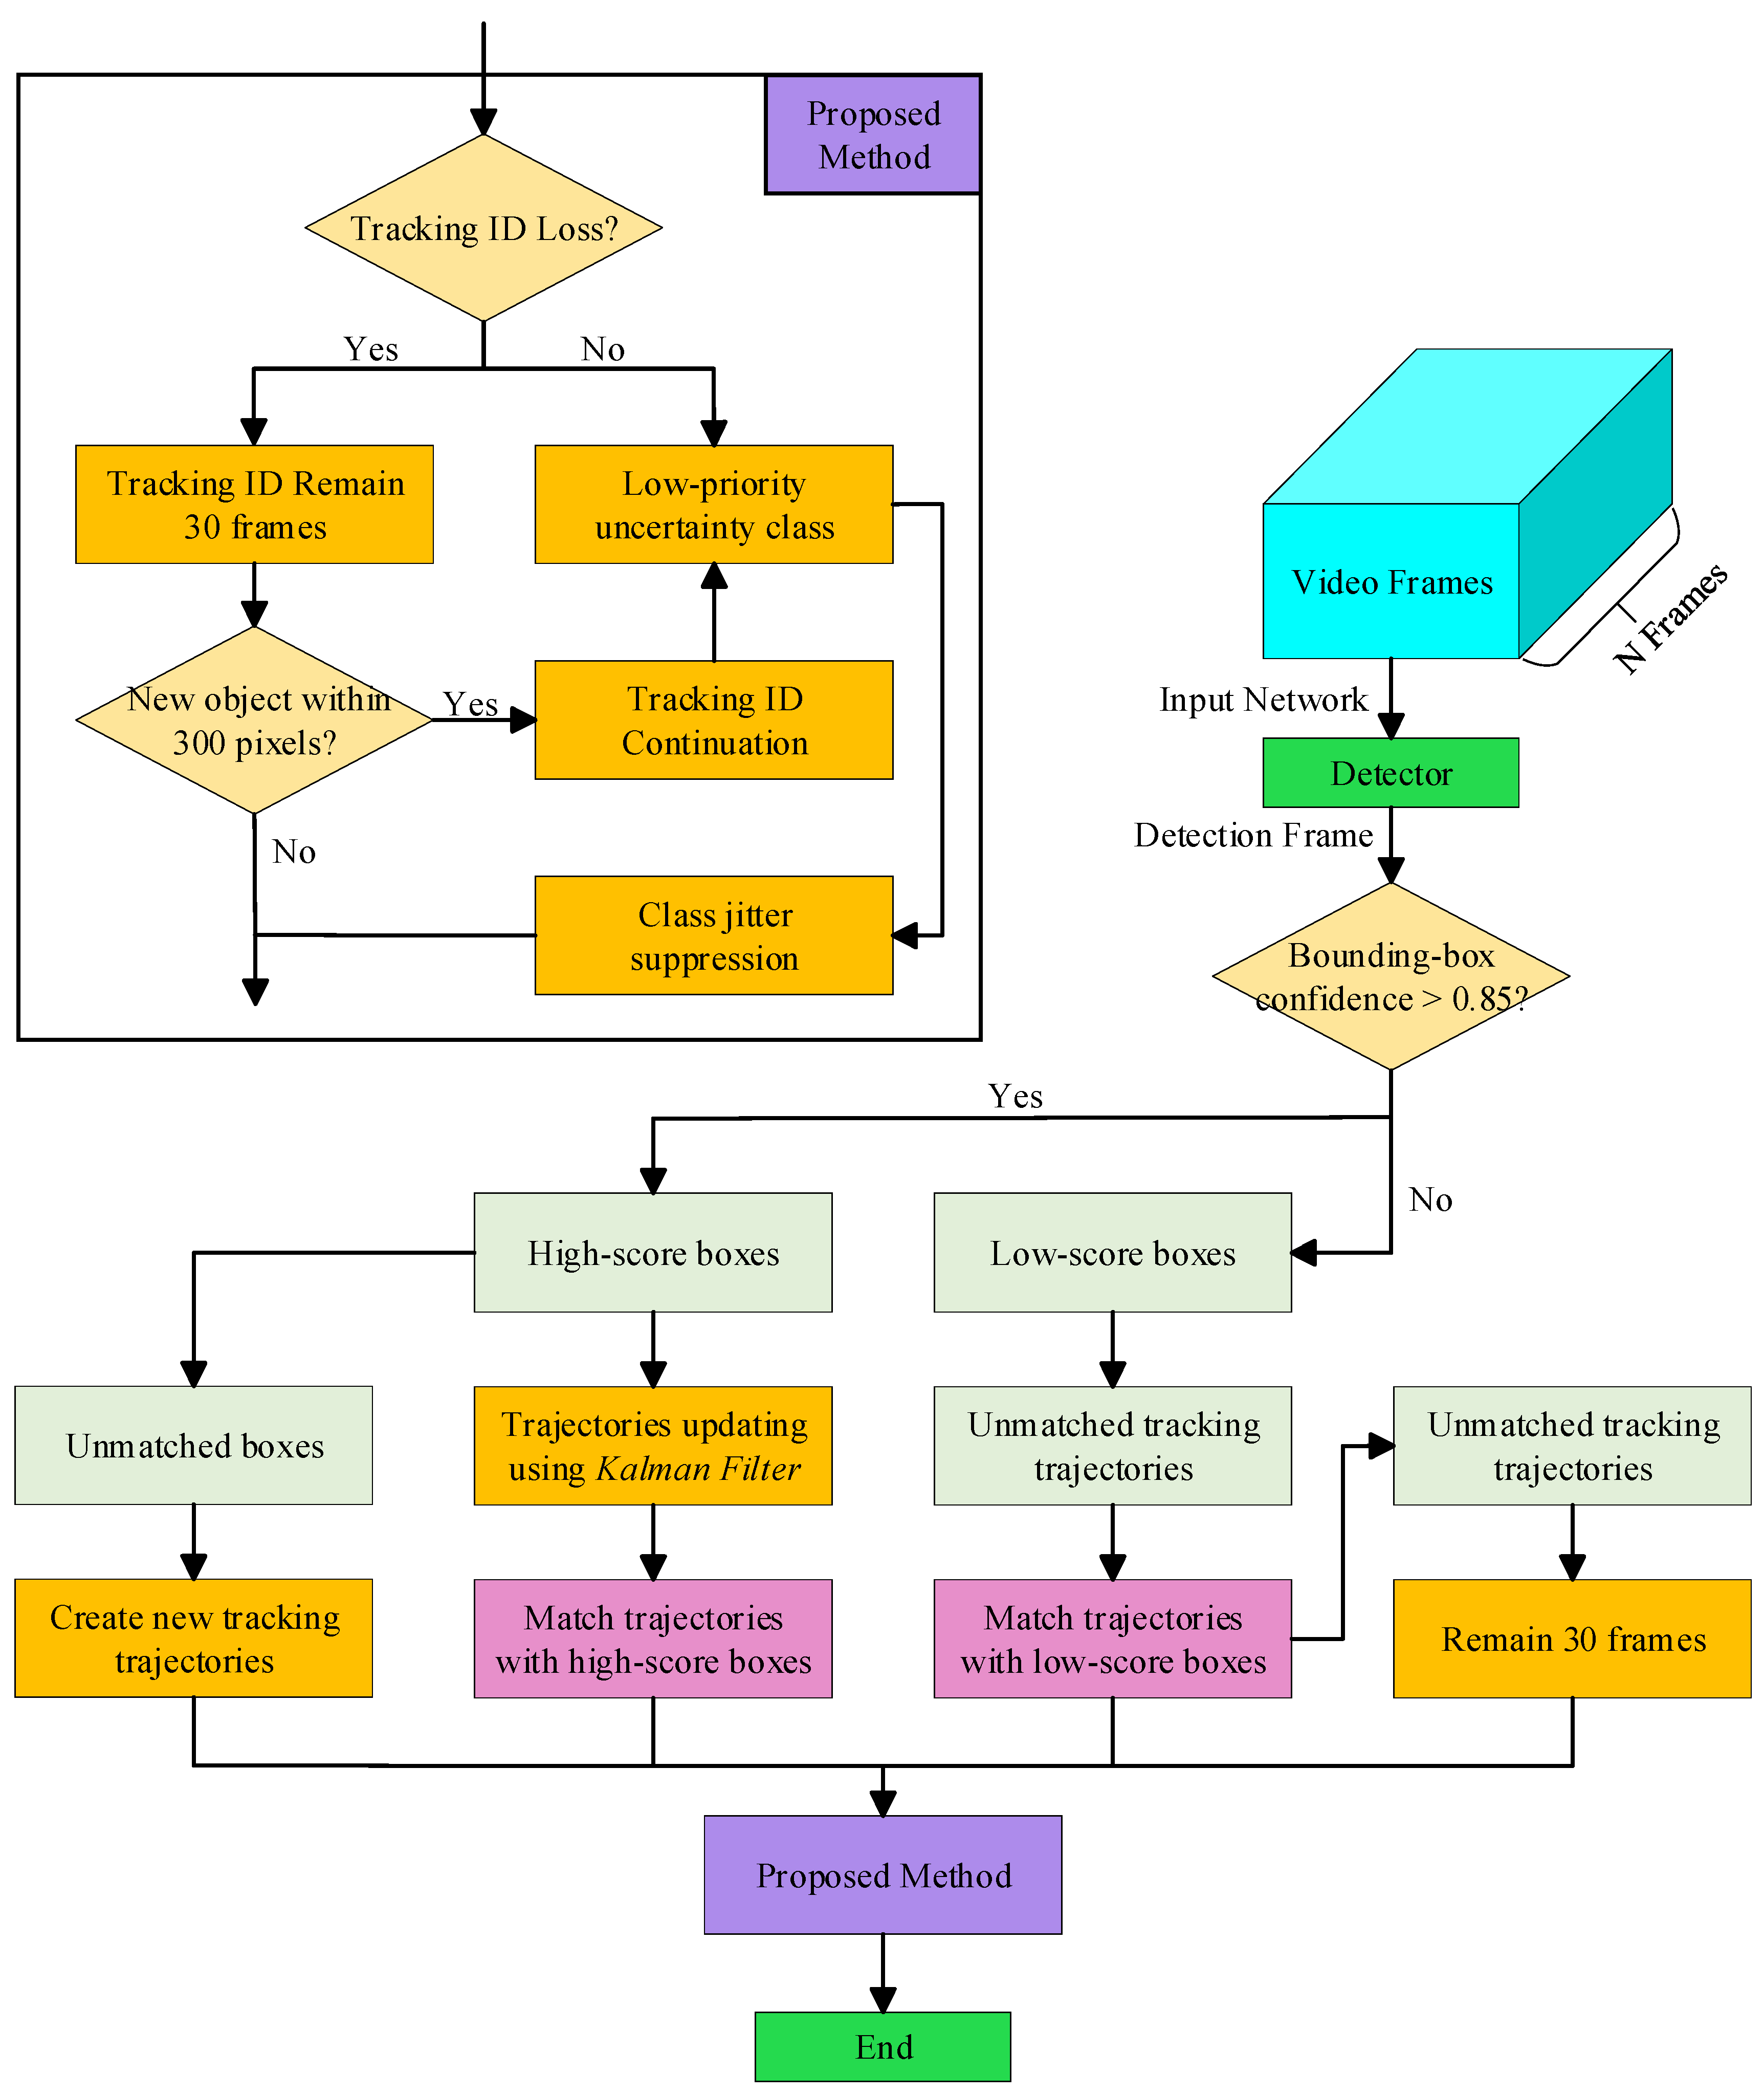
To address the problem of target trajectory interruption caused by severe occlusion in the fishing vessel deck environment, this study introduced key improvements to the ByteTrack algorithm. In the original algorithm, when a target temporarily disappears due to occlusion and reappears, the system often assigns it a new ID, leading to the same target being identified as different objects and consequently causing counting errors. To solve this, a spatio-temporal matching mechanism was designed and implemented to maintain target identity continuity by setting reasonable time and spatial thresholds. The time matching threshold is empirically set to 30 frames, aligning with ByteTrack’s default setting, while the spatial matching threshold of 300 pixels is established relative to our specific video resolution of 1920 × 1080 pixels. It is important to emphasize that both thresholds are not fixed parameters but can be dynamically adjusted according to specific application requirements. The temporal threshold can be modified based on the expected duration of occlusion episodes in different scenarios, whereas the spatial threshold should be scaled proportionally with variations in video resolution and camera perspective. When a target reappears within these adaptable threshold boundaries, the system automatically associates it with the original ID, effectively reducing counting errors caused by identity switches. This improvement maintains a plug-and-play modular design that preserves the original algorithm architecture, thus ensuring system stability while providing enhanced performance and configurable adaptability to diverse operational environments.
To further enhance the robustness of classification discrimination, two classification stabilization strategies based on temporal consistency were integrated into the tracking module. The Uncertainty Low-Priority Rule stipulates that if a tracked target has been definitively classified in historical frames, it is prohibited from being demoted to the “uncertainty” in subsequent frames. The Label Jitter Suppression mechanism requires that for targets not belonging to the “uncertainty” category, a classification switch can only be executed if the target is consistently assigned to a new category across multiple consecutive frames (typically set to 15 frames in this study). These two strategies work synergistically to effectively mitigate classification jitter problems caused by instantaneous occlusion or appearance changes, providing a reliable classification information foundation for accurate counting.
Figure 2 presents the flowchart of the enhanced algorithm.
2.4. Efficient Component Optimization for YOLOv8
Since its inception in 2016, the YOLO series models have undergone continuous iteration, with YOLOv12 [
30] achieving performance breakthroughs on the MS COCO dataset [
31] by 2025. However, its adaptability in densely occluded fishing vessel scenarios remains to be verified. Given the characteristic differences among various detection tasks, targeted optimization of a baseline model is often more effective than directly adopting the latest architecture. Based on comparative experiments of baseline model detection results, this study selected YOLOv8 [
8] as the structural foundation. By integrating YOLOv10’s [
32] SCDown downsampler, Partial Self-Attention (PSA), and C2fCIB fusion module, and utilizing lightweight reparametrized RepGhost [
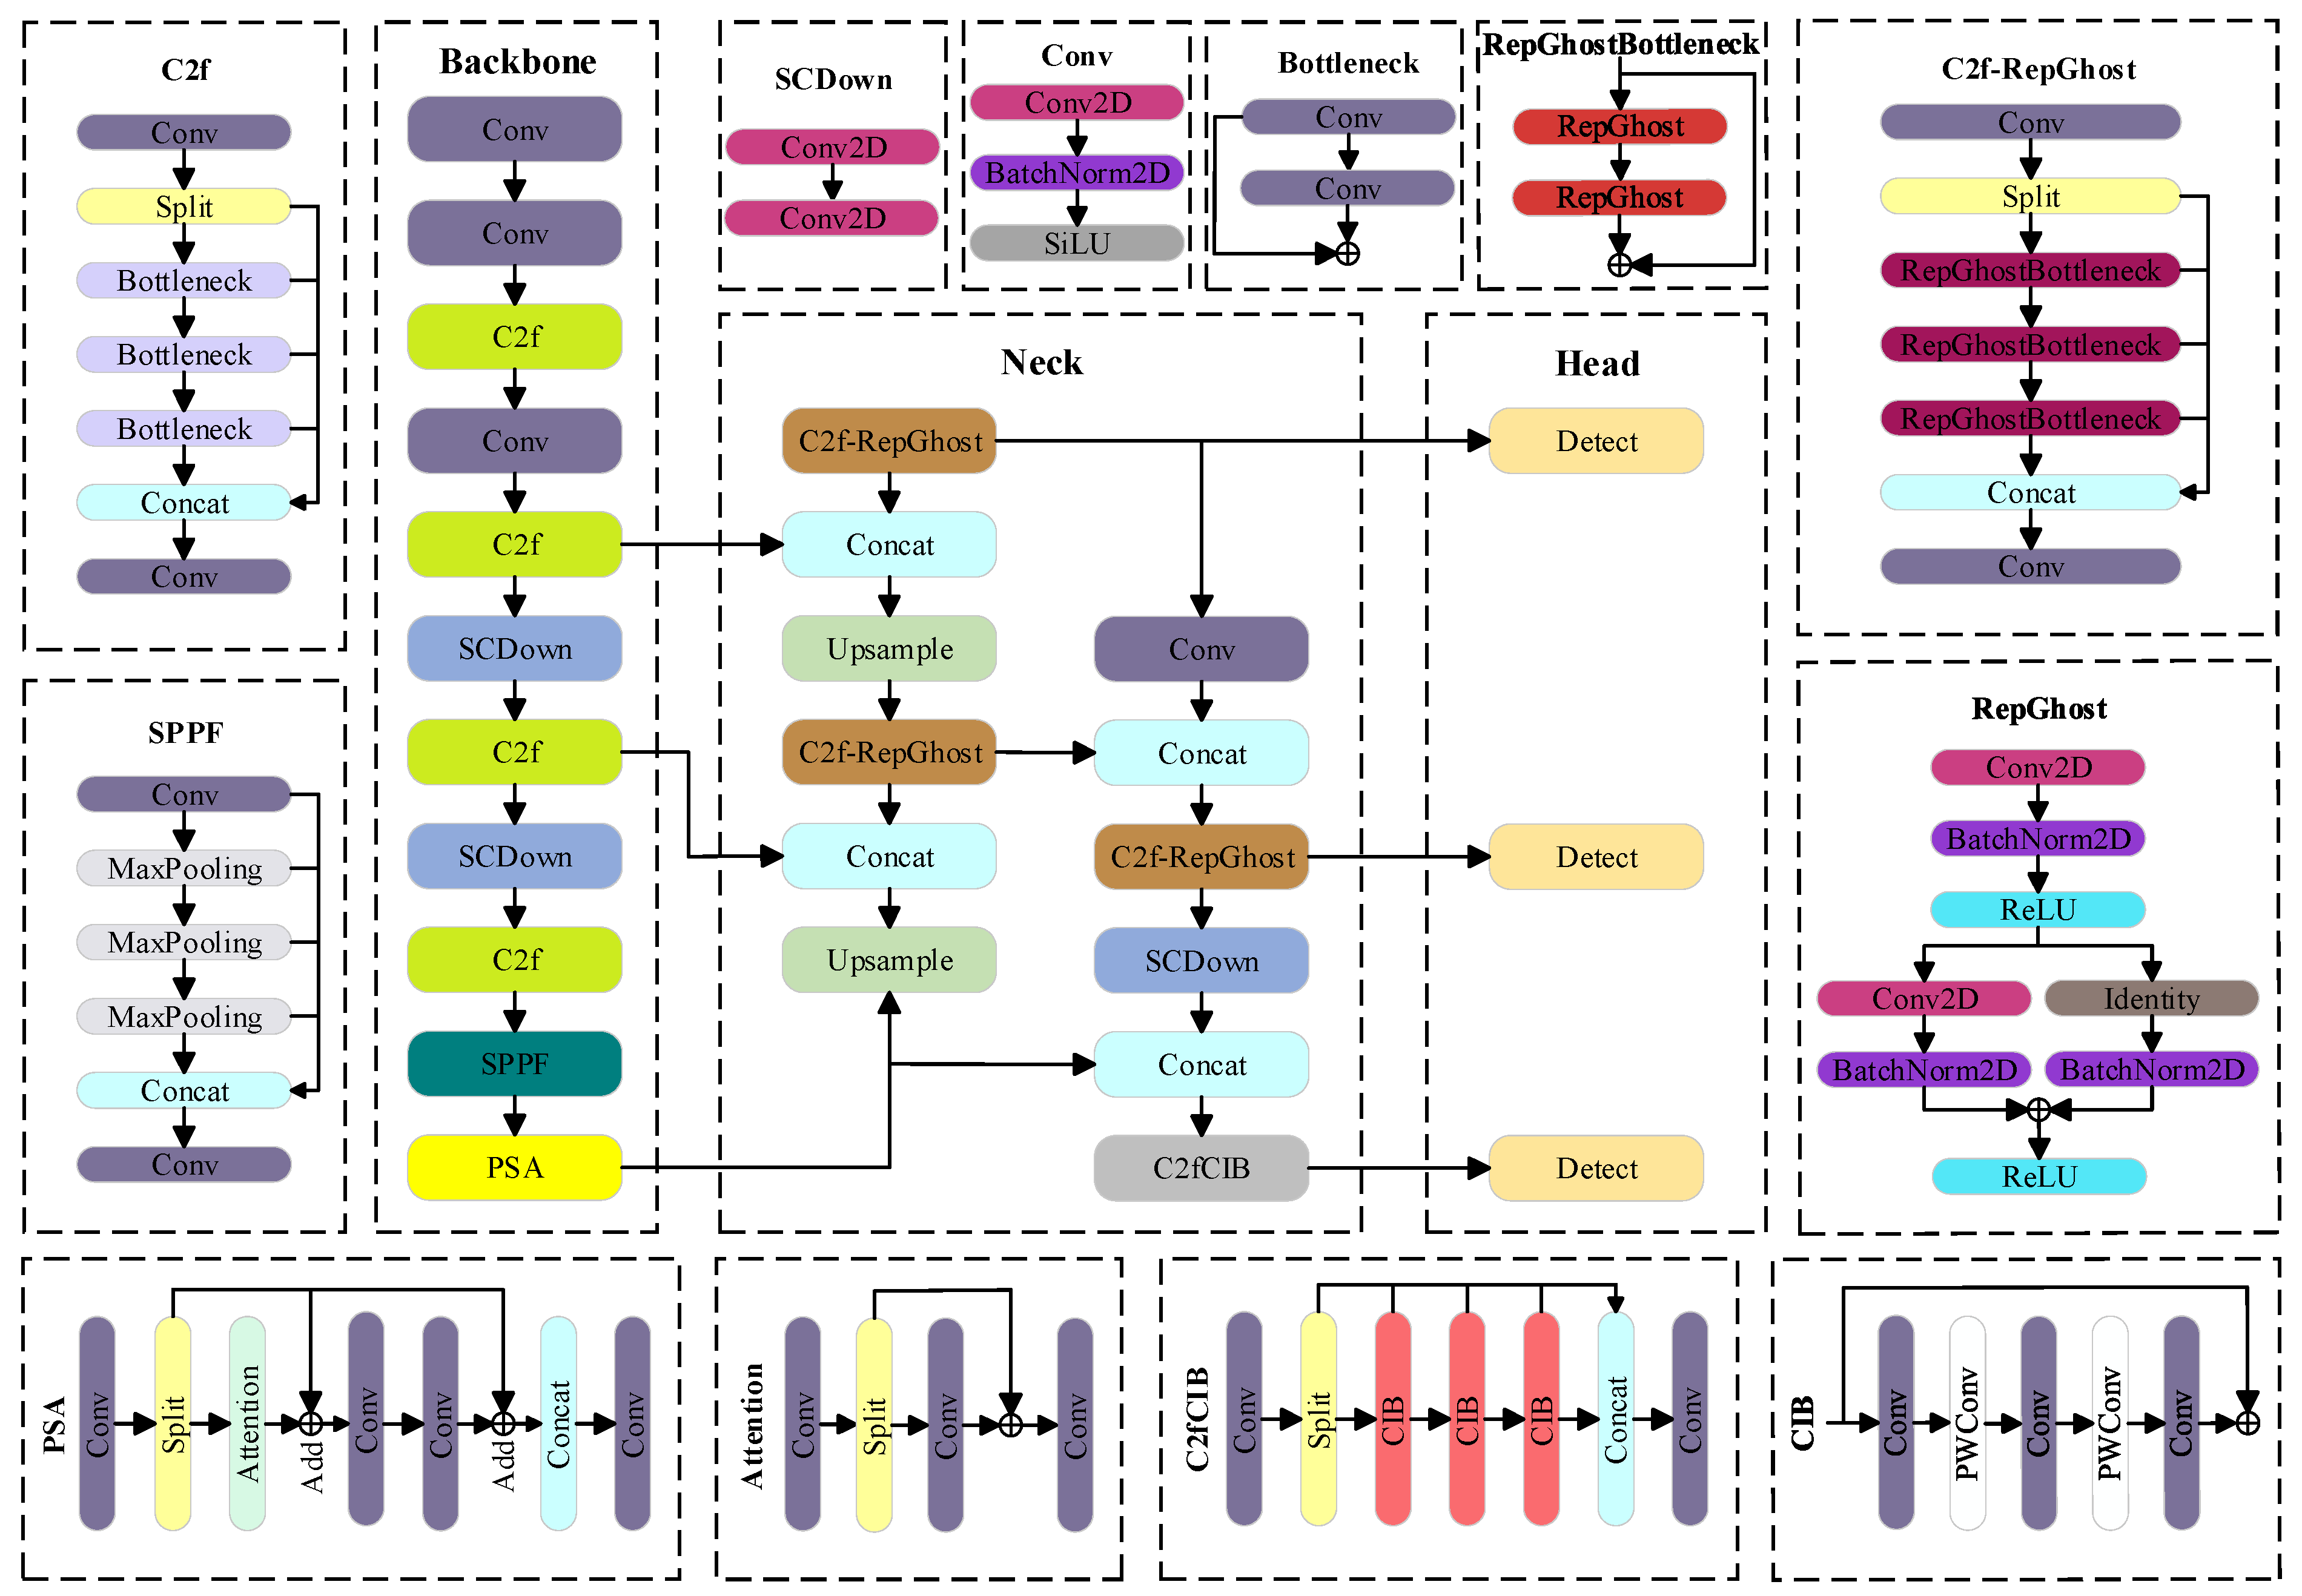
33] convolution in the C2f modules of the detection head, an efficient detection architecture tailored for fishing vessel scenarios was constructed. This decision stemmed from its high modular compatibility with YOLOv10—both share the C2f backbone feature extraction architecture—making cross-generational component fusion engineering feasible. The improved network architecture and its key components are shown in
Figure 3.
2.4.1. Spatial-Channel Decoupled Downsampling Module
To address the issue of motion blur in images caused by the rapid movement of tuna and longline fishing operations in fishing vessel deck scenarios, while also considering the stringent requirements for model lightweighting on edge devices, this study employs the SCDown module to replace the original standard convolutional downsampling layers in YOLOv8. Traditional standard convolutional downsampling often struggles to avoid the loss of detailed information when compressing the spatial dimensions of feature maps, which is particularly detrimental to the recognition of fish catch images that already suffer from severe motion blur. The SCDown module achieves finer downsampling by decomposing the process into two consecutive convolutional operations: first, using a 1 × 1 convolution for information integration and compression along the channel dimension, followed by a Depthwise Convolution with the number of groups set equal to the number of output channels for spatial downsampling. This decoupled downsampling strategy helps reduce the coupling effect inherent in single convolution kernels processing both channel and spatial information simultaneously, thereby alleviating the information loss bottleneck during downsampling and aiding the model in extracting more robust features from blurred images. The high efficiency of depthwise separable convolution makes it particularly suitable for real-time detection on edge devices with limited computational resources. Furthermore, the modular design clarifies the gradient flow path during backpropagation: the 1 × 1 convolution manages the smooth transition of channel information, while the depthwise convolution focuses on spatial dimension reduction, contributing to enhanced training stability and feature extraction efficiency.
2.4.2. Partial Self-Attention
To enhance the model’s adaptability to motion blur and crew occlusion in fishing vessel deck environments, this study introduces the PSA module at the terminus of the backbone network. Factors such as motion blur and occlusion often make it difficult to fully capture the discriminative features of tuna targets, which may compromise detection performance. The PSA module processes input features using a dual-path architecture: one path employs a multi-head self-attention mechanism to compute spatial correlations within the feature map, aiming to enhance the model’s focus on key areas of tuna, such as contours and textures; the other path preserves the original features to maintain the integrity of fundamental visual information. To further augment spatial structure awareness, the module incorporates positional encoding, implemented via depthwise convolution, into the attention path, thereby endowing the features with spatial location information. The outputs of the two paths are concatenated and then fused through a pointwise convolution. This design seeks to balance the discriminative power of attention-enhanced features with the detailed completeness of the original features. Although the dual-path structure and attention computation may introduce some increase in parameters, the overall design still considers computational efficiency constraints, striving to achieve a balance between feature selection capability and model complexity, thereby providing more robust feature representations for subsequent detection tasks.
2.4.3. Cross-Scale Feature Fusion with Channel-Wise Information Bottleneck
To enhance the feature extraction capability of the tuna detection model in complex fishing vessel deck environments while addressing the efficiency requirements of edge devices, this study adopts the C2fCIB module to replace the standard C2f structure in the feature fusion layer. The core improvement of this module lies in substituting the original Bottleneck unit with the CIB structure, which incorporates depthwise separable convolutions and a multi-layer convolutional sequence design to achieve a balance between model performance and computational cost.
The CIB module replaces standard convolution operations with depthwise separable convolutions, decoupling the spatial filtering and channel-wise linear combination processes. This design can help reduce the number of parameters and lower computational complexity. Internally, the module constructs a feature transformation path through a five-layer convolutional sequence (depthwise convolution → pointwise convolution → depthwise convolution → pointwise convolution → depthwise convolution). This “wide-narrow-wide” channel transformation strategy can capture multi-scale contextual information. For partially occluded tuna targets, it may enhance recognition robustness by strengthening the association between local features and global semantics. The module retains the residual connection mechanism, where input features are added to the transformed features through skip connections. This design can help maintain gradient propagation stability and alleviate optimization difficulties in deep networks. In terms of structural compatibility, the CIB module maintains interface consistency with the original Bottleneck, supporting shortcut operations and channel expansion ratio parameters. This enables relatively straightforward integration into the existing C2f architecture, providing a feasible improvement path for model optimization.
2.4.4. Cross-Scale Feature Fusion with Re-Parameterization Ghost Module
To meet the urgent demand for real-time detection on edge devices deployed on fishing vessel decks, this study replaces the standard C2f structure with the C2f-RepGhost [
34] module in the feature fusion path of the detection head. The limited computational resources of edge devices impose high requirements on model efficiency, while traditional feature fusion methods may have certain limitations in balancing performance and efficiency. The C2f-RepGhost module employs a structural re-parameterization design. Its core component, RepGhost [
33], maintains a multi-branch architecture during the training phase to enhance feature representation capability, while during inference, it can be transformed into an equivalent single-branch structure through parameter fusion. This design helps improve inference efficiency while maintaining model performance. The module also adopts the “compress first, then expand” strategy from the Ghost module, utilizing standard convolutions in combination with depthwise separable convolutions to achieve rich feature representation at lower computational cost. The residual connection design in the module helps maintain gradient propagation stability, while the use of depthwise separable convolutions reduces computational complexity during feature fusion. Although the re-parameterized structure and multi-branch design may introduce some training complexity, the module ultimately simplifies the inference structure through structural re-parameterization, thereby minimizing computational load with negligible precision loss. This approach is particularly suitable for detectors deployed on edge devices, offering a viable technical pathway for real-time detection in fishing vessel deck environments.
4. Results
4.1. Preliminary Experiment on Tuna Counting
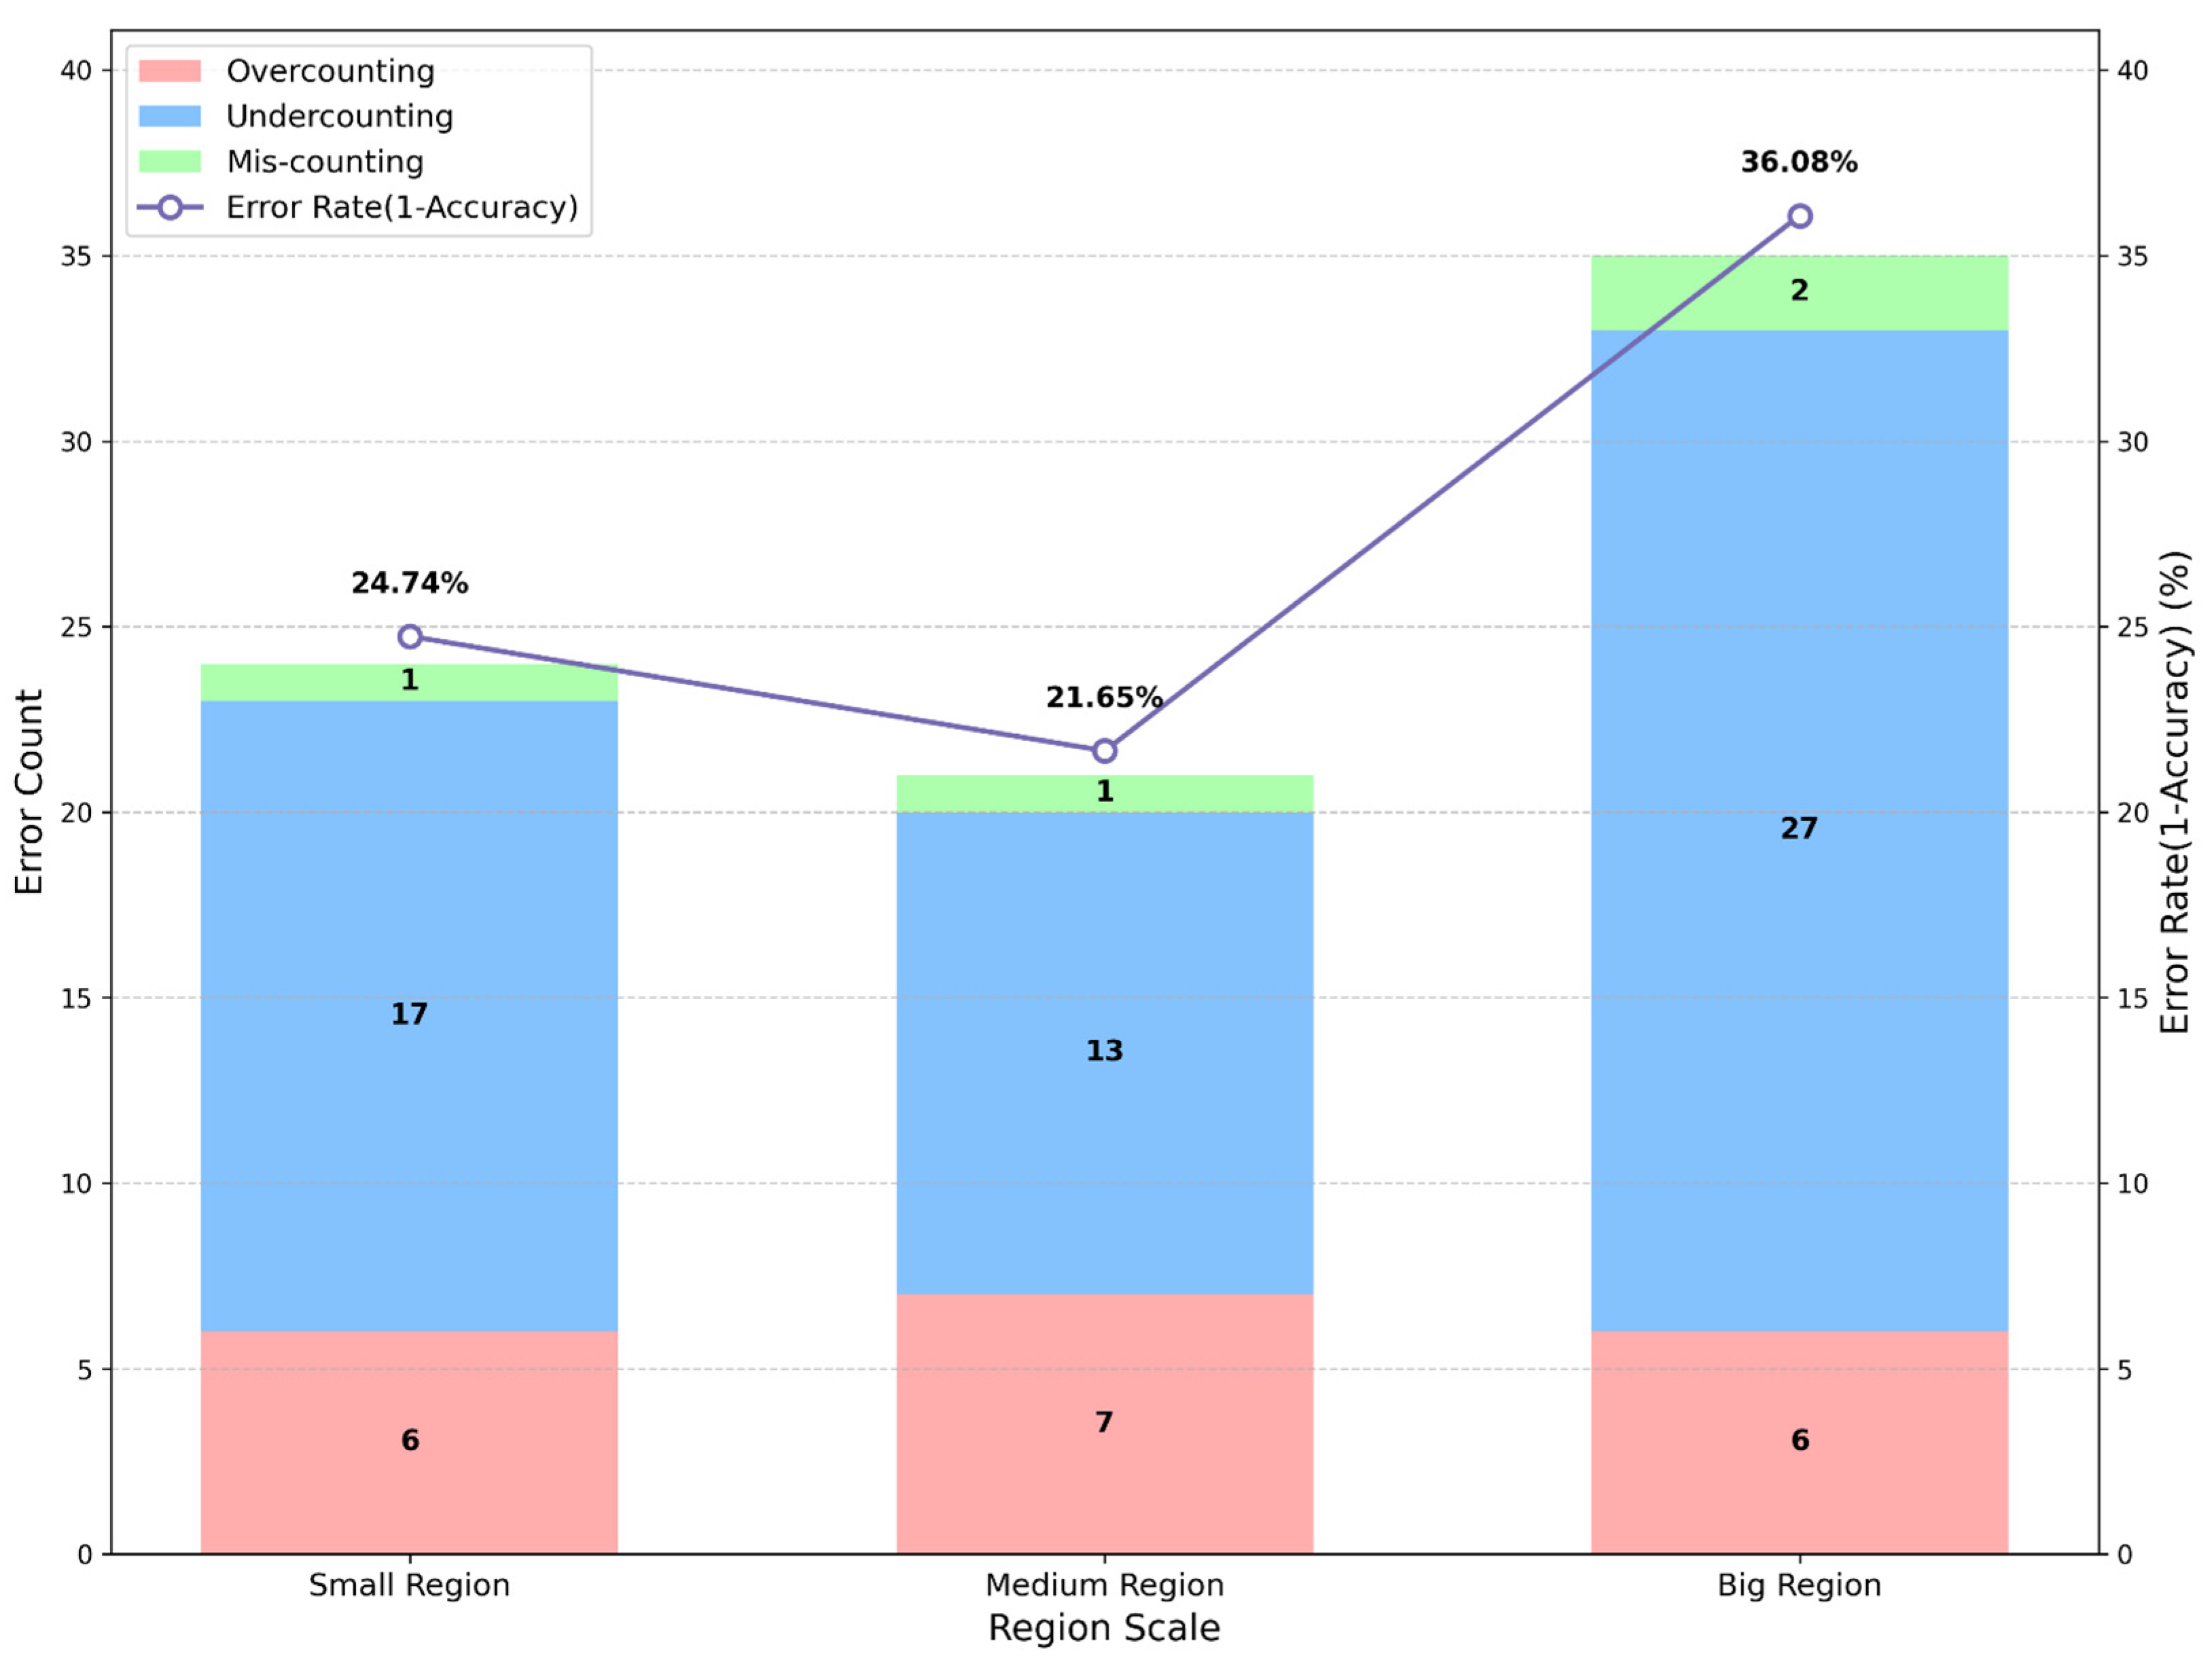
To optimize counting accuracy in highly occluded environments and to evaluate the method against a known ground truth—comprising 68 albacore tuna, 20 yellowfin tuna, 4 bigeye tuna, 3 skipjack, 0 uncertainty, and 2 others—this study conducted three preliminary experiments. These experiments employed only the enhanced YOLOv8s detector and the original ByteTrack tracker, with the aim of exploring optimal principles for configuring counting regions. The spatial definitions of the three tested regions (Big, Medium, and Small) are detailed by the yellow boxes in
Figure 5; the number within each yellow square represents the count of central points from fish detection bounding boxes inside that tested region. The corresponding counting results are provided in
Figure 6.
Experimental results demonstrate that among the three region scales, the Medium Region achieved the lowest counting error rate, while the Big Region exhibited the highest. Error subtype analysis revealed that while the Medium Region significantly reduced undercounting errors, its boundary placement within high-occlusion zones slightly increased overcounting risk. Conversely, the Small Region suffered from initial target detection occurring outside the ROI boundary, preventing valid counting triggers; the Big Region experienced substantially elevated missed detection probabilities as targets frequently moved partially beyond camera coverage during boundary crossing, impeding count initiation. Consequently, an optimal counting region must simultaneously satisfy two criteria: initial target detection must occur inside the ROI, and counting triggers must operate reliably.
4.2. Comparative Experiments on Tuna Detection
To validate the effectiveness of the enhanced network for tuna catch detection on fishing vessels, it was compared against identically sized models from YOLOv8 to v12 [
8,
30,
32,
35], with results detailed in
Table 1.
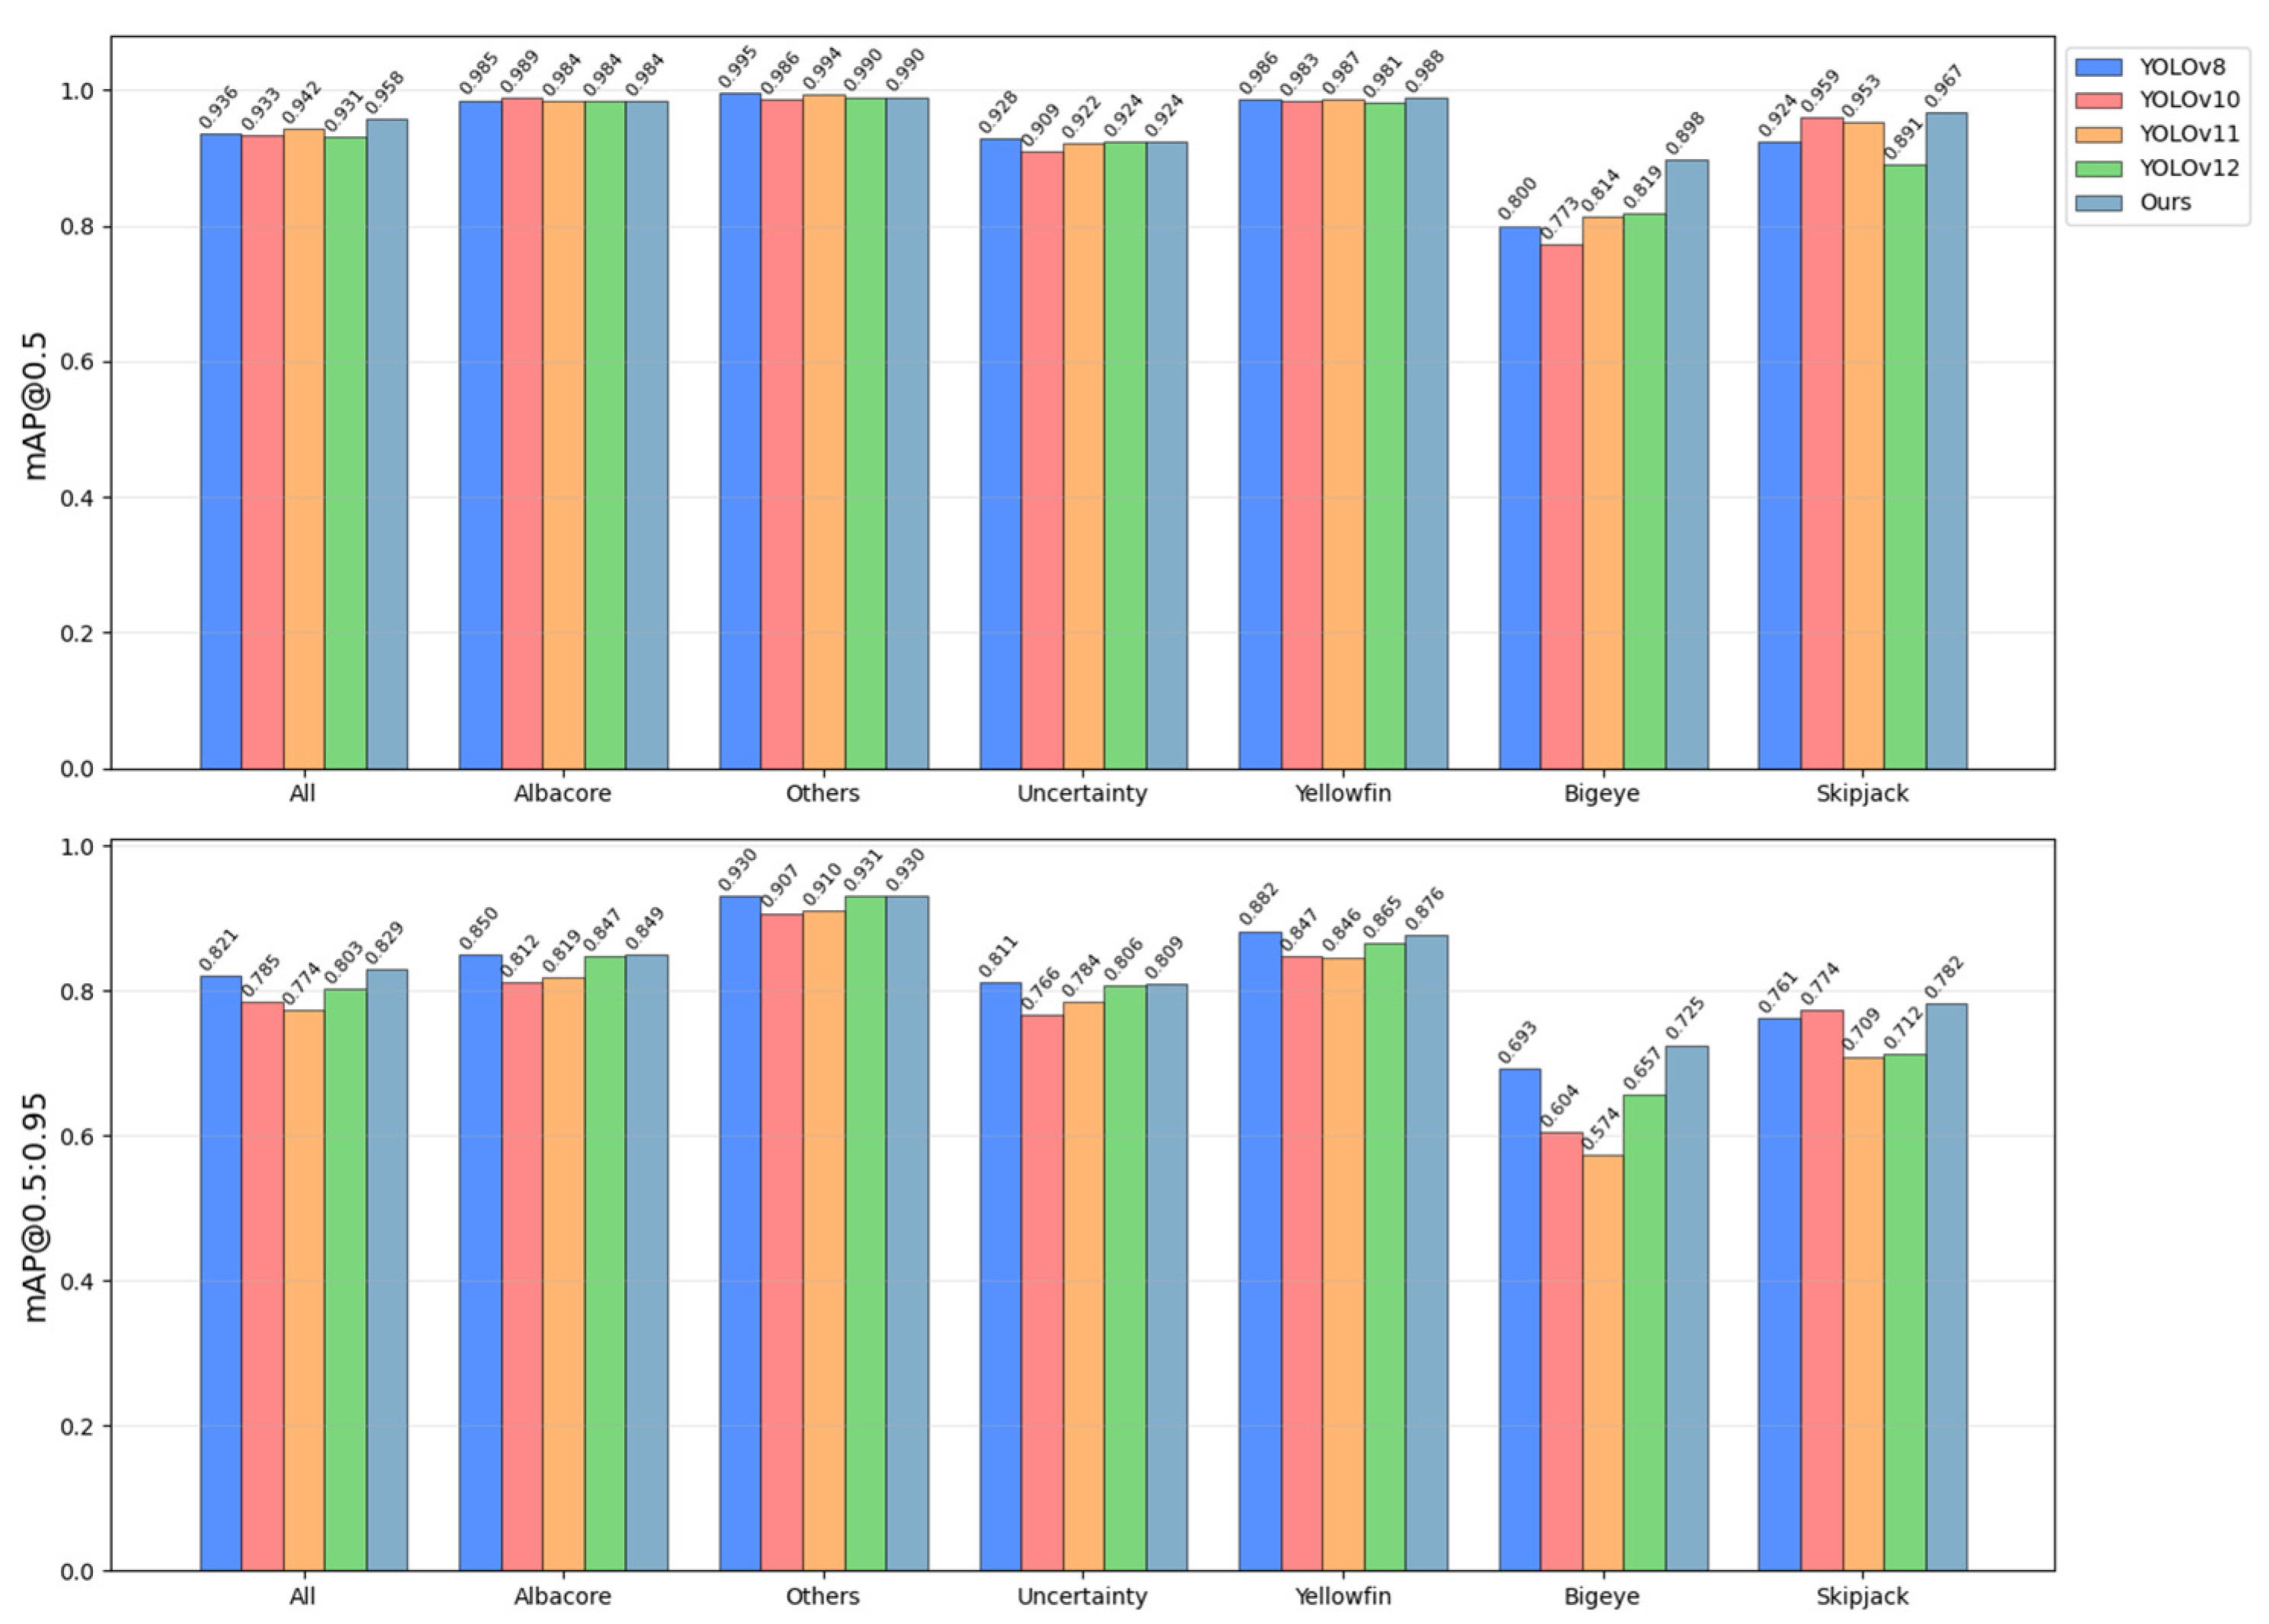
Experimental verification demonstrates that the enhanced network architecture achieves a synergistic leap in both accuracy and efficiency for catch detection in multi-occlusion vessel environments. For the nano-scale model, the proposed architecture attained peak values of 0.958 in mAP@0.5 and 0.829 in mAP@0.5:0.95, representing improvements of 2.2 and 0.8 pp, respectively, over YOLOv8n. Concurrently, parameter count was reduced to 2.44 M, marking an 18.9% reduction compared to YOLOv8n and outperforming other versions. Computational load decreased to 7.2 GFLOPs, a 12.2% reduction from YOLOv8n, and merely 0.1 GFLOPs higher than the computationally optimal YOLOv11n. Inference latency was optimized to 1.2 ms, accelerating processing by 33.3% versus YOLOv8n while matching the inference speed of YOLOv11. Model weight size was compressed to 4.95 MB, a 17.0% reduction from YOLOv8n, establishing it as the lightest solution.
Figure 7 presents the mAP for each species, while
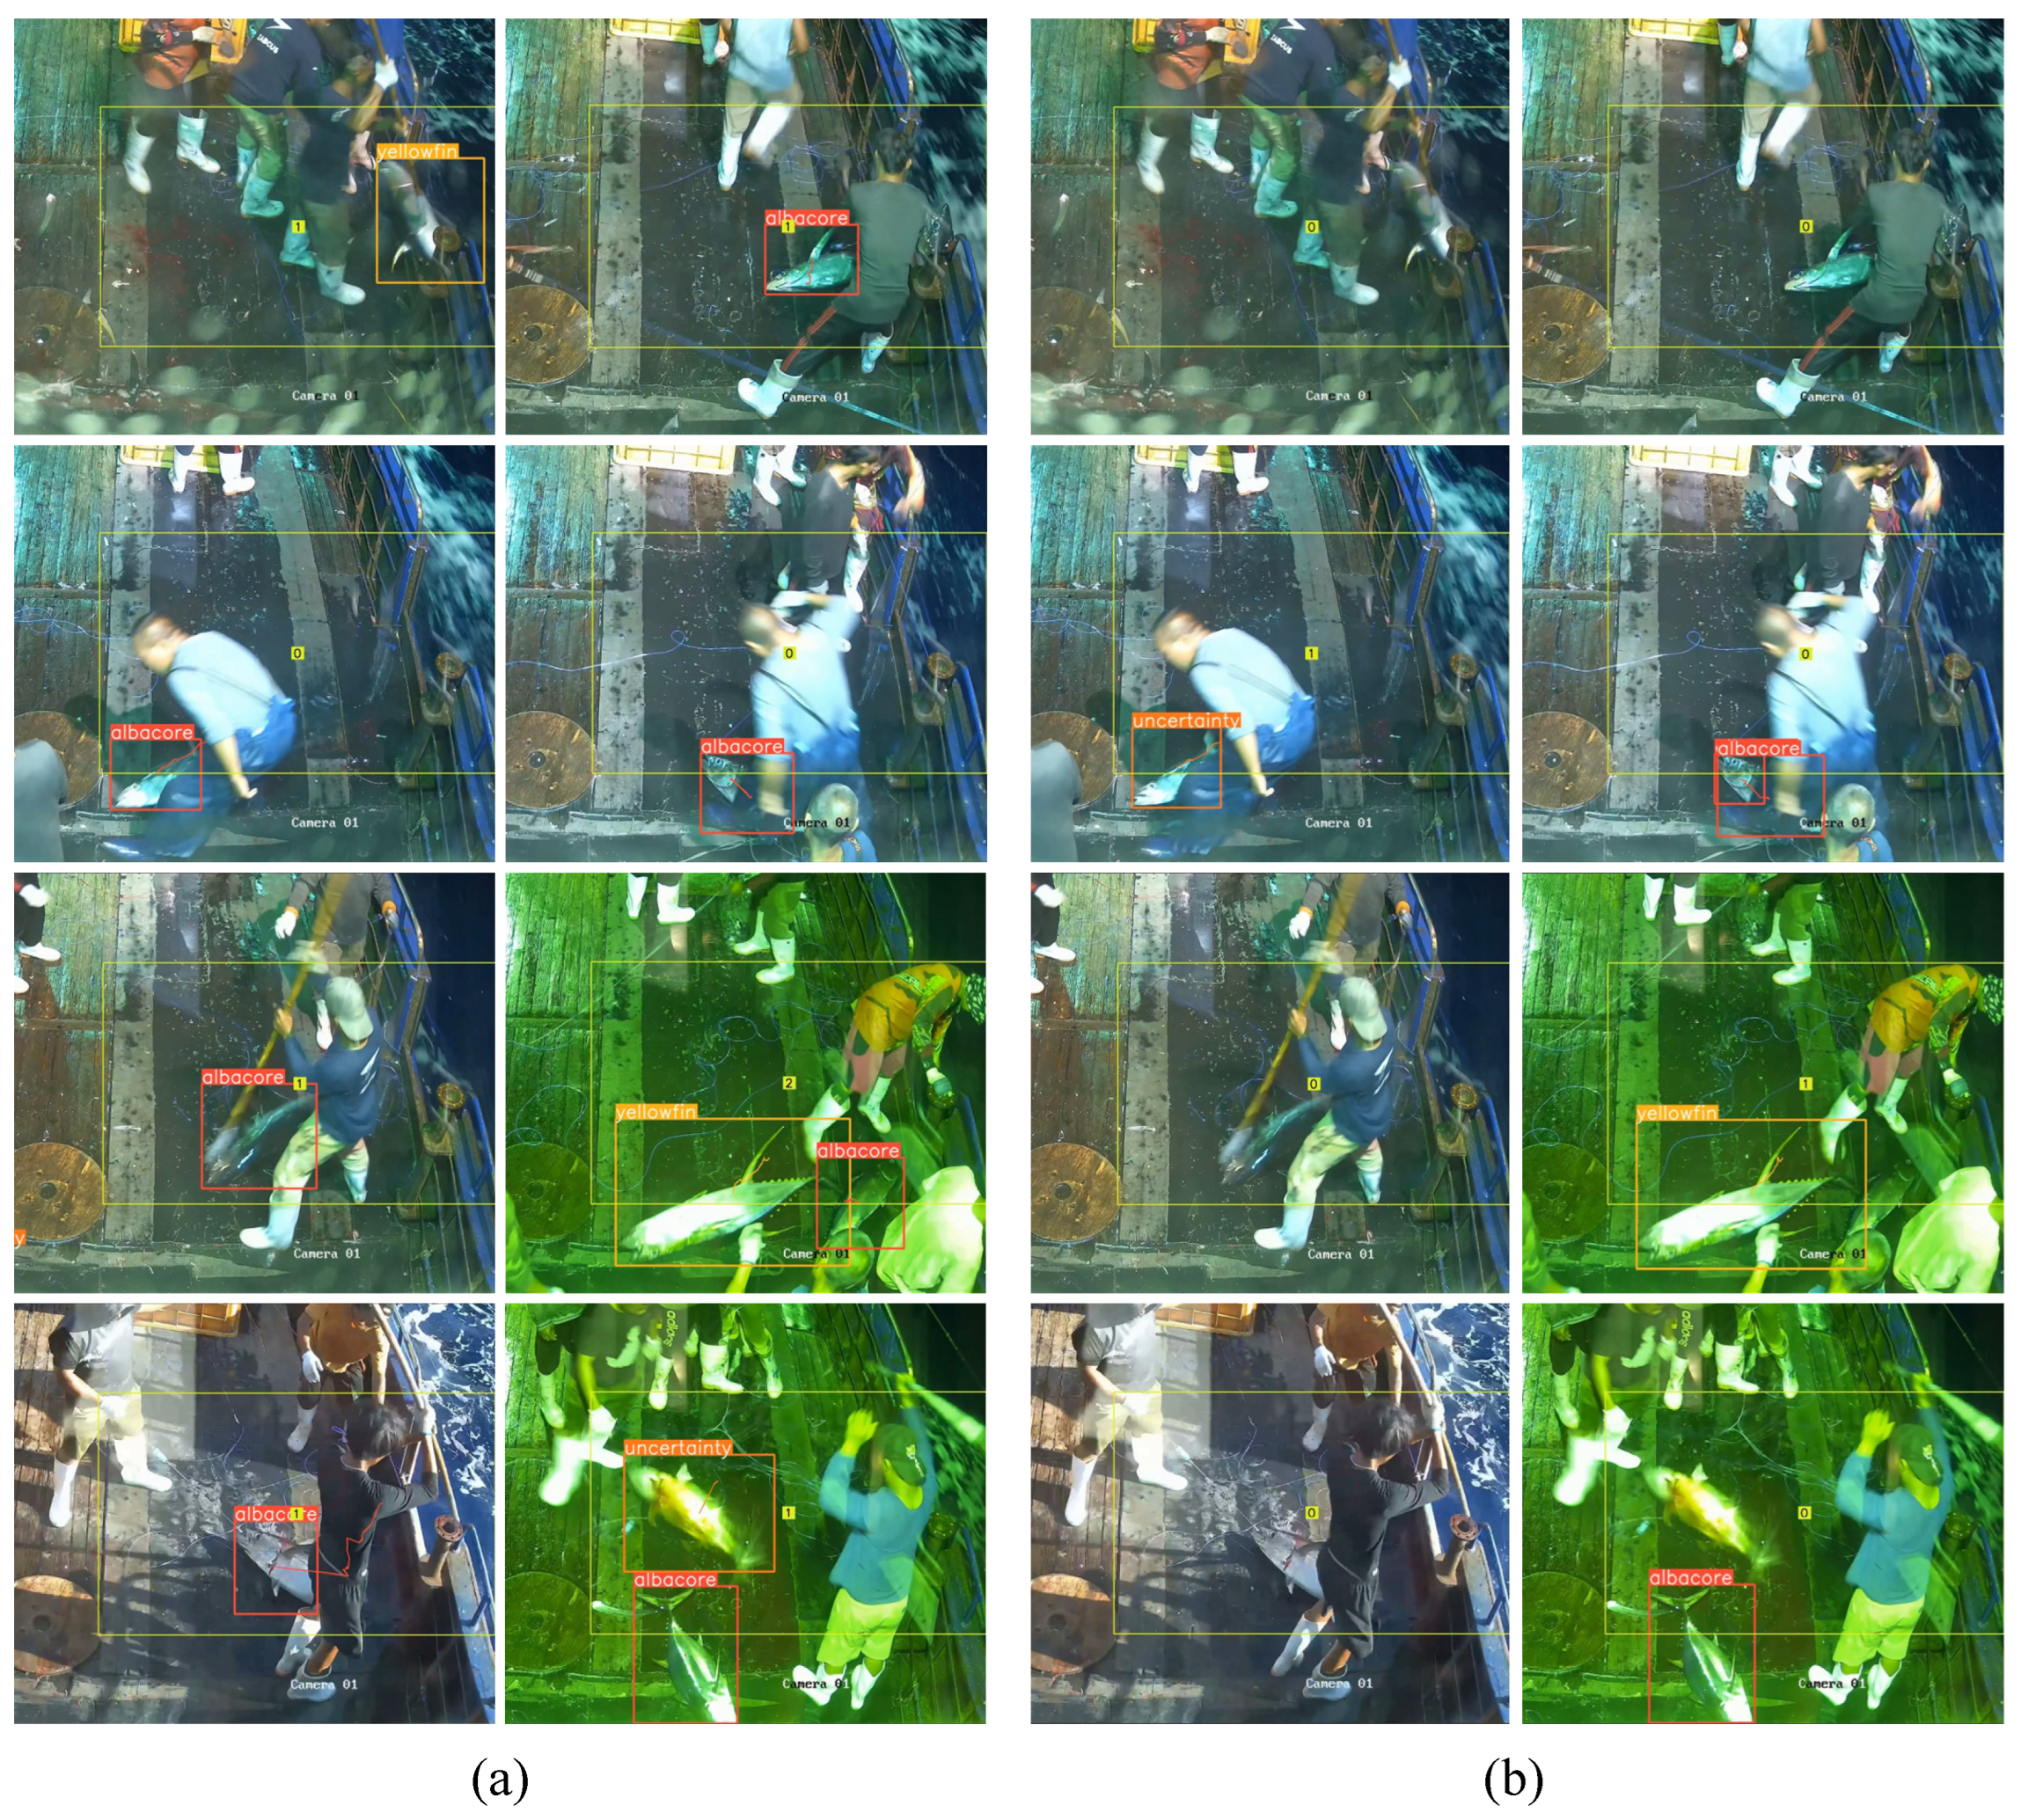
Figure 8 shows the difference in detection performance between our proposed network and YOLOv8n during the counting process.
4.3. Ablation Experiments
To validate the effectiveness of the proposed modules, we conducted a series of ablation experiments based on the YOLOv8n model. All experiments employed identical training settings and datasets to ensure comparability of results. Components were added sequentially, ultimately constructing the complete model, with results shown in
Table 2.
As can be seen from
Table 2, the baseline model YOLOv8n achieved mAP@0.5 and mAP@0.5:0.95 scores of 0.936 and 0.821, respectively. However, its parameter count was 3.01 M, computational load was 8.2 GFLOPs, and inference latency was 1.6 ms. After introducing the SCDown module, the parameter count decreased to 2.56 M, GFLOPs reduced to 7.8, and latency dropped to 1.3 ms, while the mAP metrics remained largely unchanged at 0.934 and 0.821, indicating that SCDown significantly compressed model complexity without sacrificing detection accuracy. Further addition of the PSA module significantly increased mAP@0.5 to 0.963, while mAP@0.5:0.95 also saw a slight improvement to 0.829, suggesting that this module effectively improved detection performance by enhancing the extraction of discriminative features from occluded and blurred targets. Embedding the C2f-RepGhost module subsequently restored mAP@0.5:0.95 to 0.83, with the parameter count slightly decreasing to 2.65 M, GFLOPs at 7.4, and latency remaining at 1.3 ms. This module improved feature fusion efficiency through its re-parameterized structure, aiding in the preservation of mid-level semantic information and inference acceleration. Finally, adding the C2fCIB module resulted in our proposed complete model, which maintained superior detection performance while achieving further lightweighting: parameter count only 2.44 M, GFLOPs 7.2, latency 1.2 ms, and mAP@0.5 and mAP@0.5:0.95 reaching 0.958 and 0.829, respectively. Compared to the baseline model, this model achieved accuracy gains while reducing inference latency by 25%. In summary, the collaborative design of the SCDown, PSA, C2f-RepGhost, and C2fCIB modules played key roles in suppressing background redundancy, enhancing target feature extraction, maintaining semantic integrity, and accelerating inference, effectively addressing challenges such as severe occlusion, motion blur, and classification confusion in the fishing vessel deck environment.
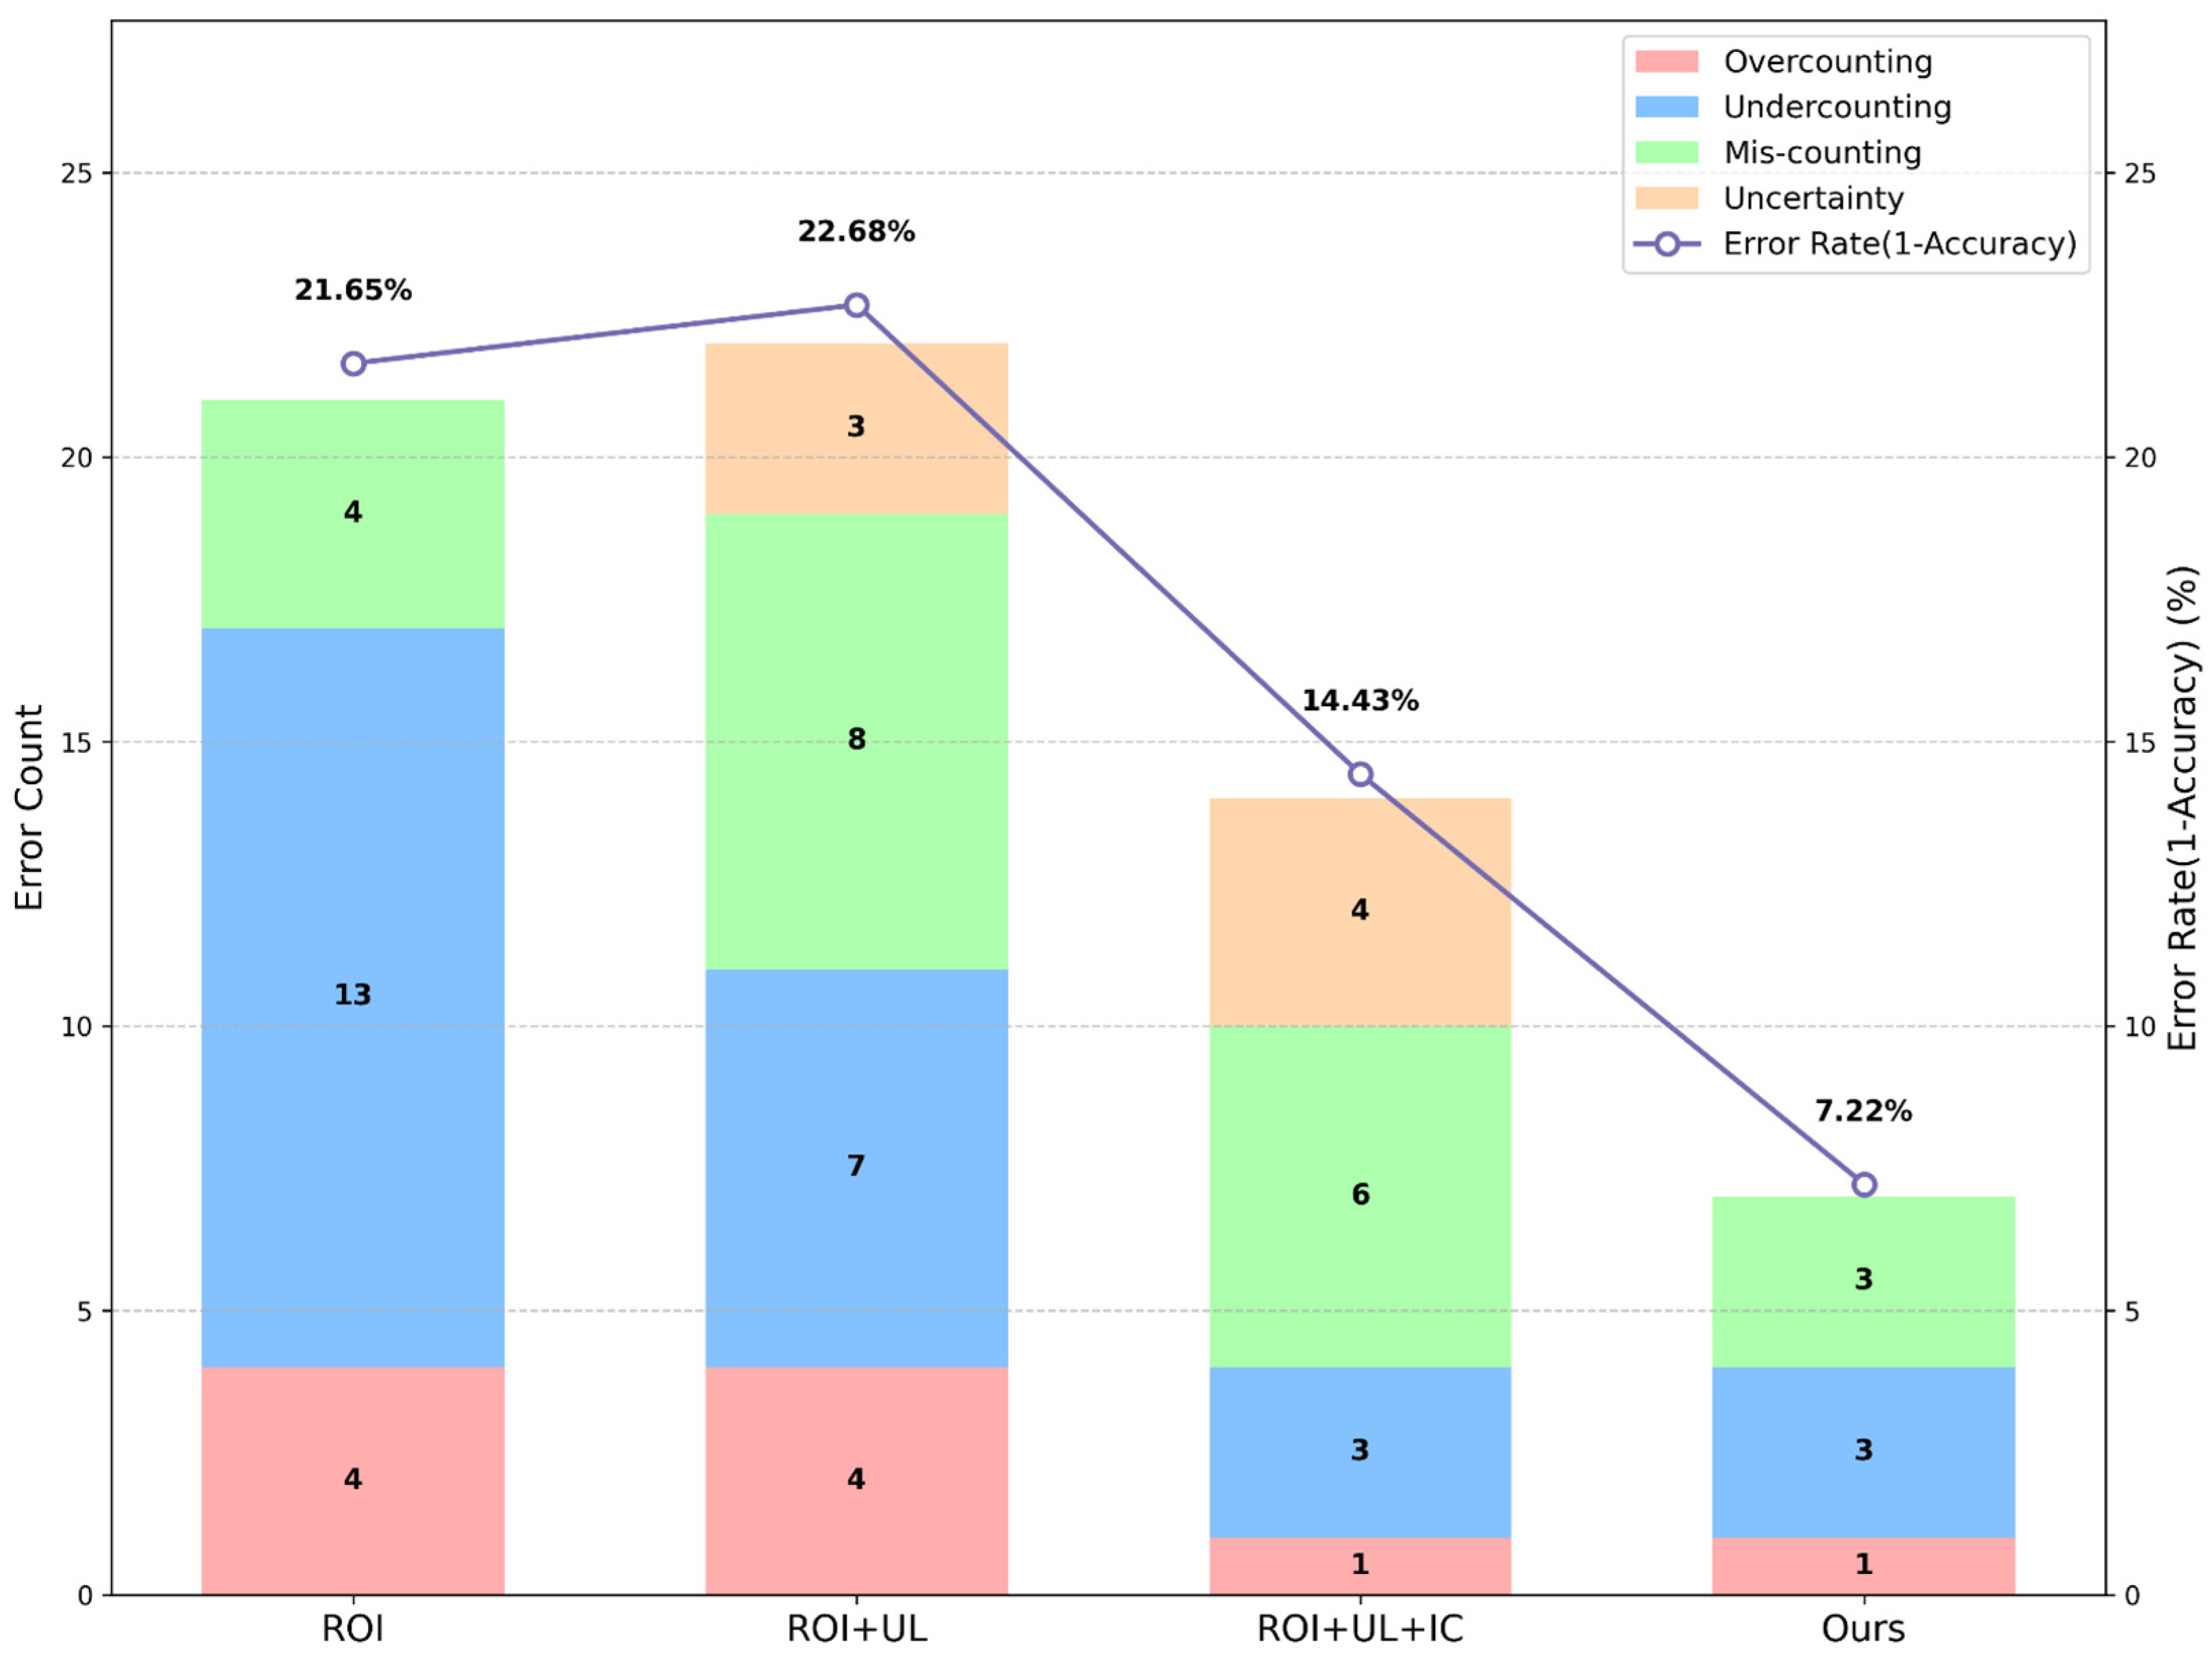
To validate the effectiveness of the proposed counting method, a series of ablation experiments were conducted. All experiments were based on the same fundamental counting method to ensure result comparability. Strategies were added sequentially to the counting method, ultimately constructing the complete method, with results shown in
Figure 9.
The ablation results for tuna counting indicate that using the improved YOLOv8n model, a medium-sized ROI region, and the ByteTrack tracker as the baseline counting method yielded a counting error rate of 21.65%, an error rate comparable to the range of manual recording errors [
2]. The counting errors produced by the baseline method were predominantly undercounting, a phenomenon likely originating from occlusions encountered by catches as they move out of the ROI region, leading to significant loss of target appearance features; once the loss exceeds the model’s recognition capability, target loss and undercounting occur.
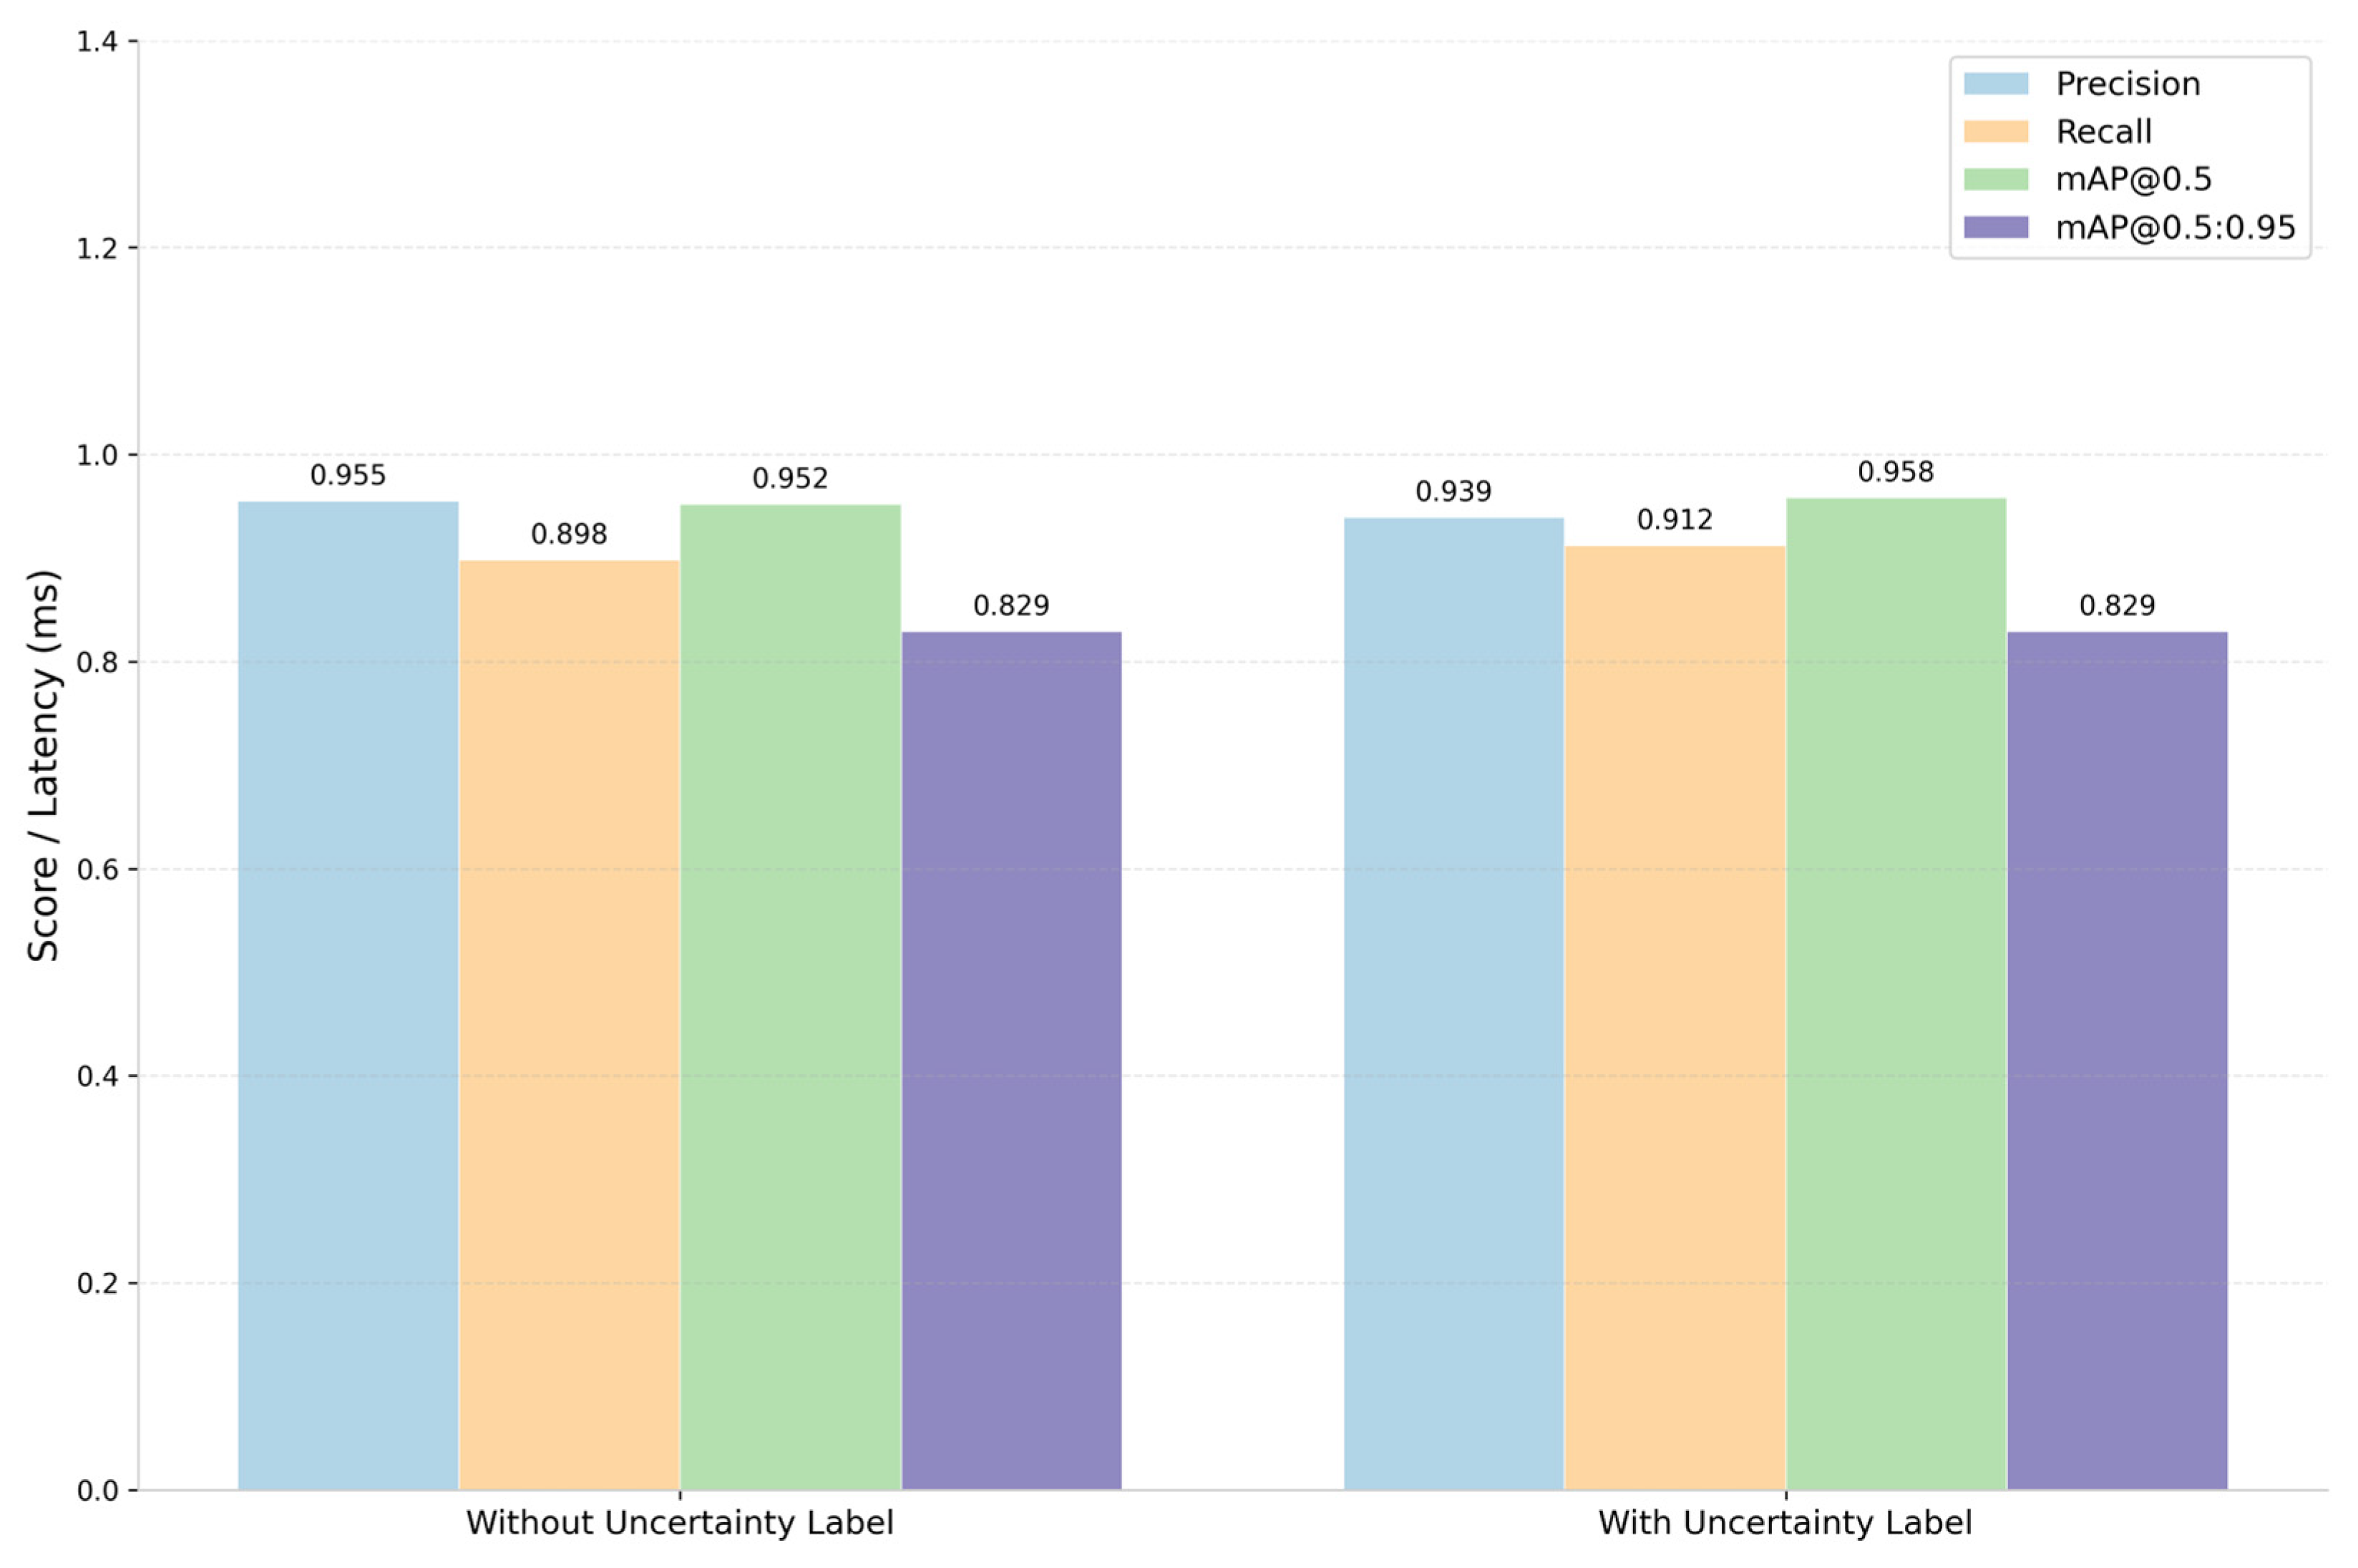
After introducing the “Uncertainty” label, experiments showed that this mechanism helped reduce the total omission of tuna counting targets. However, since marking a target as “Uncertainty” is not the final counting objective, it was still counted as an error statistically. The results showed that the frequency of undercounting decreased significantly, but the frequency of miscounting increased noticeably, indicating that the “Uncertainty” label improved the counting trigger rate but adversely affected species identification accuracy. Combined with data from
Figure 10, after training with this label, the average precision of the improved YOLOv8n slightly decreased from 0.955 to 0.939, while the average recall increased from 0.898 to 0.912, suggesting the model traded a slight increase in false positives for a reduction in missed detections; improved recall helps reduce undercounting, but decreased precision also leads to more miscounting.
Building upon the “Uncertainty” label, further introducing the ID Continuation mechanism to ByteTrack resulted in a further decrease in the frequencies of overcounting and undercounting errors, indicating that this mechanism effectively enhanced ID stability when targets cross the ROI boundary, thereby improving counting trigger reliability.
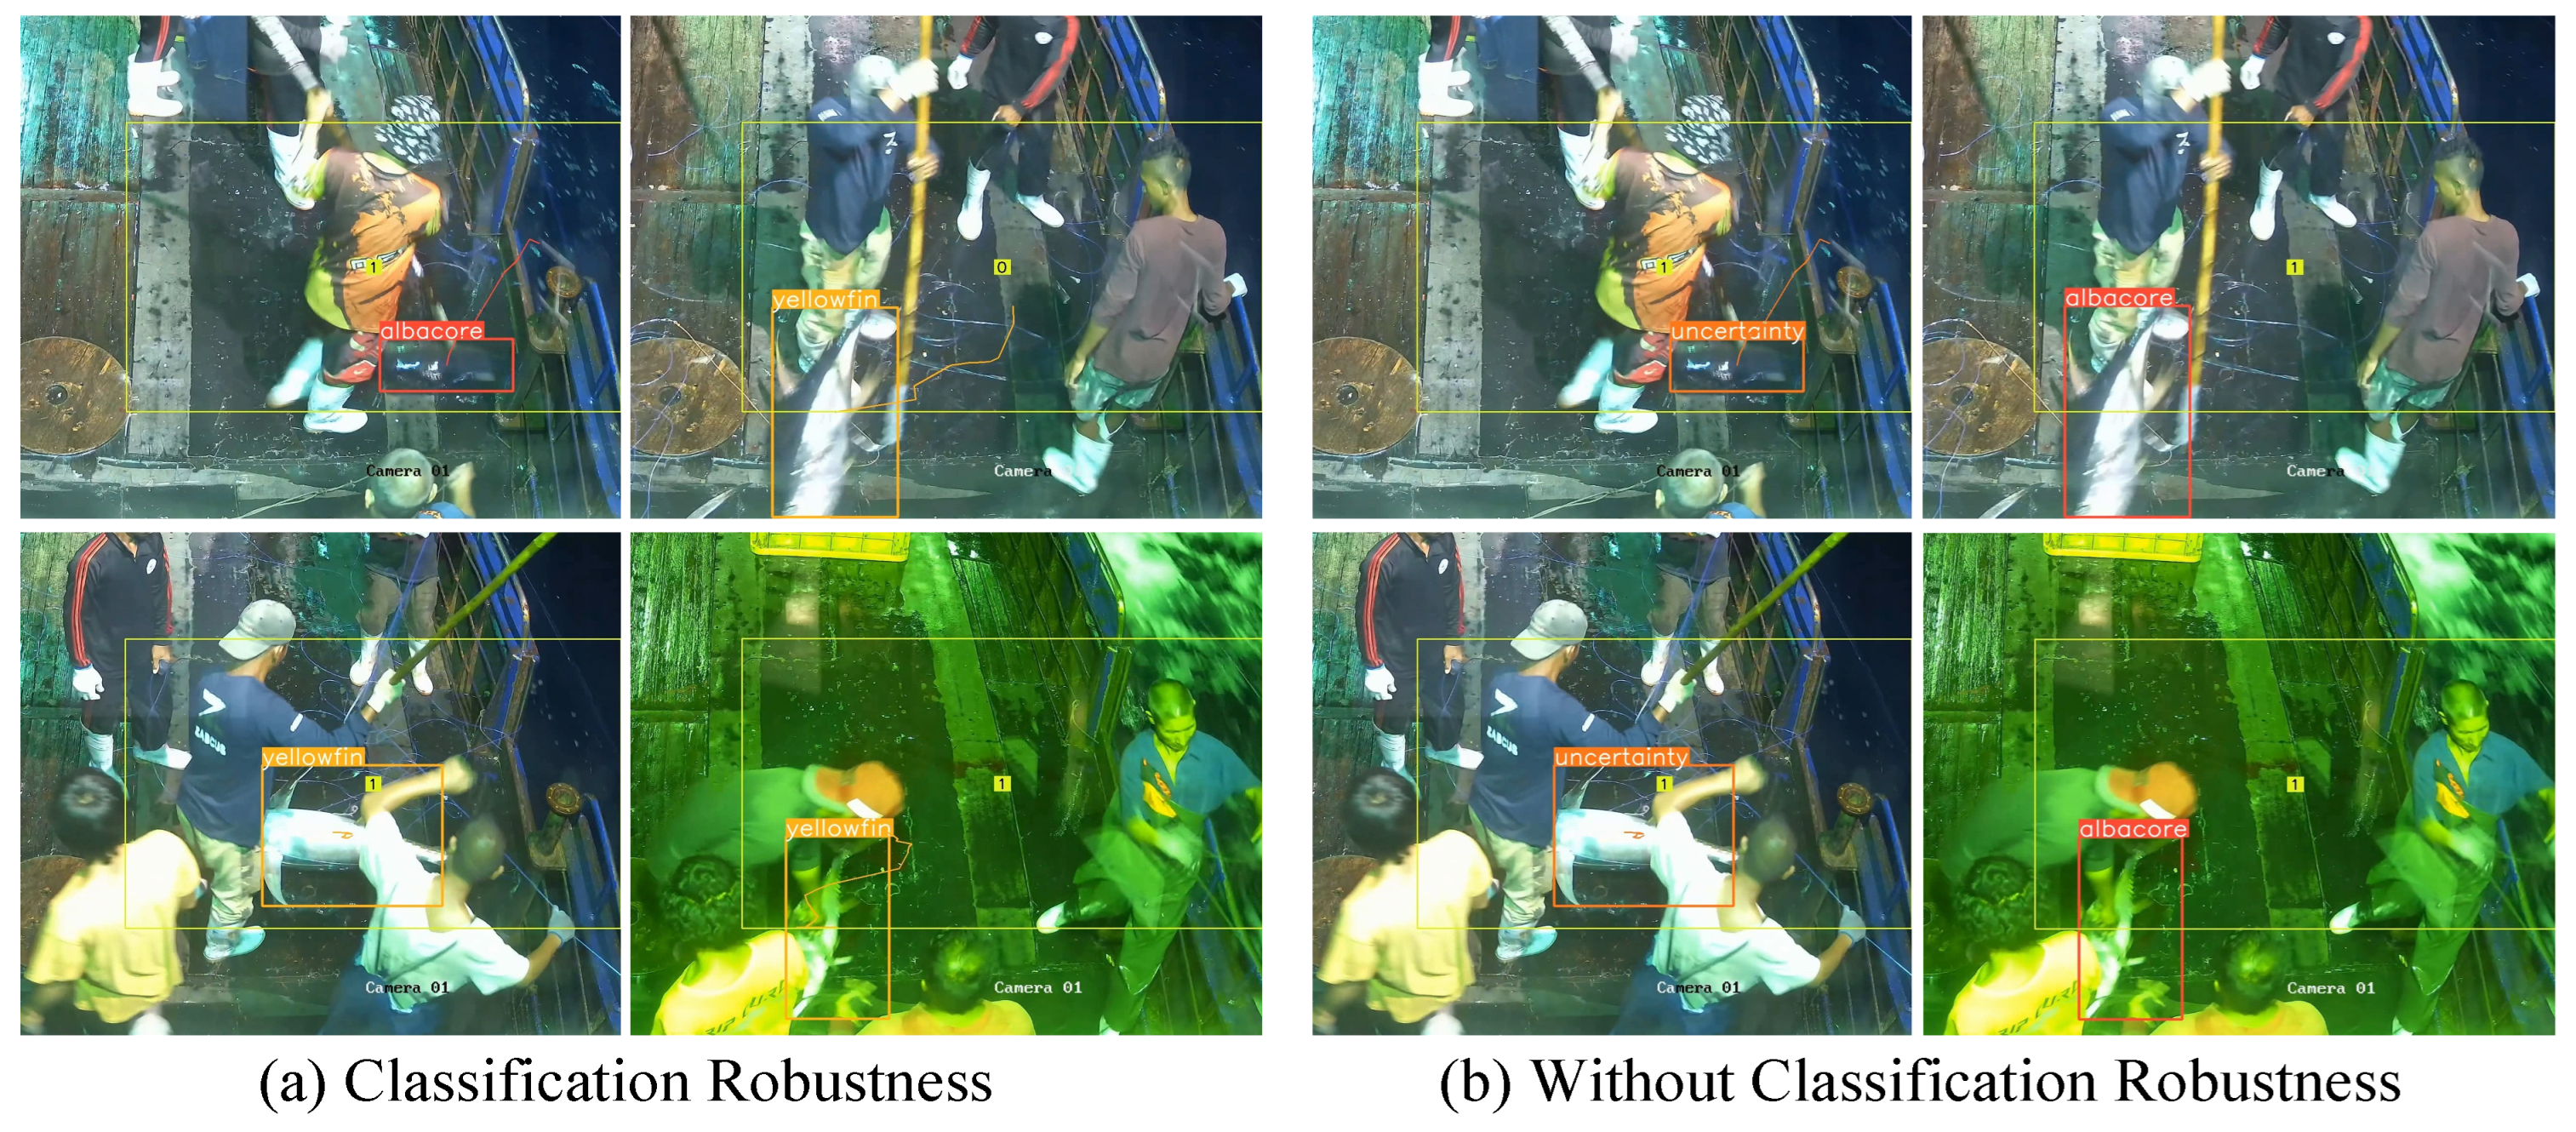
In the complete counting method proposed in this study, all error types were minimized to their lowest levels. Miscounting was further reduced, and targets originally marked as “Uncertainty” were more frequently correctly classified into specific tuna categories. The results demonstrate that the introduced classification robustness mechanisms can effectively address feature degradation and classification jitter caused by occlusion, enhancing the overall counting performance of the system in complex occlusion environments. The execution effect of classification robustness is shown in
Figure 11.
4.4. Generalization Experiments
To evaluate the generalization capability of the proposed improved model, we conducted validation experiments on the public Fishnet Open Image Database [
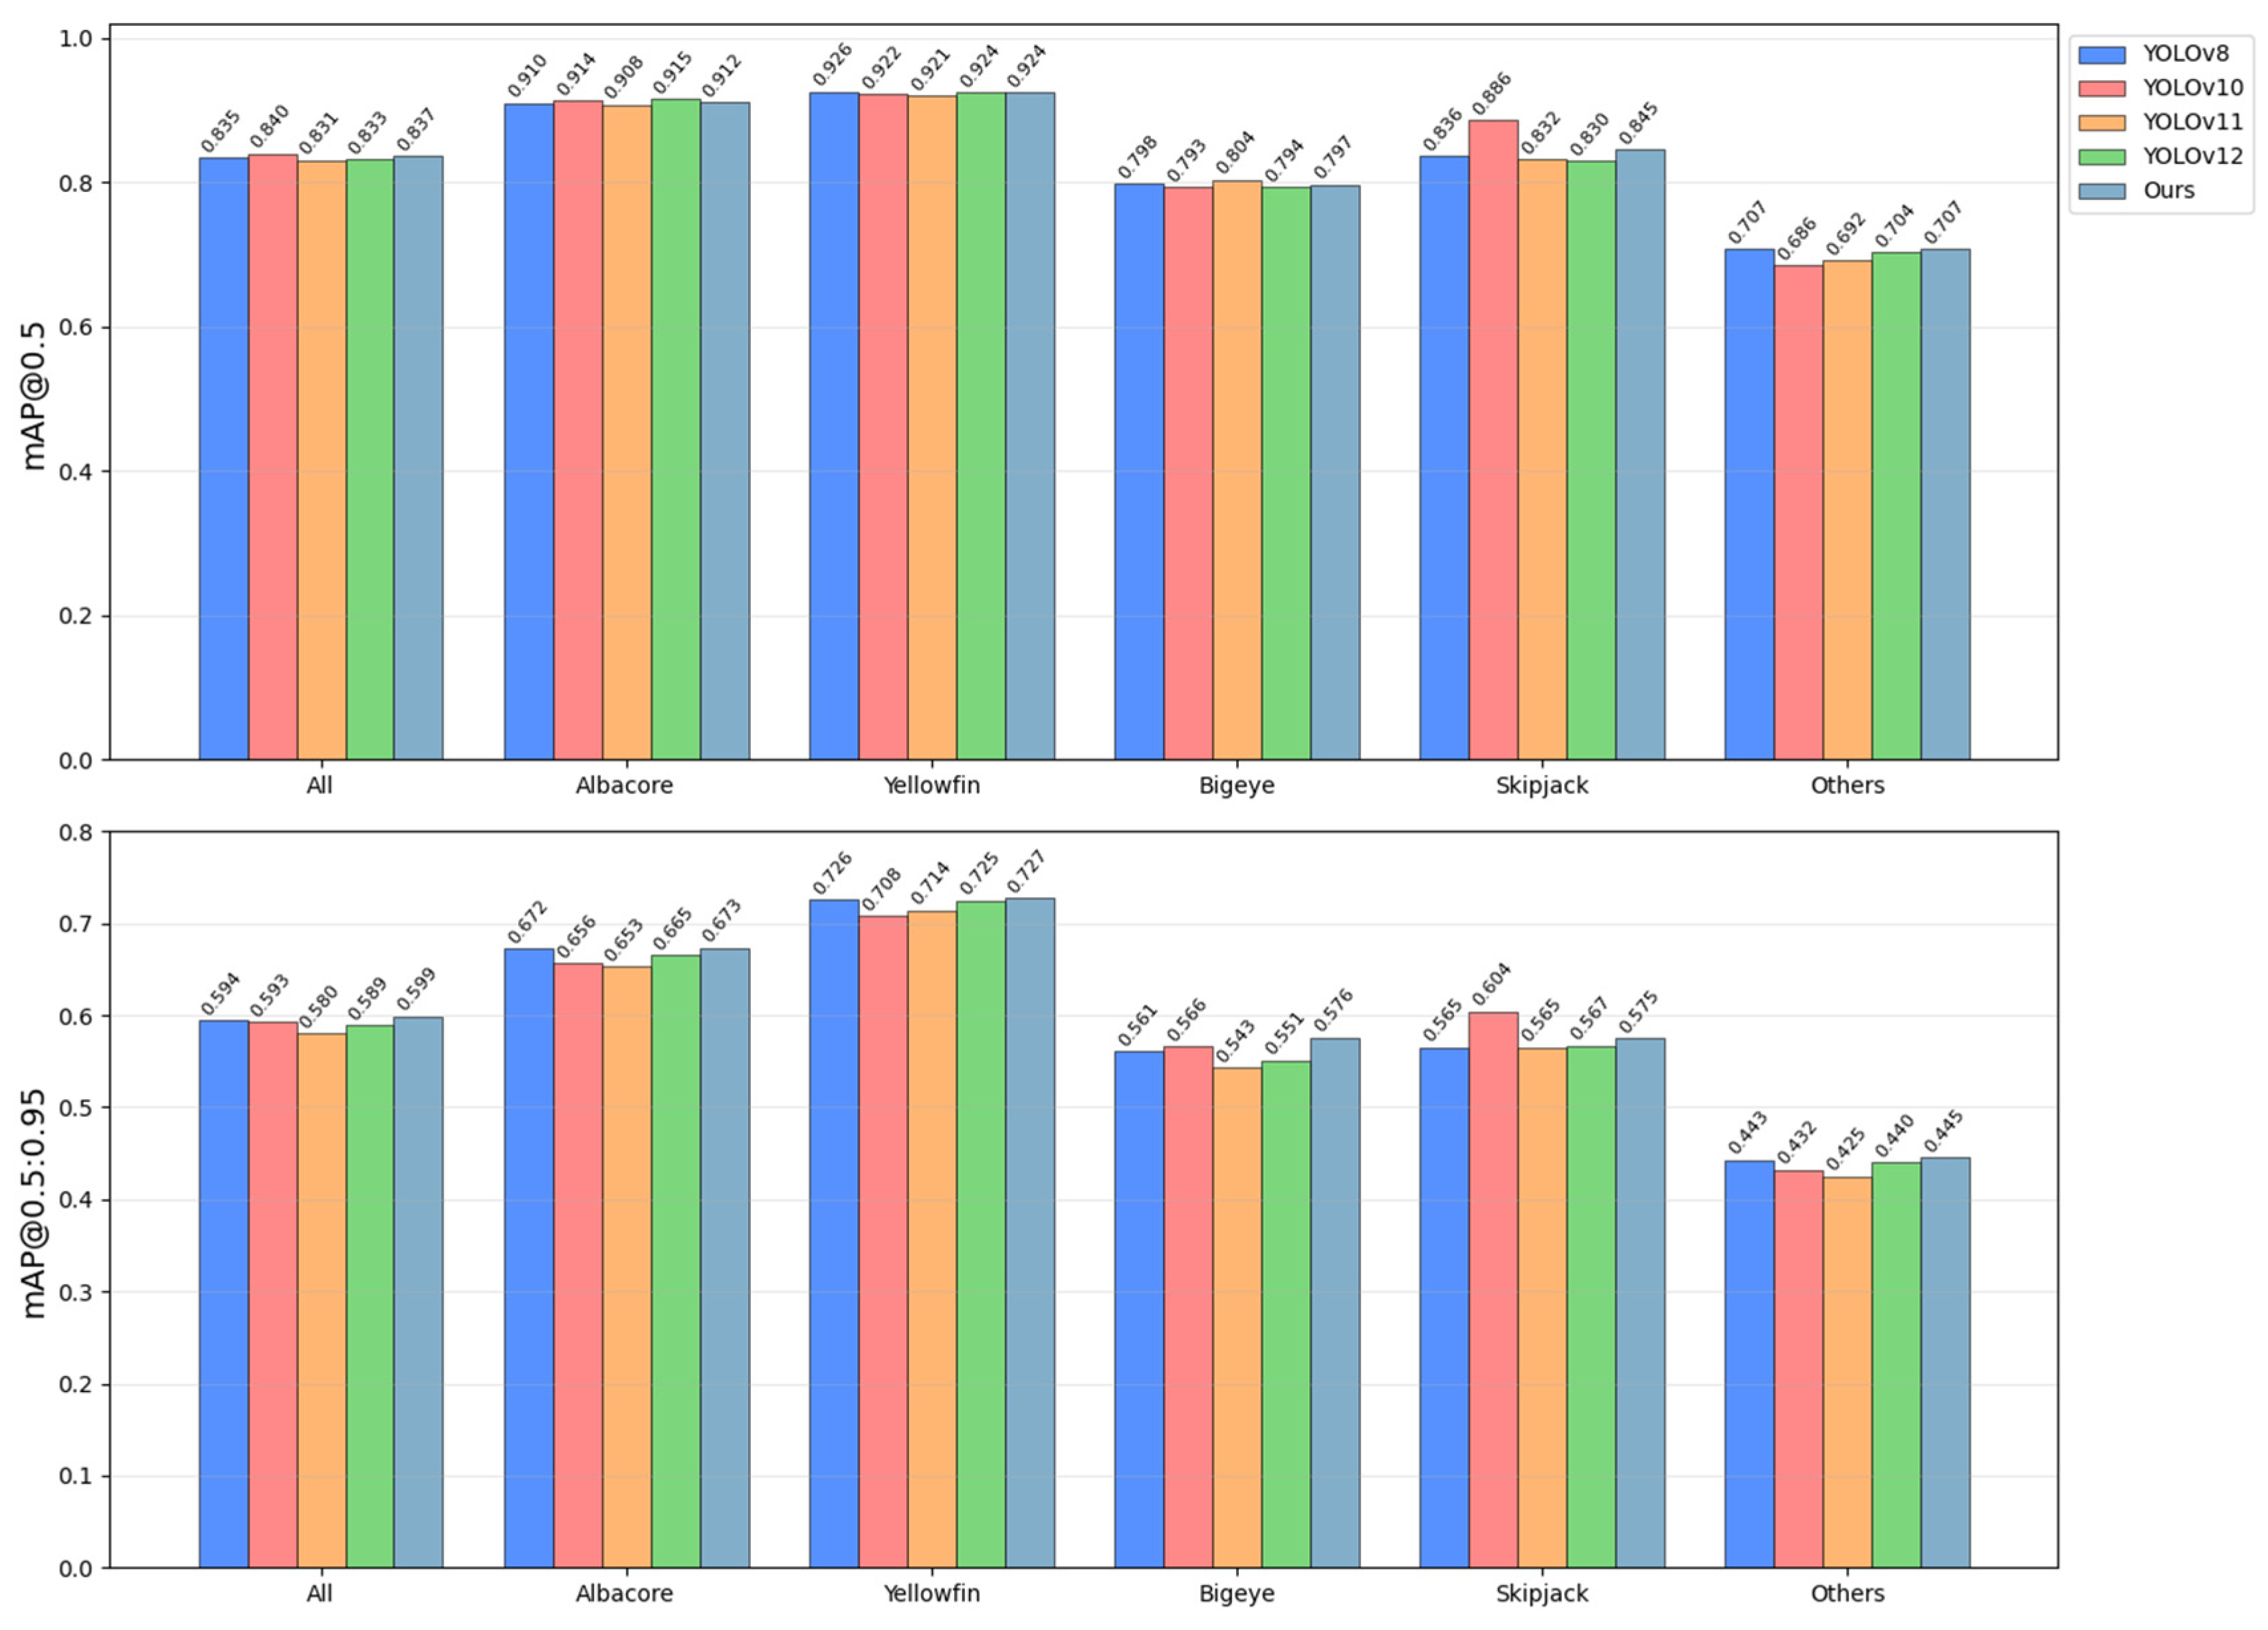
36]. This dataset originates from real fishing vessel electronic monitoring systems and contains images collected from at least 73 independent operational scenarios. Its environmental complexity and scene types share similarities with the vessel deck environment targeted in our study, providing an ideal benchmark for testing model generalization beyond our proprietary dataset. Since the original dataset provides annotations in “.csv” format incompatible with YOLO requirements, we performed systematic preprocessing: first filtering out images without fish and non-target annotations such as “human”; then consolidating all fish species other than albacore, yellowfin, bigeye, and skipjack into an others category; subsequently mapping albacore, yellowfin, bigeye, skipjack, and others to categorical indices; followed by converting bounding boxes from “[x_min, x_max, y_min, y_max]” to standard YOLO format and generating corresponding “.txt” annotation files for each image. To reduce redundancy from consecutive frames, we sampled at 5-frame intervals to initially form the dataset, then allocated the first of every five images with their annotations to the validation set, using the remainder for training, thereby ensuring data independence and representativeness. Through this process, the original 143,818 images were refined to 24,362 images, with 19,489 in the training set and 4873 in the validation set. The dataset ultimately contained 14,529 albacore tuna, 20,032 yellowfin tuna, 1904 bigeye tuna, 4310 skipjack, and 4609 others instances. The generalization capability comparison results are shown in
Figure 12.
The generalization experimental results on the Fishnet Open Image Database demonstrate that our proposed improved model achieves the best overall performance compared to a series of nano-scale YOLO baseline models. In terms of key evaluation metrics, our model reaches 0.837 in mAP@0.5, merely 0.003 lower than the top-performing YOLOv10, while in the more discriminative mAP@0.5:0.95 metric, our model scores 0.599, significantly outperforming all compared models—0.006 higher than YOLOv10. This comparative pattern remains consistent across category-specific analyses, particularly for challenging categories like Bigeye and Skipjack, where our model shows more pronounced advantages in mAP@0.5:0.95, demonstrating that the improvements we introduced substantially enhance model robustness in complex scenarios.
It should be noted, however, that although the model maintains a relative advantage on the Fishnet Open Image Database, its overall performance level is noticeably lower than on our proprietary dataset. This outcome may be attributed to inherent differences between the two datasets. First, the surveillance cameras in the Fishnet Open Image Database are typically positioned farther from the targets, resulting in smaller target sizes in the images and posing greater challenges for small object detection. In contrast, the cameras used in our study are installed at an appropriate height inside the vessel cabin, facilitating both maintenance and optimal observation distance. Second, some images in the Fishnet Open Image Database have relatively lower resolution, and under complex deck conditions, target feature distinctiveness and clarity are compromised, presenting significant difficulties for any detector. Despite these challenges, our improved model still demonstrates stable performance advantages on this demanding external dataset. These results further validate the adaptability and robustness of our method across different scenarios and data characteristics.
5. Discussion
5.1. Significance of “Uncertainty” Label for Object Detection, Tracking, and Counting
In recent years, automated fish detection technology has become a research focus in fishery informatization. With the advancement of deep learning technologies, detection model-based approaches have gradually emerged as the mainstream solution for fish detection due to their stronger background adaptability and multi-category expansion capabilities. The YOLO series, as a representative of single-stage detectors, has been widely adopted and improved to address specific challenges in fish detection such as occlusion, blur, and small targets. However, this study aims to highlight that beyond enhancing network structures to improve detection accuracy, elevating the model’s lower limit of recognition capability in scenarios with severely degraded features is equally important for achieving stable and reliable counting.
In complex operational environments like fishing vessel decks, severe occlusion, motion blur, and human operational interference can lead to significant degradation of target visual features. In some cases, the discernibility of targets may even fall below the threshold of human judgment. It is noteworthy that such low-quality samples are often discarded during conventional dataset construction to ensure annotation quality [
37]. However, this practice simultaneously prevents models from learning to handle these extreme conditions. Feature loss due to occlusion and motion anomalies may not only reduce detection confidence but also lead to disappearing bounding boxes, abrupt trajectory changes, and category misclassification, thereby posing serious challenges to subsequent tracking and counting [
38].
To address the aforementioned issues, this study introduces an “uncertainty” label mechanism. The core value of this mechanism lies in providing the detection module with a reliable intermediate state processing capability. It allows the model to temporarily assign tuna targets with highly ambiguous features to the “uncertainty” category, rather than forcing them into a specific species category or discarding them outright. As shown in the ablation study (
Figure 10), after introducing this label, the average recall of the improved model increased from 0.898 to 0.912, indicating that the mechanism effectively mitigates missed detections. Although the average precision slightly decreased from 0.955 to 0.939, it remained at a relatively high level, demonstrating that the detection robustness was significantly enhanced while maintaining recognition accuracy.
However, the introduction of the “uncertainty” label also brings new challenges to the subsequent tracking and counting processes. On one hand, short-term occlusion may cause originally clear targets to be demoted to the “uncertainty” category. On the other hand, instantaneous jitter in appearance features may cause normal targets to frequently switch between “uncertainty” and specific categories. These issues disrupt the stability of target categories and ultimately affect counting accuracy.
To solve these challenges, this study implements three improvements to the ByteTrack algorithm: First, an ID continuation mechanism is introduced to enhance the ability to reassociate targets after brief disappearances. Second, an Uncertainty Low-Priority strategy is adopted, stipulating that targets historically confirmed to belong to a definite category cannot be demoted to “uncertainty” in subsequent frames, simulating the human cognitive process of maintaining judgments based on historical observations. Third, a Label Jitter Suppression mechanism is implemented, requiring that non-“uncertainty” categories must be consistently assigned a new category label over multiple consecutive frames (e.g., 15 frames) before a switch is allowed, effectively filtering out classification noise caused by transient feature ambiguity. These strategies effectively maintain category continuity and identity stability at a low computational cost, mitigating label degradation and jitter problems. As evidenced by the ablation experiment results in
Figure 9, the counting error rate of the complete method significantly decreased, demonstrating that these improvements effectively address the temporal consistency issues introduced by the “uncertainty” label, leading to a substantial enhancement in overall counting performance.
5.2. Application Prospects and Limitations
The automated tuna catches counting method for fishing vessel decks proposed in this study demonstrates potential for practical application in fisheries operations. Designed to address complex conditions such as severe occlusion, motion blur, and intense interference characteristic of vessel deck environments, this system integrates an “uncertainty” special category label with an improved YOLOv8n detection model, an optimized ByteTrack multi-object tracking algorithm, and a closed polygonal counting region strategy. This integration enables high-precision and efficient tuna counting in this specific scenario. Deployable within the deck monitoring systems of fishing fleets, the system facilitates real-time identification and counting of catches while accurately outputting statistical results. Through manual verification, the expected accuracy rate reaches 92.78%, surpassing traditional manual counting methods. This approach not only enhances the reliability of catch data in longline fisheries but also effectively reduces labor costs and time consumption. Likely to gain recognition from fisheries management authorities, the method is suitable for pelagic fishery catch statistics and resource assessment, providing crucial data support for tuna stock management. Looking forward, with advancements in satellite communication and vessel networking technologies, the system could potentially integrate with onboard sensors (e.g., BeiDou positioning systems, temperature-depth recorders) to automatically correlate fishing locations, time, and environmental data, transmitting this information as data messages back to a central database. This would provide comprehensive information support for fisheries production management, promoting the automation goals of “precise fishing monitoring” and “sustainable fishery resource management” in longline fisheries.
It should be noted that while the proposed method performs well in counting tuna catches for longline fisheries, its design is specifically tailored to this context, and its applicability to other domains requires further validation. This specificity stems from several factors: tuna, as relatively large catches, need to be moved to the side of the deck after capture to facilitate subsequent operations, concentrating target appearances near the landing area and providing favorable conditions for the current counting method. Furthermore, catch density on longline vessels is relatively low, and movement on the deck approximates two-dimensional motion. The primary source of occlusion also differs from other scenarios—while aquaculture settings or fish trays must address inter-fish occlusion, this system primarily handles occlusion caused by crew operations, making strategies like ID continuation particularly effective for enhancing tracking stability.
6. Conclusions
This study addresses the automatic counting requirement for tuna catches in the complex occlusion environment of pelagic longline fishing vessel decks by proposing an uncertainty label-driven tuna catch counting method. By adopting a closed polygonal counting region to replace the collision detection line design, the system enhances the capture capability for targets moving in different directions to a certain extent. The detection module integrates lightweight components such as SCDown, PSA, C2fCIB, and C2f-RepGhost to improve the YOLOv8 network. Experiments show that the improved YOLOv8n model achieves mAP@0.5 and mAP@0.5:0.95 scores of 0.958 and 0.829, respectively, representing improvements over the original version, while reducing the model’s parameter count, computational load, and inference latency by 18.9%, 12.2%, and 25.0%, respectively. The introduced “uncertainty” label and corresponding processing strategies, combined with the anti-label jitter and low-priority counting mechanisms in the improved ByteTrack algorithm, aim to mitigate the impact of classification uncertainty under severe occlusion and image blur, thereby enhancing the stability of target identity and category determination. In practical scenarios on fishing vessel decks, the proposed method achieves a counting accuracy of 92.78%, which is 14.43 percentage points higher than the baseline solution’s 78.35%, demonstrating its potential for application in complex environments. This study provides an approach for catch statistics tasks in occlusion-prone environments and offers a valuable reference for the development of automated fisheries monitoring. Future work will focus on optimizing the system’s adaptability on edge devices and exploring multi-modal fusion strategies to ensure stable operation on resource-constrained equipment.
