4.1. Experimental Analysis
The experiment setup (for both analysis and final results) consists of utilizing a smart device (i.e., smart glasses or smartphone) camera (HD 720p) positioned at a stable viewing distance (approximately 43 cm) from the prompting device node. This node consists of a desktop PC monitor (with 1920 × 1080 native pixel resolution). The lighting conditions were considered as the default, i.e., at normal room lighting. There were no visible obstacles between the camera and the source. Conditions such as the viewing angle and line of sight were not considered and will be explored in future work. An example of the experiment’s functionality follows in
Figure 15.
The (pre-final) visual experimental setup consisted of capturing two image types:
To analyze the image statistics of each image type, the skimage Python library was utilized, and additional analysis on various statistics, i.e., number of pixels per color channel, image entropy, and various histograms, was also performed. The goal of this initial setup is to understand which is the most efficient optical data transmission type through the visible spectrum. We also investigate image entropy. In information theory, information entropy is the log-base-2 of the possible outcomes for a message. For an image, local entropy is related to the complexity of a given neighborhood, typically defined by a structuring element. The entropy filter can detect subtle variations in the local gray level distribution.
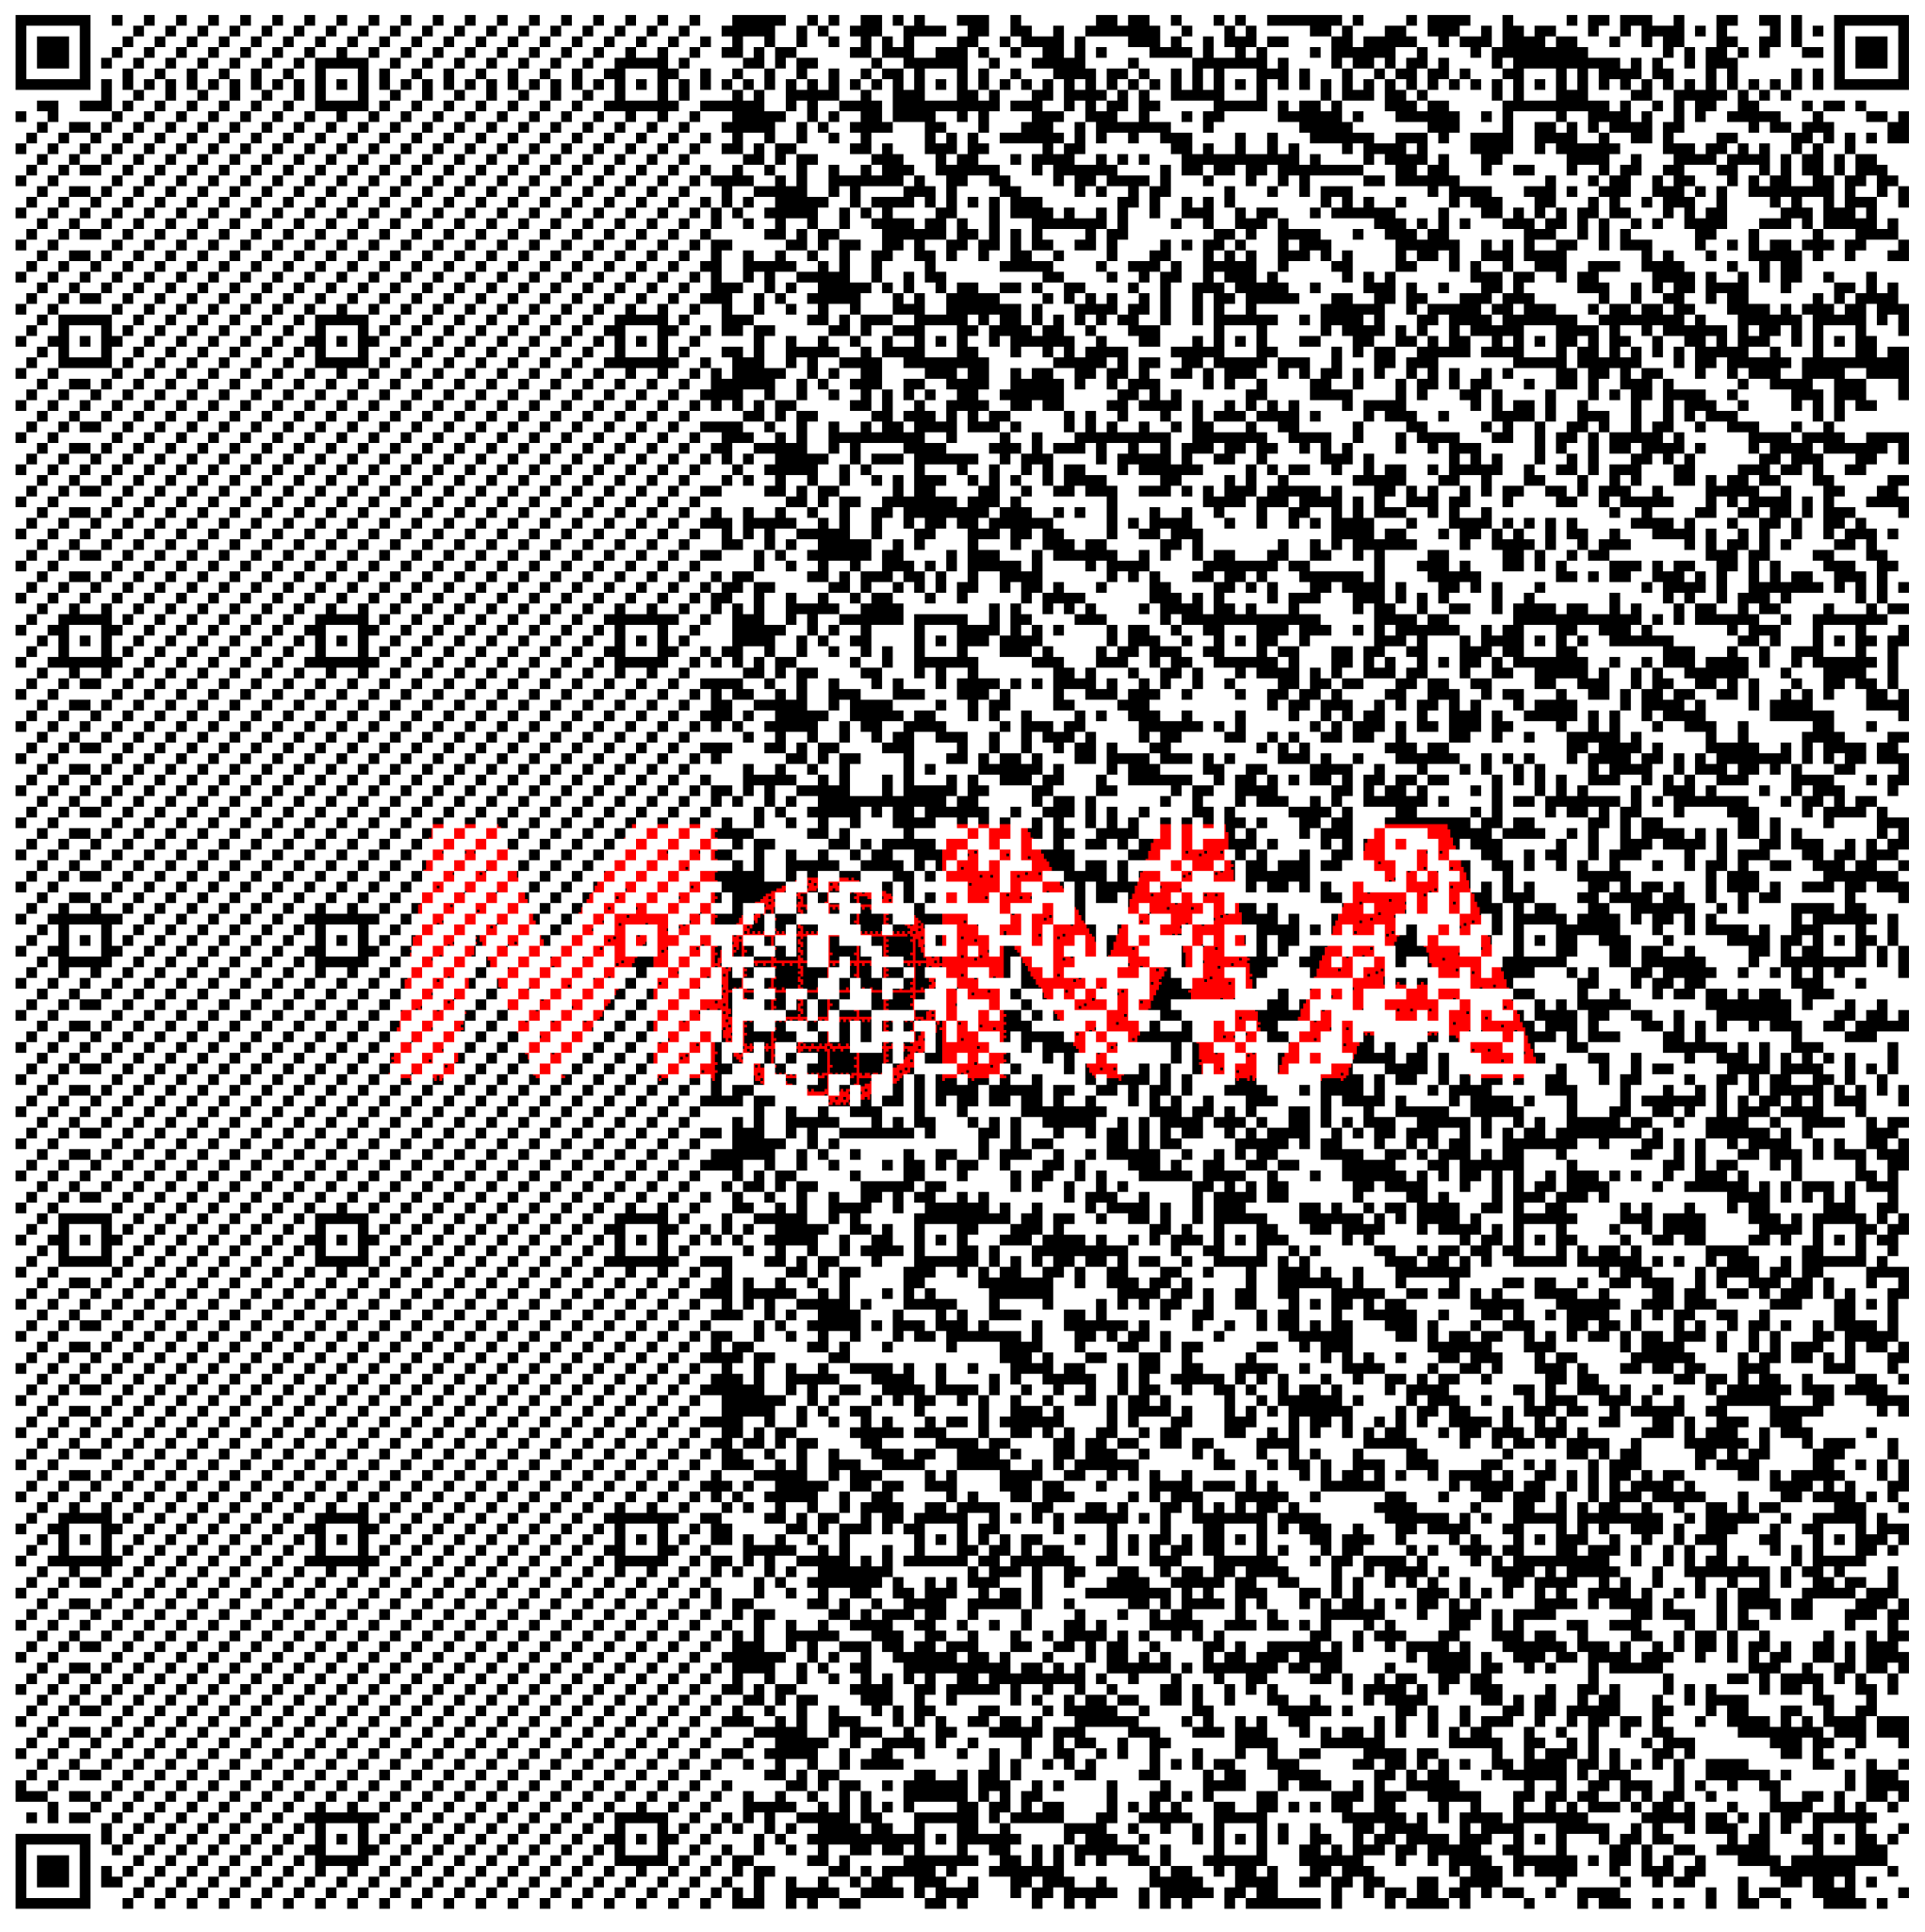
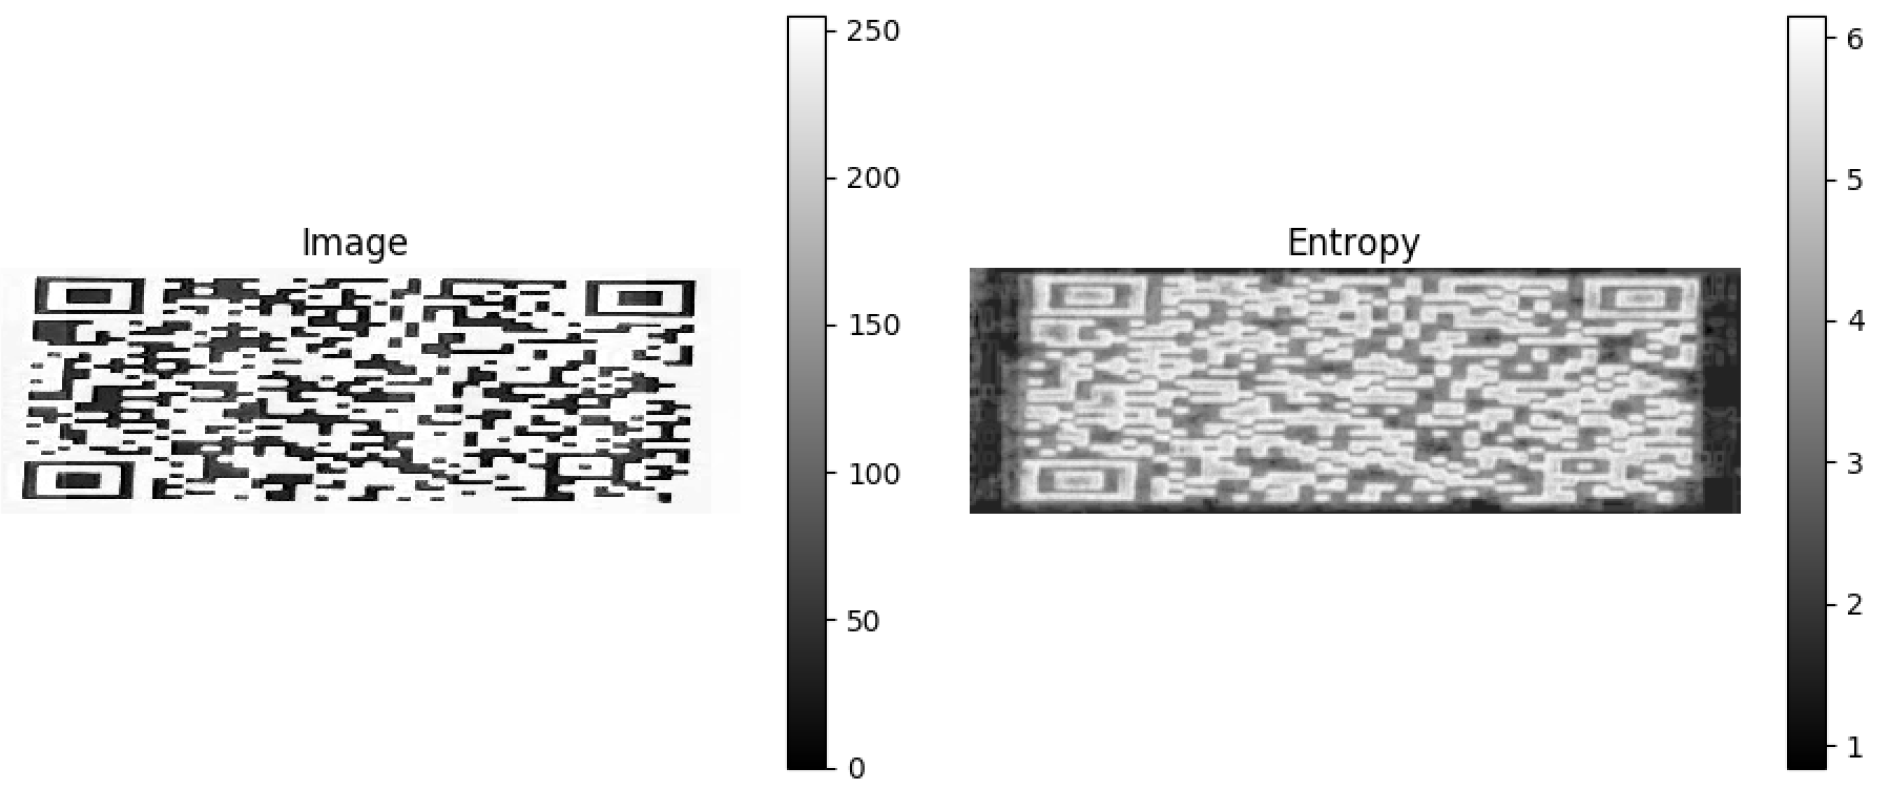
4.1.1. QR Low
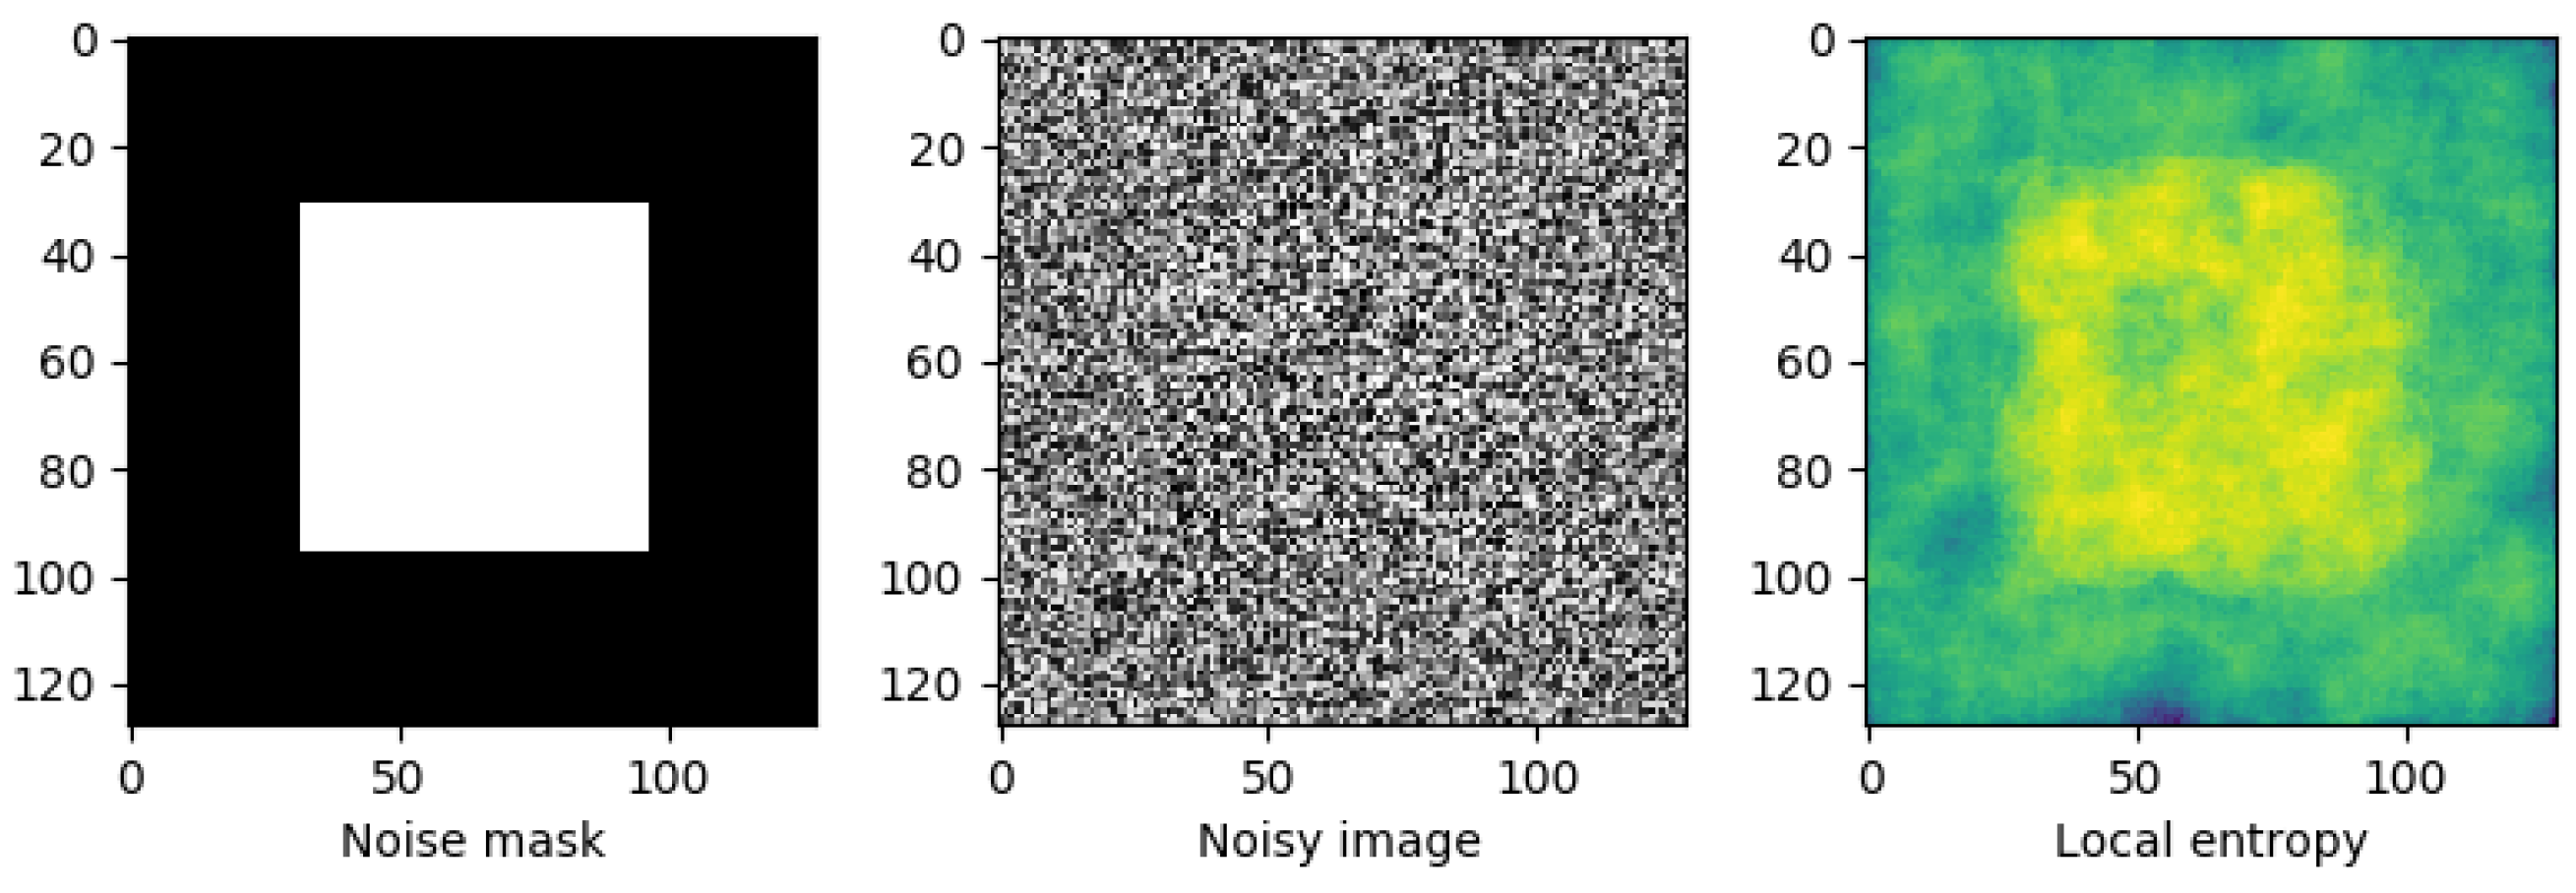
In the first example, the image comprises two surfaces with slightly different distributions. The image has a uniform random distribution in the range [
, +14] in the middle of the image and a uniform random distribution in the range [
, 15] at the image borders, both centered at a gray value of 128. We compute the local entropy measure to detect the central square using a circular structuring element of a radius big enough to capture the local gray level distribution, as shown in
Figure 16. The second example shows how to detect texture in the camera image using a smaller structuring element.
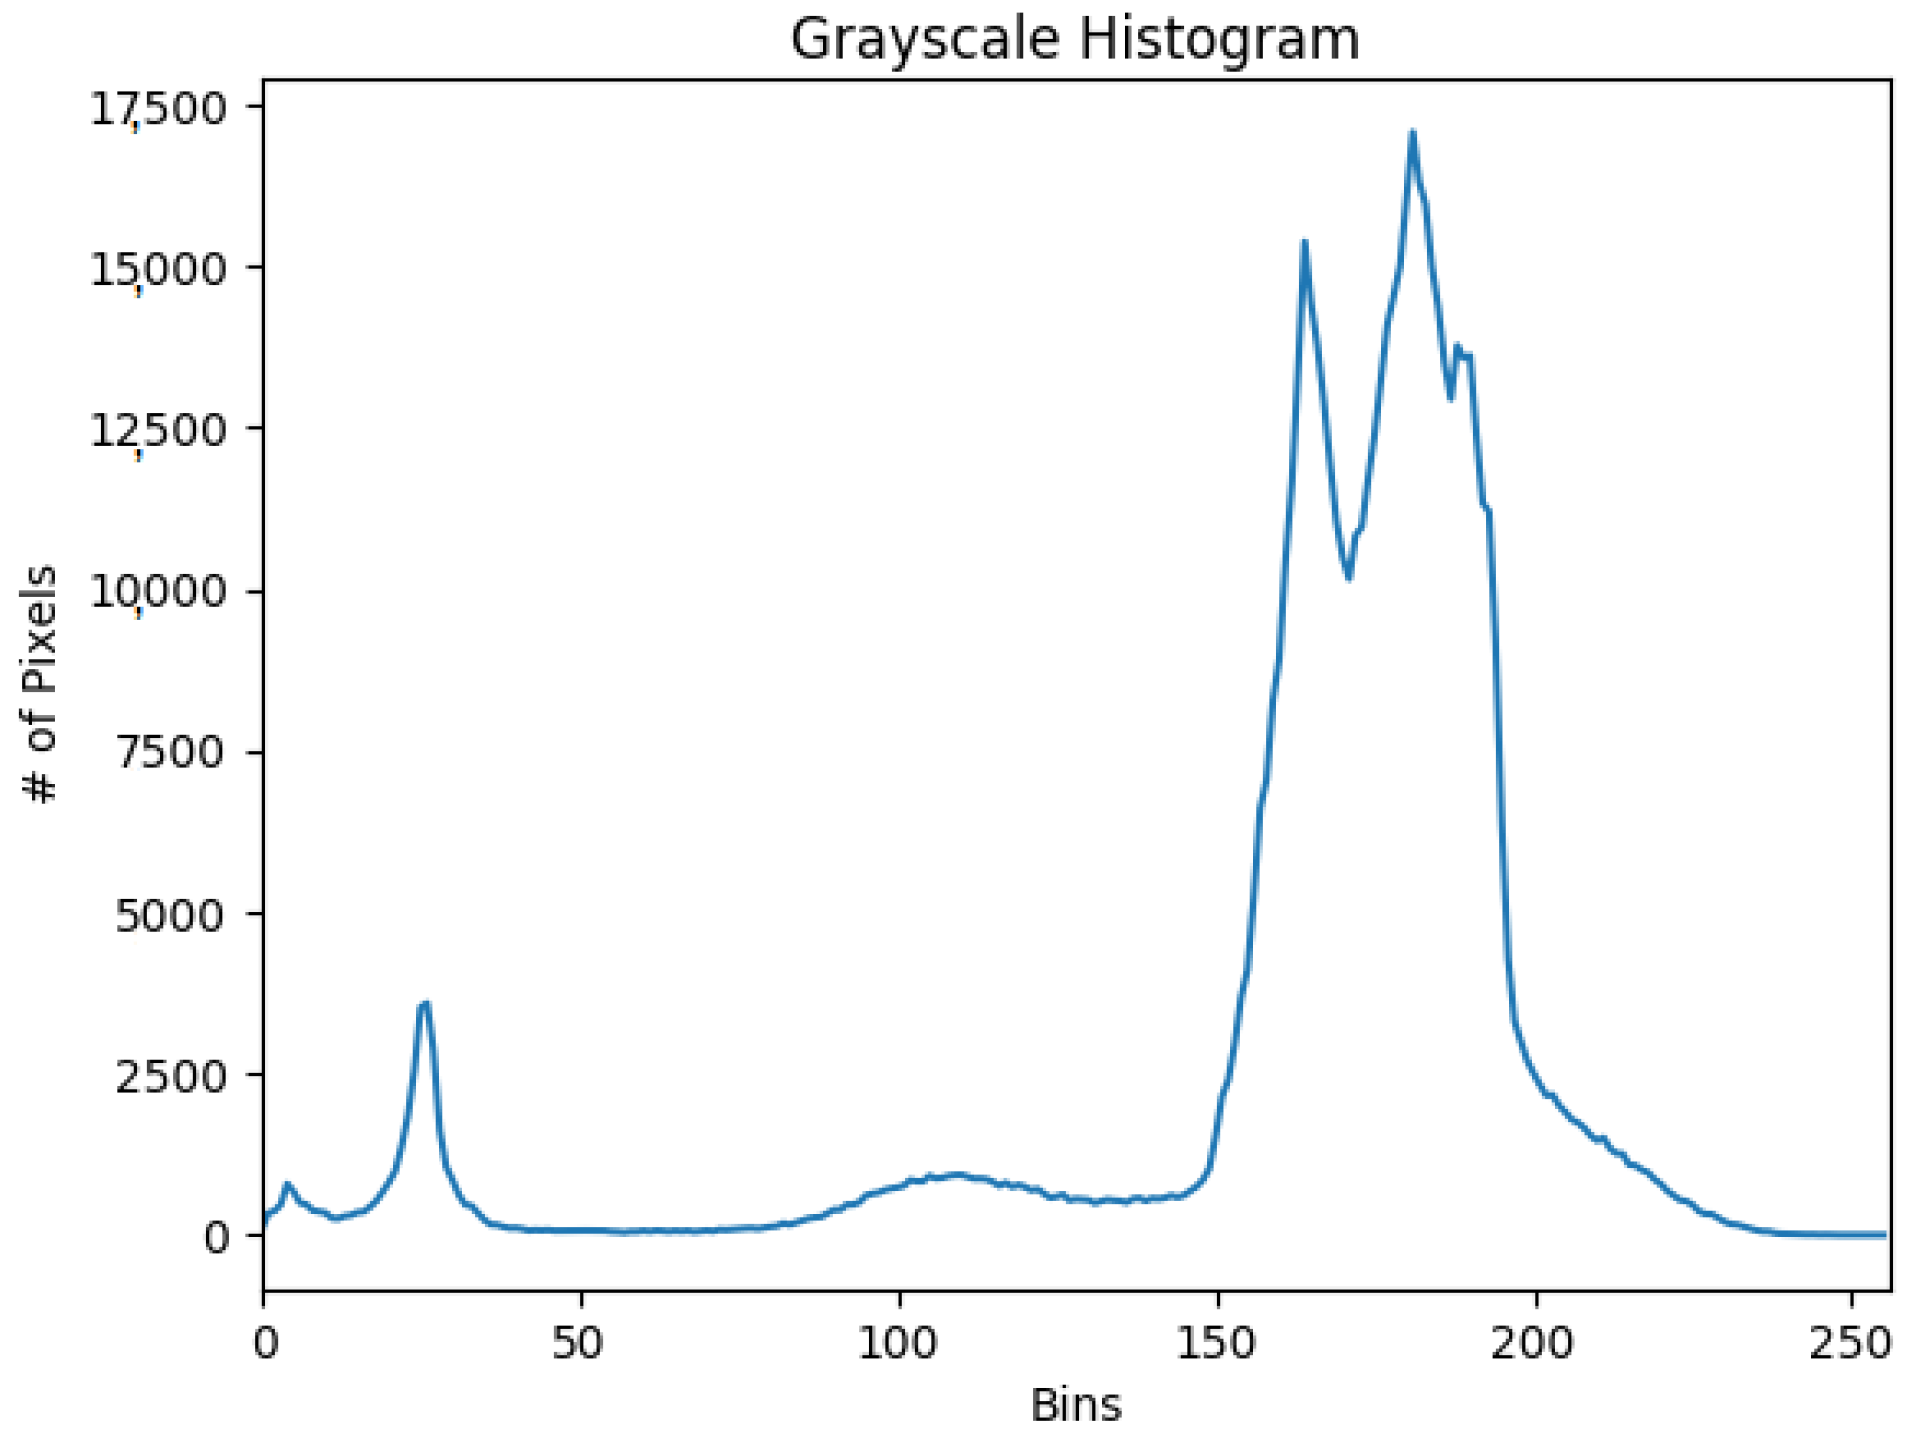
The histogram in
Figure 17 is interpreted as follows: The bins (0–255) are plotted on the x-axis, and the y-axis counts the number of pixels in each bin. The majority of pixels fall in the range of 230 to 255. Looking at the right tail of the histogram, we see almost every pixel in the range 200 to 255. This means many pixels that are almost ‘white’ are in the image. Based on this initial research, the preliminary conclusion is that the QR tag can be decoded successfully and error free from the visible spectrum almost instantly (
Figure 18). Thus,
it appears to be the most efficient means of optical transmission.
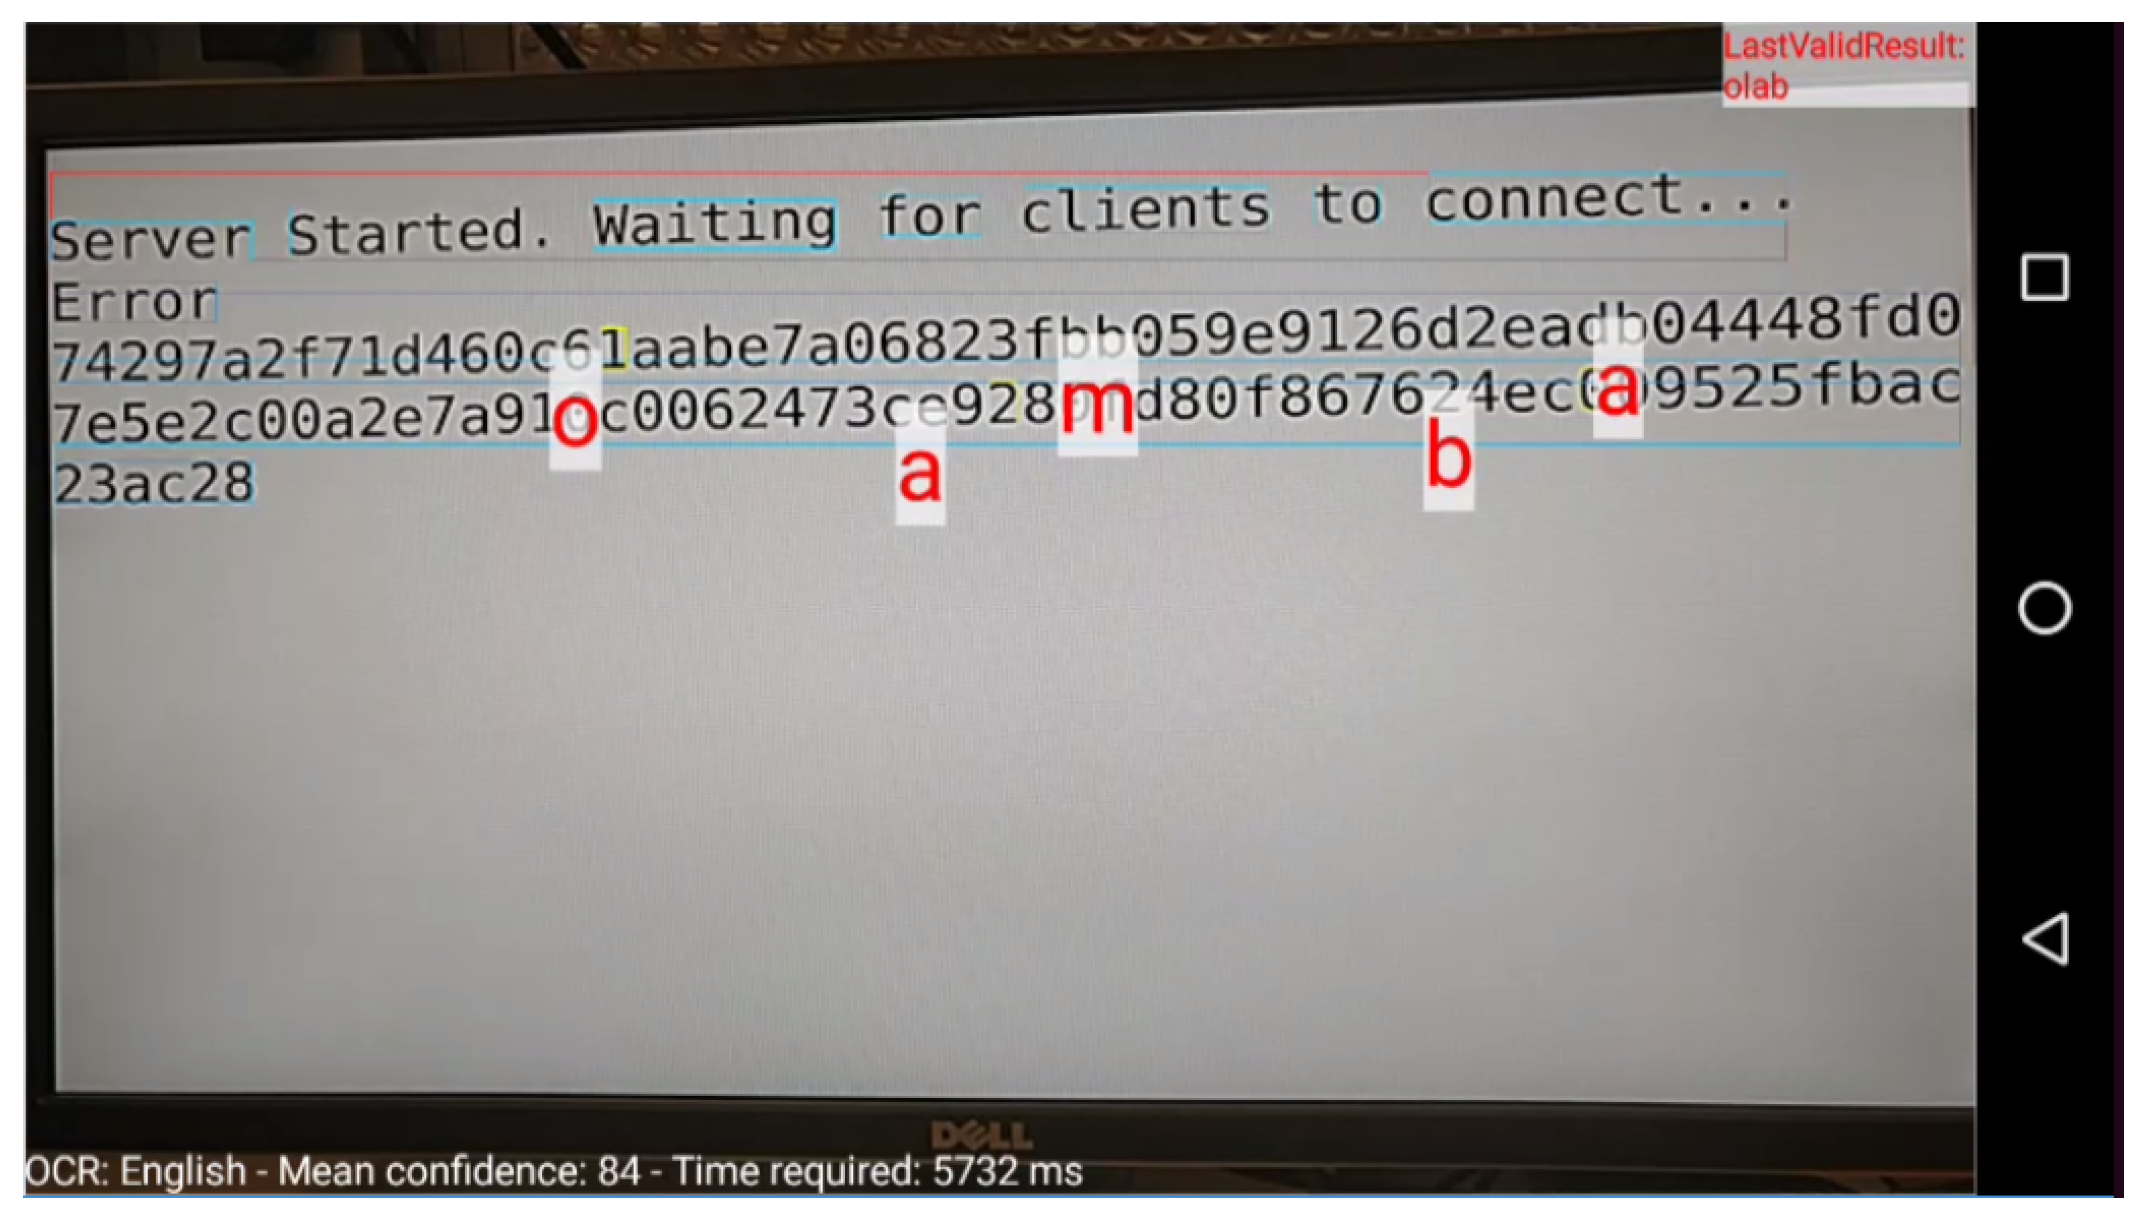
4.1.2. Text/OCR
Again, we compute the entropy parameters for the OCR text file. The results are depicted in
Figure 19. The figure shows that the entropy range now appears more restrained than the QR case. However, if we observe the histogram illustration (
Figure 20), we notice that this time, the bins on the x-axis are more widely distributed. Thus, there is a wider majority of pixel range than the ‘black–white’ case of the QR. This diversity of the pixel colors, together with the particular image entropy or gray level distribution, implies that the OCR text cannot be visually detectable in an error-free state. Thus, it initially seems from the plots that OCR
is not the most effective means of ocular data transmission.
4.2. Performance Evaluation of PRIVocular Framework
For the scope of the main evaluation analysis of the PRIVocular framework, we have conducted two sets of experiments: the first with a vertically oriented prompting PC display screen and the second with a horizontal or landscape orientation. For each case scenario, we have utilized the same smartphone device equipped with a UHD camera (16MP, 1080p) and the corresponding orientation mode (portrait or landscape).
Next follows the first results table (see
Table 3). This visual analysis table corresponds to the vertical orientation mode for both end-to-end displays. The table includes all three input modes of operation, i.e., OCR, MoMAtag, and hybrid. The aim of this experiment set, as well as the second, would be to ideally capture and successfully retrieve the
maximum amount of optical data on screen while maintaining several other technical parameters such as physical distance, visual space of data on screen, and encoding types as observational dependent variables. We pre-selected running this setup with a 32-bit key size for OCR/hybrid modes. The MoMAtag mode is dedicated to a 4096-bit key size.
In
Table 3, the second column, named
Num. of elements, matches the number of HEX characters that can be displayed, captured, detected, and decrypted from the prompting screen. Of course, this number can be divided by the
maxgrouplength parameter to uncover the total number of ASCII characters optionally recognized. The third column (i.e.,
Max. characters) is the maximum amount of (byte) data that can be successfully decoded and decrypted in the corresponding input mode. Finally, the column named
Square Pixels Per Element could be considered as a visual space calculation metric for needs, i.e., to estimate the space (width #pixels X height #pixels) for each (corresponding input mode) individual element at the desktop PC monitor.
Obviously, each mode of operation performs differently, simply because, due to the specific optical encapsulation method, QR-based encapsulation, like in the MoMAtag/hybrid cases, seems to be able to fit more raw data information, whereas it decodes and decrypts faster (due to ECC presence) than OCR. Other factors, such as the image entropy characteristics of an OCR-text file compared to a QR image tag, as depicted in the previous subsection, contribute to this argument.
Using
Table 3, we compare the OCR-based and QR-based representation methods. Although OCR appears to consume less visual space on the screen per individual element and successfully processes 1200 HEX elements, or 600 bytes, it is the least effective means of optical transmission. To justify the previous argument, it is easily observed that QR-based methods can capture more byte data, even while consuming more area space on the display screen. Thus, we can conclude that MoMAtag appears to be the most effective method of ocular encapsulation and transmission among the QR-based techniques and, as a total, from the first set of experiments.
For the second set of evaluations, we conducted the same setup with the horizontal orientation mode for both devices and derived more technical parameters as output results.
Table 4 matches the OCR operation mode, while
Table 5 corresponds to QR-based techniques (that is, MoMAtag/hybrid).
In this setup, we maintain the key size (ranging from 32 to 4096 bits) as an independent variable and analyze six dependent parameters derived from the experiment. We mention at this point that for the OCR case, we have introduced the mean confidence metric (see
Section 3.4.2), as well as the time required for the engine to perform OCR detection (the time metric is internally computed from the Android application environment). The latter applies to QR-based methods as well, except for the mean confidence metric. The reason is that the deployment of OCR in PRIVocular does not encompass any ECC method. In contrast, the hybrid/MoMAtag methods have embedded error-correction codes inside their specifications (Reed–Solomon). Finally, physical distance is the ideal distance between the device camera and the prompting display for successful recognition.
Table 4 shows that the OCR does not become functional for key sizes larger than 1024 bits. An individual ASCII element encrypted with a key size greater than 512 bits consumes much space on the screen. Therefore, it depends on at least 512 HEX characters for successful decryption; if one is misdetected by the OCR engine, the whole decryption process fails. The same table shows that the number of recognized ASCII characters is minimized as the key size becomes larger towards 512 bits.
Table 6 summarizes the basic security properties, performance comparison, and various parameters from several studied PIR techniques on IoT eHealth cloud storage, including collating with the PRIVocular framework.
As the key size grows, each ciphertext group contains a bigger (segmented) HEX length, requiring more visual space. Less useful byte data remain visible on screen, so the time to decode/decrypt becomes shorter. To enhance the previous argument, we can easily understand why, for the same reason, the mean confidence becomes higher as the key size becomes larger.
Finally, we analyze the next table of our evaluation steps (
Table 5). By only considering and comparing the number of recognized ASCII characters between OCR and hybrid, it seems that OCR outperforms QR-based techniques at first glance. That is not an apparent and correct assumption, especially considering all further technical parameters. Although QR tags consume at least 25% more visual space, for the 32-bit key size, and as mentioned before, recognizing 50% less ASCII characters, still, OCR remains an erroneous technique; thus, its detection time is tens of seconds with erroneous performance. In contrast, in QR tags, the time to retrieve data is instant and the performance is error free, with maximum availability.
The hybrid mode, with QR tags of different sizes in each key size case, has the same smooth performance for all ranges of key sizes (32 bits to even 2048 bits). The case of 4096 bits, as mentioned earlier, although it could be practical for a conventional QR tag, is solely dedicated to MoMAtag, with high ECC.


