Article

Optimal Reference Gene Selection and Potential Target Gene Identification During Xanthomonas phaseoli pv. dieffenbachiaeAnthurium andreanum Infection

1
Department of Plant and Environmental Protection Sciences, University of Hawaii at Manoa, Honolulu, HI 96822, USA
2
Department of Tropical Plant and Soil Sciences, University of Hawaii at Manoa, Honolulu, HI 96822, USA
*
Author to whom correspondence should be addressed.
Methods Protoc. 2025, 8(4), 72; https://doi.org/10.3390/mps8040072
Submission received: 5 June 2025 / Revised: 28 June 2025 / Accepted: 1 July 2025 / Published: 4 July 2025
(This article belongs to the Section Molecular and Cellular Biology)

Abstract

Xanthomonas phaseoli pv. dieffenbachiae (Xpd), the causal agent of bacterial blight in Anthurium within the Araceae family, is listed as an EPPO A2 quarantine organism. Although the whole genome of Xpd has been sequenced, the molecular mechanisms underlying anthurium bacterial blight (ABB) remain unknown. Selecting an optimal reference gene is crucial for obtaining accurate and reliable gene expression profiles during the initial interactions between Xpd and Anthurium. The stability of four reference genes was evaluated by applying three statistical methods—BestKeeper, geNorm, and delta Ct (ΔCt)—using reverse-transcription quantitative PCR (RT-qPCR) data. The rpoD and gyrB genes exhibited the most consistent gene expression profiles, whereas atpD and thyA were less stable at four time points (0, 0.5, 1, and 2 h) during the interactions between Xpd and susceptible A. andreanum cultivar ‘Marian Seefurth.’ The suitability of these reference gene candidates was validated by normalizing the gene expression levels of four pathogenicity-related genes. The highly upregulated expression of gumD, which encodes xanthan biosynthesis glycosyltransferase, observed after 1 h of interaction, suggests it may be a key virulence determinant in the Xpd–Anthurium pathosystem. The stable reference genes identified here will facilitate more accurate and comprehensive gene expression studies in the Xpd–Anthurium pathosystem going forward.

1. Introduction

According to Constantin et al., Xanthomonas phaseoli pv. dieffenbachiae (Xpd) is listed an EPPO A2 quarantine organism and causes serious bacterial leaf blight on Anthurium, which belong to the Araceae family [1,2,3,4]. The Anthurium genus contains about 950 species, including one of the best-known—A. andraeanum—which is famous for its beautiful spathes shape and wide range of colors in the cut flower and potted ornamental markets [5,6]. Anthurium bacterial blight (ABB) is an economically important disease for which outbreaks have been reported in Hawaii and other tropical and subtropical growing countries worldwide [6,7,8,9,10,11]. The symptoms of ABB include water-soaking spots near the margins of the leaf, chlorosis, and necrotic zones following coalescence, systemic infection spreading to petiole and stem, senescence and distortion, and, ultimately, the blackening and decay of the plant [10,12]. Xpd could be spread through aerosol, rain, irrigation water, infected plant material, and contaminated tools, potentially causing a 50–100% crop loss once ABB is introduced into a new anthurium farm [6].
The whole genome of Xpd has been deciphered, revealing numerous pathogenicity factors, including extracellular polysaccharides (EPSs); lipopolysaccharides (LPSs); cell-wall-degrading enzymes (CWDEs); type II, III, IV, and VI secretion systems (T2, 3, 4, 6SS); and the T3 secretion effector (T3SE) repertoire. These factors, which are present in the genomes of LMG 695 pathotype and D182 strains [11,13], have shown the potential to facilitate systemic infection in Anthurium and Dieffenbachia. However, the relationship between these pathogenicity factors and host specificity remains underexplored, despite the identification of some unique genes and clusters such as T3SE XopAO and various LPS gene clusters in Xpd [10,13]. Global gene expression analysis should be employed to elucidate the molecular mechanisms underlying the interactions between Xpd and Anthurium.
Reverse-transcription quantitative PCR (RT-qPCR) is a rapid, reproducible, and highly sensitive and specific method that is widely used to investigate target gene expression under various natural conditions and/or experimental treatments [14]. To obtain a reliable analysis of an RT-qPCR assay, an optimal reference gene is essential as an internal control to normalize mRNA data [15]. Since there is no universal reference gene suitable for all experimental designs, a preliminary analysis is required to identify the most appropriate reference gene for the specific tissue, cell type, and conditions [15].
In previous studies, several reference genes in xanthomonads were examined under different conditions of in vivo and in vitro experiments. Reference genes—thyA (thymidylate synthase) and gyrB (DNA gyrase subunit B)—were validated as the optimal reference genes in X. campestris pv. campestris when grown on hrp-inducing medium (MMXC) [16]. Meanwhile, atpD (ATP synthase subunit δ) and rpoD (RNA polymerase δ factor) were identified as the most stably expressed genes in X. arboricola pv. juglandis under three abiotic stresses [17]. Additionally, under another pathosystem between X. citri subsp. citri and sweet orange, atpD, rpoB (RNA polymerase subunit β), gyrA (DNA gyrase subunit A), and gyrB were the most stable reference genes among the nine candidates evaluated [18]. Lastly, along with the gyrB gene, ffh (signal recognition particle protein) and pykA (pyruvate kinase) were the most appropriate internal controls in X. fragariae on strawberry [19].
The objective of this study was to identify the ideal normalizers in the interactions between Xpd and Anthurium. Based on previous studies, four reference gene candidates—atpD, gyrB, rpoD, and thyA—were selected to test the suitability. The stability of these genes was evaluated using RT-qPCR data generated from the time course samples, employing popular methods such as the BestKeeper [20], geNorm [21], and delta Ct (ΔCt) methods [22]. The gene expression profiles of four pathogenicity-related target genes—hrpG and hrpX (encoding master regulators of the type III secretion system (T3SS)-specialized syringe that injects effectors into host cells to suppress defenses and promote infection), fliM (encoding a key component of flagellar biosynthesis—critical for motility, initial host colonization, and biofilm formation), and gumD (responsible for exopolysaccharide xanthan production) were normalized using the appropriate reference genes, revealing the potential determinants of virulence or pathogenicity in Xpd during its infection of A. andreanum [23].

2. Materials and Methods

2.1. Bacterial Strain and Plant Materials

Xanthomonas phaseoli pv. dieffenbachiae (Xpd) strain PL36, isolated from Hawaii in 2016 [9], was used to identify optimized reference genes. The strain was streaked out from −80 °C glycerol stock and cultured on Nutrient agar (NA) media at 28 °C for two days. The Anthurium microplant planting method was adapted from the protocol described by Ayin et al. [8] with some modifications. Briefly, a susceptible A. andreanum cultivar ‘Marian Seefurth’ (MS) was cultured in vitro for 4–6 weeks. After rooting, the plants were deflasked and transferred into humidity domes filled with orchid bark (Daltons Ltd., Matamata, New Zealand) for another 4–6 weeks with full spectrum plant growing LED light (Feit Electric, Pico Rivera, California, USA) for 12 h daily at 24–26 °C.

2.2. Selection of Reference Genes, Target Genes, and Primer Design

Four housekeeping genes–atpD, gyrB, rpoD, and thyA–were selected to demonstrate the optimal reference gene for Xpd-Anthiurim interaction. In order to verify the accuracy and practicability, four pathogenicity-related genes–fliM, gumD, hrpG, and hrpX–were chosen. The primer sets for all genes were designed for quantitative RT-PCR (qPCR) based on the whole genome sequence of strain PL36 (unpublished information) using Primer3 v4.1.0 (https://primer3.ut.ee/, accessed on 27 June 2025) (Table 1).

2.3. Experiment Design and RNA Extractions

The Xpd strain PL36 was cultured on Nutrient agar (NA) media at 28 °C for two days. A single colony was inoculated into 120 mL of Nutrient broth (NB) broth shaking at 200 rpm at 28 °C for 14–18 h to reach OD600 = 0.5 as the initial OD. The time course was set at 0, 0.5, 1, and 2 h after incubating PL36 in both NB only (NB+) and NB with 1 g of MS microplant leaf homogenized using liquid nitrogen method (NB + MS) (Figure 1). At each time interval, 2–3 mL of culture was collected and was centrifuged at 14,000× g for 1 min at room temperature (RT). The cell pellets were immediately frozen using liquid nitrogen and stored at −80 °C until further RNA extraction. Total RNAs were extracted using rBAC Mini RNA Bacteria Kit (IBI Scientific, Dubuque, IA, USA) following the manufacturer’s instructions, which included DNase I treatment step. The quality and quantity of RNA samples were assessed using NanoDrop 2000 spectrophotometer (Thermo Fisher Scientific, Waltham, MA, USA). RNA degradation and DNA contamination were examined by electrophoresis on a 0.8% agarose gel run at 100 volts for 0.5 h.

2.4. Reverse-Transcription and Quantitative RT-PCR (qPCR)

Two step qPCRs were carried out to evaluate the gene expression levels of reference and target genes. One microgram of extracted RNA was reverse-transcribed to cDNA using MMLV reverse transcriptase (Promega, Madison, WI, USA) and random hexamer (Integrated DNA Technologies, Coralville, IA, USA) through heat denatured method. For each qRT-PCR reaction of 20 µL, including 5 µL of 4X UniPLUS Hotstart qPCR, 1 µL of 100 mM DTT, 1 µL of KleeGreen Dye, 1 µL of cDNA template (approximately 10 ng/µL), 1 µL of specific primer pair (listed in Table 1), and appropriate volume of RNase-free water was prepared using UniPLUS RT-qPCR Master Mix (IBI Scientific). The PCR reaction was conducted using Rotor-Gene Q (QIAGEN LLC, Germantown, MD, USA) with the following conditions: UNG incubation at 25 °C for 2 min, RT incubation at 55 °C for 15 min, enzyme activation at 95 °C for 2 min, followed by 40 cycles of amplification at 95 °C for 10 s and 60 °C for 1 min. A melting curve analysis was subsequently performed using Rotor-Gene Q software version 2.3.1 (Qiagen), with a temperature decrease from 99 °C to 80 °C at a ramp rate of 0.2 °C per second, to verify the specificity of amplification products.

2.5. Expression Stability of Candidate Reference Genes

The stability of four reference genes was evaluated by pooling four different time point samples, i.e., 0, 0.5, 1, and 2 h after incubating PL36 in both NB only (NB+) and NB with MS plant powder (NB + MS). The PCR amplification efficiency (E) and the regression coefficient (R2) of the standard curves were estimated using the 10-fold serial dilutions of mixed cDNA samples. Meanwhile, qRT-PCR reactions were carried out for four reference genes in samples from each individual time point, growing in both NB+ and NB + MS media. The relative expression levels of the candidate reference genes were calculated using the threshold cycle (Ct), as determined by the Rotor-Gene Q series software 2.3.1 (Built 49). The expression stabilities of reference genes were analyzed and evaluated using three widely accepted algorithms: standard deviation (SD) and coefficient of variation (CV) in BestKeeper, which assess gene stability based on raw Ct values; the M value in geNorm, which calculates average pairwise variation between genes to identify the most stable candidates; and the average pairwise standard deviation in the ΔCt method, which compares relative expression differences between gene pairs across all samples [20,21,22].

2.6. Validation of Reference Genes

Four target pathogenicity-related genes–hrpG, hrpX, fliM, and gumD–were used to validate the suitability of the selected reference genes in PL36 cultured with NB + MS. The relative fold changes in gene expressions of each time point sample were calculated using the delta delta Ct (2–∆∆Ct) method [24] and normalized using the optimal candidate reference genes. The potential virulence factor with highly gene expression fold change evaluated by comparing samples of NB+ and NB + MS.

3. Results and Discussion

3.1. Primer Specificity and Amplification Efficiency of Candidate Reference Genes

The quality of extracted RNA samples was evaluated using Nanodrop 2000 spectrophotometer. The ratio of A260/A280 ranging from 2.15 to 2.19 indicated the high quality of eight RNA samples. The agarose gel confirmed the absence of DNA contamination (Figure S1). The primer specificity of reference genes was validated by the single-peak results obtained from the melting curve analysis, and no primer dimers were formed by RT-qPCR. While setting the threshold as 0.1, the PCR amplification efficiency (E) of four reference genes were determined by analyzing standard curves of pooled cDNA time course samples of Xpd strain PL36 cultured in NB+ and NB + MS. The efficiencies ranged from 70.8% to 88.8% in NB+ and from 83.2% to 92.1% in NB + MS (Table S1). However, the values of correlation coefficient (R2) of the standard curves were higher than 0.985 for all reference genes.
The atpD gene depicted the lowest E value in NB+ broth media but the highest E value in NB + MS. Although the relatively low E values (<90%) of all reference genes presented in the pooled NB+ samples, atpD and gyrB were regarded as optimal reference genes with E > 90% in the pooled NB + MS samples for RT-qPCR amplification. The lower E values could result from the higher threshold of Ct value (0.1) used to normalize all reference genes.

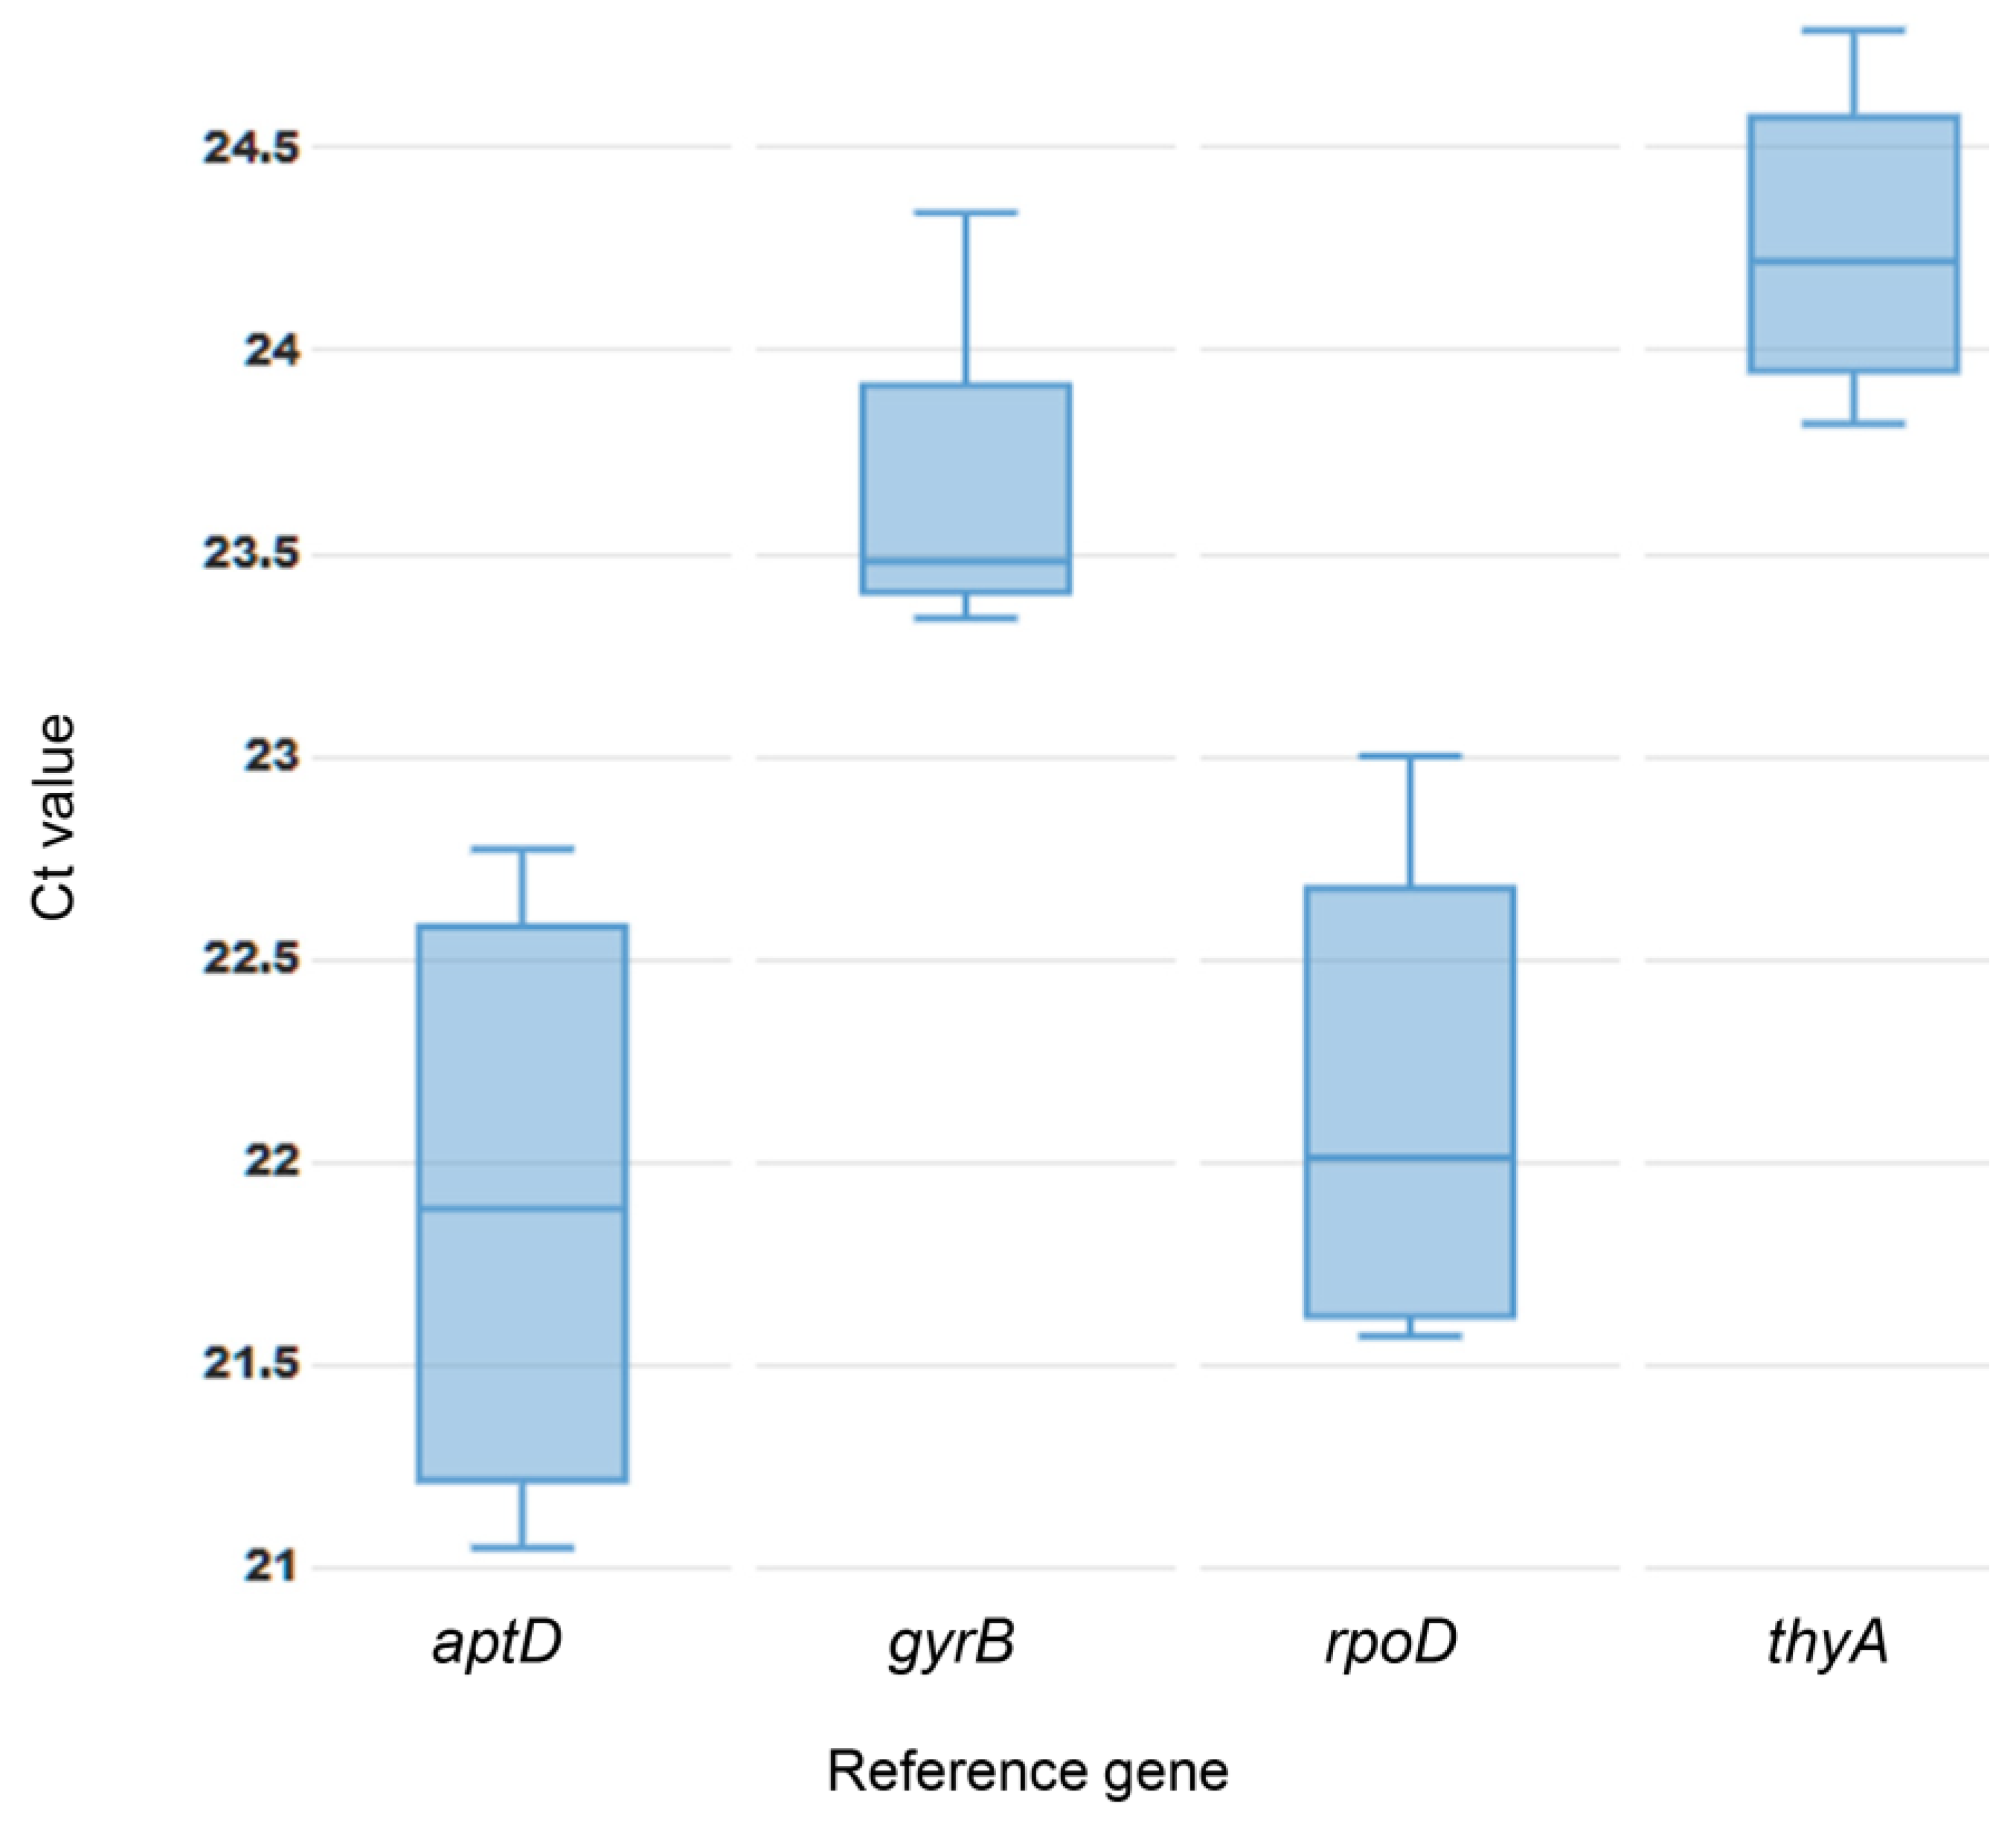
3.2. Expression Stability

Threshold cycle (Ct) value, which is inversely proportional to gene expression abundance, was used to verify the stability of four reference genes by executing statistical applets: BestKeeper, geNorm, and the ΔCt method. The Ct values of four reference genes varied across individual time point samples cultured in NB + MS (Table S2). The mean Ct value from low to high was 21.90 in atpD, 22.15 in rpoD, 23.66 in gyrB, and 24.26 in thyA (Table S2, Figure 2).
The BestKeeper, an Excel based tool, was employed to calculate the pairwise correlation analysis on time course samples cultured in NB + MS (Table S2). The more stable candidate displays the lower SD of Ct value [20]. Based on BestKeeper analysis, the order of stability of the four genes was thyA (0.31) > gyrB (0.34) > rpoD (0.53) > atpD (0.68) (Table 2 and Table S2).
Meanwhile, the geNorm method assessed the stability of reference genes by calculating M values. Lower M values indicate higher stability; if M ≤ 0.5, it is typically considered stable [21]. The relative quantities of the four reference genes displayed varied expression profiles (Figure S2). The average M value of four reference genes was 0.422 and only M value in atpD was higher than 0.5 (Table 2). The ranking of the optimal reference genes based on their stability was: rpoD (0.35) > gyrB (0.37) > thyA (0.45) > atpD (0.52) as shown in Table 2. The ΔCt method was performed to obtain the average SD of pairwise ΔCt values in all the reference genes (Table 2; Figure S3). The most stably expressed reference genes were rpoD (SD: 0.34) and gyrB (SD: 0.37), whereas the least stably expressed genes, thyA and aptD, had SD of 0.45 and 0.51, respectively (Table 2).
The similar ranking results were obtained using geNorm applet and ΔCt method. The atpD was the least stable gene based on the results from all three algorithms, whereas thyA was identified as the best choice when assessing using BestKeeper, but not when evaluating with the other two methods. Overall, rpoD and gyrB ranked in first and second place, respectively, making them the most stable genes and suitable as internal controls for RT-qPCR (Table 2). Considering the amplification efficiency and correlation coefficient of the four reference genes in PL36 growing with NB + MS (Table S1), gyrB is the optimal reference gene for gene expression normalization in the Xpd-Anthurium interaction.

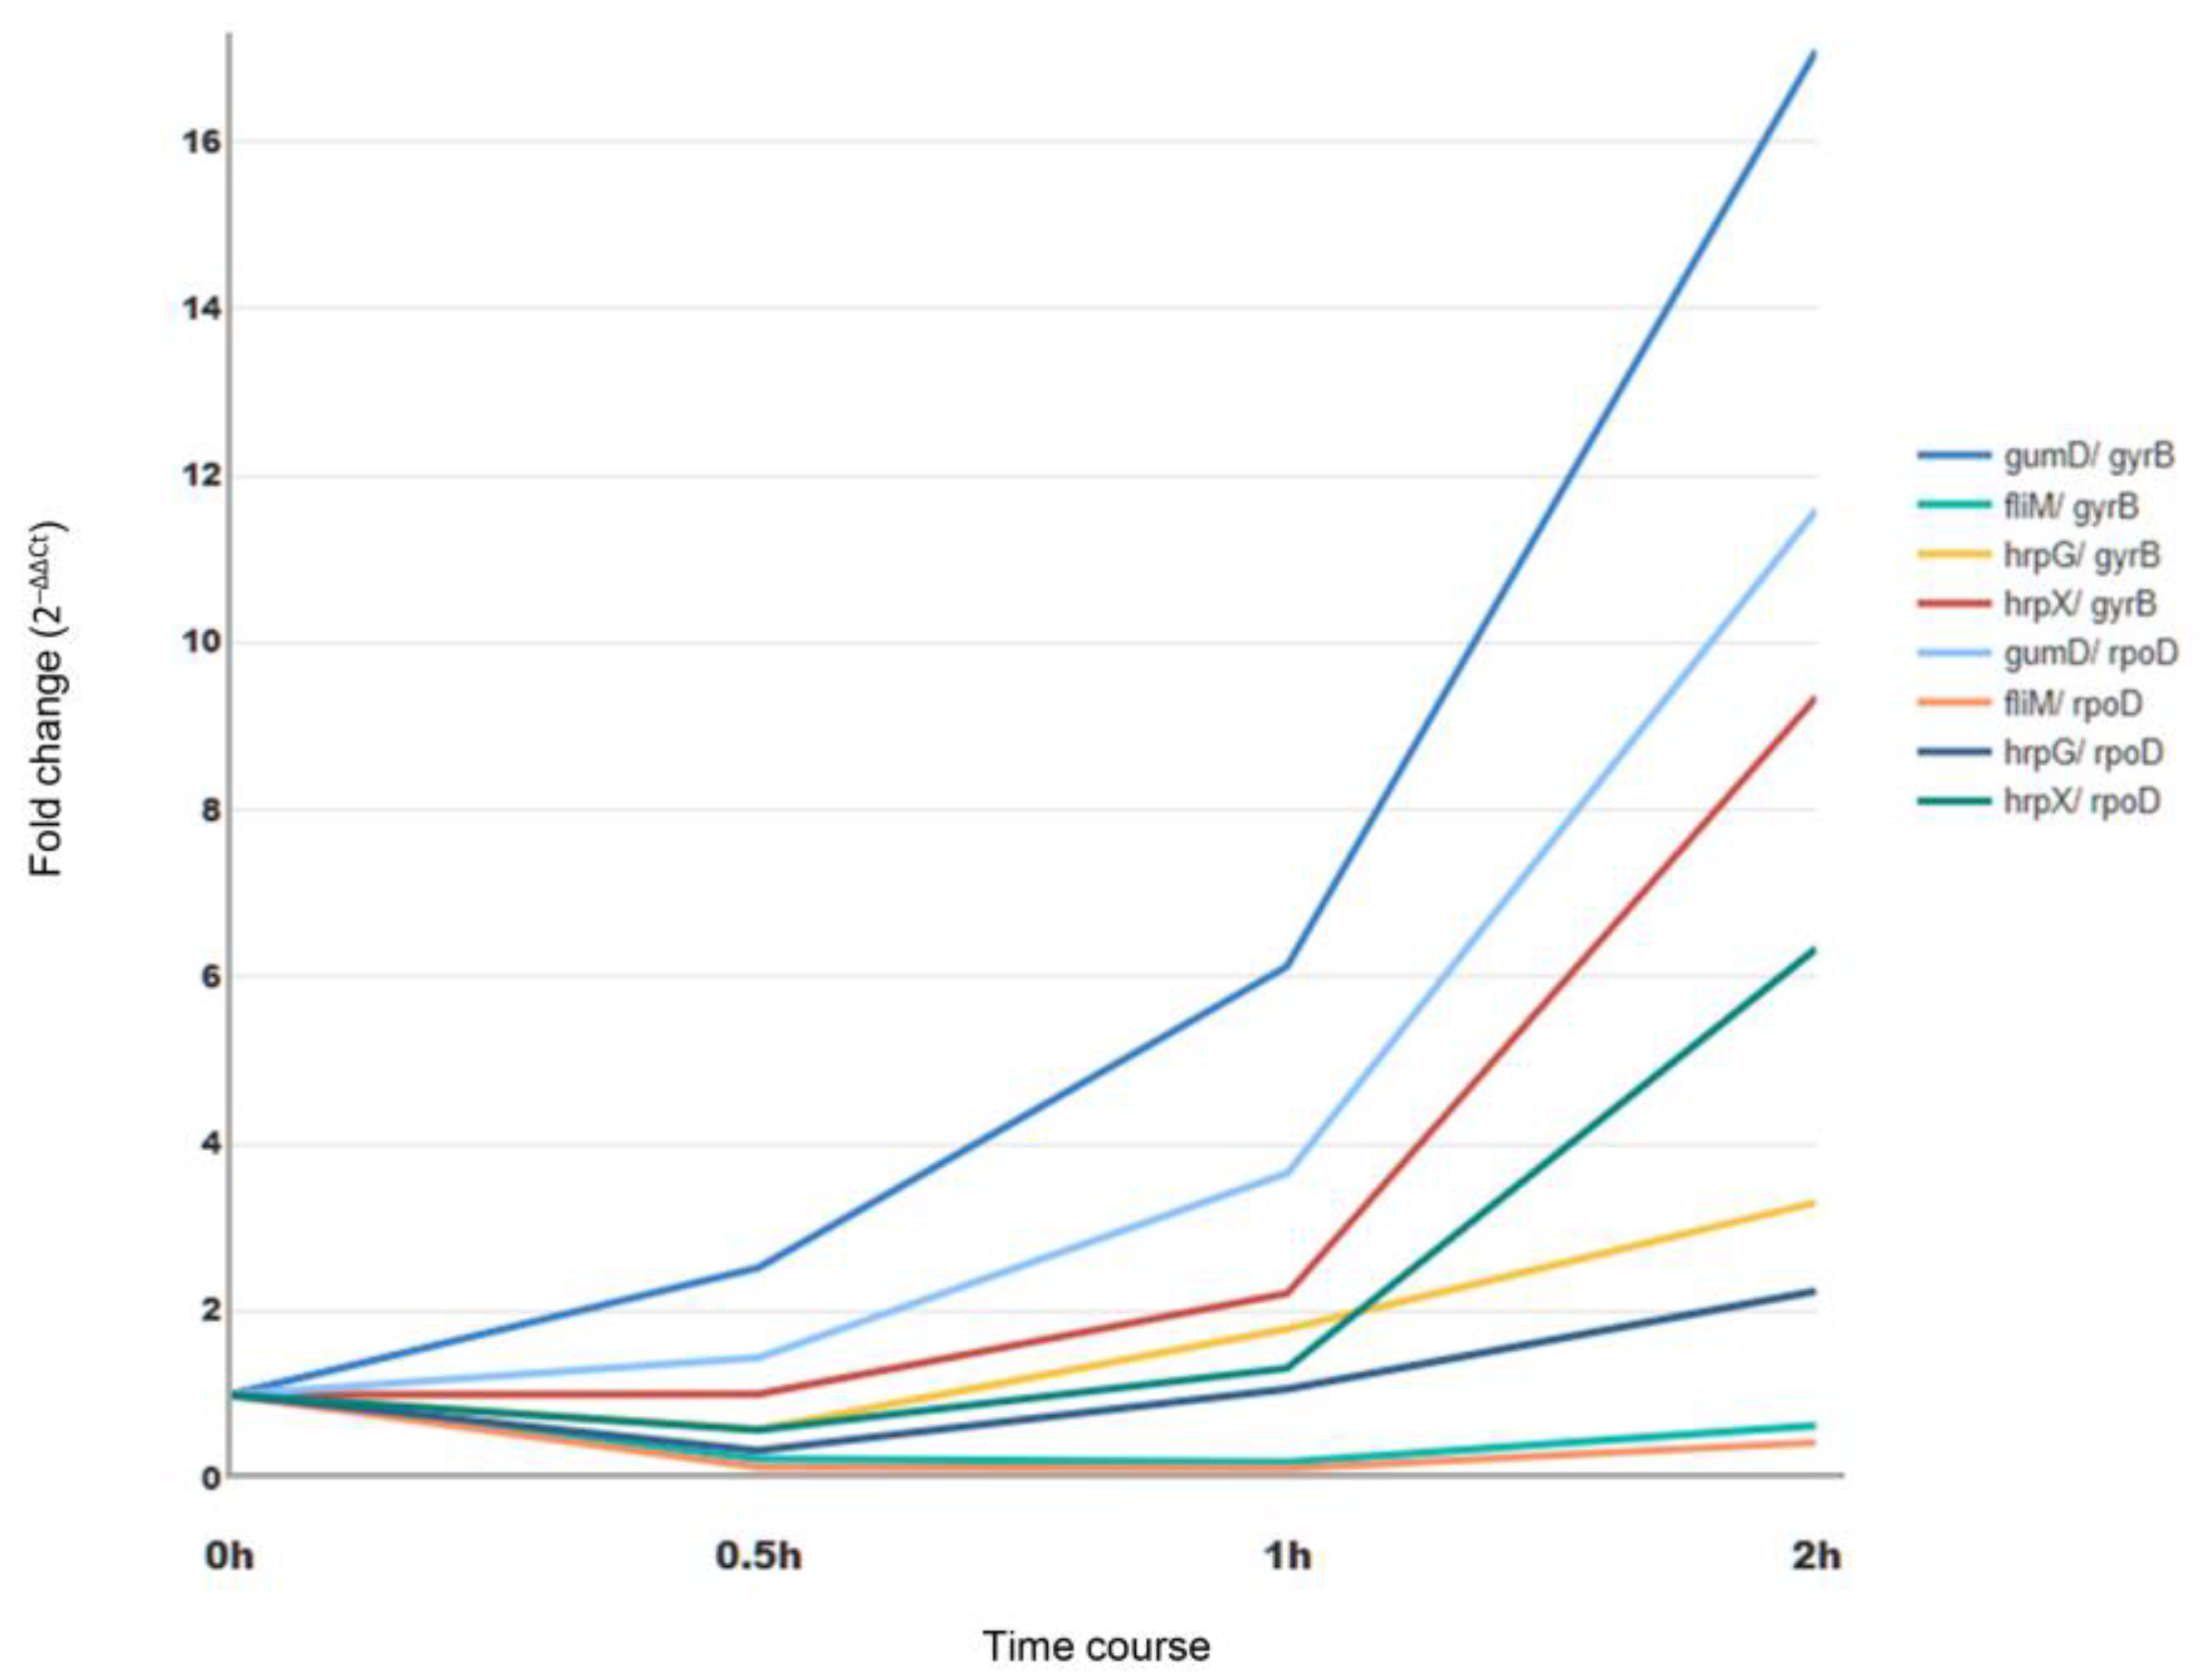
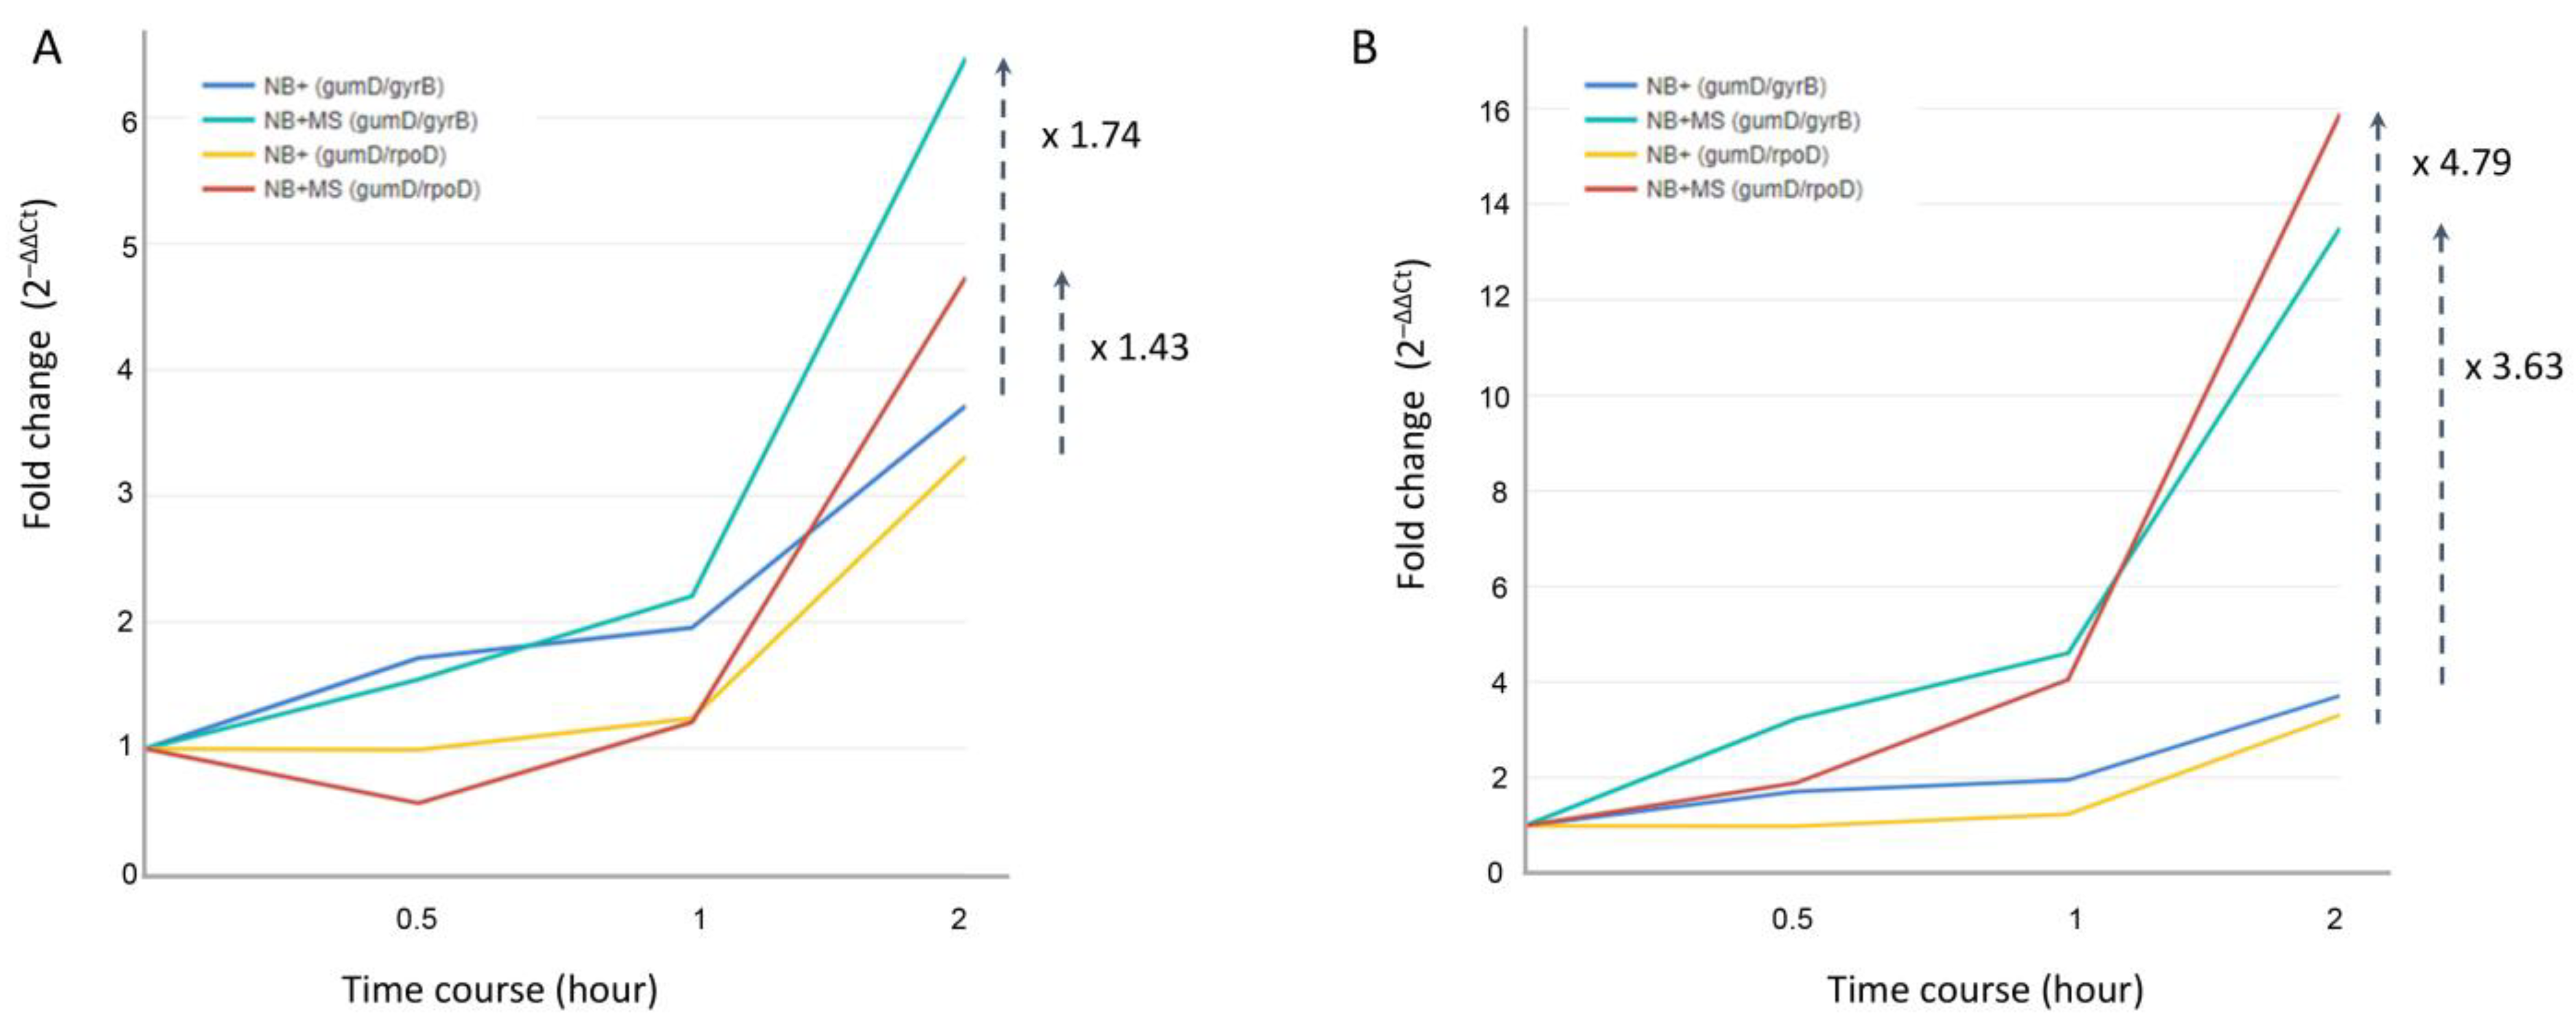
3.3. Expression Profile of Target Genes

The practicality of the optimal reference genes, rpoD and gyrB, was validated through their use in normalizing the expression of four pathogenicity-related genes–hrpG, hrpX, fliM, and gumD– in PL36 cultured with NB + MS medium. The raw Ct data for four target genes at four different time points was normalized using the gene expression of two selected reference genes separately and the expression profiles of each target gene were displayed using the 2–∆∆Ct calculation. The expression profile patterns of each target gene normalized by rpoD were similar to those normalized by gyrB over the time course; however, the fold changes were shifted (Figure 3).
The encoding genes of both HrpG and HrpX, which control the gene expression of T3SS, T3 effectors, and T2SS substrate encoded genes as regulators [25,26,27], were upregulated after 0.5 h. Interestingly, hrpX significantly increased, ranging from 4.23 to 4.81 folds, from 1 h to 2 h samples, whereas hrpG exhibited an increase of about 1.85–2.10 folds during the same period (Figure 3). The continually increasing gene expression of hrpX and hrpG suggest they play important roles on the downstream genes in the HrpG and HrpX-related regulation cascades, which were revealed by the microarray analysis [27].
In addition, the fliM gene involved in flagellar biosynthesis was downregulated in 2 h interaction between Xpd-MS (Figure 3). The results might be attributed to signal transmission from HrpG to HrpX and to HrpG’s inhibition of flagellar assembly and chemotaxis within the hrpG and hrpX regulons [27,28]. Interestingly, RNA-seq analysis in the in vitro system using rice leaf extract showed that the expression of hrpG and hrpX peaked within 10–15 min, while fliM expression was downregulated during the first 10 min and then upregulated afterward [28]. This difference suggests a strategic infection program in which X. oryzae pv. oryzae rapidly activates T3SS regulators (hrpG and hrpX) to deliver effector proteins and suppress plant defenses, while initially repressing flagellar genes such as fliM to avoid early detection by host immunity, followed by later upregulation to facilitate bacterial colonization and spread.
The expression profile of the gumD gene, which encoded the pentasaccharide repeating unit of xanthan [29], showed the highest upregulation in NB + MS samples during the 2 h incubation compared to that of other target genes (Figure 3). In the previous study, the X. campestris pv. campestris gumD knockout mutant displayed a reduced virulence during infection on broccoli leaves [30]. Similarly, the X. oryzae pv. oryzae gumD knockout mutant showed a significant reduction in lesion size, decreasing to about 11% on the susceptible rice cultivar IR24 [31]. Therefore, the elevated gene expression suggests that the gumD gene is likely one of the key genes influencing pathogenicity in the Xpd-Anthurium pathosystem. To determine whether the highest gene expression of gumD was induced by the addition of A. andreanum MS microplant powder, a comparison of gumD gene expression profiles, normalized using the two optimal reference genes—gyrB and rpoD—was performed on time course samples cultured with NB+ and NB + MS, respectively (Figure 4). Using the 0 h-NB+ sample as a baseline, the results demonstrated differential gene expression after 1 h, and the gumD gene, normalized by gyrB and rpoD, respectively, was upregulated about 1.74- and 1.43-fold in the 2 h-NB+MS sample compared to the 2 h-NB+ sample (Figure 4A). Notably, the gumD gene expression profiles differed depending on whether the 0 h-NB+ and 0 h-NB+MS samples were independently used as the baseline for each time course set (Figure 4B). The differences in fold changes were more than twofold when calculated using different baselines, indicating that the gene expression changes occurred immediately after the addition of MS microplant powder. The gyrB gene demonstrated greater stability than the rpoD gene due to its consistent gene expression profile (Figure 4). Despite the varied gene expression levels, the gumD gene, involved in the biosynthesis of xanthan gum, differentially regulated pathogenicity in the interactions between Xpd and the susceptible A. andreanum cultivar MS.

4. Conclusions

This study aimed to select the optimal reference gene for X. phaseoli pv. dieffenbachiae while interacting with the host plant A. andreanum. The in vitro system using anthurium leaf extract successfully activated the tested pathogenicity-related genes. The BestKeeper, geNorm, and delta Ct methods summarized rpoD and gyrB as the most stable housekeeping genes during the initial time course of the in vitro pathosystem. These two optimal reference gene candidates were able to assess the similar gene expression patterns of four pathogenicity-related target genes. The flagellar-related gene, fliM, was downregulated within 2 h. On the other hand, the activation of hrpX and hrpG was detected after 0.5 and 1 h, respectively, with their gene expressions levels continually upregulated. The highest gene expression of gumD was observed at the 2 h time point in the NB + MS samples, while no significant increase was observed in the non-treatment samples, suggesting its importance as a virulence determinant. To our knowledge, this is the first study to identify reference genes for studying the interactions between Xpd and A. andreanum. The identified ideal gene normalizers are suitable for the further validation of transcriptome analysis using RNA-seq technology.

Supplementary Materials

The following supporting information can be downloaded at: https://www.mdpi.com/article/10.3390/mps8040072/s1, Figure S1. Agarose gel result of RNA samples cultured in NB+ and NB + MS broth media across different time points. L denoted a 100 bp ladder. Figure S2. Expression stability of four candidate reference genes (atpD, gyrB, rpoD, and thyA) analyzed using geNorm. The relative quantities (±SEM) of the reference genes were evaluated across four time point samples of NB + MS inoculated with Xanthomonas phaseoli pv. dieffenbachiae PL36. SEM: standard error of the mean. Figure S3. Box plot shows the pairwise comparisons of delta Ct (ΔCt) among four candidate reference genes in Xanthomonas phaseoli pv. dieffenbachiae cultured in NB + MS broth medium. The average ΔCt value across samples of four time points were analyzed for atpD (A), gyrB (G), rpoD (R), and thyA (T) genes. The lines within boxes indicate the median values, the boxes indicate the interquartile range (25th to 75th percentile), and the whiskers indicate the full range of the data. Table S1. Parameters of the standard curve derived from qRT-PCR using 10-fold serial dilutions (10–0.01 ng/µL) of pooled cDNA from Xanthomonas phaseoli pv. dieffenbachiae (Xpd) strain PL36 cultured in NB+ and NB + MS broth media. Table S2. Expression stability of candidate reference genes in PL36 cultured in NB with MS plant powder analyzed using BestKeeper.

Author Contributions

Conceptualization, M.A.; experiments, S.-C.C.; writing—original draft preparation, S.-C.C.; writing—review and editing, S.-C.C., S.D., T.D.A., A.M.A. and M.A. All authors have read and agreed to the published version of the manuscript.

Funding

This research was funded by the USDA National Institute of Food and Agriculture, Hatch project 9038H, managed by the College of Tropical Agriculture and Human Resources. This work was also supported by the USDA-ARS Agreement no. 58-2040-9-011, Systems Approaches to Improve Production and Quality of Specialty Crops Grown in the U.S. Pacific Basin; sub-project: Genome Informed Next Generation Detection Protocols for Pests and Pathogens of Specialty Crops in Hawaii. This work is also supported by the USDA-NIFA Award No. 2023-67013-39301.

Institutional Review Board Statement

Not applicable.

Informed Consent Statement

Not applicable.

Data Availability Statement

The original contributions presented in this study are included in the article. Further inquiries can be directed to the corresponding author.

Conflicts of Interest

The authors declare no conflicts of interest.

References

  1. McCulloch, L.; Pirone, P.P. Bacterial leaf spot of Dieffenbachia. Phytopathology 1939, 29, 956–962. [Google Scholar]
  2. Constantin, E.C.; Cleenwerck, I.; Maes, M.; Baeyen, S.; Van Malderghem, C.; De Vos, P.; Cottyn, B. Genetic characterization of strains named as Xanthomonas axonopodis pv. dieffenbachiae leads to a taxonomic revision of the X. axonopodis species complex. Plant Pathol. 2016, 65, 792–806. [Google Scholar] [CrossRef]
  3. EPPO. Xanthomonas axonopodis pv. dieffenbachiae: Diagnostic protocols. Bull. OEPP 2004, 34, 183–186. [Google Scholar] [CrossRef]
  4. EPPO. PM 7/23 (2): Xanthomonas axonopodis pv. dieffenbachiae. Bull. OEPP 2009, 39, 393–402. [Google Scholar] [CrossRef]
  5. Boyce, P.C.; Croat, T.B. (2011 Onwards) The Überlist of Araceae, Totals for Published and Estimated Number of Species in Aroid Genera. International Aroid Society. Available online: http://www.aroid.org/genera/180211uberlist.pdf (accessed on 28 June 2025).
  6. Alvarez, A.M.; Toves, P.J.; Vowell, T.S. Bacterial blight of Anthuriums: Hawaii’s experience with a global disease. APSnet Features 2006, 2006. [Google Scholar] [CrossRef]
  7. Duffy, B. Survival of the anthurium blight pathogen, Xanthomonas axonopodis pv. dieffenbachiae, in field crop residues. Eur. J. Plant Pathol. 2000, 106, 291–295. [Google Scholar] [CrossRef]
  8. Ayin, C.M.; Amore, T.D.; Toves, P.J.; de Silva, A.S.; Alvarez, A.M. Evaluation of anthurium cultivars for resistance to Xanthomonas axonopodis pv. dieffenbachiae, the causal agent of bacterial blight. In Proceedings of the International Symposium on Tropical and Subtropical Ornamentals; Acta Horticulturae: Leuven, Belgium, 2017; Volume 1167, pp. 245–250. [Google Scholar]
  9. Chuang, S.-C.; Dobhal, S.; Pal, K.; Amore, T.D.; Alvarez, A.M.; Arif, M. Xanthomonas strains isolated from hosts in the family Araceae reveal diverse phylogenetic relationships and origins. Phytopathology 2024, 114, 1963–1974. [Google Scholar] [CrossRef]
  10. Chuang, S.-C.; Dobhal, S.; Keith, L.M.; Alvarez, A.M.; Arif, M. Xanthomonas spp. infecting Araceae and Araliaceae: Taxonomy, phylogeny, and potential virulence mechanisms. Biology 2025, 14, 766. [Google Scholar] [CrossRef]
  11. Dobhal, S.; Chuang, S.-C.; Arizala, D.; Keith, L.M.; Alvarez, A.M.; Arif, M. High-quality complete genome sequence of Xanthomonas phaseoli pv. dieffenbachiae outbreak strain D182: The causative agent of Anthurium Bacterial Blight in Hawai’i. PhytoFrontiers 2024, 4, 812–816. [Google Scholar] [CrossRef]
  12. Fukui, H.; Alvarez, A.M.; Fukui, R. Differential susceptibility of anthurium cultivars to bacterial blight in foliar and systemic infection phases. Plant Dis. 1998, 82, 800–806. [Google Scholar] [CrossRef]
  13. Constantin, E.C.; Haegeman, A.; Van Vaerenbergh, J.; Baeyen, S.; Van Malderghem, C.; Maes, M.; Cottyn, B. Pathogenicity and virulence gene content of Xanthomonas strains infecting Araceae, formerly known as Xanthomonas axonopodis pv. dieffenbachiae. Plant Pathol. 2017, 66, 1539–1554. [Google Scholar] [CrossRef]
  14. Mackay, I.M. Real-time PCR in the microbiology laboratory. Clin. Microbiol. Infect. 2004, 10, 190–212. [Google Scholar] [CrossRef]
  15. Bustin, S.A.; Benes, V.; Garson, J.A.; Hellemans, J.; Huggett, J.; Kubista, M.; Wittwer, C.T. The MIQE guidelines: Minimum information for publication of quantitative real-time PCR experiments. Clin. Chem. 2009, 55, 611–622. [Google Scholar] [CrossRef]
  16. Yan, X.; Zhang, Q.; Zou, J.; He, C.; Tao, J. Selection of optimized reference genes for qRT-PCR normalization in Xanthomonas campestris pv. campestris cultured in different media. Curr. Microbiol. 2019, 76, 613–619. [Google Scholar] [CrossRef]
  17. Petriccione, M.; Magri, A.; Gaudiano, M.; Scortichini, M. Selection and validation of reference genes for gene expression studies in Xanthomonas arboricola pv. juglandis subjected to abiotic stress. Plant Pathol. 2021, 70, 1455–1466. [Google Scholar] [CrossRef]
  18. Jacob, T.R.; Laia, M.L.; Ferro, J.A.; Ferro, M.I.T. Selection and validation of reference genes for gene expression studies by reverse transcription quantitative PCR in Xanthomonas citri subsp. citri during infection of Citrus sinensis. Biotechnol. Lett. 2011, 33, 1177–1184. [Google Scholar] [CrossRef]
  19. Kałużna, M.; Kuras, A.; Puławska, J. mRNA extraction of Xanthomonas fragariae in strawberry and validation of reference genes for RT-qPCR to study bacterial gene expression. Mol. Biol. Rep. 2019, 46, 5723–5733. [Google Scholar] [CrossRef]
  20. Pfaffl, M.W.; Tichopad, A.; Prgomet, C.; Neuvians, T.P. Determination of stable housekeeping genes, differentially regulated target genes and sample integrity: BestKeeper—Excel-based tool using pair-wise correlations. Biotechnol. Lett. 2004, 26, 509–515. [Google Scholar] [CrossRef]
  21. Vandesompele, J.; De Preter, K.; Pattyn, F.; Poppe, B.; Van Roy, N.; De Paepe, A.; Speleman, F. Accurate normalization of real-time quantitative RT-PCR data by geometric averaging of multiple internal control genes. Genome Biol. 2002, 3, RESEARCH0034. [Google Scholar] [CrossRef]
  22. Silver, N.; Best, S.; Jiang, J.; Thein, S.L. Selection of housekeeping genes for gene expression studies in human reticulocytes using real-time PCR. BMC Mol. Biol. 2006, 7, 33. [Google Scholar] [CrossRef]
  23. Worrall, L.J.; Majewski, D.D.; Strynadka, N.C.J. Structural insights into type III secretion systems of the bacterial flagellum and injectisome. Annu. Rev. Microbiol. 2023, 77, 669–698. [Google Scholar] [CrossRef]
  24. Livak, K.J.; Schmittgen, T.D. Analysis of relative gene expression data using real-time quantitative PCR and the 2−ΔΔCT method. Methods 2001, 25, 402–408. [Google Scholar] [CrossRef]
  25. Wengelnik, K.; Bonas, U. HrpXv, an AraC-type regulator, activates expression of five of the six loci in the hrp cluster of Xanthomonas campestris pv. vesicatoria. J. Bacteriol. 1996, 178, 3462–3469. [Google Scholar] [CrossRef]
  26. Furutani, A.; Tsuge, S.; Ohnishi, K.; Hikichi, Y.; Oku, T.; Tsuno, K.; Inoue, Y.; Ochiai, H.; Kaku, H.; Kubo, Y. Evidence for HrpXo-dependent expression of type II secretory proteins in Xanthomonas oryzae pv. oryzae. J. Bacteriol. 2004, 186, 1374–1380. [Google Scholar] [CrossRef]
  27. Guo, Y.; Figueiredo, F.; Jones, J.; Wang, N. HrpG and HrpX play global roles in coordinating different virulence traits of Xanthomonas axonopodis pv. citri. Mol. Plant Microbe Interact. 2011, 24, 649–661. [Google Scholar] [CrossRef]
  28. Kim, S.; Cho, Y.-J.; Song, E.-S.; Lee, S.H.; Kim, J.-G.; Kang, L.-W. Time-resolved pathogenic gene expression analysis of the plant pathogen Xanthomonas oryzae pv. oryzae. BMC Genom. 2016, 17, 345. [Google Scholar] [CrossRef]
  29. Katzen, F.; Ferreiro, D.U.; Oddo, C.G.; Ielmini, M.V.; Becker, A.; Pühler, A.; Ielpi, L. Xanthomonas campestris pv. campestris gum mutants: Effects on xanthan biosynthesis and plant virulence. J. Bacteriol. 1998, 180, 1607–1617. [Google Scholar] [CrossRef]
  30. Chou, F.-L.; Chou, H.-C.; Lin, Y.-S.; Yang, B.-Y.; Lin, N.-T.; Weng, S.-F.; Tseng, Y.-H. The Xanthomonas campestris gumD gene required for synthesis of xanthan gum is involved in normal pigmentation and virulence in causing black rot. Biochem. Biophys. Res. Commun. 1997, 233, 265–269. [Google Scholar] [CrossRef]
  31. Kim, S.-Y.; Kim, J.-G.; Lee, B.-M.; Cho, J.-Y. Mutational analysis of the gum gene cluster required for xanthan biosynthesis in Xanthomonas oryzae pv. oryzae. Biotechnol. Lett. 2009, 31, 265–270. [Google Scholar] [CrossRef]
Figure 1. Schematic representation of the time course in vitro assay for the interactions between Xanthomonas phaseoli pv. dieffenbachiae and Anthurium.
Mps 08 00072 g001
Figure 2. Average Ct value of four time point samples for four candidate reference genes in Xanthomonas phaseoli pv. dieffenbachiae PL36 strain cultured in NB + MS liquid medium.
Mps 08 00072 g002
Figure 3. Fold changes in gene expression of four target genes using gyrB and apoD as internal controls across four time point samples cultured in NB + MS.
Mps 08 00072 g003
Figure 4. Relative expressions of the gumD gene normalized using two reference genes, gyrB and rpoD, in NB+ and NB + MS liquid broths. (A) The gene expression was calculated using the 0 h-NB+ sample as the baseline to determine fold changes for both sets. (B) The gene expression of the 0 h-NB+ and 0 h-NB+MS samples were calculated as the individual baselines in NB+ and NB + MS sample sets. Dashed arrows indicate the fold changes in gene expression between NB+ and NB + MS samples at the 2 h time point.
Mps 08 00072 g004
Table 1. The primer sets of reference and target genes designed in the study.
Gene CandidateGene NamePrimer Sequence (5′-3′)Amplicon Size
(bp)
Tm
(°C)
Reference genes (RG)atpDatpD_QF: GCTGAGCGAAGAAGACAAGC
atpD_QR: GTCCTTCAGCGAGACGTACT
12462
gyrBgyrB_QF: TGACCGACGAACAAAACACC
gyrB_QR: CATCGCCGATATACATGCCG
11760
rpoDrpoD_QF: ATGAAAATCGCCAAGGAGCC
rpoD_QR: TGATGTTGGTGGTGTTGTCG
12460
thyAthyA_QF: AAGCCGTACCTGGAGTTGTT
thyA_QR: GGAAAGCCGTCGTTGAGATC
12560
Target genes (TG)fliMfilM_QF: TGGACGTGGACTTCGAGTAC
filM_QR: GAATACGGCAGGGTGATGTG
14560
gumDgumD_QF: TCCTGAACCATCTGCGTACC
gumD_QR: GTTACGGCTCAGGTAGTGGT
10160
hrpGhrpG_QF: ATCGGTGTTTCTGTTGACGC
hrpG_QR: GAAGCTCCAGTTCCTCGGAA
10760
hrpXhrpX_QF: ACTGCAACATCTCCAACAGC
hrpX_QR: ATACGCATCTTCGGCCTCTT
13360
Table 2. Final ranking and statistical comparison of four reference genes in X. phaseoli pv. dieffenbachiae PL36 cultured in NB + MS medium across four time points by BestKeeper, geNorm and delta Ct methods.
Reference GeneBestKeepergeNormΔCtFinal Rank
SD
[±Ct]
CV
[% Ct]
Rank M Value CVRank SD* Rank
atpD0.683.1240.520.2840.5144
gyrB0.341.4420.370.1520.3722
rpoD0.532.3830.350.1010.3411
thyA0.311.2910.450.2130.4533
SD [±Ct]: the standard deviation of the Ct; CV [% Ct]: coefficient of variance expressed as a percentage of the Ct value; M value: the measure of a gene’s expression stability; CV: coefficient of variance in geNorm; SD* (ΔCt*): mean of pairwise ΔCt values in ΔCt method.
Disclaimer/Publisher’s Note: The statements, opinions and data contained in all publications are solely those of the individual author(s) and contributor(s) and not of MDPI and/or the editor(s). MDPI and/or the editor(s) disclaim responsibility for any injury to people or property resulting from any ideas, methods, instructions or products referred to in the content.

