

Advanced Flow Cytometry Using the SYTO-13 Dye for the Assessment of Platelet Reactivity and Maturity in Whole Blood

 , ,
, ,
Abstract
1. Introduction
2. Materials
2.1. Flow Cytometer
2.2. Blood Sampling
2.3. Reagents
- CD42b-Alexa Flour 700 (AF700) (stock concentration: 100 µg/mL, mouse antibody, clone HIP1, Nordic BioSite, Copenhagen, Denmark, cat. no. 303928).
- CD45-Brilliant Violet 650 (BV650) (stock concentration: 100 µg/mL, mouse antibody, clone HI30, Nordic BioSite, Copenhagen, Denmark, cat. no. 304044).
- CD63-Phycoerythrin-Cyanine 7 (PECy7) (stock concentration: 200 µg/mL, mouse antibody, clone H5C6, Nordic BioSite, Copenhagen, Denmark, cat. no. 353010).
- CD62p-PE (P-selectin, stock concentration: 100 µg/mL, mouse antibody, clone AK4, Nordic BioSite, Copenhagen, Denmark, cat. no. 304906).
- Antifibrinogen (stock concentration: 1 mg/mL unconjugated, polyclonal chicken, Diapensia HB, Linköping, Sweden, cat. no. 2204).
- ReadiLink™ Rapid mFluor™ Violet 420 (V420) Antibody Labeling Kit (Nordic BioSite, Copenhagen, Denmark, cat. no. ABD-1105).
- SYTO-13 (stock concentration: 5 mM in dimethyl sulfoxide (DMSO), ThermoFisher Scientific, Copenhagen, Denmark, ref. no. S7575).
- NaCl (137 mmol, Merck, Darmstadt, Germany, ref. no. 1.06404.1000).
- KCl (2.7 mmol, Merck, Darmstadt, Germany, ref. no. 1.04936.0500).
- MgCl2 (1 mmol, Merck, Darmstadt, Germany, ref. no. 1.05833.0250).
- Glucose (5.6 mmol, Sigma-Aldrich, St. Louis, MO, USA, ref. no. G7021-100G).
- 4-(2-hydroxyethyl)-1-piper-azineethanesulfonic acid (HEPES) (20 mmol, Sigma-Aldrich, St. Louis, MO, USA, ref. no. H3375-100G).
- Bovine Serum Albumin (BSA, Sigma-Aldrich, St. Louis, MO, USA, ref. no. A7030.100G).
- Paraformaldehyde (PFA) (Formaldehyde Solution >36.0%, Sigma-Aldrich, St. Louis, MO, USA, ref. no. 47608-250ML-P).
- Phosphate-buffered saline (PBS) (one tablet, Sigma-Aldrich, St. Louis, MO, USA, ref. no. P441750TAB).
- Demineralized water (ELGA Purelab flex, Krüger Aquacare, Glostrup, Denmark).
- Titriplex (EDTA) (Merck, Darmstadt, Germany, ref. no. 1.08418.0100).
- PE isotype control (stock concentration: 0.2 mg/mL Mouse IgG1, κ isotype ctrl, Nordic BioSite, Copenhagen, Denmark, cat. no. 400112).
- Adenosine diphosphate (ADP, stock concentration: 1.4 µM) (Sigma-Aldrich, St. Louis, MO, USA, ref. no A5285-16).
- Thrombin Receptor Activating Peptide (TRAP-6, stock concentration: 2.6 µM) (JPT, Berlin, Germany, ref. no. 17951-4).
- Arachidonic Acid (AA, stock concentration: 15.3 mM) (Sigma-Aldrich, St. Louis, MO, USA, ref. no. SML 1395-100 MG).
- Collagen-related peptide (collagen, stock concentration: 7mg/mL) (CambCOL Ltd, Cambridge, UK, ref. 1 mg CRP-XL freeze-dried).
2.4. Equipment
- Nunc MaxiSorp™, flat-bottom (ThermoFisher Scientific, Copenhagen, Denmark, cat. no. 44-2404-21).
- Reaction vials (1.5 mL) (Chromsystems®, Munich, Germany, order no. 33005).
- Superclear® 12 × 75 mm culture tubes (test tubes) (Labcon, Petaluma, CA, USA, ref. no. 3350-368-000-9).
- Wizard Advanced IR Vortex Mixer (VELP Scientific Inc, New York, NY, USA).
- CytoFLEX S (B75442) flow cytometer (In deep well configuration, Beckman Coulter, Miami, FL, USA).
- CytExpert Software (Version 2,4, Beckman Coulter, Miami, FL, USA).
3. Procedure
3.1. Storage of Reagents
- HEPES buffer was collected from the freezer or cooler. See Section 6.2.
- Antibodies and PE isotypic control were collected from the cooler.
 CRITICAL STEP: HEPES buffer, antibodies, and PE isotype control should reach room temperature before further processing.

3.2. Preparation of Reagents
- 1.
- Antibodies and isotypic control dilution were prepared in seven labelled reaction vials.
- 2.
- P-selectin-PE: 1 µL antibody in 74 µL HEPES (dilution factor 1:75).
- 3.
- CD63-PCy7: 25 µL antibody in 25 µL HEPES (dilution factor 1:2).
- 4.
- Antifibrinogen-V420 (See Section 6.3): 25 µL antibody in 25 µL HEPES (dilution factor 1:2).
- 5.
- SYTO-13: 1 µL dye in 19 µL HEPES (dilution factor 1:20).
- 6.
- PE isotype control: 1 µL antibody in 150 µL HEPES (dilution factor 1:150).
- 7.
- CD42b-AF700: undiluted.
- 8.
- CD45-BV650: undiluted.
- 9.
- An antibody cocktail was prepared in a single reaction vial using the previously diluted antibodies/reagents: 32 µL P-selectin-PE, 32 µL CD63-PCy7, 32 µL Antifibrinogen-V420, 32 µL SYTO-13, 48 µL CD42b-AF700, 3.2 µL CD45-BV650 and 172.8 µL HEPES buffer.
3.3. Preparations of Working Dilutions of Agonists
- 10.
- Agonists were collected from the freezer.
- 11.
 CRITICAL STEP: keep agonists in the freezer until immediately before use, thaw at room temperature for 5 min.
- 12.
- Agonist dilution was prepared in Eppendorf tubes.
- 13.
- Collagen:
- 14.
- Add 1 µL agonist in 99 µL HEPES buffer (solution A).
- 15.
- Add 1 µL of solution A in 99 µL HEPES buffer (working concentration: 0.7 μg/mL).
- 16.
- ADP: Add 5 µL of agonist in 45 µL HEPES buffer (working concentration: 140 μM).
- 17.
- TRAP: Add 10 µL of agonist in 60 µL HEPES buffer (working concentration: 371 μM).
- 18.
- AA: Add 15 µL of agonist in 15.6 µL HEPES buffer (working concentration: 7.5 mM).

3.4. Preparing Test Tubes
- 19.
- Six test tubes were prepared:
- 20.
- Negative/isotype sample: 5 µL CD63-PCy7 (diluted), 5 µL antifibrinogen-V420 (diluted), 7.5 µL CD42b-AF700 (undiluted), 0.5 CD45-BV650 (undiluted), 5 µL PE isotype control, 5 µL EDTA (undiluted) and 32 µL HEPES buffer.
- 21.
- HEPES/preactivation sample: 55 µL antibody cocktail and 5 µL HEPES buffer.
- 22.
- Collagen sample: 55 µL antibody cocktail and 5 µL collagen (final assay concentration: 0.05 μg/mL).
- 23.
- ADP sample: 55 µL antibody cocktail and 5 µL ADP (final assay concentration: 10.8 μM).
- 24.
- TRAP sample: 55 µL antibody cocktail and 5 µL TRAP (final assay concentration: 28.6 μM).
- 25.
- AA sample: 55 µL antibody cocktail and 5 µL AA (final assay concentration: 0.58 μM).
- 26.
 CRITICAL STEP: antibodies and PE isotype control must not be exposed to direct light for a prolonged period.
- 27.
- A total of 5 µL whole blood was added to each test tube at 20 s intervals.
- 28.
- Each sample was mixed slightly by gently shaking the tube.
- 29.
 CRITICAL STEP: incubate for exactly 10 min in darkness.
- 30.
- After incubation, 2 mL PBS-0.2% PFA was added to each test tube for fixation with 20 s intervals. See Section 6.4.
- 31.
 CRITICAL STEP: after adding fixative, each test tubes must be vortexed immediately for 8–10 s.
- 32.
- After fixation, the test tubes must rest in darkness for 1 h.


3.5. Preparing the Analysis
- 33.
- The waste bottle was emptied and refilled with sheath fluid container.
- 34.
- CytoFLEX and the associated computer were started.
- 35.
- CytExpert software was started.
- 36.
- The system startup program was run: see Section 6.6.
- 37.
- The daily quality control program was run: see Section 6.7.
- 38.
- A new experiment was created from the template: see Section 6.8.
3.6. Analysis (This May Take up to 90 min Depending on Platelet Count)
- 39.
- A well plate was prepared.
- 40.
- Using a manual pipette, add a sample of Test Tube 1 into Well 1, Test Tube 2 into Well 2, and so forth.
- 41.
- Inset well plate onto plate loader on CytoFLEX.
- 42.
- Load the plate.
- 43.
- Press Initialize in CytExpert software.
- 44.
- Press Backflush in CytExpert software.
- 45.
- Press Autorecord in CytExpert software.
- 46.
 CRITICAL STEP: the placement of the test wells in CytExpert software must match the added wells on the plate.

3.7. Data Quality
- 47.
- Preactivation was evaluated on the basis of P-selectin expression in Test Tube 2 containing the antibody cocktail, HEPES buffer, and whole blood (see Section 4.2).
- 48.
- P-selectin expression < 15% was considered to be acceptable (no evidence of preactivation).
- 49.
- In the case of P-selectin expression > 15%, the results should be evaluated with caution.
4. Results and Interpretation
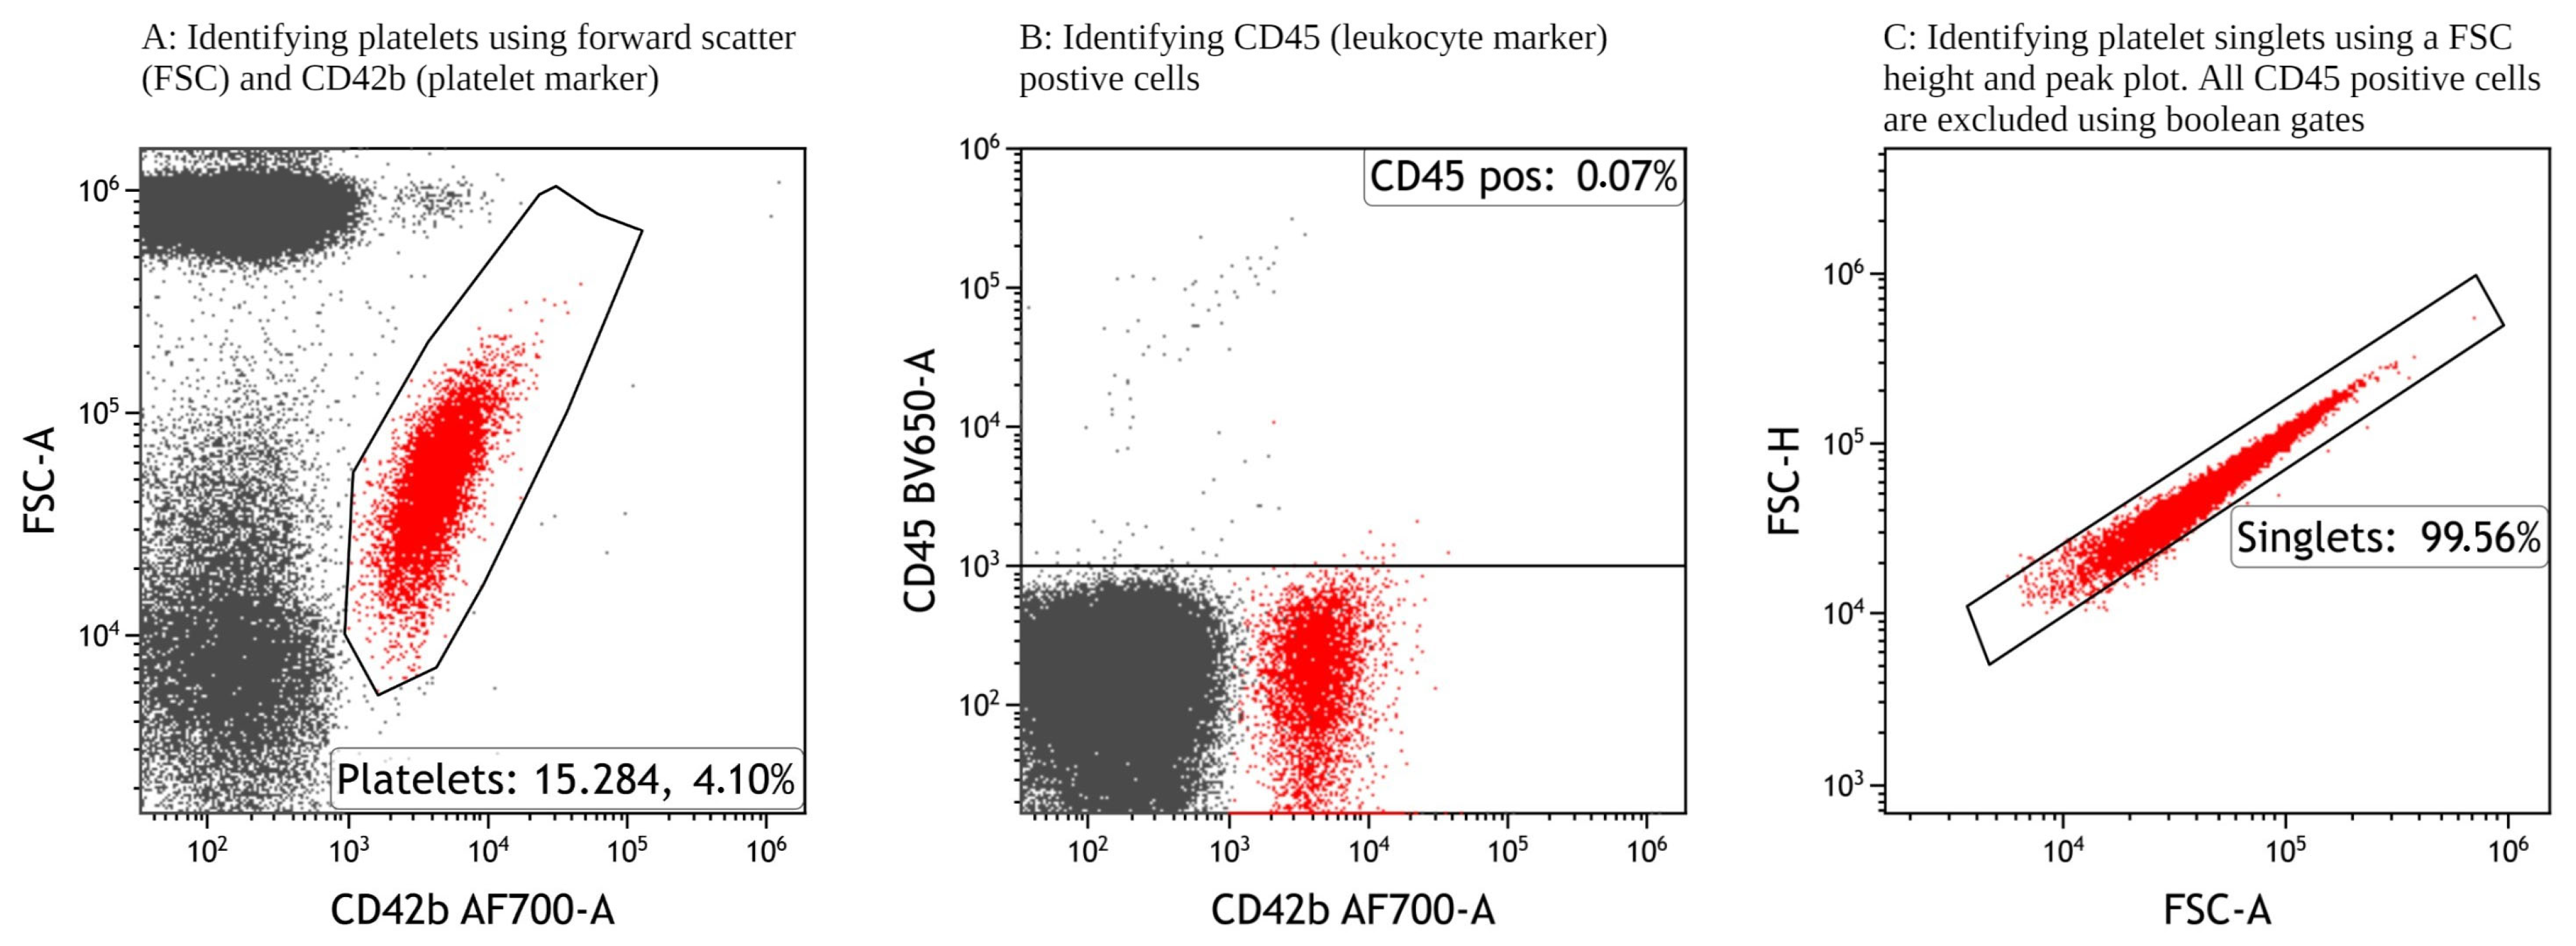
4.1. Identifying Single Platelets
- 50.
- Single platelets were identified for further analysis using the gating strategy as shown in Figure 1. Minor adjustments are to be expected between test tubes; see Section 6.9.
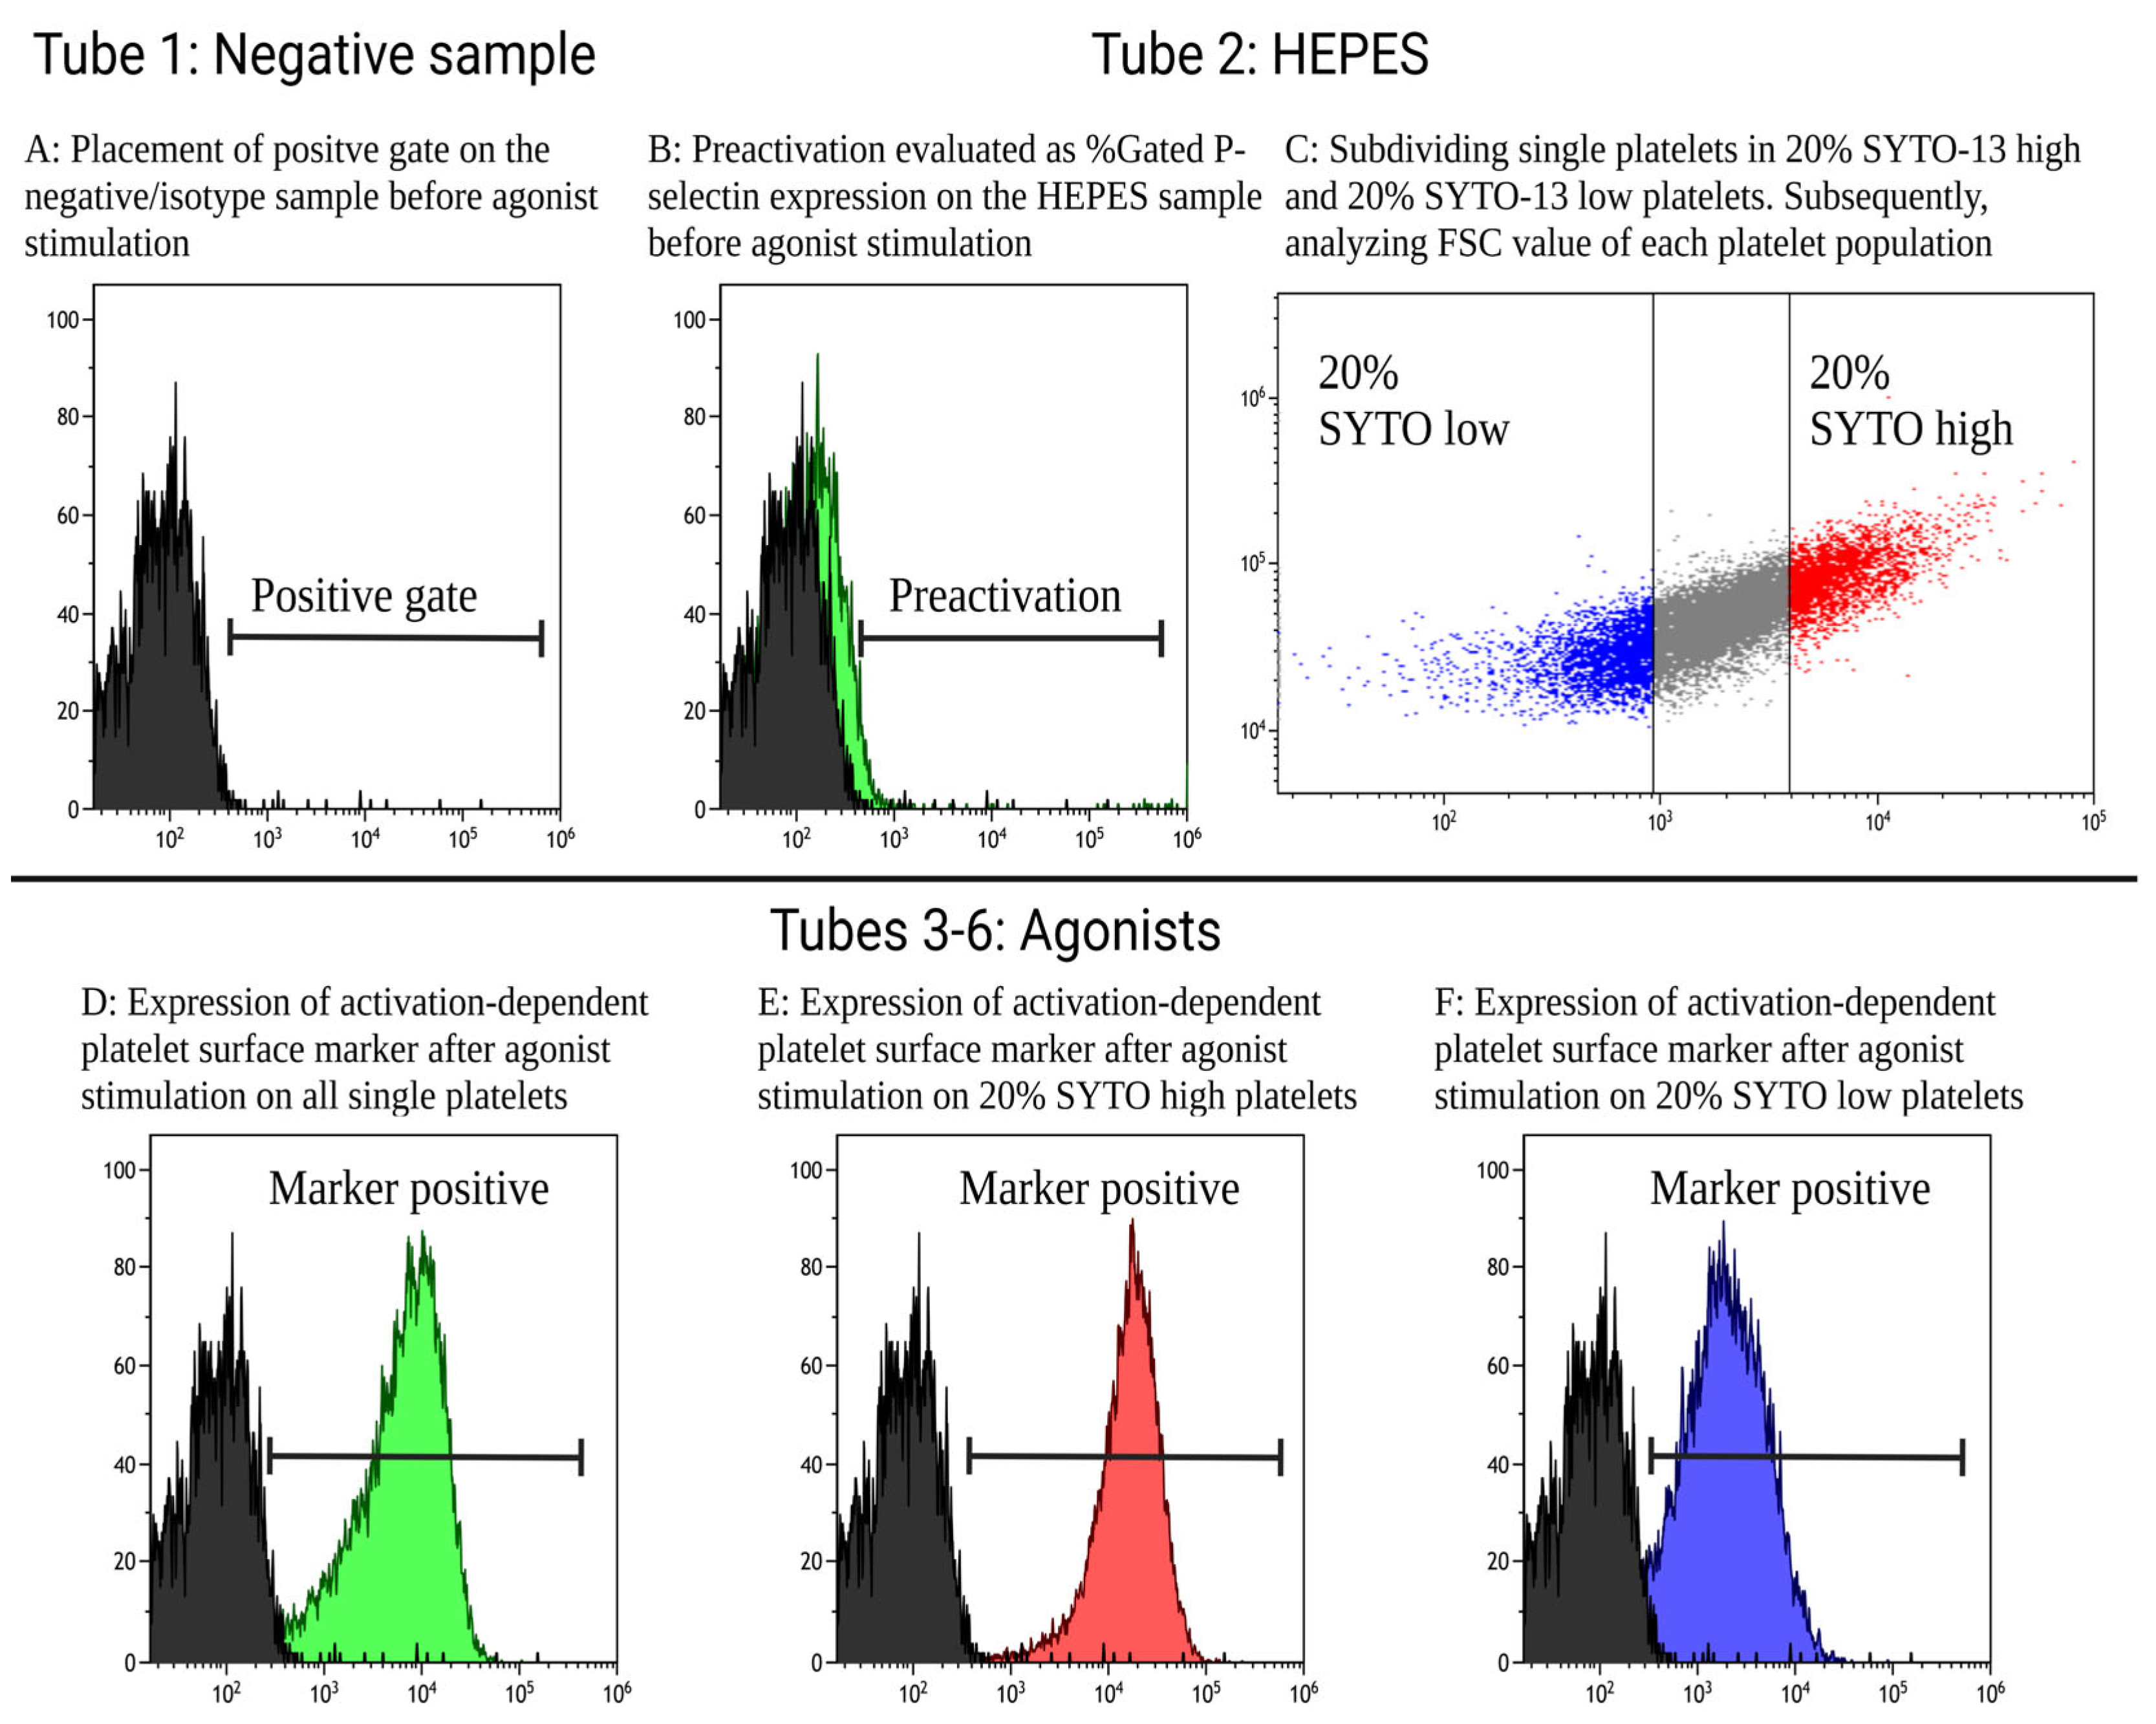
4.2. Defining Gates and Measurements
- 51.
- The expression of activation-dependent platelet surface markers (antifibrinogen, CD63, and P-selectin) was evaluated via the percentage of positive platelets and with median fluorescence intensity (MFI) corresponding to the amount of the expression of a surface marker.
- 52.
- Test Tube 1 (negative sample) was used to set the positive gates, as shown in Figure 2A. The positive gates were set to include 1–2% events for antifibrinogen and CD63, 0.1–0.2% events for P-selectin, and 0.02–0.04% events for SYTO-13 on the negative control. Gates must be applied to all tubes, although minor adjustment can be expected between test tubes. Preactivation was evaluated through the positive expression of P-selectin in Test Tube 2 containing the antibody cocktail, whole blood, and HEPES buffer instead of an agonist, as shown in Figure 2B. Furthermore, using the HEPES sample, all single platelets were subdivided into quintiles according to SYTO MFI. SYTO-high platelets occupied the first quintile (20% of platelets with the highest SYTO-13 expression) and SYTO-low platelets occupied the fifth quintile (20% of the platelets with the lowest SYTO-13 expression), as shown in Figure 2C. In Test Tubes 3–6, containing agonists, the MFI and percentage of positive platelets of activation-dependent platelet surface markers of all single platelet were evaluated as shown in Figure 2D, SYTO-high platelets in Figure 2E, and SYTO-low platelets in Figure 2F.
4.3. Results
- 53.
- Table 1 shows the flow cytometric analysis of platelet reactivity in 20 healthy individuals investigated using the current protocol. The expression of antifibrinogen indicates platelet-to-platelet aggregation, as this process is mediated through fibrinogen binding [21]. The expression of CD63 indicates the release of dense granules containing high concentrations of ADP that increase platelet reactivity [1]. The expression of P-selectin indicates the release of α-granules containing proteins participating in platelet reactivity, cell adhesion, and coagulation [1].
- 54.
- Table 2 shows the platelet reactivity of SYTO-high platelets (immature platelets) and SYTO-low platelets (mature platelets) in 20 healthy individuals investigated via flow cytometry using the described protocol. SYTO-high platelets were statistically significantly larger (higher FSC) than the SYTO-13-low platelets. Furthermore, SYTO-high platelets had overall statistically significantly increased platelet reactivity compared with the SYTO-low platelets.
5. Summary and Conclusions
6. Notes
6.1. Blood Sampling
6.2. HEPES Buffer
6.3. Conjugation of Antifibrinogen with V420
6.4. Mixture of PBS-0.2% PFA Fixation
6.5. Flow Cytometer Settings
6.6. System Startup Program
6.7. Daily Quality Control Program
6.8. Experiment Creation
- “New Experiment from Template” was selected on the Start page.
- “Browse” was selected to save the experiment in the preferred location.
- “Template” was selected to choose the specific template (a template must be created before analysis).
6.9. Identification of Platelets
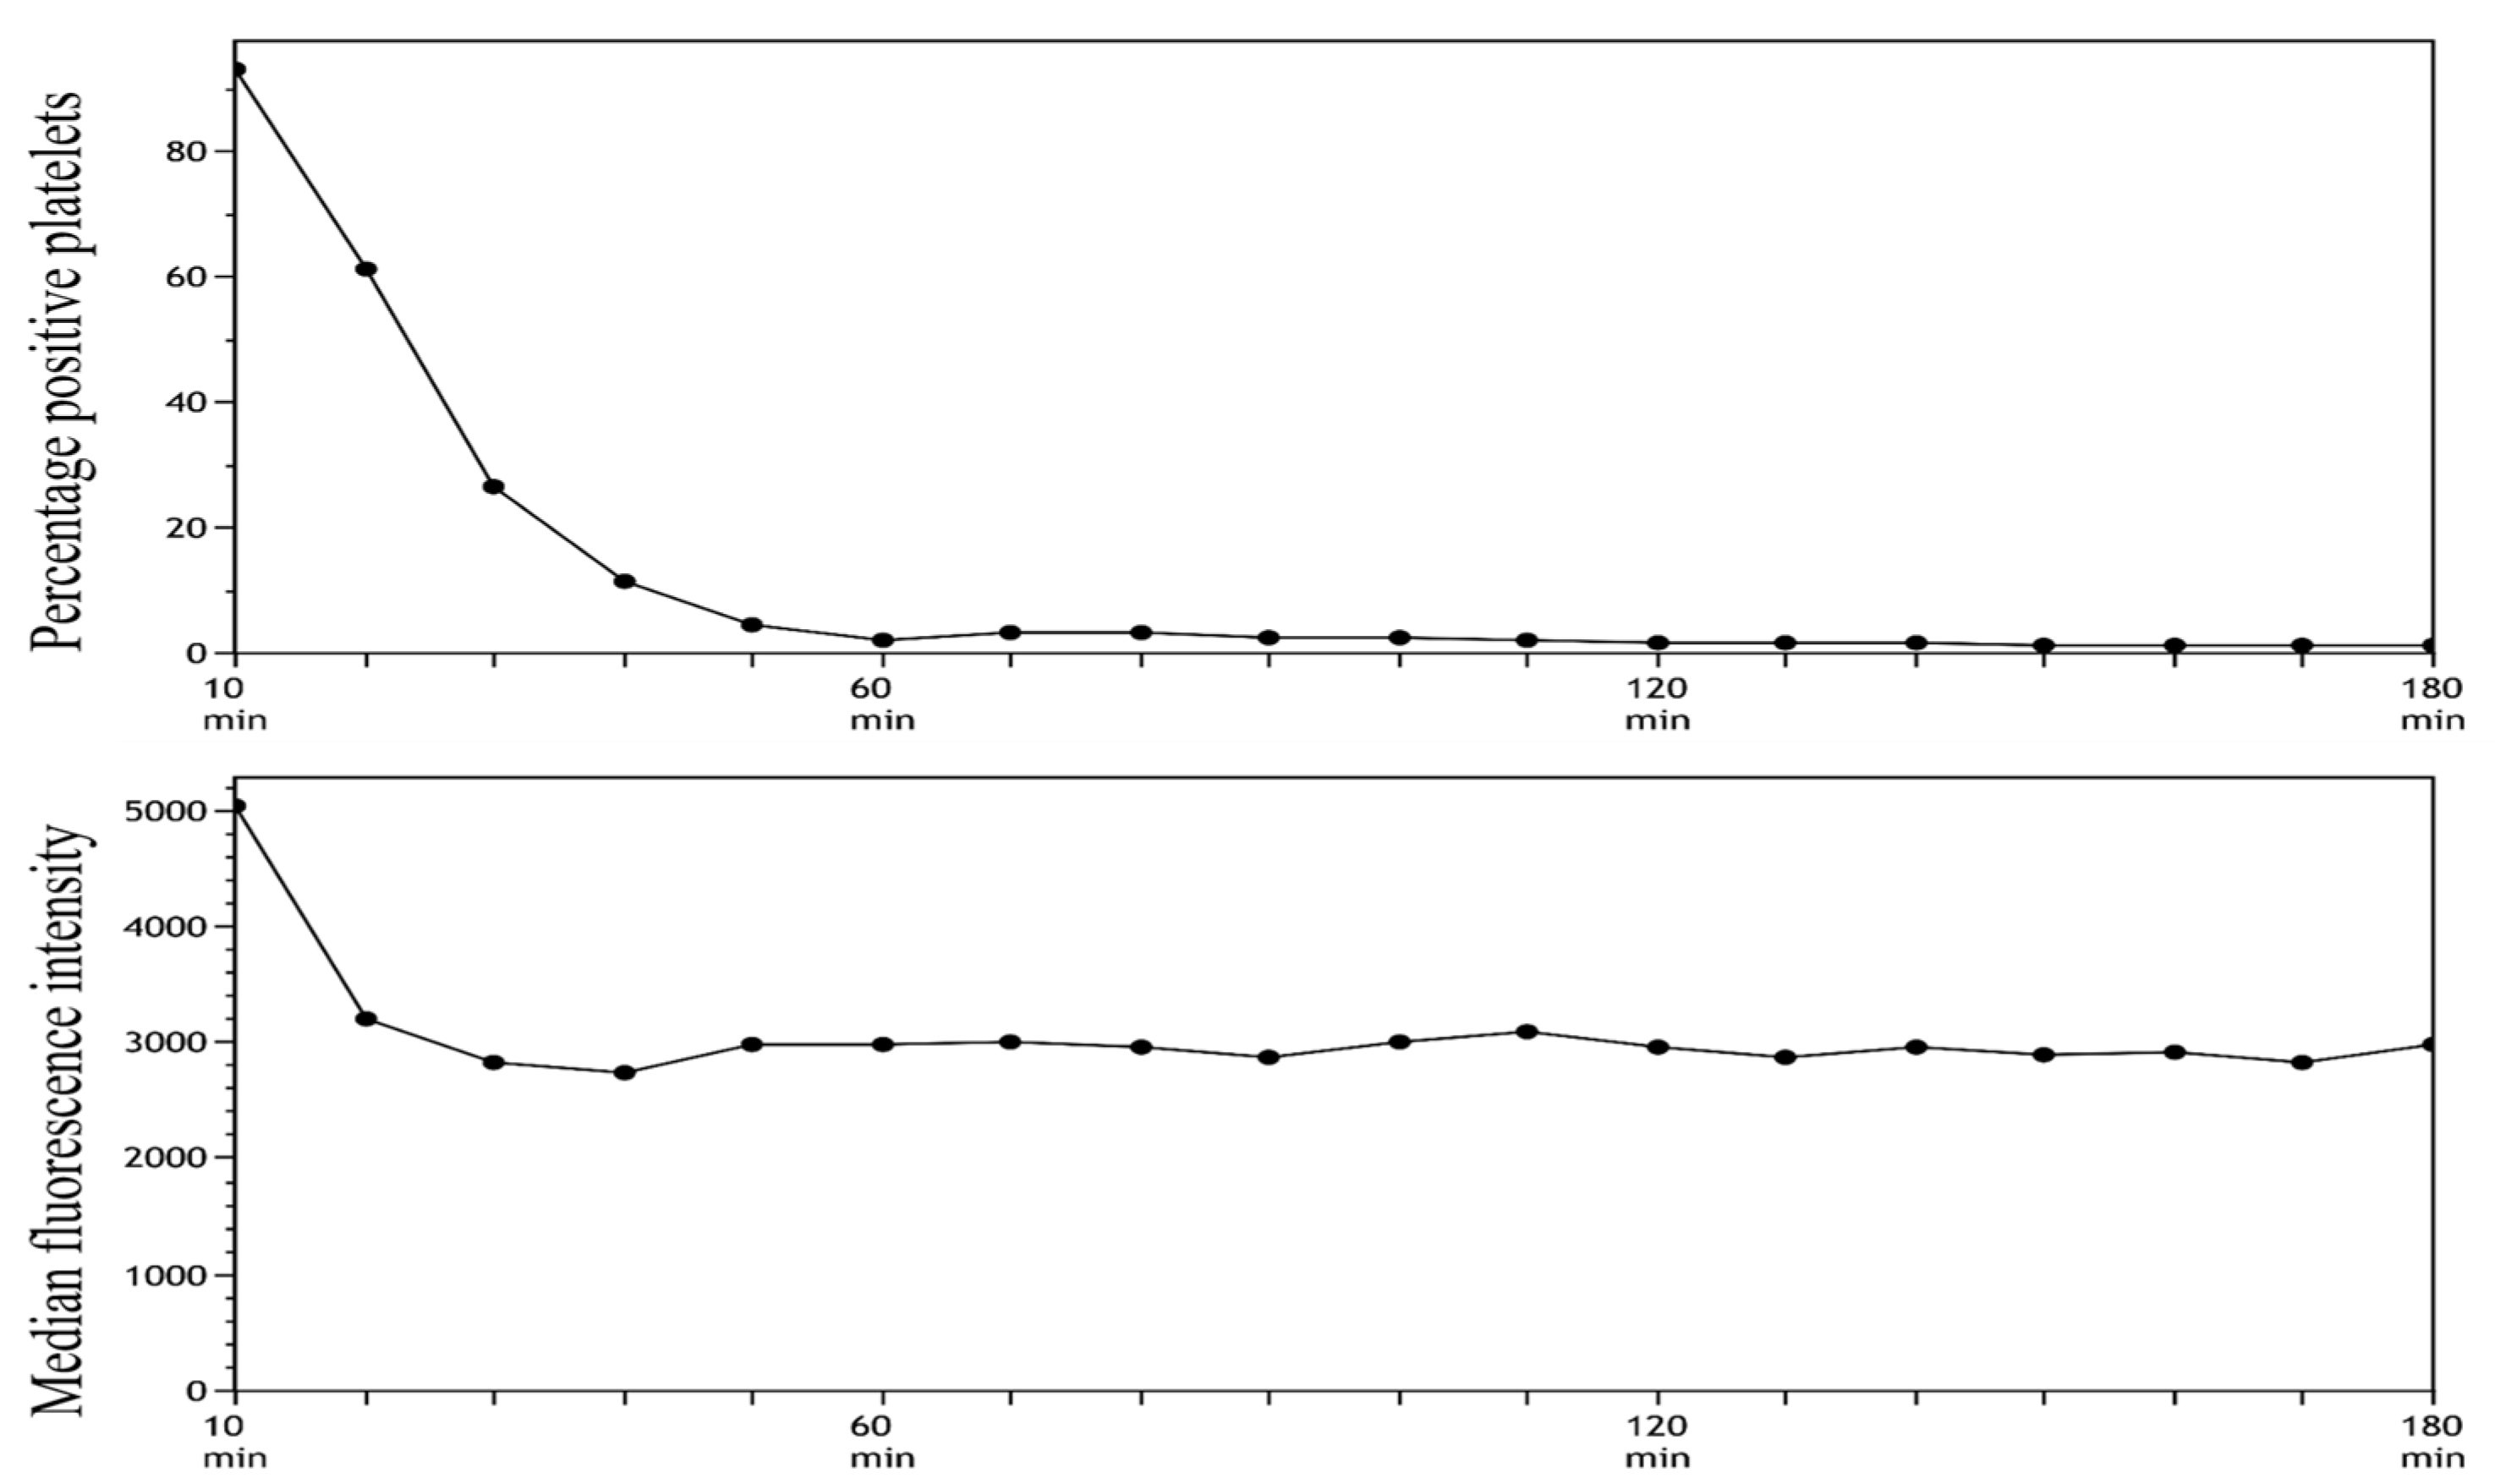
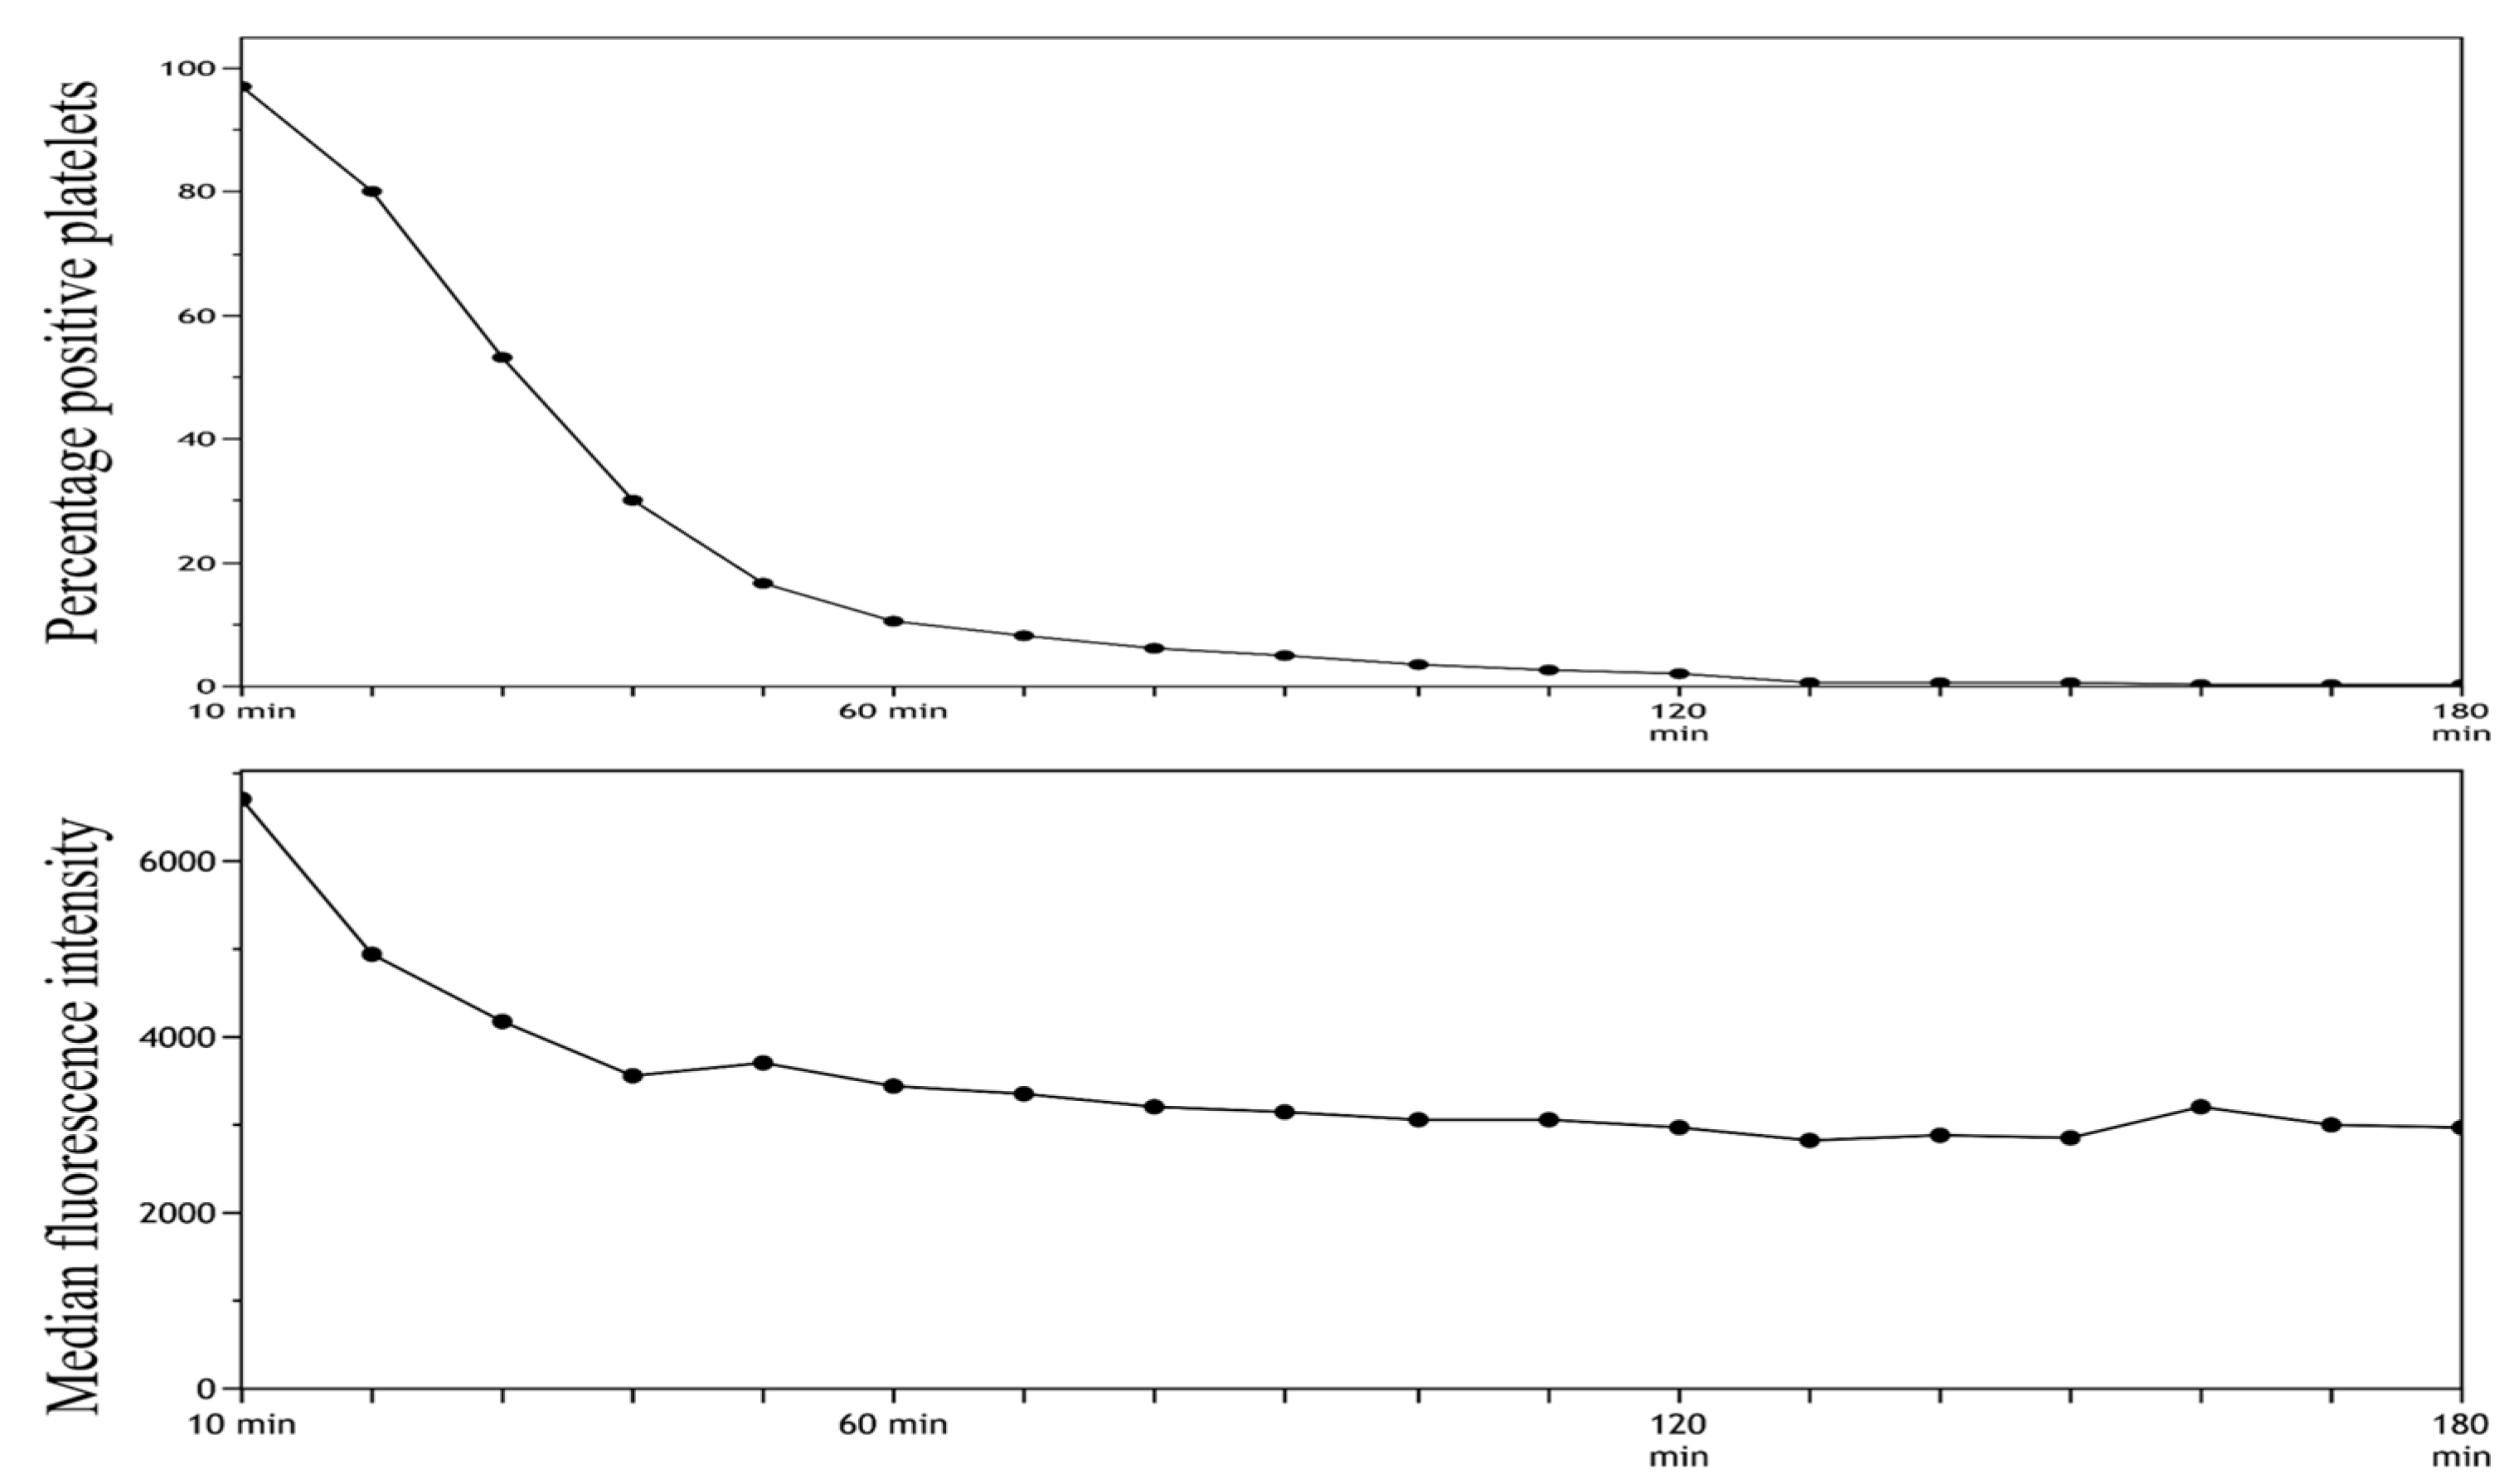
6.10. Stability of SYTO-13 Dye
- A total of 5 µL of SYTO-13 with a final concentration of 13.7 µM, 7.5 µL of CD42b, 0.5 µL of CD45, and 47.0 µL HEPES was pooled.
- Then, 5 µL whole blood was added.
- Fixation with 2 mL of 0.2% PFA-PBS.
- After fixation, samples were transferred to the well plate and analyzed.
- The analysis started by running an unstained sample, analyzed in 6 min, followed by the analysis of a stained sample for 4 min.
- The unstained sample was used to set the gate to subdivide platelets into SYTO-13-positive and SYTO-13 negative.
- Steps 6 and 7 were repeated for a total of 3 h.
- The MFI and percentage of positive platelets were stable after 10 min of incubation followed by 60 min of resting. On the basis of these findings, we decided to use these time intervals in our future analyses.
6.11. Titration of Antibodies
- A final SYTO-13 concentration of 19.23 µM was selected.
- A final P-selectin concentration of 0.10 µg/mL was selected.
- A final CD63 concentration of 7.69 µg/mL was selected.
- A final antifibrinogen concentration of 0.013 µg/mL was selected.
6.12. Stability of Activation Dependent Surface Markers
6.13. Titration of Agonists
6.14. Agonist Dilution
6.15. Compensation
Author Contributions
Funding
Institutional Review Board Statement
Informed Consent Statement
Data Availability Statement
Acknowledgments
Conflicts of Interest
Ethics Statement
References
- Gremmel, T.; Frelinger, A.L., 3rd; Michelson, A.D. Platelet Physiology. Semin. Thromb. Hemost. 2016, 42, 191–204. [Google Scholar] [CrossRef]
- Michelson, A.D. Evaluation of Platelet Function by Flow Cytometry. Pathophysiol. Haemost. Thromb. 2006, 35, 67–82. [Google Scholar] [CrossRef]
- Pedersen, O.B.; Pasalic, L.; Nissen, P.H.; Grove, E.L.; Kristensen, S.D.; Hvas, A.-M. Flow Cytometric Assessment of Changes in Platelet Reactivity after Acute Coronary Syndrome: A Systematic Review. Semin. Thromb. Hemost. 2022, 48, 542–551. [Google Scholar] [CrossRef]
- Ramström, S.; Södergren, A.L.; Tynngård, N.; Lindahl, T.L. Platelet Function Determined by Flow Cytometry: New Perspectives? Semin. Thromb. Hemost. 2016, 42, 268–281. [Google Scholar] [CrossRef]
- Rubak, P.; Nissen, P.H.; Kristensen, S.D.; Hvas, A.-M. Investigation of platelet function and platelet disorders using flow cytometry. Platelets 2016, 27, 66–74. [Google Scholar] [CrossRef]
- Pedersen, O.H.; Larsen, M.L.; Grove, E.L.; Niekerk, P.B.V.K.; Bønløkke, S.; Nissen, P.H.; Kristensen, S.D.; Hvas, A. Platelet characteristics in patients with essential thrombocytosis. Cytom. Part B Clin. Cytom. 2018, 94, 918–927. [Google Scholar] [CrossRef]
- Pedersen, O.H.; Nissen, P.H.; Hvas, A.-M. Platelet function investigation by flow cytometry: Sample volume, needle size, and reference intervals. Platelets 2018, 29, 199–202. [Google Scholar] [CrossRef]
- Frelinger, A.L., 3rd; Rivera, J.; Connor, D.E.; Freson, K.; Greinacher, A.; Harrison, P.; Kunishima, S.; Lordkipanidzé, M.; Michelson, A.D.; Ramström, S.; et al. Consensus recommendations on flow cytometry for the assessment of inherited and acquired disorders of platelet number and function: Communication from the ISTH SSC Subcommittee on Platelet Physiology. J. Thromb. Haemost. 2021, 19, 3193–3202. [Google Scholar] [CrossRef]
- McBane, R.D., 2nd; Gonzalez, C.; Hodge, D.O.; Wysokinski, W.E. Propensity for young reticulated platelet recruitment into arterial thrombi. J. Thromb. Thrombolysis 2014, 37, 148–154. [Google Scholar] [CrossRef]
- Hoffmann, J.J. Reticulated platelets: Analytical aspects and clinical utility. Clin. Chem. Lab. Med. 2014, 52, 1107–1117. [Google Scholar] [CrossRef]
- Angénieux, C.; Maître, B.; Eckly, A.; Lanza, F.; Gachet, C.; de la Salle, H. Time-Dependent Decay of mRNA and Ribosomal RNA during Platelet Aging and Its Correlation with Translation Activity. PLoS ONE 2016, 11, e0148064. [Google Scholar] [CrossRef] [PubMed]
- Cesari, F.; Marcucci, R.; Caporale, R.; Paniccia, R.; Romano, E.; Gensini, G.F.; Abbate, R.; Gori, A.M. Relationship between high platelet turnover and platelet function in high-risk patients with coronary artery disease on dual antiplatelet therapy. Thromb. Haemost. 2008, 99, 930–935. [Google Scholar] [CrossRef]
- Freynhofer, M.K.; Gruber, S.C.; Grove, E.L.; Weiss, T.W.; Wojta, J.; Huber, K. Antiplatelet drugs in patients with enhanced platelet turnover: Biomarkers versus platelet function testing. Thromb. Haemost. 2015, 114, 459–468. [Google Scholar] [CrossRef]
- Robinson, M.; Machin, S.; Mackie, I.; Harrison, P. In vivo biotinylation studies: Specificity of labelling of reticulated platelets by thiazole orange and mepacrine. Br. J. Haematol. 2000, 108, 859–864. [Google Scholar] [CrossRef]
- Faber, J.; Hvas, A.-M.; Kristensen, S.D.; Grove, E.L.; Adelborg, K. Immature Platelets and Risk of Cardiovascular Events among Patients with Ischemic Heart Disease: A Systematic Review. Thromb. Haemost. 2021, 121, 659–675. [Google Scholar] [CrossRef]
- Grove, E.L.; Hvas, A.M.; Kristensen, S.D. Immature platelets in patients with acute coronary syndromes. Thromb. Haemost. 2009, 101, 151–153. [Google Scholar]
- Cesari, F.; Marcucci, R.; Gori, A.M.; Caporale, R.; Fanelli, A.; Casola, G.; Balzi, D.; Barchielli, A.; Valente, S.; Giglioli, C.; et al. Reticulated platelets predict cardiovascular death in acute coronary syndrome patients. Insights from the AMI-Florence 2 Study. Thromb. Haemost. 2013, 109, 846–853. [Google Scholar] [CrossRef]
- Ibrahim, H.; Schutt, R.C.; Hannawi, B.; DeLao, T.; Barker, C.M.; Kleiman, N.S. Association of Immature Platelets With Adverse Cardiovascular Outcomes. J. Am. Coll. Cardiol. 2014, 64, 2122–2129. [Google Scholar] [CrossRef]
- Van der Linden, N.; Klinkenberg, L.J.; Meex, S.J.; Beckers, E.A.; de Wit, N.C.; Prinzen, L. Immature platelet fraction measured on the S ysmex XN hemocytometer predicts thrombopoietic recovery after autologous stem cell transplantation. Eur. J. Haematol. 2014, 93, 150–156. [Google Scholar] [CrossRef]
- Hille, L.; Cederqvist, M.; Hromek, J.; Stratz, C.; Trenk, D.; Nührenberg, T.G. Evaluation of an Alternative Staining Method Using SYTO 13 to Determine Reticulated Platelets. Thromb. Haemost. 2019, 119, 779–785. [Google Scholar] [CrossRef]
- Jackson, C.W.; Jennings, L.K. Heterogeneity of fibrinogen receptor expression on platelets activated in normal plasma with ADP: Analysis by flow cytometry. Br. J. Haematol. 1989, 72, 407–414. [Google Scholar] [CrossRef]


| Reactivity Markers | Percentage of Positive Platelets | MFI |
|---|---|---|
| Antifib (COL) | 68 (53;74) | 2791 (2540;3383) |
| CD63 (COL) | 81 (77;88) | 29,746 (25,375;34,419) |
| P-sel (COL) | 97 (94;98) | 11,095 (9703;13,817) |
| Antifib (ADP) | 52 (49;63) | 2474 (2056;2852) |
| CD63 (ADP) | 33 (26;42) | 14,148 (10,332;15,784) |
| P-sel (ADP) | 84 (71;88) | 3504 (2545;5127) |
| Antifib (TRAP) | 68 (60;71) | 2638 (2232;3060) |
| CD63 (TRAP) | 86 (80;90) | 29,620 (24,975;34,233) |
| P-sel (TRAP) | 97 (95;98) | 10,967 (9266;13,644) |
| Antifib AA | 75 (61;84) | 2648 (2309;3030) |
| CD63 (AA) | 75 (68;84) | 18,610 (15,891;23,403) |
| P-sel (AA) | 81 (70;86) | 1542 (1051;2064) |
| Preactivation (P-sel expression in resting platelets) | 2 (2;3) |
| SYTO-High Platelets (Immature Platelets) | SYTO-Low Platelets (Mature Platelets) | p-Value of Difference (High vs. Low) | ||||
|---|---|---|---|---|---|---|
| Markers | MFI | MFI | ||||
| FSC (HEPES) | 84,934 | 30035 | <0.0001 | |||
| 75,527;94,029 | 25,376;31,368 | |||||
| Reactivity Markers | Percentage of positive platelets | MFI | Percentage of positive platelets | MFI | Percentage of positive platelets | MFI |
| Antifib (COL) | 75 | 3782 | 60 | 2433 | <0.0001 | <0.0001 |
| 60;81 | 3324;4305 | 44;68 | 2160;2785 | |||
| CD63 (COL) | 80 | 38,284 | 81 | 25,362 | 0.50 | <0.0001 |
| 72;90 | 29,456;44,463 | 74;85 | 20,275;28,528 | |||
| P-sel (COL) | 95 | 12,822 | 96 | 9699 | 0.09 | <0.0001 |
| 92;98 | 10,938;18,772 | 94;97 | 8086;11,486 | |||
| Antifib (ADP) | 62 | 2975 | 43 | 2172 | <0.0001 | <0.0001 |
| 54;72 | 2373;3769 | 32;50 | 1904;2390 | |||
| CD63 (ADP) | 41 | 14,233 | 29 | 14,075 | <0.0001 | 0.73 |
| 31;47 | 10,424;15,893 | 24;39 | 10,383;16,021 | |||
| P-sel (ADP) | 81 | 4096 | 84 | 3172 | 0.51 | <0.0001 |
| 67;85 | 3071;5773 | 72;87 | 2352;4334 | |||
| Antifib (TRAP) | 78 | 3365 | 51 | 2133 | <0.0001 | <0.0001 |
| 68;81 | 3012;4412 | 40;61 | 1911;2368 | |||
| CD63 (TRAP) | 88 | 46,033 | 78 | 20,717 | <0.0001 | <0.0001 |
| 83;94 | 36,010;48,869 | 73;84 | 18,589;24,851 | |||
| P-sel (TRAP) | 97 | 15,579 | 95 | 8218 | 0.03 | <0.0001 |
| 95;98 | 12,256;21,171 | 95;97 | 6681;9734 | |||
| Antifib (AA) | 93 | 3809 | 61 | 2177 | 0.0003 | <0.0001 |
| 66;96 | 2894;5013 | 44;75 | 1828;2334 | |||
| CD63 (AA) | 94 | 29,713 | 52 | 13,829 | 0.0003 | <0.0001 |
| 69;96 | 22,360;38,195 | 42;69 | 12,101;16,868 | |||
| P-sel (AA) | 88 | 2838 | 63 | 927 | 0.0005 | <0.0001 |
| 82;93 | 1583;3567 | 53;76 | 842;1340 | |||
| Antibodies | Fluorescence | Channel | Laser | Filter |
|---|---|---|---|---|
| CD42b | AF700 | FL3 | Red | 712/25 |
| CD45 | BV650 | FL5 | Violet | 780/60 |
| Antifibrinogen | V420 | FL4 | Violet | 450/45 |
| CD63 | PECy7 | FL7 | Yellow-Green | 780/60 |
| CD62p/P-selectin | PE | FL6 | Yellow-Green | 585/42 |
| SYTO-13 | FL1 | Blue | 525/40 |
| Marker | Directly after Fixation | 60 min Resting after Fixation | Percentage Difference | ||
|---|---|---|---|---|---|
| HEPES | Preactivation (P-selectin) | % positive | 3 | 3 | 13 |
| MFI | 658 | 686 | 4 | ||
| Collagen | Antifibrinogen | % positive | 85 | 85 | 0.0 |
| MFI | 2138 | 2194 | 3 | ||
| CD63 | % positive | 72 | 74 | 4 | |
| MFI | 28,925 | 29,086 | 1 | ||
| P-selectin | % positive | 91 | 9 | 0 | |
| MFI | 9225 | 9334 | 1 | ||
| ADP | Antifibrinogen | % positive | 79 | 80 | 1 |
| MFI | 2237 | 2277 | 2 | ||
| CD63 | % positive | 21 | 23 | 8 | |
| MFI | 13,758 | 13,472 | 2 | ||
| P-selectin | % positive | 79 | 77 | 4 | |
| MFI | 2708 | 2518 | 7 | ||
| TRAP | Antifibrinogen | % positive | 88 | 88 | 0 |
| MFI | 2365 | 2425 | 3 | ||
| CD63 | % positive | 87 | 88 | 1 | |
| MFI | 30,664 | 31,976 | 4 | ||
| P-selectin | % positive | 98 | 98 | 0 | |
| MFI | 11,594 | 11,192 | 3 | ||
| Arachidonic Acid | Antifibrinogen | % positive | 96 | 95 | 1 |
| MFI | 2613 | 2630 | 1 | ||
| CD63 | % positive | 79 | 85 | 7 | |
| MFI | 23,678 | 26,036 | 10 | ||
| P-selectin | % positive | 91 | 88 | 3 | |
| MFI | 2265 | 1748 | 23 |
| ADP | TRAP | Collagen | AA | |
|---|---|---|---|---|
| Agonist stock conc. | 1.4 mM | 2.6 µL | 7 mg/mL | 15.3 mM |
| Agonist stock volume | 5 µL | 10 µL | 1 µL * | 15 µL |
| HEPES buffer volume | 45 µL | 60 µL | 99 µL | 15.6 µL |
| Agonist working dilution volume | 50 µL | 70 µL | 100 µL | 30.6 µL |
| Agonist working dilution conc. | 140 µM | 371 µM | 0.7 µg/mL | 7.5 mM |
| Blood sample | 5 µL | 5 µL | 5 µL | 5 µL |
| Antibody cocktail volume | 55 µL | 55 µL | 55 µL | 55 µL |
| Agonist (working dilution) volume | 5 µL | 5 µL | 5 µL | 5 µL |
| Final assay volume | 65 µL | 65 µL | 65 µL | 65 µL |
| Agonist final assay conc | 10.8 µM | 28.6 µM | 0.05 µg/mL | 0.58 µM |
| Spilover (%) | ||||||
|---|---|---|---|---|---|---|
| FL1 | FL3 | FL4 | FL5 | FL6 | FL7 | |
| FL1 | 3.72 | 6.90 | 0.18 | 0.83 | 0.33 | |
| FL3 | 4.04 | 7.41 | 5.65 | 0.77 | 0.33 | |
| FL4 | 2.89 | 4.56 | 12.09 | 0.42 | 0.38 | |
| FL5 | 3.87 | 3.68 | 9.09 | 0.82 | 0.33 | |
| FL6 | 3.23 | 3.50 | 8.24 | 0,23 | 0.70 | |
| FL7 | 3.47 | 18.35 | 8.57 | 4.25 | 1.65 | |
Disclaimer/Publisher’s Note: The statements, opinions and data contained in all publications are solely those of the individual author(s) and contributor(s) and not of MDPI and/or the editor(s). MDPI and/or the editor(s) disclaim responsibility for any injury to people or property resulting from any ideas, methods, instructions or products referred to in the content. |
© 2023 by the authors. Licensee MDPI, Basel, Switzerland. This article is an open access article distributed under the terms and conditions of the Creative Commons Attribution (CC BY) license (https://creativecommons.org/licenses/by/4.0/).
Share and Cite
Pedersen, O.B.; Pasalic, L.; Grove, E.L.; Kristensen, S.D.; Hvas, A.-M.; Nissen, P.H. Advanced Flow Cytometry Using the SYTO-13 Dye for the Assessment of Platelet Reactivity and Maturity in Whole Blood. Methods Protoc. 2023, 6, 8. https://doi.org/10.3390/mps6010008
Pedersen OB, Pasalic L, Grove EL, Kristensen SD, Hvas A-M, Nissen PH. Advanced Flow Cytometry Using the SYTO-13 Dye for the Assessment of Platelet Reactivity and Maturity in Whole Blood. Methods and Protocols. 2023; 6(1):8. https://doi.org/10.3390/mps6010008
Chicago/Turabian StylePedersen, Oliver Buchhave, Leonardo Pasalic, Erik Lerkevang Grove, Steen Dalby Kristensen, Anne-Mette Hvas, and Peter H. Nissen. 2023. "Advanced Flow Cytometry Using the SYTO-13 Dye for the Assessment of Platelet Reactivity and Maturity in Whole Blood" Methods and Protocols 6, no. 1: 8. https://doi.org/10.3390/mps6010008
APA StylePedersen, O. B., Pasalic, L., Grove, E. L., Kristensen, S. D., Hvas, A.-M., & Nissen, P. H. (2023). Advanced Flow Cytometry Using the SYTO-13 Dye for the Assessment of Platelet Reactivity and Maturity in Whole Blood. Methods and Protocols, 6(1), 8. https://doi.org/10.3390/mps6010008