
Quantitative Assessment of Histone H2B Monoubiquitination in Yeast Using Immunoblotting

 and
and
Abstract
:1. Introduction
2. Experimental Design
2.1. Materials
- Yeast extract (Fisher Scientific, Waltham, MA, USA; Cat. no.: DF0127-08-0)
- Bacto™ Peptone (Fisher, Waltham, MA, USA; Cat. no.: DF0118)
- Adenine hemisulfate salt (Sigma, St. Louis, MO, USA; Cat. no.: A9126)
- D-(+)-Glucose monohydrate (Sigma, St. Louis, MO, USA; Cat. no.: 49159)
- Bacto™ Dehydrated Agar (Fisher, Waltham, MA, USA Cat. no.: DF0140-01-0)
- YES50 (Sunrise Science, Knoxville, TN, USA; Cat. no.: 2009-1 kg)
- Trichloroacetic acid solution (TCA) (Sigma, St. Louis, MO, USA; Cat. no.: T0699-100 mL)
- Tris (Fischer, Cat. no.: BP152-500 g)
- 2-Mercaptoethanol (BME) (Sigma, St. Louis, MO, USA; Cat. no.: M3148-100 mL)
- Bovine Serum Albumin (BSA) (New England Biolabs, Ipswich, NY, USA; Cat. no.: B9000S)
- ProSignal® full range prestained protein ladder (10-250 kDa) (Genesee Scientific, San Diego, CA, USA; Cat. no.: 83-660)
- Tween-20 (Sigma, St. Louis, MO, USA; Cat. no.: P9416)
- 30% Acrylamide/Bis Solution (29:1) (Bio Rad, Hercules, CA, USA; Cat. no.: 1610156)
- N′-Tetramethylethylenediamine (TEMED) (Bio Rad, Hercules, CA, USA; Cat. no.: 161-0801)
- Ammonium Persulfate (APS) (Sigma, St. Louis, MO, USA; Cat. no.: 016-060-006)
- Glycine (Fischer, Waltham, MA, USA; Cat. no.: BP381-5 kg)
- Sodium Dodecyl Sulfate (SDS) (Sigma, St. Louis, MO, USA; Cat. no.: L3771)
- PVDF Membranes 0.45 μm, (VWR, Radnor, PA, USA; Cat. no.: 490007-440)
- Blotting Paper (VWR, Radnor, PA, USA; Cat. no.: 732-0591)
- Ponceau S (Fisher, Waltham, MA, USA; Cat. No BP103-10)
- Nestle Carnation Instant Nonfat Dry Milk (Nestle, Arlington, VA, USA)
- Ampac 500 Series Tubular Rollstock (Thomas Scientific, Swedesboro, NJ, USA; Cat. no.: TRS-95125-3)
- 2X Laemmli Sample Buffer (Bio Rad, Hercules, CA, USA; Cat. no.: 1610737)
- Anti-histone H2B (S. pombe) antibody (Gene Tex, Irvine, CA, USA; Cat. no.: GTX64122)
- Anti-histone H2B antibody (Active Motif, Carlsbad, CA, USA; Cat. no.: 39237)
- Anti-histone H3 antibody (Epicypher, Durham, NC, USA; Cat. no.: 13-0001)
- Anti-Ubiquityl-histone H2B (Lys120) antibody (D11) (Cell Signaling Technology, Danvers, MA, USA; Cat. no.: 5546)
- DC™ Protein Assay Kit I (Bio Rad, Hercules, CA, USA; Cat. no.: 5000111)
- ECL Plus Western Blotting Substrate (Thermo Fisher Scientific, Waltham, MA, USA; Cat. no.: 32312)
- Apollo Transparency Film (Office Depot, Boca Raton, FL, USA; Model: VPP201CE)
- Image J software (https://imagej.nih.gov/ij/) (accessed on 29 July 2022)
2.2. Equipment
- 32.
- 1.5-mL Screw-cap tubes (Genesee Scientific, San Diego, CA, USA; Cat. no.: 21-257)
- 33.
- 1.5-mL Microfuge tubes (Genesee Scientific, San Diego, CA, USA; Cat. no.: 14-125)
- 34.
- 1.5-mL Snap-cap tubes (Genesee Scientific, San Diego, CA, USA; Cat. no.: 14-214)
- 35.
- 16-mL Culture tubes (Genesee Scientific, San Diego, CA, USA; Cat. no.: 21-310)
- 36.
- 50-mL Centrifuge tubes (Genesee Scientific, San Diego, CA, USA; Cat. no.: 28-108)
- 37.
- Mini Bead Beater 96 (Biospec Products, Bartlesville, OK, USA; Cat. no.: 1001)
- 38.
- 0.7-mm Zirconia Beads (Biospec Products, Bartlesville, OK, USA; Cat. no.: 11079107zx)
- 39.
- 16-place Beaker Buddy™ (VWR, Radnor, PA, USA; Cat. no.: 100493-762)
- 40.
- Corning™ Hot Plate Stirrer (Fisher, Waltham, MA, USA; Cat. no.: 07-770-152)
- 41.
- 200-μL Round gel tips, 0.58 mm (Genesee Scientific, San Diego, CA, USA; Cat. no.: 14-100)
- 42.
- Eppendorf Centrifuge 5424 (Eppendorf, Hamburg, Germany; Cat. no.: 5424)
- 43.
- Allegra 6R Centrifuge (Beckman Coulter, Brea, CA, USA; Cat. no.: BE-A6R)
- 44.
- BD Precisionglide® Syringe Needles (18 gauge) (Sigma, St. Louis, MO, USA; Cat. no.: Z118044)
- 45.
- Ultrospec 2100 Pro UV/Vis Spectrophotomoter (Biochrom US, Holliston, MA, USA; Cat. no.: 80-2112-21)
- 46.
- Humboldt High Temperature Burner (Humboldt Mfg Co. Elgin, IL, USA; Cat. no.: H-5500)
- 47.
- Petri plates (Falcon, Corning, NY, USA, Cat. no.: 351-029)
- 48.
- Benchtop Electrophoresis Station (CBS Scientific, San Diego, CA, USA; Cat. no.: MGV-202-20)
- 49.
- Trans-Blot Cell (Bio Rad, Hercules, CA, USA; Cat. no.: 1703939)
- 50.
- PowerPac Basic (Bio Rad, Hercules, CA, USA; Cat. no.: 1645050)
- 51.
- ENDURO™ 300 V Power Supply (Labnet, Edison, NJ, USA; Cat. no.: E0303)
- 52.
- GyroMini™ Nutating Mixer (Labnet, Edison, NJ, USA; Cat. no.: S0500)
- 53.
- Laboratory Platform Rocker (Genesee Scientific, San Diego, CA, USA; Cat. no.: 33-208DXL)
- 54.
- X-ray Film Cassette (Thomas Scientific, Swedesboro, NJ, USA; Cat. no.: 1139A30)
- 55.
- Epson Perfection V39 Scanner (Epson, Los Alamitos, CA, USA; Model: B11B232201)
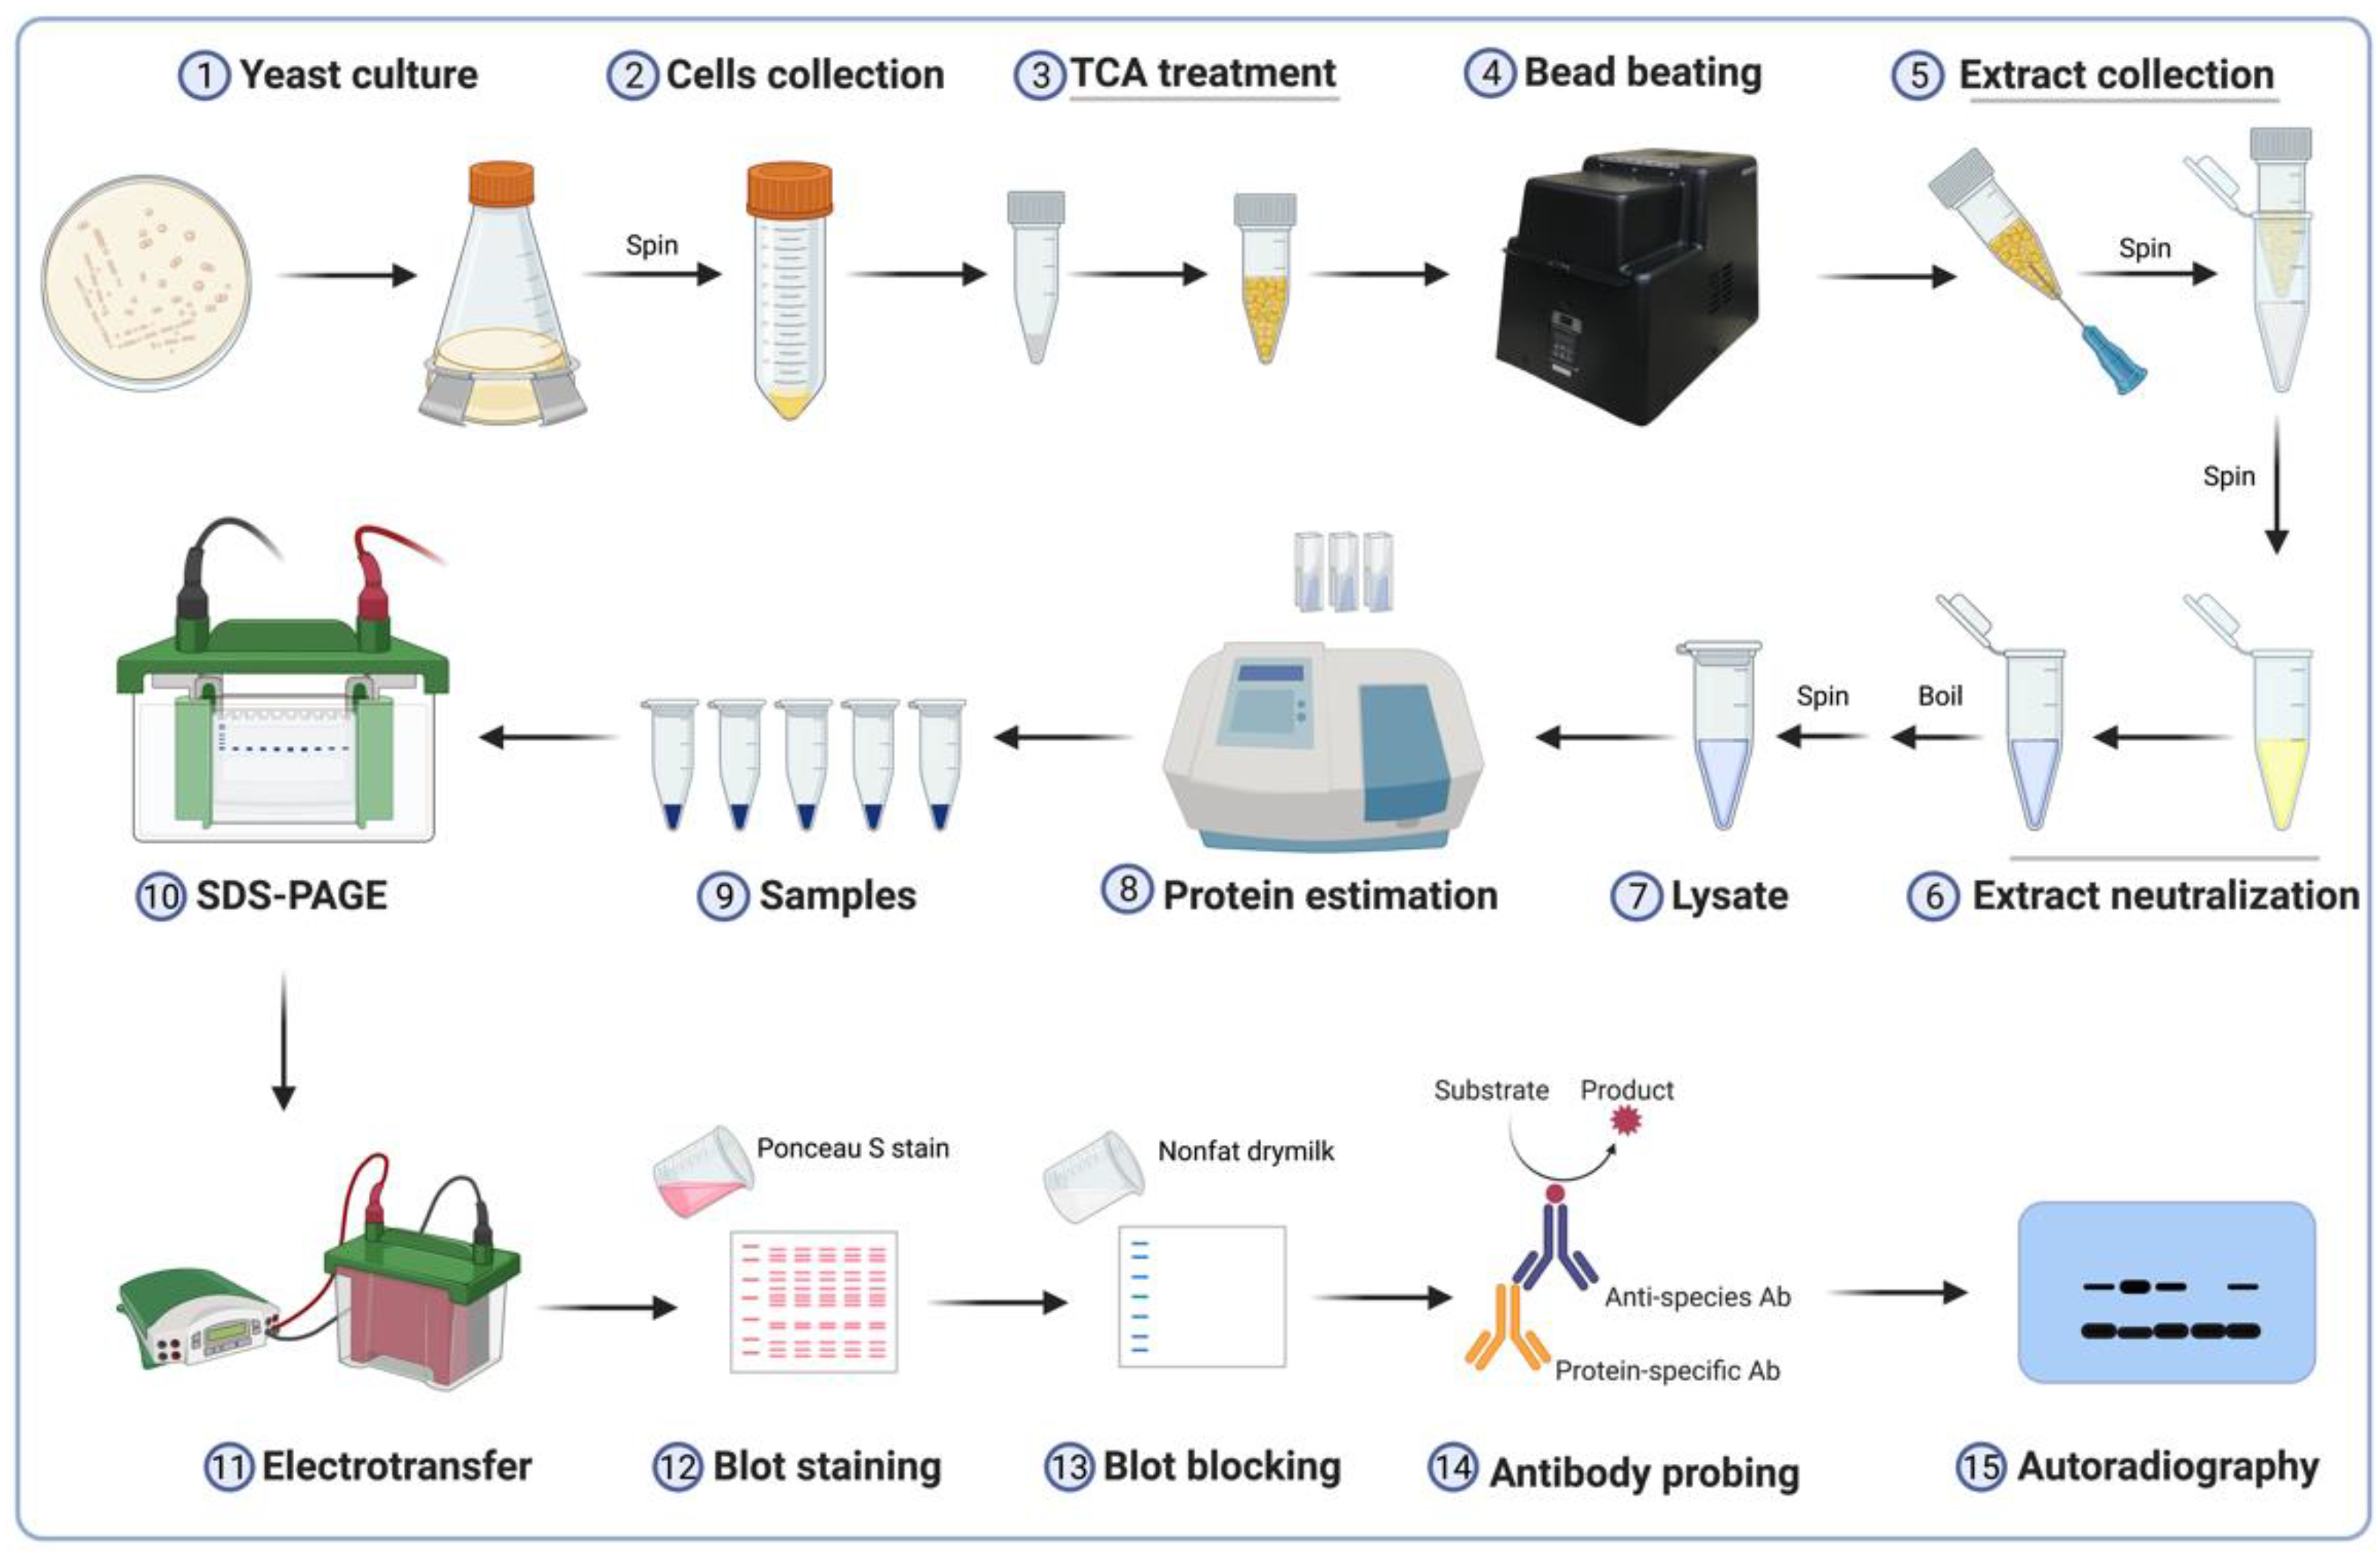
3. Procedure
3.1. Yeast Culture and Harvest of Cells
- (1) Streak yeast strains onto YPAD or YES50 solid media (see Section 5: Reagents setup) from glycerol stocks stored at −80 °C. Grow yeast in an incubator for 2–3 days at appropriate temperature.
- (2) Use aseptic conditions to inoculate 2–3 yeast colonies into 3–5 mL YPAD or YES50 liquid media in a 16-mL culture tube. Grow cultures at 30 °C or at a permissive temperature with vigorous agitation overnight.
- Technical notes: (a) In general, S. cerevisiae or S. pombe strains are grown at 30 °C. However, optimal growth for certain S. pombe strains including those used in this study, is between 25 °C to 29 °C or at 32 °C. Any conditional temperature-sensitive yeast mutant should be grown at a predetermined permissive or restrictive temperature depending on the experiment. (b) We have observed higher levels of H2Bub1 in yeast cells grown in rich media (YPAD or YES50) than in synthetic media. (c) To ensure effective aeration, place the culture tubes in a tube holder angled at ~45° in a shaker incubator or, alternatively, grow yeast cultures in baffled Erlenmeyer flasks.
- CRITICAL STEP In S. cerevisiae, the steady-state H2Bub1 levels are dependent on glucose levels [29,31]. Thus, to prevent caramelization of glucose, avoid prolonged exposure of yeast media or stock solutions with glucose to temperatures above 120 °C as used during autoclaving. Alternatively, yeast media with glucose should be prepared by addition of a filter-sterilized glucose stock solution to autoclaved media.
- (3) Determine absorbance at 600 nm (OD600) of the yeast cultures using a spectrophotometer. To ensure samples are in a linear range of detection, dilute the overnight cultures in growth media and mix well prior to spectrophotometry.
- CRITICAL STEP The levels of H2Bub1 are high in actively growing cultures and decrease in stationary phase [29]; therefore, cultures should not be overgrown. When analyzing H2Bub1 levels, harvest cells at OD600 0.8–1.0 (or at mid-log phase).
- (4) Inoculate yeast cultures at a starting OD600 of 0.2 in 50 mL media in a 250 mL baffled flask. Grow with agitation at 30 °C or at an appropriate temperature till cultures reach an OD600 between 0.8–1.0; this should take ~4 h.
- Technical notes: (a) Baffled flasks enable better growth by disrupting cell aggregation. (b) For effective aeration of yeast cultures, use a media volume that is equal to one-fourth the total indicated capacity of the flask.
- (5) Harvest cells by centrifugation (845× g) in a 50-mL centrifuge tubes for 3 min.
- Technical notes: A 50-mL culture grown to 1 OD600 yields ~1 × 10⁷ yeast cells. In general, 5-30 ODs of cells are sufficient for the TCA lysis protocol described below with 12–20 ODs being ideal for effective lysis. Using >30 ODs results in poor lysis during bead beating and therefore low protein yields.
- (6) Discard the spent media after centrifugation. Resuspend the pellet (5–30 ODs) in 1 mL sterile water to transfer the cells into a labeled 1.5-mL screwcap tube. Centrifuge at 845× g for 3 min to pellet cells. Discard water by pipetting or by using vacuum suction.
- (7) Resuspend cells in 0.5 mL 5% TCA. Vortex. Centrifuge at 845× g for 3 min. Discard the TCA solution and store the cell pellet at −80 °C.
- Technical note: The cell pellet obtained washing with water will be straw colored, it will be white after washing with 5% TCA.
- PAUSE STEP The cell pellets can be stored indefinitely at –80 °C.
3.2. Lysate Preparation
- (1) Add 0.5 mL 20% TCA to the frozen cell pellet. Thaw and resuspend the cells in the TCA solution by vigorous vortexing.
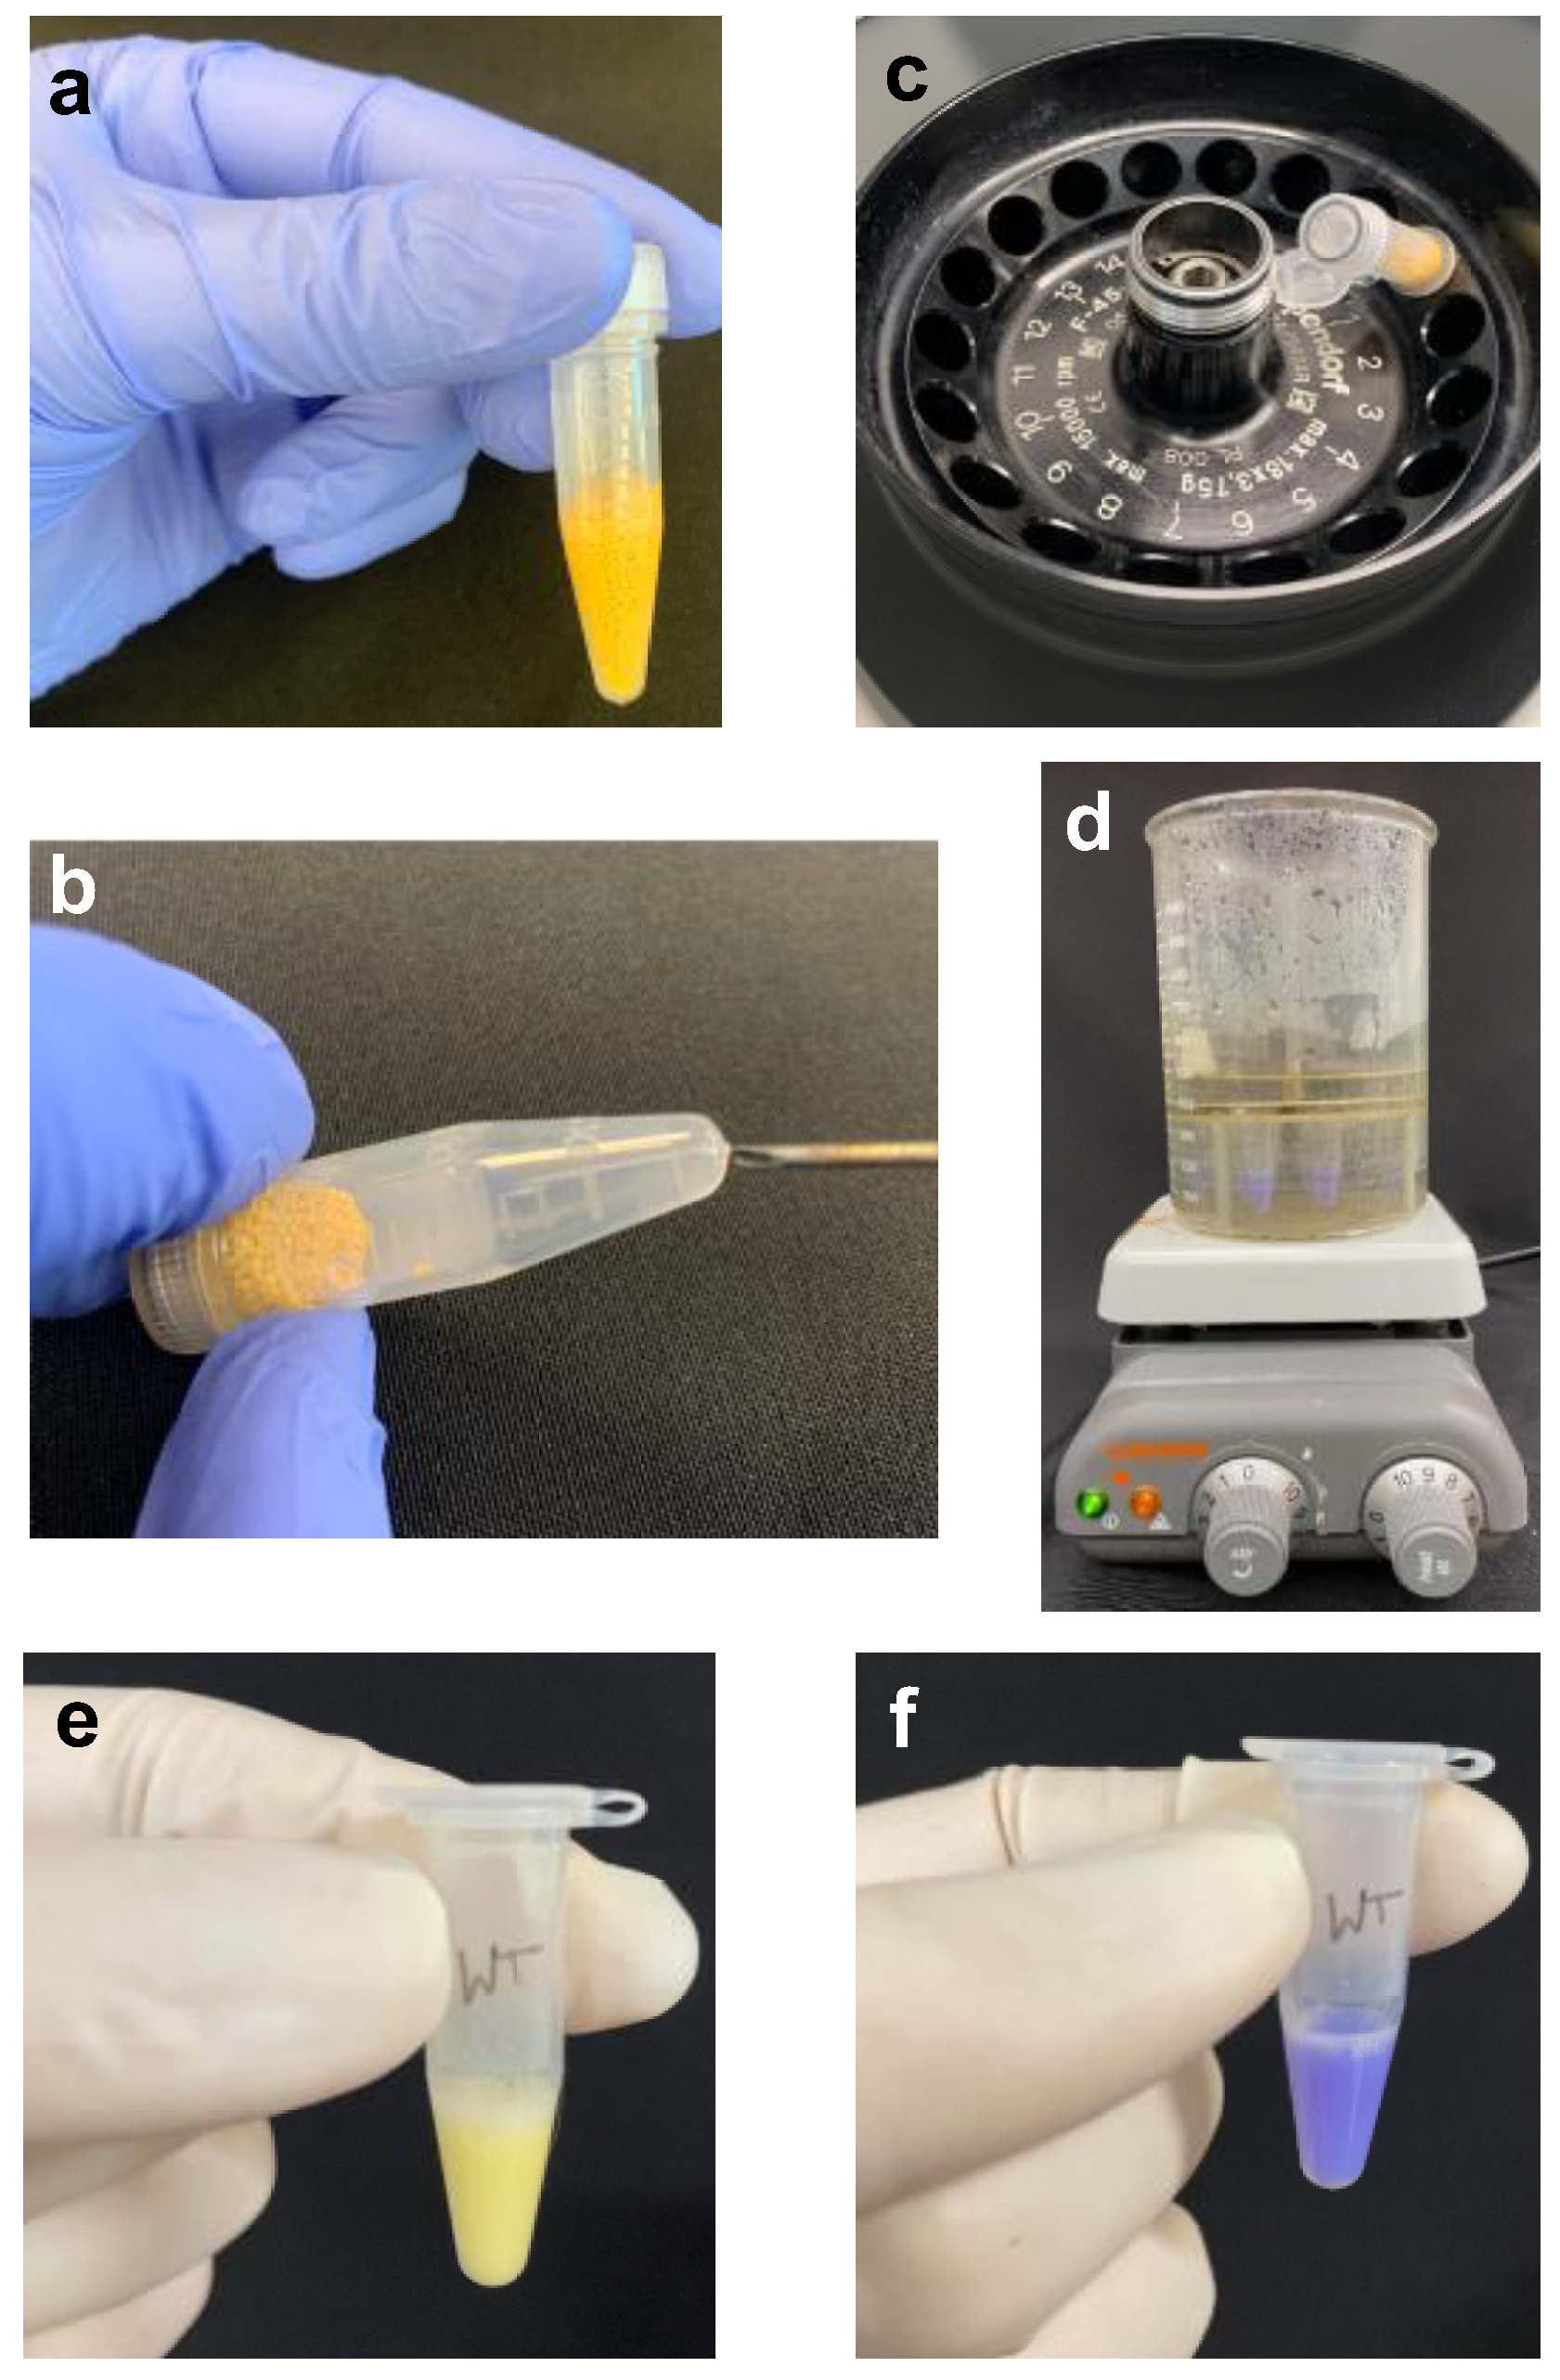
- (2) Add zirconia beads to the 0.5 mL mark of a screwcap tube containing cells resuspended in TCA (Figure 2a). Secure the cap well and place the tube in a Mini-Beadbeater-96. Agitate to bead-beat the cells for a duration of 30 s three times with a short cooling period (5–10 s) between each agitation.

- CRITICAL STEPS(a) Do not add more zirconia beads than recommended, as an excess will impede effective cell lysis. (b) Place the tubes in the bead-beater such that the tube-restrainer lid can be evenly secured using the wing nut screws. Skewed or imbalanced placement of tubes in the bead-beater can lead to loosening of the screws and dislodging of the lid during the vigorous shaking or bead-beating step that can potentially damage the equipment or the sample tubes.
- (3) Heat the end of an 18-gauge needle using a Bunsen burner and insert it into the bottom of the screwcap tube (Figure 2b).
- CAUTION Take care not to impale your fingers with the heated needle.
- (4) Place the punctured tube in a labeled 1.5-mL microfuge tube; the latter will serve as the collection tube. Centrifuge briefly (5–10 s) to collect the sample (Figure 2c).
- CAUTION To avoid breaking the sample tube, confirm that sufficient clearance exists between the screwcap-collection tube and the centrifuge lid (Figure 2c).
- (5) Discard the screw-cap tube containing beads. Centrifuge the lysate in the collection tube at 845× g for 5 min.
- (6) Add 300 mL water to a 500-mL glass beaker; bring to boiling.
- Technical note: This preparative step enables quick processing of samples in step 10.
- (7) Discard the supernatant. Wash the pellet gently with 0.5 mL 5% TCA. Centrifuge briefly and discard residual TCA solution.
- CRITICAL STEP Completely remove all TCA solution, as it will interfere with effective neutralization of the lysate in step 9.
- (8) Add 0.3 mL 1X SDS lysis buffer (without reducing agent) to the pellet and resuspend it thoroughly by pipetting and vortexing.
- Technical note: The bromophenol blue dye in the SDS lysis buffer will turn yellow upon addition to the acidic sample (Figure 2d).
- (9) Neutralize the lysate by addition of 5–10 μL of the 2 M Tris base at a time and vortexing. Continue to add base until the sample turns blue (Figure 2e).
- Technical note: Approximately 20–50 μL 2M Tris base will be needed to neutralize 300 μL of the acidic lysate.
- (10) Securely fasten the tubes in a tube holder and place in the boiling water bath (step 6) for 8 min.
- Technical note: The water level in the beaker should be below the tube caps to prevent seepage and dilution of samples (Figure 2f).
- CAUTION Exercise care to avoid scalding or burns when handling the heated hot plate and the boiling water bath.
- (11) Centrifuge the lysate at 16,363× g for 10 min at room temperature.
- (12) Transfer the supernatant to a 1.5-mL microfuge tube.
- PAUSE STEP Samples can be stored indefinitely at −80 °C.
3.3. Estimation of Protein Concentration
- (1) As samples are prepared using a buffer containing SDS, protein estimation should be performed using the detergent-compatible Bio-Rad Dc assay. Add 5 μL of sample to 20 μL water in a 1.5-mL microfuge tubes. Mix well by pipetting and transfer 5 μL of the diluted sample to 20 μL water in another 1.5-mL microfuge tube.
- Technical note: If using samples stored at −80 °C (Section 3.2, step 10), thaw samples in a boiling water bath or heat block set >95 °C, then vortex well and centrifuge at 16,363× g at room temperature for 5 min to remove any insoluble particulates or precipitates. Transfer the lysate to a fresh labeled tube before proceeding to protein estimation.
- (2) To prepare a reference or protein standard for spectrophotometry, add 10 μL of 20 mg/mL BSA stock to 90 μL water to obtain a 1 μg/μL working solution. Label 6 tubes as follows: 0, 0, 5, 10, 15 and 25. Add 25 μL water to the tubes labeled ‘0′; this will serve as a blank and as a ‘no BSA’ control. To the tubes labeled 5, 10, 15 and 25, add 5 μL 1 μg/μL BSA and 20 μL water, 10 μL 1 μg/μL BSA and 15 μL water, 15 μL 1 μg/μL BSA and 10 μL water, and 25 μL 1 μg/μL BSA, respectively.
- (3) Prepare the Dc assay reagent mix as follows: Add 20 μL of reagent S to 1 mL of reagent A to obtain reagent SA. Add 125 μL reagent SA to 25 μL sample and to each BSA standard and then add 1 mL of reagent B to each sample and standard. Mix well and incubate at room temperature for 15 min. Transfer the reaction mix into a cuvette and determine absorbance at 750 nm using a spectrophotometer.
- (4) Transfer the recorded absorbance values to a Microsoft Excel spreadsheet. Compute the protein concentration of the samples and amounts of sample to be used in gel electrophoresis as shown in Figure 3.
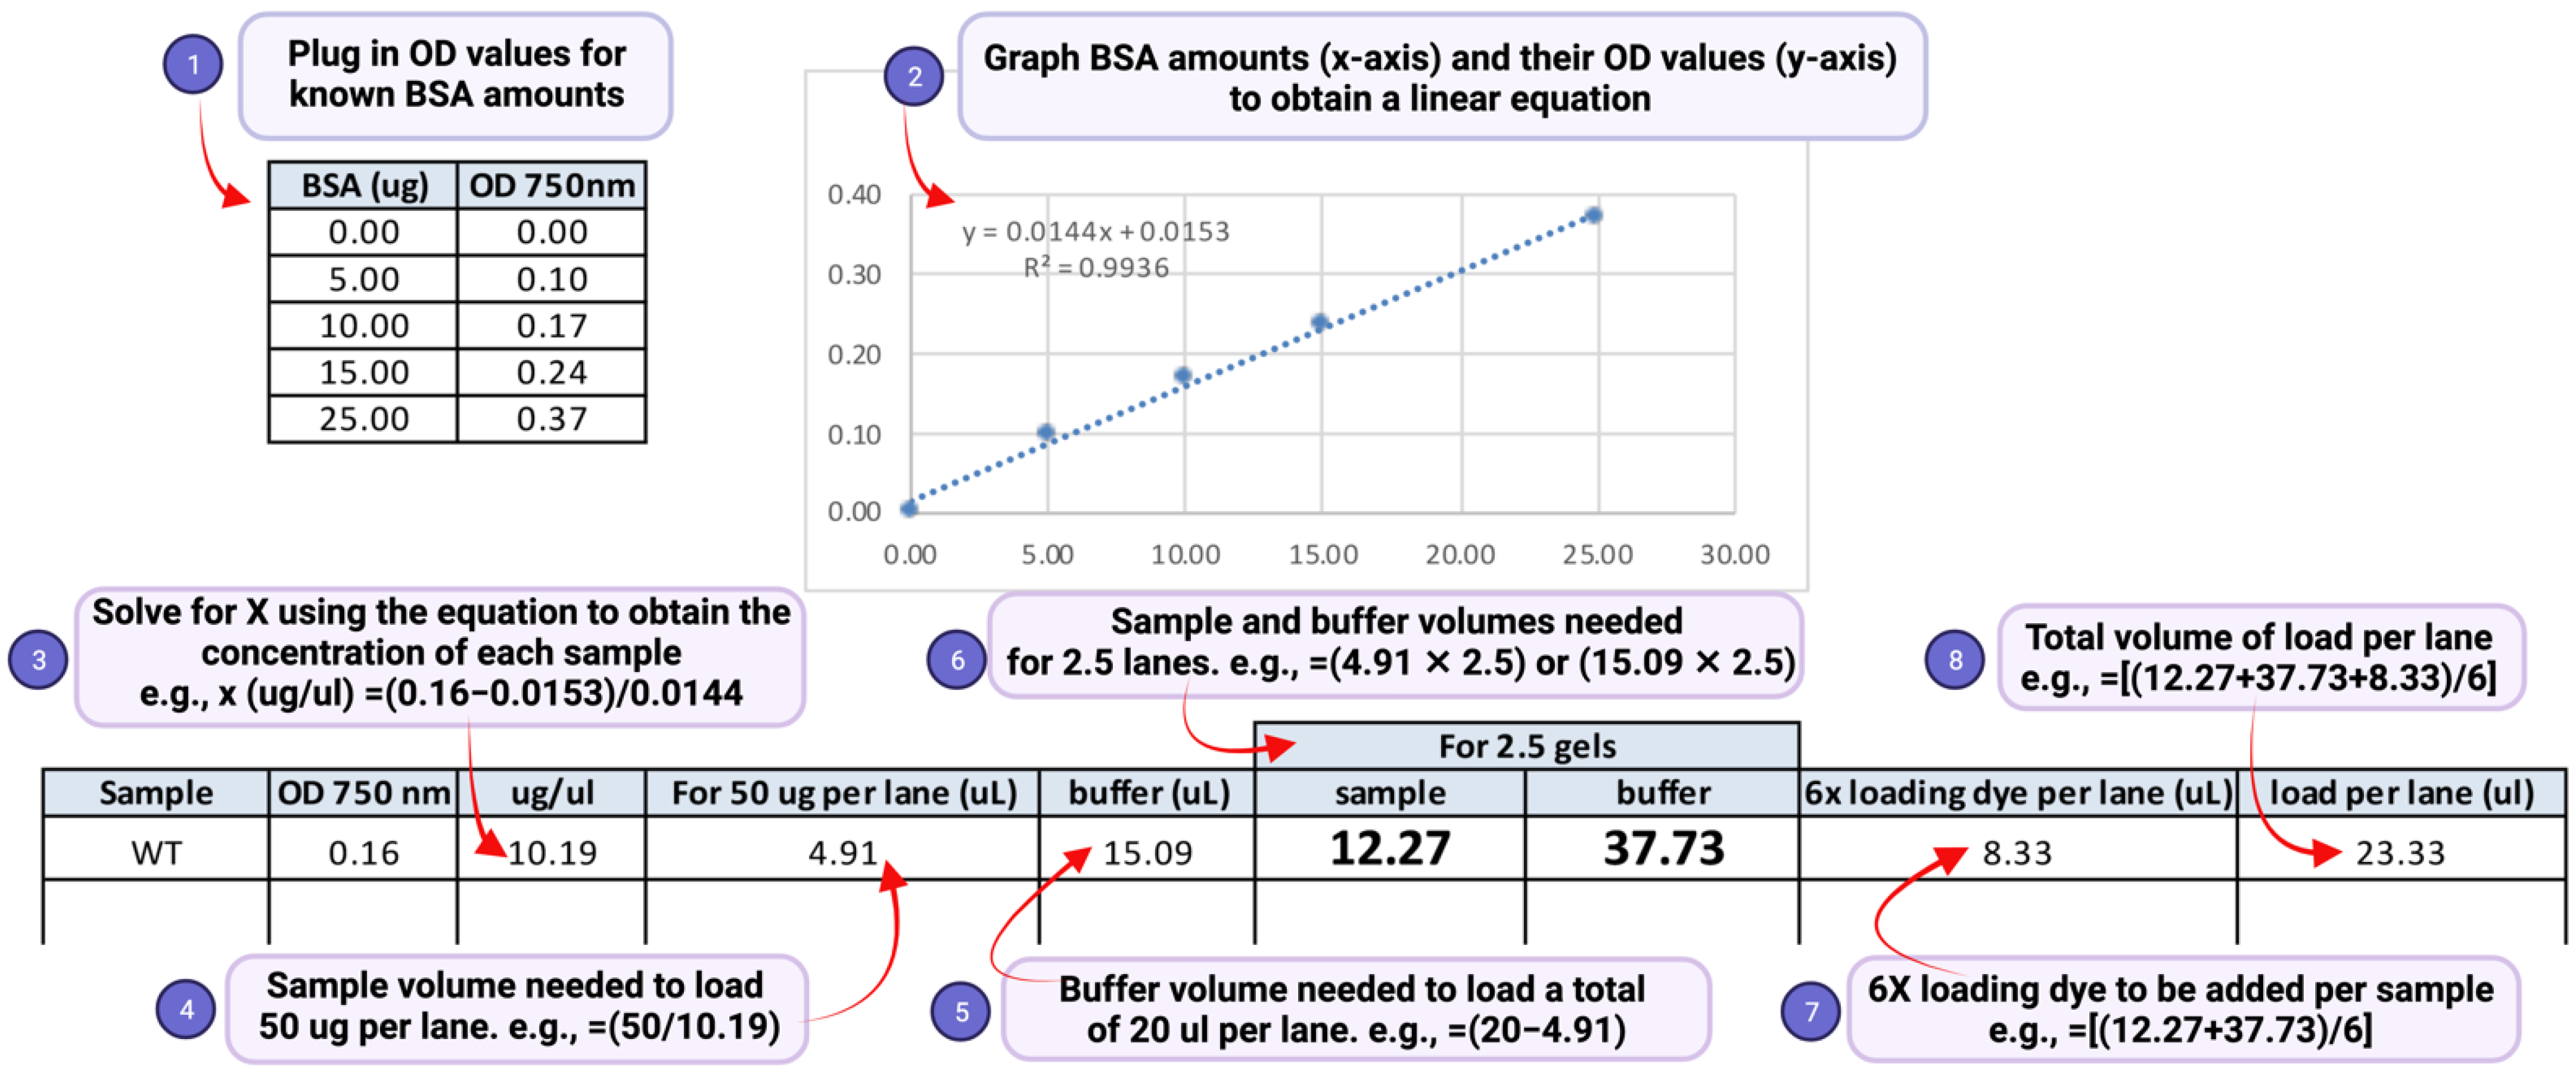
- Technical notes:(a) An aliquot of 50 μg of the total denatured lysate is in general sufficient for detection of H2Bub1. (b) A two-fold serially diluted gradient of protein amounts (e.g., 50 μg, 25 μg, and 12.5 μg) should be used to ensure that the signal is in the linear range of detection. (c) Load the same volume for all samples in each gel lane by diluting to an equal volume with SDS lysis buffer (Figure 3, step 5). This will ensure that the samples migrate uniformly in the gel, and the bands for H2Bub1 or H2B are not stretched or compressed after immunoblotting, (d) Prepare two separate sets or aliquots of the samples. The second set can be used in case a repeat run is needed due to poor transfer of proteins onto the blot or due to other problems during electrophoresis or immunoblotting. (e) To account for possible sample loss during the boiling or pipetting steps, prepare more than will be needed. For example, as shown in Figure 3 step 6, if a sample is to be loaded in two gel lanes, prepare enough for loading 2.5 lanes. (f) In the event that samples must reanalyzed, thaw the frozen lysate quickly in a heat block set at >95 °C. Vortex and spin to remove any precipitates. Measure the protein concentration again using the DC assay and recalculate concentration and volumes needed for preparation of samples for electrophoresis.
3.4. Electrophoretic Separation of Proteins
- (1) Set up the gel casting/running unit by assembling the cleaned gel plates along with spacers. Pipet in the gel solution containing 15% acrylamide: bis-acrylamide and SDS. Expedite polymerization by applying isopropanol or ethanol on top of the gel mix to limit exposure to air. After polymerization, discard isopropanol or ethanol, wash it away with water, remove any residual water with a blotting paper. Add the mixture for the stacking gel and insert the comb.
- (2) After polymerization, remove the spacer or gasket, if any, at the bottom of the gel plates. Fix the gel onto an electrophoresis apparatus with clips. Fill the top and bottom tanks of the rig with the SDS running buffer. Remove the comb and flush the wells with the running buffer using an 18-gauge needle fixed to a syringe to remove any gel debris. Use a syringe with a bent needle to flush the bottom of the gel to remove any trapped air bubbles.
- (3) Mix SDS loading buffer and sample in amount calculated as describe above (Figure 3, step 7). Mix well and boil for 8 min.
- (4) Briefly centrifuge to return any condensate to solution and load equal volumes of the denatured samples into individual wells. Load a lane with the protein ladder.
- Technical notes: To ensure that samples run evenly in the gel, and that the bands are not ‘squeezed’ or ‘smiling’ after electrophoresis, the volumes of all samples, including the protein ladder, should be the same. Fill any empty lanes with ‘mock’ samples, which are made up of the lysis buffer and the SDS sample buffer in the same volume as the samples.
- (5) Electrophorese at 75 V until the dye front enters the separating gel, then increase to 130–140 V and run for 3–4 h until the 10-kDa size marker reaches the bottom of the gel.
3.5. Immunoblot for H2Bub1
- (1) Cut four blotting papers and a PVDF membrane to fit the dimensions of the gel. Wet and activate the PVDF membrane in methanol and then place it in transfer buffer.
- CRITICAL STEP It is important to cut the blotting papers and the PVDF membrane to exactly fit the dimensions of the gel in order to prevent trapping of any air bubbles, which can block the transfer of proteins from the gel onto the membrane.
- (2) Disassemble the gel apparatus and remove the gel from the glass plates. Remove the wells and/or the stacking gel and equilibrate the gel in transfer buffer.
- (3) In the gel holder cassette, place one fiber pad or sponge prewetted with transfer buffer, two pre-cut, pre-wetted blotting papers, the equilibrated gel, the activated PVDF membrane, the final two additional pre-cut, pre-wetted blotting papers, and the second fiber pad.
- Technical note: Remove any trapped air bubbles using a gel roller or by gently rolling over the gel-blotting paper sandwich with a plastic pipette.
- (4) Close the cassette taking care not to cause any shifts in the gel-blotting paper sandwich. Secure the cassette. Place the cassette in the transfer module. Fill the module with cold Towbin transfer buffer (see Section 5). Add a stir bar to maintain even buffer and ion distribution in the tank.
- (5) Put the lid on the transfer module ensuring that the plugs are in contact with the correct electrodes. Connect the cables to a power supply and run at constant current (150 mA) for 6 h.
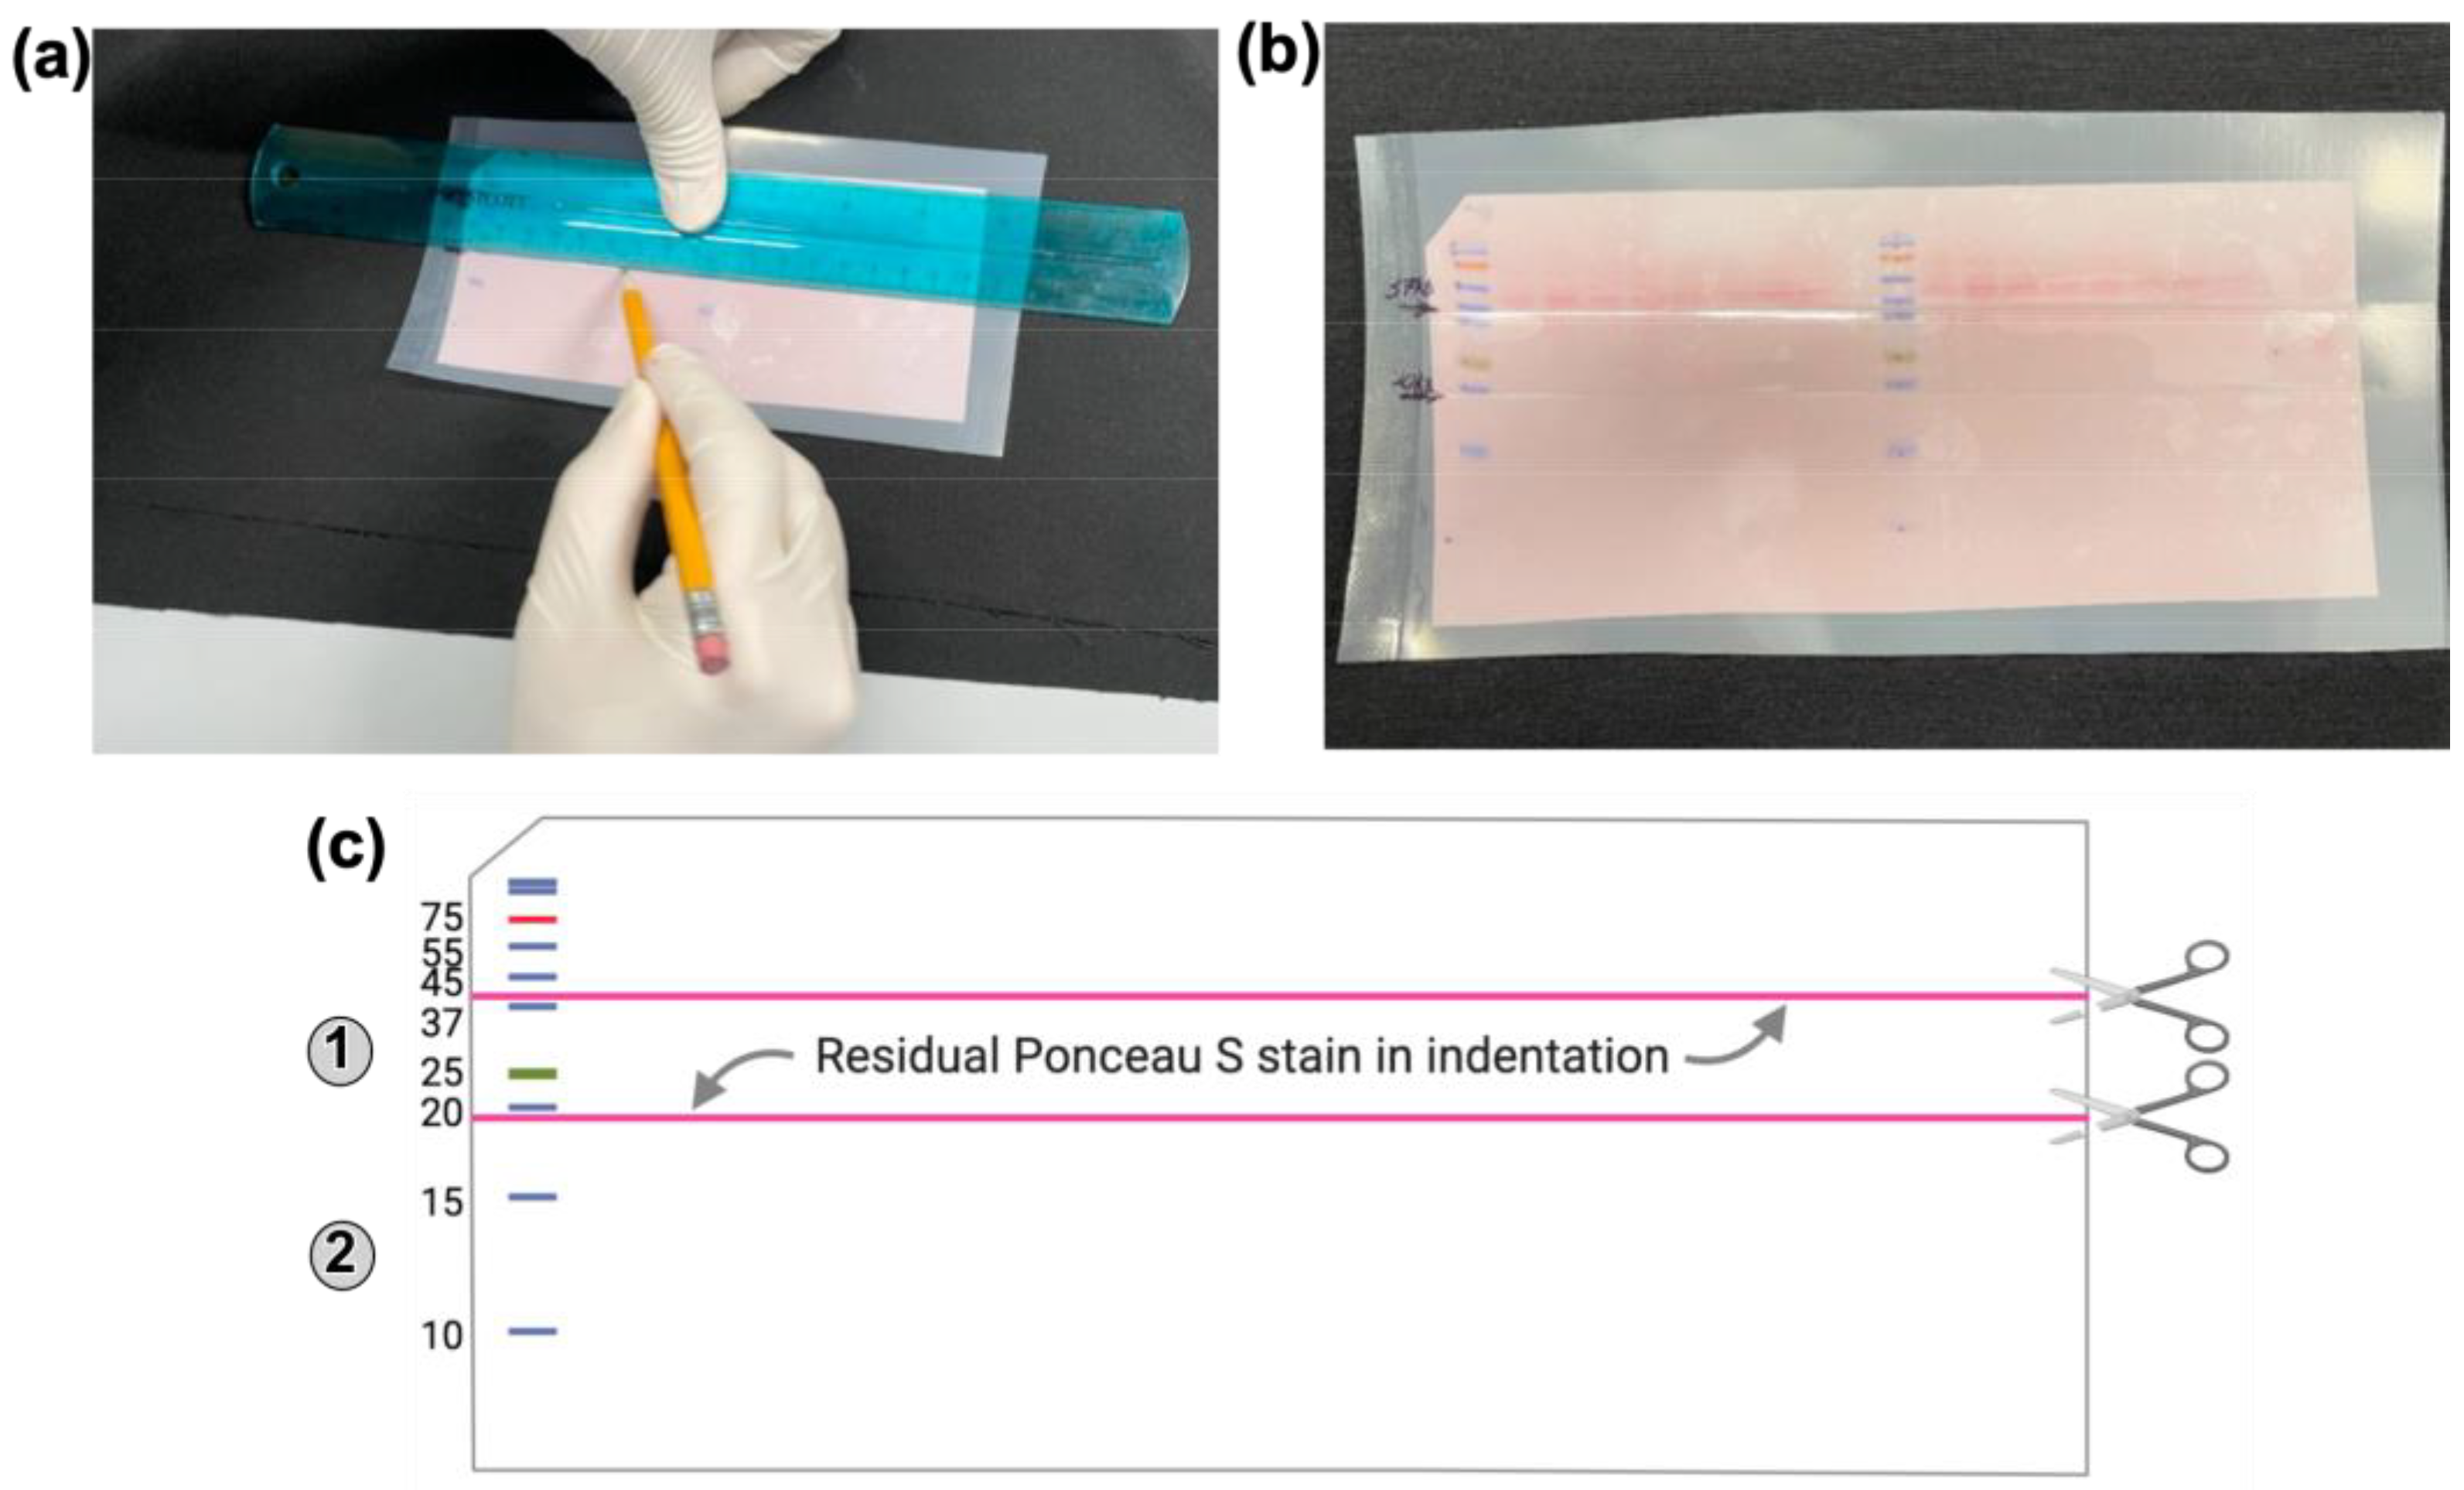
- (6) Post transfer, disassemble the gel- blotting paper-fiber pad sandwich. While the membrane with transferred proteins is still wet and on the blotting papers, mark each protein molecular weight marker by placing a dot on the membrane with a lab marker. Clip the left corner of the blot to indicate the protein-containing surface and the loading order of the samples (Figure 4). Label the membrane below the clipped notch with the name of the primary antibody to be used. Then, place the blot in a tray using forceps. Add Ponceau S stain to cover the membrane and stain by rocking in a shaker for 5 min.

- (7) Carefully pour the Ponceau S stain back into its storage container. Pour distilled water into a corner of the tray and then rock the tray back and forth to destain the blot evenly. Avoid pouring water directly onto the membrane. Discard water and wash once with water.
- Technical notes: (a) Use forceps to handle the membrane. (b) Protein bands should be visible upon Ponceau S staining and can be used to determine the electro-transfer efficiency (Figure 4a,b).
- (8) With the stained proteins still visible, use forceps to place the membrane into a plastic bag and seal two sides using a heat sealer. Use a ruler and a pencil to mark the locations to be cut before probing with a primary antibody (Figure 4a,b).
- Technical note: The Ponceau S stain that remains after washing with water will settle into the indentation made by the pencil marking and this will indicate where the membrane should be cut into sections before probing with primary antibodies (Figure 4c).
- (9) Add 10–15 mL of 5% non-fat dry milk (NFDM) prepared in 1X phosphate buffered saline (PBS) to block the membrane to be probed with anti-histone H2B antibody. Use 5% non-fat dry milk prepared in 1XPBS containing 0.05% Tween-20 (PBST) as the blocking agent for all other antibodies. Seal the bag with a heat sealer. Place on a nutating mixer and agitate for 1 h at room temperature.
- (10) During the blocking step, prepare primary antibody in 2.5% or 5% non-fat dry milk in 1X PBST. Antibody dilutions used for experiments described here are listed in Table 1.

| Antibody | Dilution |
|---|---|
| Anti-Ubiquityl-histone H2B (Lys120) antibody (D11) | 1:1000 |
| Anti-histone H2B antibody (Active Motif) | 1:1000 (for 20–35 kDa section) |
| Anti-histone H2B antibody (Active Motif) | 1:10,000 (for 10–20 kDa section) |
| Anti-histone H2B antibody (Active Motif) | 1:1000 (for whole blot) |
| Anti-histone H2B antibody (GeneTex) | 1:1000 (for 20–35 kDa section) |
| Anti-histone H2B antibody (GeneTex) | 1:5000 (for 10–20 kDa section) |
| Anti-histone H3 antibody | 1:5000 |
- (11) Remove the membrane and cut along the marks made in step 8 (Figure 4c). Place each portion in separate plastic bag. Seal the bag on two sides.
- (12) Add the primary antibody containing solution and seal the bag. Place on a nutating mixer and agitate at room temperature for 1 h.
- Technical note: Add the primary antibody dilution for different sections of the membrane as indicated in Table 1.
- (13) Place each membrane in a tray. Add 1X PBST and agitate for 15 min at room temperature in an orbital shaker. Repeat the wash step with fresh 1X PBST.
- (14) Prepare secondary antibody in 2.5% non-fat dry milk in 1X PBST.
- (15) Place each portion of the membrane in a separate bag and seal two ends of each bag. Add the secondary antibody containing solution, seal, and agitate at room temperature for 1 h on a nutating mixer.
- (16) Wash the membranes twice in 1X PBST as described in step 13.
- (17) During last 5 min of the second washing step, prepare the ECL solution. For every 1 mL of Solution A, add 25 μL Solution B. Mix well and place in dark. Set up a clean glass plate. Place paper towels adjacent to two sides of the glass plate.
- (18) After washing, take the blot with a forceps and remove excess wash buffer by dabbing on a paper towel. Place the blot on the glass plate with the protein containing surface facing upwards.
- CRITICAL STEP Do not let the PVDF membrane dry out.
- (19) Add ECL solution dropwise to cover the blot completely. Incubate at room temperature for 5 min. During the last 2 min of incubation, flip the membrane with the protein surface facing downwards to ensure even contact with the ECL solution.
- Technical Notes: Perform incubation of the blot and the ECL substrate on an even surface, such as, a glass plate. It is easy to add and evenly distribute the ECL substrate solution when the blot is moist.
- (20) During incubation, fold a transparency printer film/sheet and cut it to a size slightly larger than the autoradiography film. Tape the two cut pieces of the sheet together along one side.
- (21) Lift the membrane with forceps and remove excess ECL solution by draining it onto a paper towel. Place the blot between the two pieces of sheet protector. Place this sandwich in a film cassette.
- (22) Expose the blot to an X-ray film in a dark room for different time periods. Develop the films. Perform an overnight or long exposure to visualize the entire blot. Align the film with the membrane and mark locations of the different protein size markers on the film.
- Caution: (a) Use a chemical resistant and smudge-proof lab marker on the PVDF membrane. (b) Label and store the membranes safely to be used in subsequent analyses (Section 3.6).
3.6. Quantitation of H2Bub1
- (1) To account for any discrepancies in the sample amount applied in each gel lane, the signal intensity obtained for any band in the immunoblot must be normalized to the levels of Ponceau S-stained protein bands in the same membrane. To restain the blot with Ponceau S, wet the dry blot initially in transfer buffer and then wash twice with 1X PBST. Add Ponceau S stain to cover the blot and stain by rocking for 5 min at room temperature in a tabletop orbital or rotatory shaker. Pour the stain back in its storage container and then wash the blot evenly with water until protein bands appear to be uniformly stained. Dry the blot in a hood on paper towel then place it with the protein side facing downwards on a flatbed scanner.
- Technical Note: As the blots are blocked with non-fat dry milk, the background Ponceau S stain on the blot will be higher that obtained after the initial staining performed in Section 3.5.
- (2) Choose a developed X-ray film that by visual inspection appears to have signal intensities in a linear range of detection.
- Technical Note: The linear range of detection is a region where the band intensity on a developed X-ray film is proportional to the amount of target protein in the membrane. Therefore, an X-ray film that shows a gradual decrease in signals commensurate with the serial dilution of extract can be tentatively deemed as being in the linear range of detection and chosen for scanning and quantitation by densitometry. For this initial assessment of signal intensity, it is important to place the developed X-ray film on a piece of white paper to simulate the final scanned image to be used in densitometry.
- (3) Scan in gray scale and save the developed X-ray film and the Ponceau S-stained dry blot.
- (4) If the scanned image is in .jpg or .png format, open it in Adobe Photoshop and invert the image, so that the bands appear white, and the background appears black. Save the file in .tif format.
- (5) Open the .tif file in the Image J software. Select the protein band of interest using the *Rectangle* option. Go to ‘Analyze ‘dropdown menu and use the ‘Measure’ (Cmd M) option to obtain the signal intensity value (Mean). Signal intensities of other protein band(s) are then determined by moving the same rectangle area marker sequentially to select and measure each band. Finally, move the area marker to a section of the image without any band to obtain the ‘background’ signal intensity.
- Critical step: Use a rectangle of the same size to quantify the bands for a given protein in different lanes to ensure that the area measured remains the same.
- (6) Transfer values into an Excel spreadsheet. Subtract the value for the ‘background’ signal from those obtained for the bands of interest. Divide the values obtained for each protein band in the X-ray film with the value obtained for the protein bands in the corresponding lane in the Ponceau S-stained blot. Use these normalized values for plotting graphs using Microsoft Excel or GraphPad Prism.
4. Expected Results
5. Reagents Setup
5.1. Preparation of Media and Solutions
- 56.
- To grow S. cerevisiae strains, prepare YPAD medium by dissolving 10 g yeast extract, 20 g bacto-peptone, 40 mg adenine hemisulfate in 950 mL water. Sterilize media by autoclaving at 121 °C for 20 min. Add 50 mL sterile 40% dextrose/glucose solution to the autoclaved YPA media after cooling to room temperature. To grow S. pombe strains, dissolve 35.25 g YES50 powder in 1 L water and sterilize by autoclaving. To prepare solid media, add agar (2%) to liquid media, sterilize by autoclaving, and cool before pouring into Petri plates.
- 57.
- For washing and lysing yeast cells, prepare 5% and 20% trichloroacetic acid (TCA), respectively, by diluting 6.1 N TCA (or 100% stock solution) in sterile water immediately before use. You will need to prepare 1 mL 5% TCA and 0.5 mL 20% TCA for processing each sample. Calculate the total volume of these working solutions needed based on the number of samples or strains in each experiment.
- 58.
- Prepare 1X SDS lysis buffer by diluting the 2X Laemmli sample buffer (Bio-Rad) in sterile water. Do not add reducing agents (β-mercaptoethanol or DTT) to the SDS lysis buffer, as they will interfere with the DC protein assay. To neutralize the acidic extracts, prepare 2 M Tris base by dissolving 12.114 g Tris in 50 mL of water and sterilize by filtration.
- 59.
- To reconstitute the stock SDS loading buffer, combine 950 μL 2X Laemmli sample buffer (Bio Rad) with 50 μL β-mercaptoethanol. Dilute the reconstituted 2X dye 1:1 with sample. To prepare 6X SDS loading dye, combine 300 mM Tris.HCl, pH 7.5, 12%SDS, 60% glycerol and 0.12% bromophenol blue in water. Heat to liquefy and combine 100 μL 6X SDS loading dye with 6 μL β-mercaptoethanol. Mix this with the sample at 1:6 ratio. For electrophoresis, prepare 10X SDS running buffer by dissolving 15.1 g Tris base, 72 g glycine, and 5 g SDS in 1 L water.
- 60.
- For reversible staining of the blots, mix 0.4 g Ponceau S dye, 8 mL TCA, and 2 mL acetic acid in 100 mL water.
- 61.
- For probing and washing blots, first prepare 10X PBS by dissolving 17.8 g Na2HPO4. 2H2O, 2.4 g KH2PO4, 80 g NaCl and 2 g KCl in water, and sterilize by autoclaving. Then, prepare 1 L 1X PBST solution by diluting 100 mL 10X PBS and 5 mL 10% Tween-20 in water. Dissolve 0.5 g non-fat dry milk in 10 mL 1X PBST to prepare 5% blocking solution for the blots. Dilute equal parts of 5% milk stock in 1X PBST to obtain 2.5% milk solution to prepare primary or secondary antibodies solutions. To prepare Towbin transfer buffer, dissolve 57.5 g glycine and 12 g Tris base in water, add 800 mL methanol and 4 mL 10% SDS, and bring to 4 L with water.
5.2. Generation of S. cerevisiae Strains
Supplementary Materials
Author Contributions
Funding
Institutional Review Board Statement
Informed Consent Statement
Data Availability Statement
Acknowledgments
Conflicts of Interest
References
- Strahl, B.D.; Allis, C.D. The language of covalent histone modifications. Nature 2000, 403, 41–45. [Google Scholar] [CrossRef] [PubMed]
- Kim, J.J.; Lee, S.Y.; Miller, K.M. Preserving genome integrity and function: The DNA damage response and histone modifications. Crit. Rev. Biochem. Mol. Biol. 2019, 54, 208–241. [Google Scholar] [CrossRef]
- Stewart-Morgan, K.R.; Petryk, N.; Groth, A. Chromatin replication and epigenetic cell memory. Nat. Cell Biol. 2020, 22, 361–371. [Google Scholar] [CrossRef]
- Vaughan, R.M.; Kupai, A.; Rothbart, S.B. Chromatin Regulation through Ubiquitin and Ubiquitin-like Histone Modifications. Trends Biochem. Sci. 2021, 46, 258–269. [Google Scholar] [CrossRef]
- Mattiroli, F.; Penengo, L. Histone Ubiquitination: An Integrative Signaling Platform in Genome Stability. Trends Genet. 2021, 37, 566–581. [Google Scholar] [CrossRef]
- Goldknopf, I.L.; Busch, H. Isopeptide linkage between nonhistone and histone 2A polypeptides of chromosomal conjugate-protein A24. Proc. Natl. Acad. Sci. USA 1977, 74, 864–868. [Google Scholar] [CrossRef]
- Hunt, L.T.; Dayhoff, M.O. Amino-terminal sequence identity of ubiquitin and the nonhistone component of nuclear protein A24. Biochem. Biophys. Res. Commun. 1977, 74, 650–655. [Google Scholar] [CrossRef]
- Zhou, W.; Wang, X.; Rosenfeld, M.G. Histone H2A ubiquitination in transcriptional regulation and DNA damage repair. Int. J. Biochem. Cell Biol. 2009, 41, 12–15. [Google Scholar] [CrossRef] [PubMed]
- Cao, J.; Yan, Q. Histone ubiquitination and deubiquitination in transcription, DNA damage response, and cancer. Front. Oncol. 2012, 2, 26. [Google Scholar] [CrossRef]
- Zhang, Y. Transcriptional regulation by histone ubiquitination and deubiquitination. Genes Dev. 2003, 17, 2733–2740. [Google Scholar] [CrossRef] [PubMed] [Green Version]
- Chandrasekharan, M.B.; Huang, F.; Sun, Z.W. Ubiquitination of histone H2B regulates chromatin dynamics by enhancing nucleosome stability. Proc. Natl. Acad. Sci. USA 2009, 106, 16686–16691. [Google Scholar] [CrossRef] [PubMed]
- Barbour, H.; Daou, S.; Hendzel, M.; Affar, E.B. Polycomb group-mediated histone H2A monoubiquitination in epigenome regulation and nuclear processes. Nat. Commun. 2020, 11, 5947. [Google Scholar] [CrossRef]
- Meas, R.; Mao, P. Histone ubiquitylation and its roles in transcription and DNA damage response. DNA Repair 2015, 36, 36–42. [Google Scholar] [CrossRef] [PubMed]
- Cole, A.J.; Clifton-Bligh, R.; Marsh, D.J. Histone H2B monoubiquitination: Roles to play in human malignancy. Endocr. Relat. Cancer 2015, 22, T19–T33. [Google Scholar] [CrossRef] [PubMed]
- Tamburri, S.; Conway, E.; Pasini, D. Polycomb-dependent histone H2A ubiquitination links developmental disorders with cancer. Trends Genet. 2022, 38, 333–352. [Google Scholar] [CrossRef] [PubMed]
- Robzyk, K.; Recht, J.; Osley, M.A. Rad6-dependent ubiquitination of histone H2B in yeast. Science 2000, 287, 501–504. [Google Scholar] [CrossRef]
- Wood, A.; Krogan, N.J.; Dover, J.; Schneider, J.; Heidt, J.; Boateng, M.A.; Dean, K.; Golshani, A.; Zhang, Y.; Greenblatt, J.F.; et al. Bre1, an E3 ubiquitin ligase required for recruitment and substrate selection of Rad6 at a promoter. Mol. Cell 2003, 11, 267–274. [Google Scholar] [CrossRef]
- Hwang, W.W.; Venkatasubrahmanyam, S.; Ianculescu, A.G.; Tong, A.; Boone, C.; Madhani, H.D. A conserved RING finger protein required for histone H2B monoubiquitination and cell size control. Mol. Cell 2003, 11, 261–266. [Google Scholar] [CrossRef]
- Zofall, M.; Grewal, S.I. HULC, a histone H2B ubiquitinating complex, modulates heterochromatin independent of histone methylation in fission yeast. J. Biol. Chem. 2007, 282, 14065–14072. [Google Scholar] [CrossRef] [PubMed]
- Tanny, J.C.; Erdjument-Bromage, H.; Tempst, P.; Allis, C.D. Ubiquitylation of histone H2B controls RNA polymerase II transcription elongation independently of histone H3 methylation. Genes Dev. 2007, 21, 835–847. [Google Scholar] [CrossRef] [PubMed] [Green Version]
- Kim, J.; Guermah, M.; McGinty, R.K.; Lee, J.S.; Tang, Z.; Milne, T.A.; Shilatifard, A.; Muir, T.W.; Roeder, R.G. RAD6-Mediated transcription-coupled H2B ubiquitylation directly stimulates H3K4 methylation in human cells. Cell 2009, 137, 459–471. [Google Scholar] [CrossRef] [PubMed]
- Zhu, B.; Zheng, Y.; Pham, A.D.; Mandal, S.S.; Erdjument-Bromage, H.; Tempst, P.; Reinberg, D. Monoubiquitination of human histone H2B: The factors involved and their roles in HOX gene regulation. Mol. Cell 2005, 20, 601–611. [Google Scholar] [CrossRef] [PubMed]
- Zhang, F.; Yu, X. WAC, a functional partner of RNF20/40, regulates histone H2B ubiquitination and gene transcription. Mol. Cell 2011, 41, 384–397. [Google Scholar] [CrossRef] [PubMed]
- Kouranti, I.; McLean, J.R.; Feoktistova, A.; Liang, P.; Johnson, A.E.; Roberts-Galbraith, R.H.; Gould, K.L. A global census of fission yeast deubiquitinating enzyme localization and interaction networks reveals distinct compartmentalization profiles and overlapping functions in endocytosis and polarity. PLoS Biol. 2010, 8, e1000471. [Google Scholar] [CrossRef] [PubMed]
- Daniel, J.A.; Torok, M.S.; Sun, Z.W.; Schieltz, D.; Allis, C.D.; Yates, J.R., 3rd; Grant, P.A. Deubiquitination of histone H2B by a yeast acetyltransferase complex regulates transcription. J. Biol. Chem. 2004, 279, 1867–1871. [Google Scholar] [CrossRef]
- Henry, K.W.; Wyce, A.; Lo, W.S.; Duggan, L.J.; Emre, N.C.; Kao, C.F.; Pillus, L.; Shilatifard, A.; Osley, M.A.; Berger, S.L. Transcriptional activation via sequential histone H2B ubiquitylation and deubiquitylation, mediated by SAGA-associated Ubp8. Genes Dev. 2003, 17, 2648–2663. [Google Scholar] [CrossRef]
- Gardner, R.G.; Nelson, Z.W.; Gottschling, D.E. Ubp10/Dot4p regulates the persistence of ubiquitinated histone H2B: Distinct roles in telomeric silencing and general chromatin. Mol. Cell Biol. 2005, 25, 6123–6139. [Google Scholar] [CrossRef]
- Jeusset, L.M.; McManus, K.J. Characterizing and exploiting the many roles of aberrant H2B monoubiquitination in cancer pathogenesis. Semin. Cancer Biol. 2021, in press. [Google Scholar] [CrossRef]
- Dong, L.; Xu, C.W. Carbohydrates induce mono-ubiquitination of H2B in yeast. J. Biol. Chem. 2004, 279, 1577–1580. [Google Scholar] [CrossRef]
- Chandrasekharan, M.B.; Huang, F.; Chen, Y.C.; Sun, Z.W. Histone H2B C-terminal helix mediates trans-histone H3K4 methylation independent of H2B ubiquitination. Mol. Cell Biol. 2010, 30, 3216–3232. [Google Scholar] [CrossRef] [Green Version]
- Chandrasekharan, M.B.; Huang, F.; Sun, Z.W. Decoding the trans-histone crosstalk: Methods to analyze H2B ubiquitination, H3 methylation and their regulatory factors. Methods 2011, 54, 304–314. [Google Scholar] [CrossRef] [PubMed]
- Sun, Z.W.; Allis, C.D. Ubiquitination of histone H2B regulates H3 methylation and gene silencing in yeast. Nature 2002, 418, 104–108. [Google Scholar] [CrossRef] [PubMed]
- Cucinotta, C.E.; Young, A.N.; Klucevsek, K.M.; Arndt, K.M. The Nucleosome Acidic Patch Regulates the H2B K123 Monoubiquitylation Cascade and Transcription Elongation in Saccharomyces cerevisiae. PLoS Genet. 2015, 11, e1005420. [Google Scholar] [CrossRef] [PubMed]
- Wozniak, G.G.; Strahl, B.D. Catalysis-dependent stabilization of Bre1 fine-tunes histone H2B ubiquitylation to regulate gene transcription. Genes Dev. 2014, 28, 1647–1652. [Google Scholar] [CrossRef]
- Zhang, X.; Kolaczkowska, A.; Devaux, F.; Panwar, S.L.; Hallstrom, T.C.; Jacq, C.; Moye-Rowley, W.S. Transcriptional regulation by Lge1p requires a function independent of its role in histone H2B ubiquitination. J. Biol. Chem. 2005, 280, 2759–2770. [Google Scholar] [CrossRef]
- Goldstein, A.L.; McCusker, J.H. Three new dominant drug resistance cassettes for gene disruption in Saccharomyces cerevisiae. Yeast 1999, 15, 1541–1553. [Google Scholar] [CrossRef]
- Elmore, Z.C.; Beckley, J.R.; Chen, J.S.; Gould, K.L. Histone H2B ubiquitination promotes the function of the anaphase-promoting complex/cyclosome in Schizosaccharomyces pombe. G3 Genes Genomes Genet. 2014, 4, 1529–1538. [Google Scholar] [CrossRef] [Green Version]


Publisher’s Note: MDPI stays neutral with regard to jurisdictional claims in published maps and institutional affiliations. |
© 2022 by the authors. Licensee MDPI, Basel, Switzerland. This article is an open access article distributed under the terms and conditions of the Creative Commons Attribution (CC BY) license (https://creativecommons.org/licenses/by/4.0/).
Share and Cite
Leng, A.M.; Radmall, K.S.; Shukla, P.K.; Chandrasekharan, M.B. Quantitative Assessment of Histone H2B Monoubiquitination in Yeast Using Immunoblotting. Methods Protoc. 2022, 5, 74. https://doi.org/10.3390/mps5050074
Leng AM, Radmall KS, Shukla PK, Chandrasekharan MB. Quantitative Assessment of Histone H2B Monoubiquitination in Yeast Using Immunoblotting. Methods and Protocols. 2022; 5(5):74. https://doi.org/10.3390/mps5050074
Chicago/Turabian StyleLeng, Andrew M., Kaitlin S. Radmall, Prakash K. Shukla, and Mahesh B. Chandrasekharan. 2022. "Quantitative Assessment of Histone H2B Monoubiquitination in Yeast Using Immunoblotting" Methods and Protocols 5, no. 5: 74. https://doi.org/10.3390/mps5050074
APA StyleLeng, A. M., Radmall, K. S., Shukla, P. K., & Chandrasekharan, M. B. (2022). Quantitative Assessment of Histone H2B Monoubiquitination in Yeast Using Immunoblotting. Methods and Protocols, 5(5), 74. https://doi.org/10.3390/mps5050074