Fibrin Clot Formation and Lysis in Plasma


Abstract
1. Introduction
2. Materials
2.1. Patient Preparation
 PAUSE STEP After preparation, PPP can be stored at −80 °C for 12 months.
2.2. Reagents
- Human recombinant TF (Dade® Innovin®, Siemens Healthcare, Diagnostics Aps, Ballerup, Denmark. Ref.no.: B4212-40)
- Human recombinant tPA, lyophilized, 100 µg (Calbiochem®, Sigma-Aldrich, Merck, Darmstadt, Germany. Cat. no.: 612200)
- Phospholipids 500 µM (Rossix, Mölndal, Sweden. Ref.no.: PL604T)
- HEPES buffer, 20 mM, NaCl 150 mM, pH 7.4 (Ampliqon, Odense, Denmark)
- HEPES, 20 mM, NaCl 150 mM, CaCl2 200 mM, pH 7.4 (Ampliqon, Odense, Denmark)
- Bovine serum albumin (BSA), lyophilized (>98%) (Sigma-Aldrich, Merck, Darmstadt, Germany. Cat. no.: A70-30-100a)
- Controls: Pooled normal plasma (PrecisionBiologic, CryocheckTM, Haemochrom Diagnostica, Frederiksberg, Denmark. Cat.no.: CCN-10)
- Demineralized water (resistivity 18.2 MΩ × cm at 25 °C) to dissolve TF and tPA and flush dispensers
- 10 µL HEPES buffer (see Section 3.1)
- 10 µL phospholipid 60 µM solution (see Section 6.5), Target final concentration in well = 4 µM
- 20 µL TF B 1:665 solution (see Section 6.5), Target final dilution in well = 1:5000
- 70 µL PPP (see Section 2.1)
- 20 µL tPA 870 ng/mL solution (see Section 6.5), Target final concentration in well = 116 ng/mL
- 20 µL HEPES-Ca (see Section 3.1), Target Ca2+ concentration in well = 26.7 mM
- Total volume in well = 150 µL
2.3. Equipment
- 96-well plate (Nunc ImmunoPlate, Thermo Fisher Scientific, Roskilde, Denmark. Cat. no.: 442404)
- 5 mL and 10 mL tubes for preparation of reagents
- Victor Reader X4 (Perkin Elmer, Waltham, MA, USA)
- Two automatic 1-channel dispensers (PerkinElmer, Waltham, MA, USA)
- Software: 2030 WorkOut and WorkOut 2.5 (Perkin Elmer, Waltham, MA, USA)
3. Procedure
3.1. Reconstitution of Reagents and Preparation of Buffers
- Reconstitute TF in 4 mL distilled water, aliquot, and store at −80 °C until use.
- Reconstitute tPA in 1 mL distilled water. Mix gently, aliquot, and store at −80 °C until use.
- Prepare 1% w/v BSA in HEPES, aliquot in 4 mL portions, and store at −20 °C until use.
PAUSE STEP Reconstituted TF, tPA, and HEPES with BSA can be stored for several months. See Section 6.4.3.2. Preparation of Victor Protocol
3.3. Preparation for Analysis (30 min)
- Turn on Victor reader and computer. Open software “PerkinElmer”. Start heating to 37 °C. Start WorkOut; choose the appropriate protocol name.
- Make a note of plate layout with ID numbers; plasma samples in duplicate. Controls should be positioned at B1, B2, G11, and G12.
- Collect plasma samples, controls, and TF in −80 °C freezer.
- Collect HEPES-BSA1% from freezer, thaw in a water bath at 37 °C for 1 min, and then thaw in a 5 °C cooler.
- Collect HEPES and HEPES-Ca from the cooler.
 CRITICAL STEP Buffers should reach room temperature before reagent solutions are mixed with plasma.
- 6.
- Thaw plasma samples and controls in a water bath at 37 °C for 5 min.
- 7.
- Prepare plasma samples and controls:
- Remove samples and controls from a water bath and refer to a dry tray.
- Mix samples and controls by gently inverting them five times.
- Spin samples and controls in a micro-centrifuge at 15,000 g for 3 min.
- 8.
- Label seven 5 mL tubes: “PL”, “TF A”, “TF”, “PLTFH”, “tPA A”, “tPA”, “HEPES-Ca” and one 10 mL tube: “HEPES”.
- 9.
- Add relevant buffers to tubes:
- “HEPES”: 7 mL HEPES
- “HEPES-Ca”: 4 mL HEPES-Ca
- Remaining tubes: as detailed in Section 6.5.
- 10.
- Prepare a 60 µM phospholipid solution (tube: “PL”). See Section 6.5.
- 11.
- Prepare a 1:665 TF dilution (tubes: “TF A” and “TF”). See Section 6.5.
- 12.
- Prepare a mix of TF 1:665, phospholipids 60 µM, and HEPES (tube: PLTFH). See Section 6.5.
- 13.
- Prepare plate:
- Add 40 µL “PLTFH” to each well on plate.
- Add 70 µL of plasma sample or control to each well according to plate layout.
- Place plate in reader.
- 14.
- Prepare tPA 870 ng/mL solution (tubes: “tPA A”, “tPA”) as detailed in Section 6.5.
CRITICAL STEP Keep tPA at −80 °C until immediately before use, thaw at room temperature for 5 min. Do not vortex; shake gently.- 15.
- Prepare dispensers:
- Flush dispensers with distilled water.
- Flush dispensers with air.
- Flush dispenser 1 with tPA 870 ng/mL solution.
- Flush dispenser 2 with HEPES-Ca.
3.4. Analysis (80 min)
- On the computer screen, press “Start measurements”:
- Dispenser 1 will now add 20 µL tPA to each well.
- Dispenser 2 will subsequently add 20 µL HEPES-Ca to each well. This activates coagulation.
- The plate will be shaken for 10 s.
- Reading will begin.
- Reading (absorbance at 405 nm, 1 read/min for 80 min). See Section 6.6.
CRITICAL STEP After use, clean/flush both dispensers with a pipette and then flush both dispensers five times with distilled water to avoid clotting of the system.3.5. Data Export
3.6. Results Validation
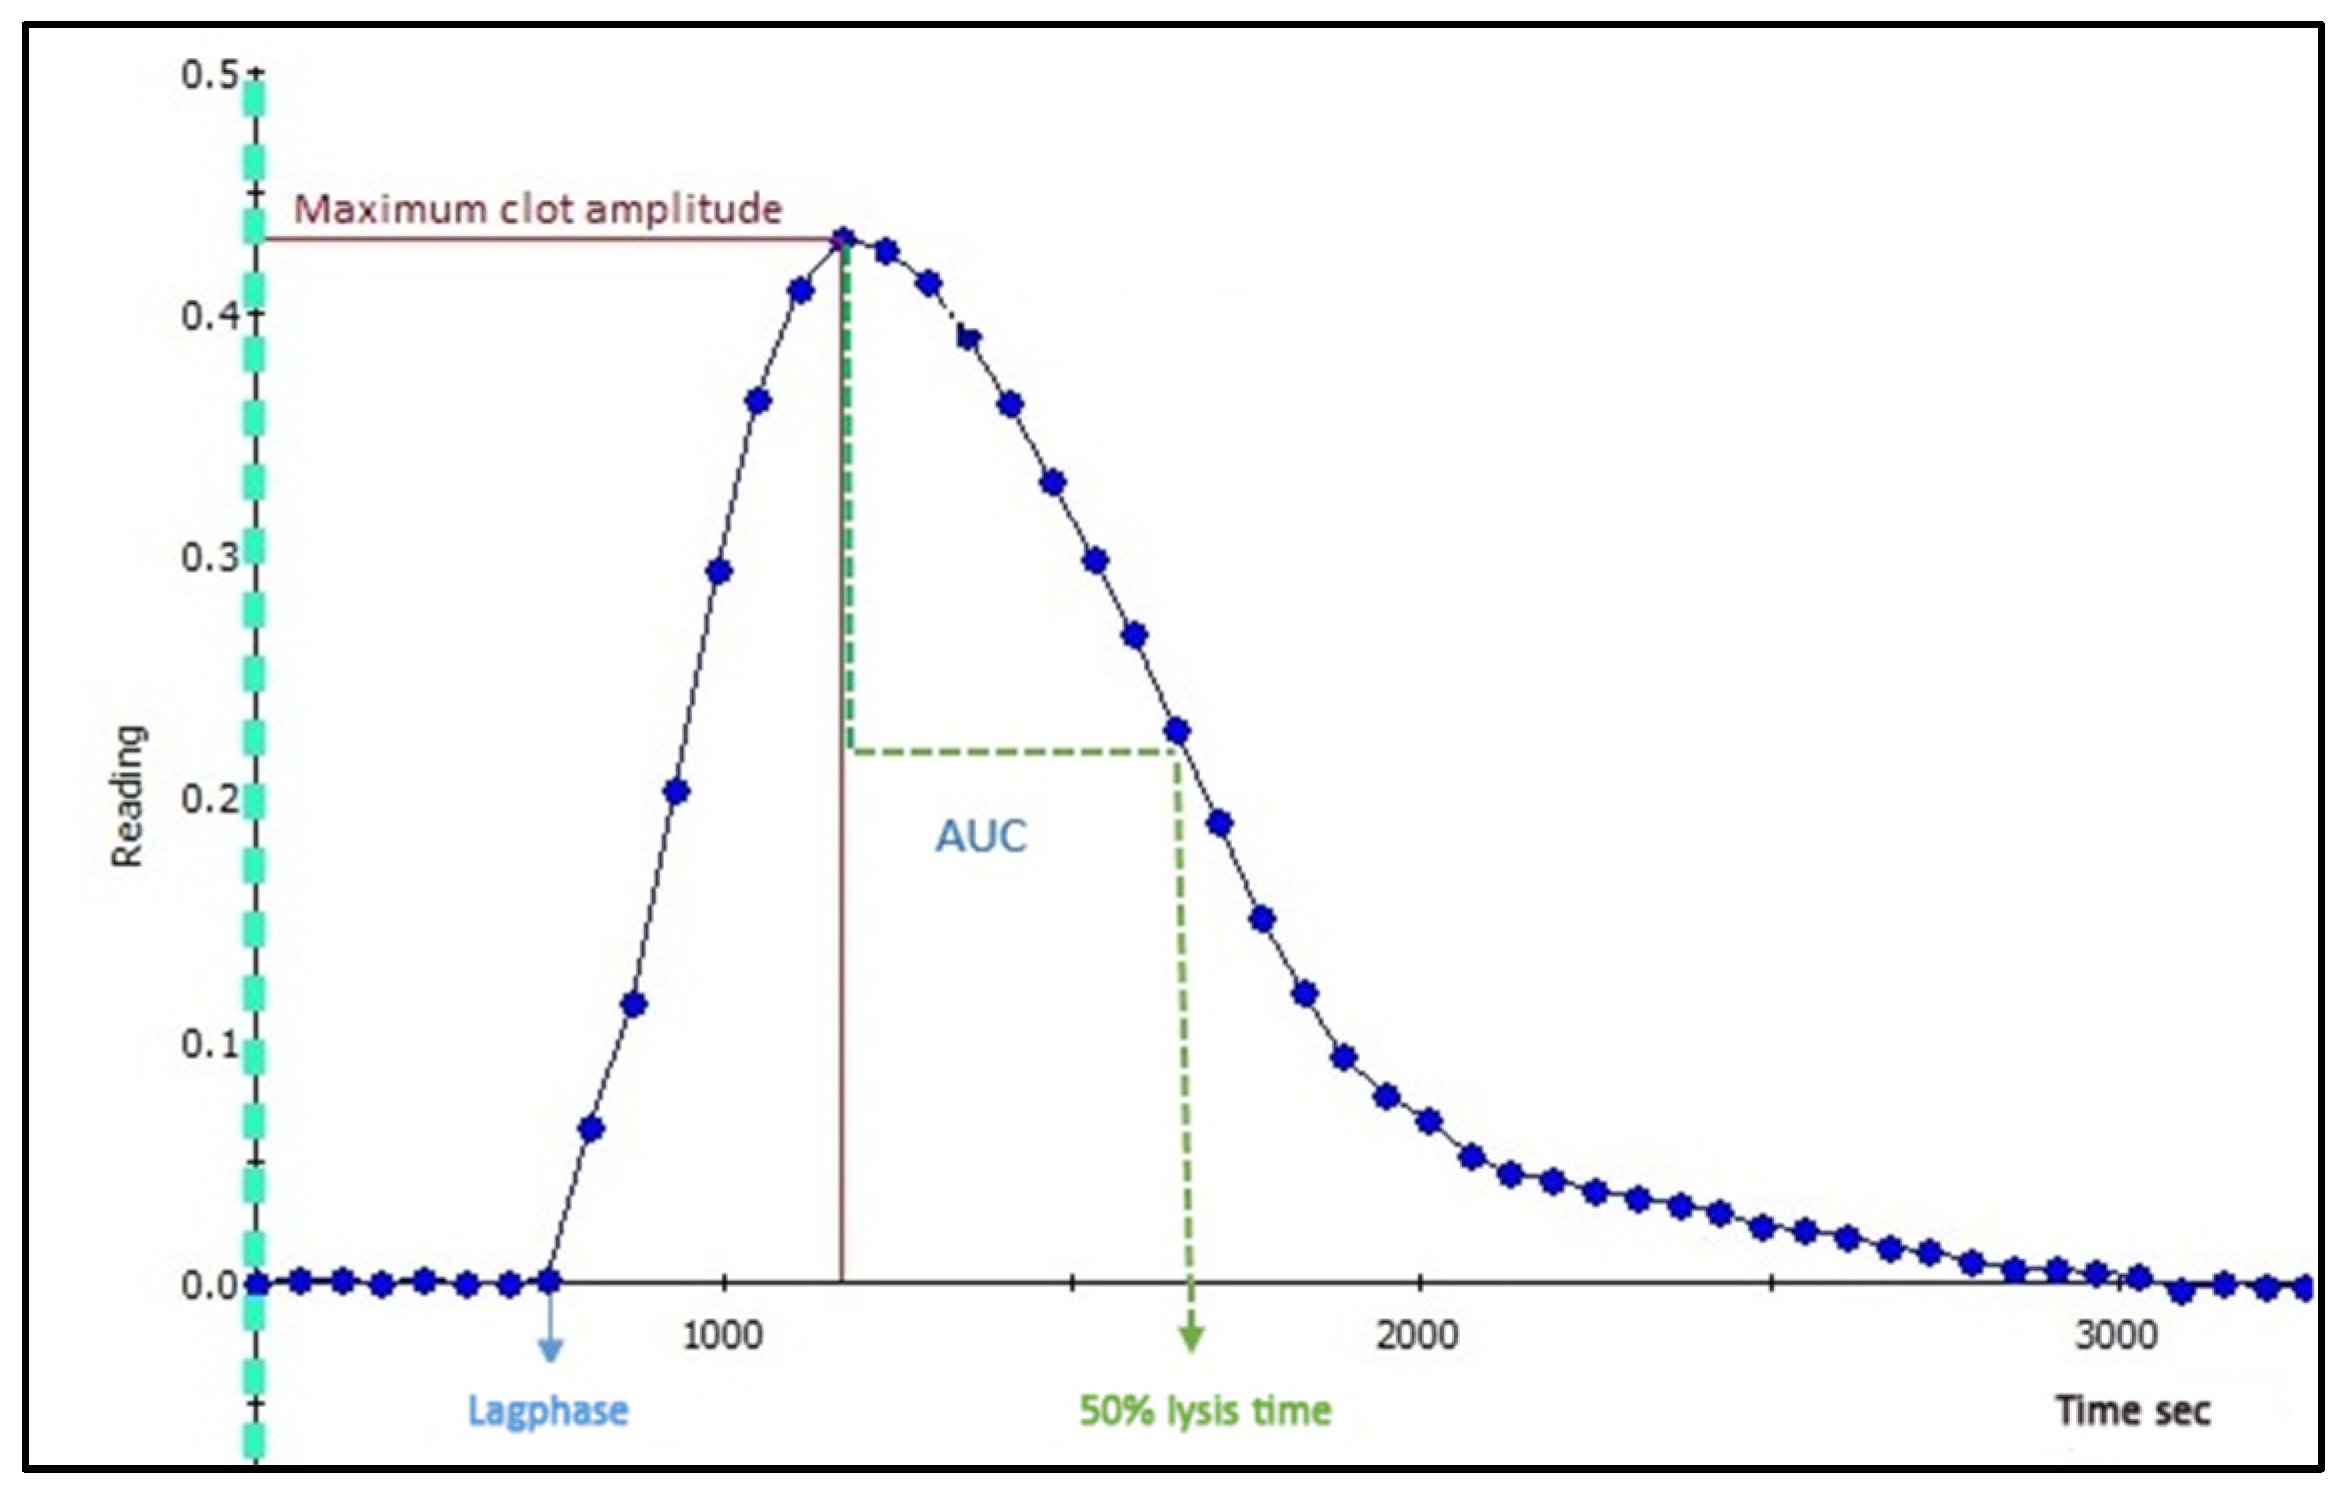
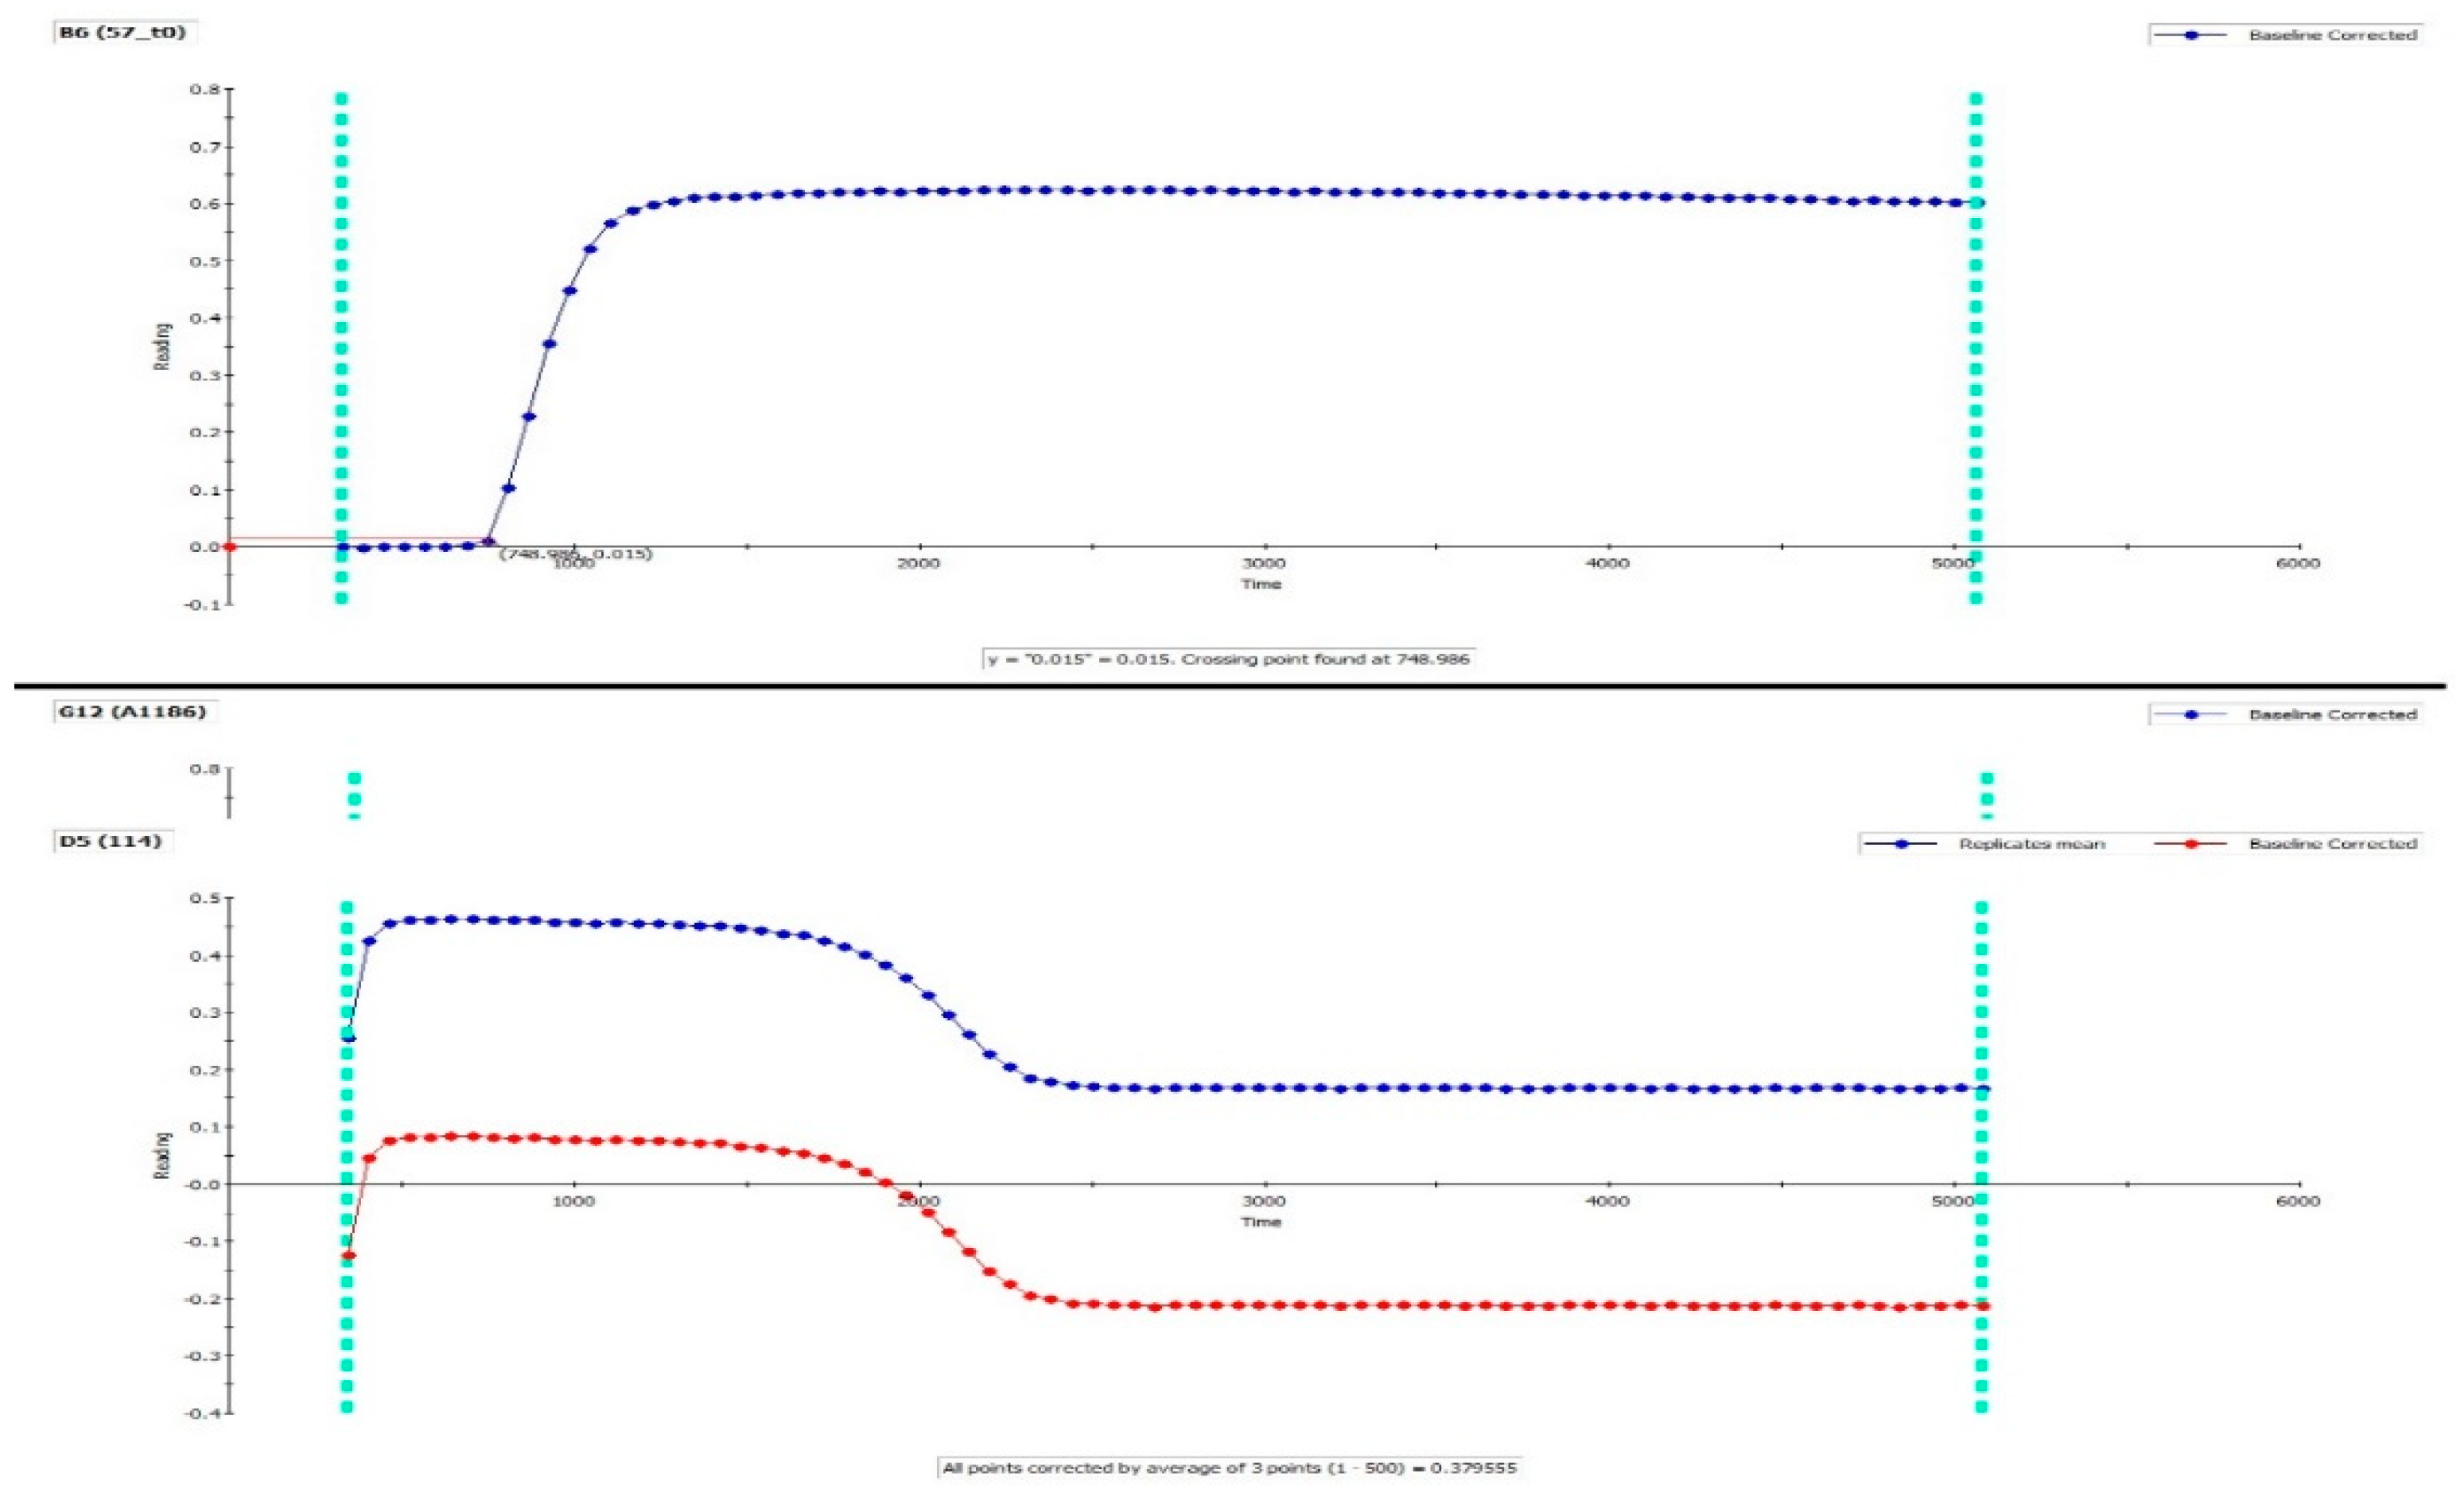
- Inspect all graphs of duplicates visually. The same reproducible duplicate and almost full lysis should be present; if not, exclude samples from analysis (perform re-run). Check baseline correction and crossing point to assure that baseline and lag phase are calculated correctly. See Figure 2 and Figure 3 (top).
- In Excel: inspect all individual samples for peak and integral. We accept a coefficient of variation (CV) of 15% for all parameters.
- High CV% between duplicates
- Clotted sample. Inspect samples visually.
- Pipetting error.
- Flat curve (no derived parameters can be calculated), see Figure 3.
- Single sample, controls normal: Patient-related—see Table 1; clotted sample; pipetting error.
- Controls/entire plate: Faulty activation of coagulation: check TF reagent, HEPES-Ca.
- No or partial lysis only (integral and 50% lysis time cannot be calculated), see Figure 3.
- Single sample, controls normal: Patient-related—see Table 1.
- Controls/entire plate: Faulty activation of fibrinolysis: problems with tPA reagent; automatic pipetting error.
4. Expected Results and Interpretation
5. Summary and Conclusions
6. Notes
6.1. Patient Preparation
6.2. Blood Sampling
6.3. Preparation of PPP
6.4. Reagents
6.5. Preparation of Reagents Immediately Prior to Analysis
- Add 150 µL phospholipids 500 µM + 1100 µL HEPES buffer to the 5 mL tube marked “PL”. Add lid and vortex spin.
- (150 + 1100)/150 = 1:8.33 dilution. 500 µM/8.33 = 60 µM.
- In well: 10 µL 60 µM phospholipids. (10 + 140)/10 = 1:15 dilution.
- Final concentration in well: 60 µM/15 = 60 µM/15 = 4 µM.
- TF “A”: Add 10 µL TF + 1320 µL HEPES buffer to the 5 mL tube marked “TF A”. Add lid and vortex spin.
- (10 + 1320)/10 = 1:133 dilution
- TF: Add 600 µL TF “A” + 2400 µL HEPES buffer to the separate 5 mL tube marked “TF”. Add lid and vortex spin.
- (600 + 2400)/600 = 1:5 dilution.
- 1:(133 × 5) = 1:655 dilution.
- In well: 20 µL 1:665 TF. (20 + 130)/20 = 1:7.5 dilution.
- Final dilution in well: 1:(665 × 7.5) = 1:4987 = 1:5000.
- tPA “A”: Add 40 µL tPA 100 µg/mL + 160 µL HEPES with 1% BSA to the 5 mL tube marked “tPA A”. Shake gently to mix.
- (40 + 160)/40 = 1:5 dilution.
- tPA: Add 150 µL tPA “A” + 3300 µL HEPES-BSA to the separate 5 mL tube marked “tPA”. Shake gently to mix.
- (150 + 3300)/150 = 1:23 dilution.
- 100 µg/mL/(5 × 23) = 0.879.6 µg/mL = 870 ng/mL.
- In well: 20 µL 870 ng/mL tPA. (20 + 130)/20 = 1:7.5 dilution.
- Final concentration in well: 870 ng/mL/7.5 = 115.9 ng/mL = 116 ng/mL.
- Add 1200 µL HEPES, 1200 µL “PL” and 2400 µL “TF” to the 5 mL tube labelled “PLTFH”. Add lid and vortex spin.
6.6. Use of Software and Automatic Dispensers
6.7. Setup of the Protocol in Workout
- Slow kinetics. Absorbance 405 nm (0.1 s).
- Measure each plate 80 times. Delay between readings: 0 s.
- Plate: Flat bottomed. Generic and 12 size plate. Measure the height standard (min 8 mm).
- Temperature: 37 °C.
- Dispenser 1: 20 µL.
- Dispenser 2: 20 µL.
- Shaking: Slow, 10 s.
- Reading: Measurement mode: by plate.
- Baseline correction: mean from 0 to 500 s; consider to redefine from run to run.
- Crossing point (baseline corrected): 0.015 absorbance units.
6.8. Data Export
- To create pictures: in the WorkOut protocol, click on well; click “Analysis”, right-click on picture “copy as image”. Open in MS Paint; save as .jpg.
- To export raw data:
- From Perkin Elmer 2030 Manager, choose “Explore protocols and results”.
- Find the folder where you stored the protocol and open folder.
- The results files are on the right side of this window. Open the wanted file.
- The file opens. After the Print button, you can see the Export button = two beams. Press this button. Save the file as .mht. Afterward, open in Excel and save as .xls.
Author Contributions
Funding
Acknowledgments
Conflicts of Interest
Ethics Statement
References
- Longstaff, C.; Kolev, K. Basic mechanisms and regulation of fibrinolysis. J. Thromb. Haemostasis 2015, 13, S98–S105. [Google Scholar] [CrossRef] [PubMed]
- Aoki, N. Discovery of alpha2-plasmin inhibitor and its congenital deficiency. J. Thromb. Haemost. 2005, 3, 623–631. [Google Scholar] [CrossRef] [PubMed]
- Binder, B.R.; Christ, G.; Gruber, F.; Grubic, N.; Hufnagl, P.; Krebs, M.; Mihaly, J.; Prager, G.W. Plasminogen activator inhibitor 1: Physiological and pathophysiological roles. Physiology 2002, 17, 56–61. [Google Scholar] [CrossRef] [PubMed]
- Bouma, B.N.; Mosnier, L.O. Thrombin activatable fibrinolysis inhibitor (TAFI)—how does thrombin regulate fibrinolysis? Ann. Med. 2006, 38, 378–388. [Google Scholar] [CrossRef]
- Gabriel, D.A.; Muga, K.; Boothroyd, E.M. The effect of fibrin structure on fibrinolysis. J. Biol. Chem. 1992, 267, 24259–24263. [Google Scholar]
- Collet, J.P.; Park, D.; Lesty, C.; Soria, J.; Soria, C.; Montalescot, G.; Weisel, J.W. Influence of fibrin network conformation and fibrin fiber diameter on fibrinolysis speed: Dynamic and structural approaches by confocal microscopy. Arterioscler. Thromb. Vasc. Biol. 2000, 20, 1354–1361. [Google Scholar] [CrossRef]
- Saes, J.L.; Schols, S.E.M.; Van Heerde, W.L.; Nijziel, M.R. Hemorrhagic disorders of fibrinolysis: A clinical review. J. Thromb. Haemostasis 2018, 16, 1498–1509. [Google Scholar] [CrossRef]
- Lisman, T. Decreased plasma fibrinolytic potential as a risk for venous and arterial thrombosis. Semin. Thromb. Hemost. 2017, 43, 178–184. [Google Scholar] [CrossRef]
- Dunn, E.J.; Philippou, H.; Ariëns, R.A.S.; Grant, P.J. Molecular mechanisms involved in the resistance of fibrin to clot lysis by plasmin in subjects with type 2 diabetes mellitus. Diabetologia 2006, 49, 1071–1080. [Google Scholar] [CrossRef]
- Foley, J.H.; Nesheim, M.E. Soluble thrombomodulin partially corrects the premature lysis defect in FVIII-deficient plasma by stimulating the activation of thrombin activatable fibrinolysis inhibitor. J. Thromb. Haemostasis 2009, 7, 453–459. [Google Scholar] [CrossRef]
- He, S.; Antovic, A.; Blombäck, M. A simple and rapid laboratory method for determination of haemostasis potential in plasma: II. Modifications for use in routine laboratories and research work. Thromb. Res. 2001, 103, 355–361. [Google Scholar] [CrossRef]
- Mosnier, L.O.; Von dem Borne, P.A.K.; Meijers, J.C.; Bouma, B.N. Plasma TAFI levels influence the clot lysis time in healthy individuals in the presence of an intact intrinsic pathway of coagulation. Thromb. Haemost. 1998, 80, 829–835. [Google Scholar] [PubMed]
- Silva, M.M.C.G.; Thelwell, C.; Williams, S.C.; Longstaff, C. Regulation of fibrinolysis by C-terminal lysines operates through plasminogen and plasmin but not tissue-type plasminogen activator. J. Thromb. Haemost. 2012, 10, 2354–2360. [Google Scholar] [CrossRef] [PubMed]
- Undas, A.; Celinska-Löwenhoff, M.; Löwenhoff, T.; Szczeklik, A. Statins, fenofibrate, and quinapril increase clot permeability and enhance fibrinolysis in patients with coronary artery disease. J. Thromb. Haemost. 2006, 4, 1029–1036. [Google Scholar] [CrossRef] [PubMed]
- Neergaard-Petersen, S.; Mogensen, V.B.; Veirup, M.S.; Grove, E.L.; Kristensen, S.D.; Hvas, A.M. Fibrin clot lysis assay: Establishment of a reference interval. Thromb. Res. 2018, 167, 9–11. [Google Scholar] [CrossRef]
- Meltzer, M.E.; Lisman, T.; de Groot, P.G.; Meijers, J.C.; le Cessie, S.; Doggen, C.J.; Rosendaal, F.R. Venous thrombosis risk associated with plasma hypofibrinolysis is explained by elevated plasma levels of TAFI and PAI-1. Blood 2010, 116, 113–121. [Google Scholar] [CrossRef]
- Lisman, T.; Leebeek, F.W.; Mosnier, L.O.; Bouma, B.N.; Meijers, J.C.; Janssen, H.L.; Nieuwenhuis, H.K.; De Groot, P.G. Thrombin-activatable fibrinolysis inhibitor deficiency in cirrhosis is not associated with increased plasma fibrinolysis. Gastroenterology 2001, 121, 131–139. [Google Scholar] [CrossRef]
- Veirup, M.S.; Mogensen, V.B.; Neergaard-Petersen, S.; Hvas, A.M. Fibrin Clot Lysis Analysis: Tissue Factor versus Thrombin as Activator. In Proceedings of the International Society on Thrombosis and Haemostasis, Melbourne, Australia, 6–10 July 2019. [Google Scholar]
- Pieters, M.; Philippou, H.; Undas, A.; De Lange, Z.; Rijken, D.C.; Mutch, N.J. An international study on the feasibility of a standardized combined plasma clot turbidity and lysis assay: Communication from the SSC of the ISTH. J. Thromb. Haemost. 2018, 16, 1007–1012. [Google Scholar] [CrossRef]
- Undas, A.; Szułdrzynski, K.; Stepien, E.; Zalewski, J.; Godlewski, J.; Tracz, W.; Pasowicz, M.; Zmudka, K. Reduced clot permeability and susceptibility to lysis in patients with acute coronary syndrome: Effects of inflammation and oxidative stress. Atherosclerosis 2008, 196, 551–557. [Google Scholar] [CrossRef]
- Sumaya, W.; Wallentin, L.; James, S.K.; Siegbahn, A.; Gabrysch, K.; Bertilsson, M.; Himmelmann, A.; Ajjan, R.A.; Storey, R.F. Fibrin clot properties independently predict adverse clinical outcome following acute coronary syndrome: A PLATO substudy. Eur. Heart J. 2018, 39, 1078–1085. [Google Scholar] [CrossRef]
- Neergaard-Petersen, S.; Ajjan, R.; Hvas, A.M.; Hess, K.; Larsen, S.B.; Kristensen, S.D.; Grove, E.L. Fibrin clot structure and platelet aggregation in patients with aspirin treatment failure. PLoS ONE 2013, 8, e71150. [Google Scholar] [CrossRef] [PubMed]
- Neergaard-Petersen, S.; Larsen, S.B.; Grove, E.L.; Kristensen, S.D.; Ajjan, R.A.; Hvas, A.M. Imbalance between fibrin clot formation and fibrinolysis predicts cardiovascular events in patients with stable coronary artery disease. Thromb. Haemost. 2020, 120, 75–82. [Google Scholar] [CrossRef] [PubMed]
- Undas, A.; Slowik, A.; Wolkow, P.; Szczudlik, A.; Tracz, W. Fibrin clot properties in acute ischemic stroke: Relation to neurological deficit. Thromb. Res. 2010, 125, 357–361. [Google Scholar] [CrossRef] [PubMed]
- Bembenek, J.P.; Niewada, M.; Siudut, J.; Plens, K.; Członkowska, A.; Undas, A. Fibrin clot characteristics in acute ischaemic stroke patients treated with thrombolysis: The impact on clinical outcome. Thromb. Haemost. 2017, 117, 1440–1447. [Google Scholar] [CrossRef] [PubMed]
- Lisman, T.; De Groot, P.G.; Meijers, J.C.; Rosendaal, F.R. Reduced plasma fibrinolytic potential is a risk factor for venous thrombosis. Blood 2005, 105, 1102–1105. [Google Scholar] [CrossRef] [PubMed]
- Meltzer, M.E.; Lisman, T.; Doggen, C.J.; De Groot, P.G.; Rosendaal, F.R. Synergistic effects of hypofibrinolysis and genetic and acquired risk factors on the risk of a first venous thrombosis. PLoS Med. 2008, 5, e97. [Google Scholar] [CrossRef]
- Ząbczyk, M.; Natorska, J.; Janion-Sadowska, A.; Metzgier-Gumiela, A.; Polak, M.; Plens, K.; Janion, M.; Skonieczny, G.; Mizia-Stec, K.; Undas, A. Prothrombotic fibrin clot properties associated with NETs formation characterize acute pulmonary embolism patients with higher mortality risk. Sci. Rep. 2020, 10, 11433. [Google Scholar] [CrossRef]
- Martinez, M.R.; Cuker, A.; Mills, A.M.; Crichlow, A.; Lightfoot, R.T.; Chernysh, I.N.; Chandrasekaran Nagaswami, C.; Weisel, J.W.; Ischiropoulos, H. Enhanced lysis and accelerated establishment of viscoelastic properties of fibrin clots are associated with pulmonary embolism. Am. J. Physiol. Lung Cell. Mol. Physiol. 2014, 306, L397–L404. [Google Scholar] [CrossRef]
- Cieslik, J.; Mrozinska, S.; Broniatowska, E.; Undas, A. Altered plasma clot properties increase the risk of recurrent deep vein thrombosis: A cohort study. Blood 2018, 131, 797–807. [Google Scholar] [CrossRef]
- Traby, L.; Kollars, M.; Eischer, L.; Eichinger, S.; Kyrle, P.A. Prediction of recurrent venous thromboembolism by clot lysis time: A prospective cohort study. PLoS ONE 2012, 7, e51447. [Google Scholar] [CrossRef]
- Neergaard-Petersen, S.; Hvas, A.M.; Kristensen, S.D.; Grove, E.L.; Larsen, S.B.; Phoenix, F.; Kurdee, Z.; Grant, P.J.; Ajjan, R.A. The influence of type 2 diabetes on fibrin clot properties in patients with coronary artery disease. Thromb. Haemost. 2014, 112, 1142–1150. [Google Scholar] [CrossRef]
- Potze, W.; Siddiqui, M.S.; Boyett, S.L.; Adelmeijer, J.; Daita, K.; Sanyal, A.J.; Lisman, T. Preserved hemostatic status in patients with non-alcoholic fatty liver disease. J. Hepatol. 2016, 65, 980–987. [Google Scholar] [CrossRef] [PubMed]
- Bos, S.; van den Boom, B.; Kamphuisen, P.W.; Adelmeijer, J.; Blokzijl, H.; Schreuder, T.; Lisman, T. Haemostatic profiles are similar across all aetiologies of cirrhosis. Thromb. Haemost. 2019, 119, 246–253. [Google Scholar] [CrossRef] [PubMed]
- Blasi, A.; Patel, V.C.; Adelmeijer, J.; Azarian, S.; Hernandez Tejero, M.; Calvo, A.; Fernández, J.; Bernal, W.; Lisman, T. Mixed fibrinolytic phenotypes in decompensated cirrhosis and acute-on-chronic liver failure with hypofibrinolysis in those with complications and poor survival. Hepatology 2020, 71, 1381–1390. [Google Scholar] [CrossRef] [PubMed]
- Semeraro, F.; Colucci, M.; Caironi, P.; Masson, S.; Ammollo, C.T.; Teli, R.; Semeraro, N.; Magnoli, M.; Salati, G.; Isetta, M.; et al. Platelet drop and fibrinolytic shutdown in patients with sepsis. Crit. Care Med. 2018, 46, e221–e228. [Google Scholar] [CrossRef]
- Longstaff, C. Development of Shiny app tools to simplify and standardize the analysis of hemostasis assay data: Communication from the SSC of the ISTH. J. Thromb. Haemost. 2017, 15, 1044–1046. [Google Scholar] [CrossRef]
- Larsen, S.B.; Grove, E.L.; Neergaard-Petersen, S.; Würtz, M.; Hvas, A.M.; Kristensen, S.D. Determinants of reduced antiplatelet effect of aspirin in patients with stable coronary artery disease. PLoS ONE 2015, 10, e0126767. [Google Scholar] [CrossRef]


| Parameter | Reference Interval [15] | Represents | Interpretation |
|---|---|---|---|
| Peak absorbance (AU) | 0.18–0.74 | Maximum fibrin concentration reached in well | ↑: Increased procoagulant activity; high plasma fibrinogen ↓: Decreased procoagulant activity, may be due to low plasma levels of coagulation factors or fibrinogen |
| Integral (AU * s) | 219–1051 | Net fibrin formation Balance between fibrin formation and breakdown | ↑: Increased procoagulant activity; decreased endogenous anticoagulant activity; decreased fibrinolytic capacity ↓: Decreased procoagulant activity or clot stability, may be due to low circulating coagulation factors, fibrinogen or factor XIII; increased fibrinolytic activity |
| 50% lysis time (s) | 309–1565 | Time from maximum fibrin concentration is reached until 50% of the clot is lysed 1 | ↑: Decreased fibrinolytic capacity, may be due to low circulating plasminogen, high PAI-1 and/or TAFI [16] or anti-fibrinolytic treatment ↓: Increased fibrinolytic activity may be due to high plasma levels of tPA or uPA |
| Parameter | Thrombin 0.03 U/mL | Tissue Factor 1:5000 |
|---|---|---|
| Peak absorbance (AU) | 0.32 (0.26–0.40) | 0.68 (0.59–0.75) |
| Integral (AU × s) | 408 (289–585) | 1381 (1083–1733) |
| 50% lysis time (s) | 726 (570–912) | 1483 (1154–1828) |
| Parameter | tPA 83 ng/mL | tPA 116 ng/mL |
|---|---|---|
| Peak absorbance (AU) | 0.69 (0.61–0.76) | 0.68 (0.58–0.75) |
| Integral (AU × s) | 1410 (1111–1748) | 826 (665–1025) |
| 50% lysis time (s) | 1509 (1166–1830) | 802 (653–1027) |
| Condition | Findings |
|---|---|
| Cardiovascular disease | ACS: ↑ lysis time ACS patients vs. healthy controls [20]; ↑ lysis time at ACS associated with ↑ 1-year mortality [21] Stable CAD: ↑ lysis time in CAD patients with previous MI [22]; ↑ integral but not lysis time associated with subsequent poor cardiovascular outcome [23] |
| Ischaemic stroke | ↑ lysis time in stroke patients at onset vs. healthy controls [24]; ↑ lysis time at onset associated with poor 3-month neurological function [25] |
| Venous thrombosis | ↑ lysis time in DVT and PE patients compared with healthy controls [26,27]; in PE, ↑ lysis time associated with ↑ 12-month mortality [28] ↓ lysis time in patients with PE vs. patients with DVT alone [29] ↑ lysis time may predict VTE recurrence [30], though other studies found no association [16,31] |
| Diabetes mellitus | ↑ integral and lysis time in CAD patients with type 2 diabetes vs. non-diabetic patients [32] |
| Hepatic dysfunction | Stable cirrhosis: uncertain; may vary according to etiology. ASH: ↓ lysis time; NASH: ↑ lysis time [33,34] ACLF: variable lysis times, influenced by concurrent factors [35] ALF: ↑↑ lysis time/lysis resistance |
| Sepsis | ↑ lysis time in sepsis vs. healthy controls [36] and in septic vs. non-septic ACLF patients [35]; ↑ lysis time associated with lower platelet count but not survival [36] ↑ integral in sepsis vs. healthy controls; flat or lysis resistant clot-lysis curves associated with ↑ DIC and SOFA score * |
© 2020 by the authors. Licensee MDPI, Basel, Switzerland. This article is an open access article distributed under the terms and conditions of the Creative Commons Attribution (CC BY) license (http://creativecommons.org/licenses/by/4.0/).
Share and Cite
Larsen, J.B.; Hvas, A.-M. Fibrin Clot Formation and Lysis in Plasma. Methods Protoc. 2020, 3, 67. https://doi.org/10.3390/mps3040067
Larsen JB, Hvas A-M. Fibrin Clot Formation and Lysis in Plasma. Methods and Protocols. 2020; 3(4):67. https://doi.org/10.3390/mps3040067
Chicago/Turabian StyleLarsen, Julie Brogaard, and Anne-Mette Hvas. 2020. "Fibrin Clot Formation and Lysis in Plasma" Methods and Protocols 3, no. 4: 67. https://doi.org/10.3390/mps3040067
APA StyleLarsen, J. B., & Hvas, A.-M. (2020). Fibrin Clot Formation and Lysis in Plasma. Methods and Protocols, 3(4), 67. https://doi.org/10.3390/mps3040067