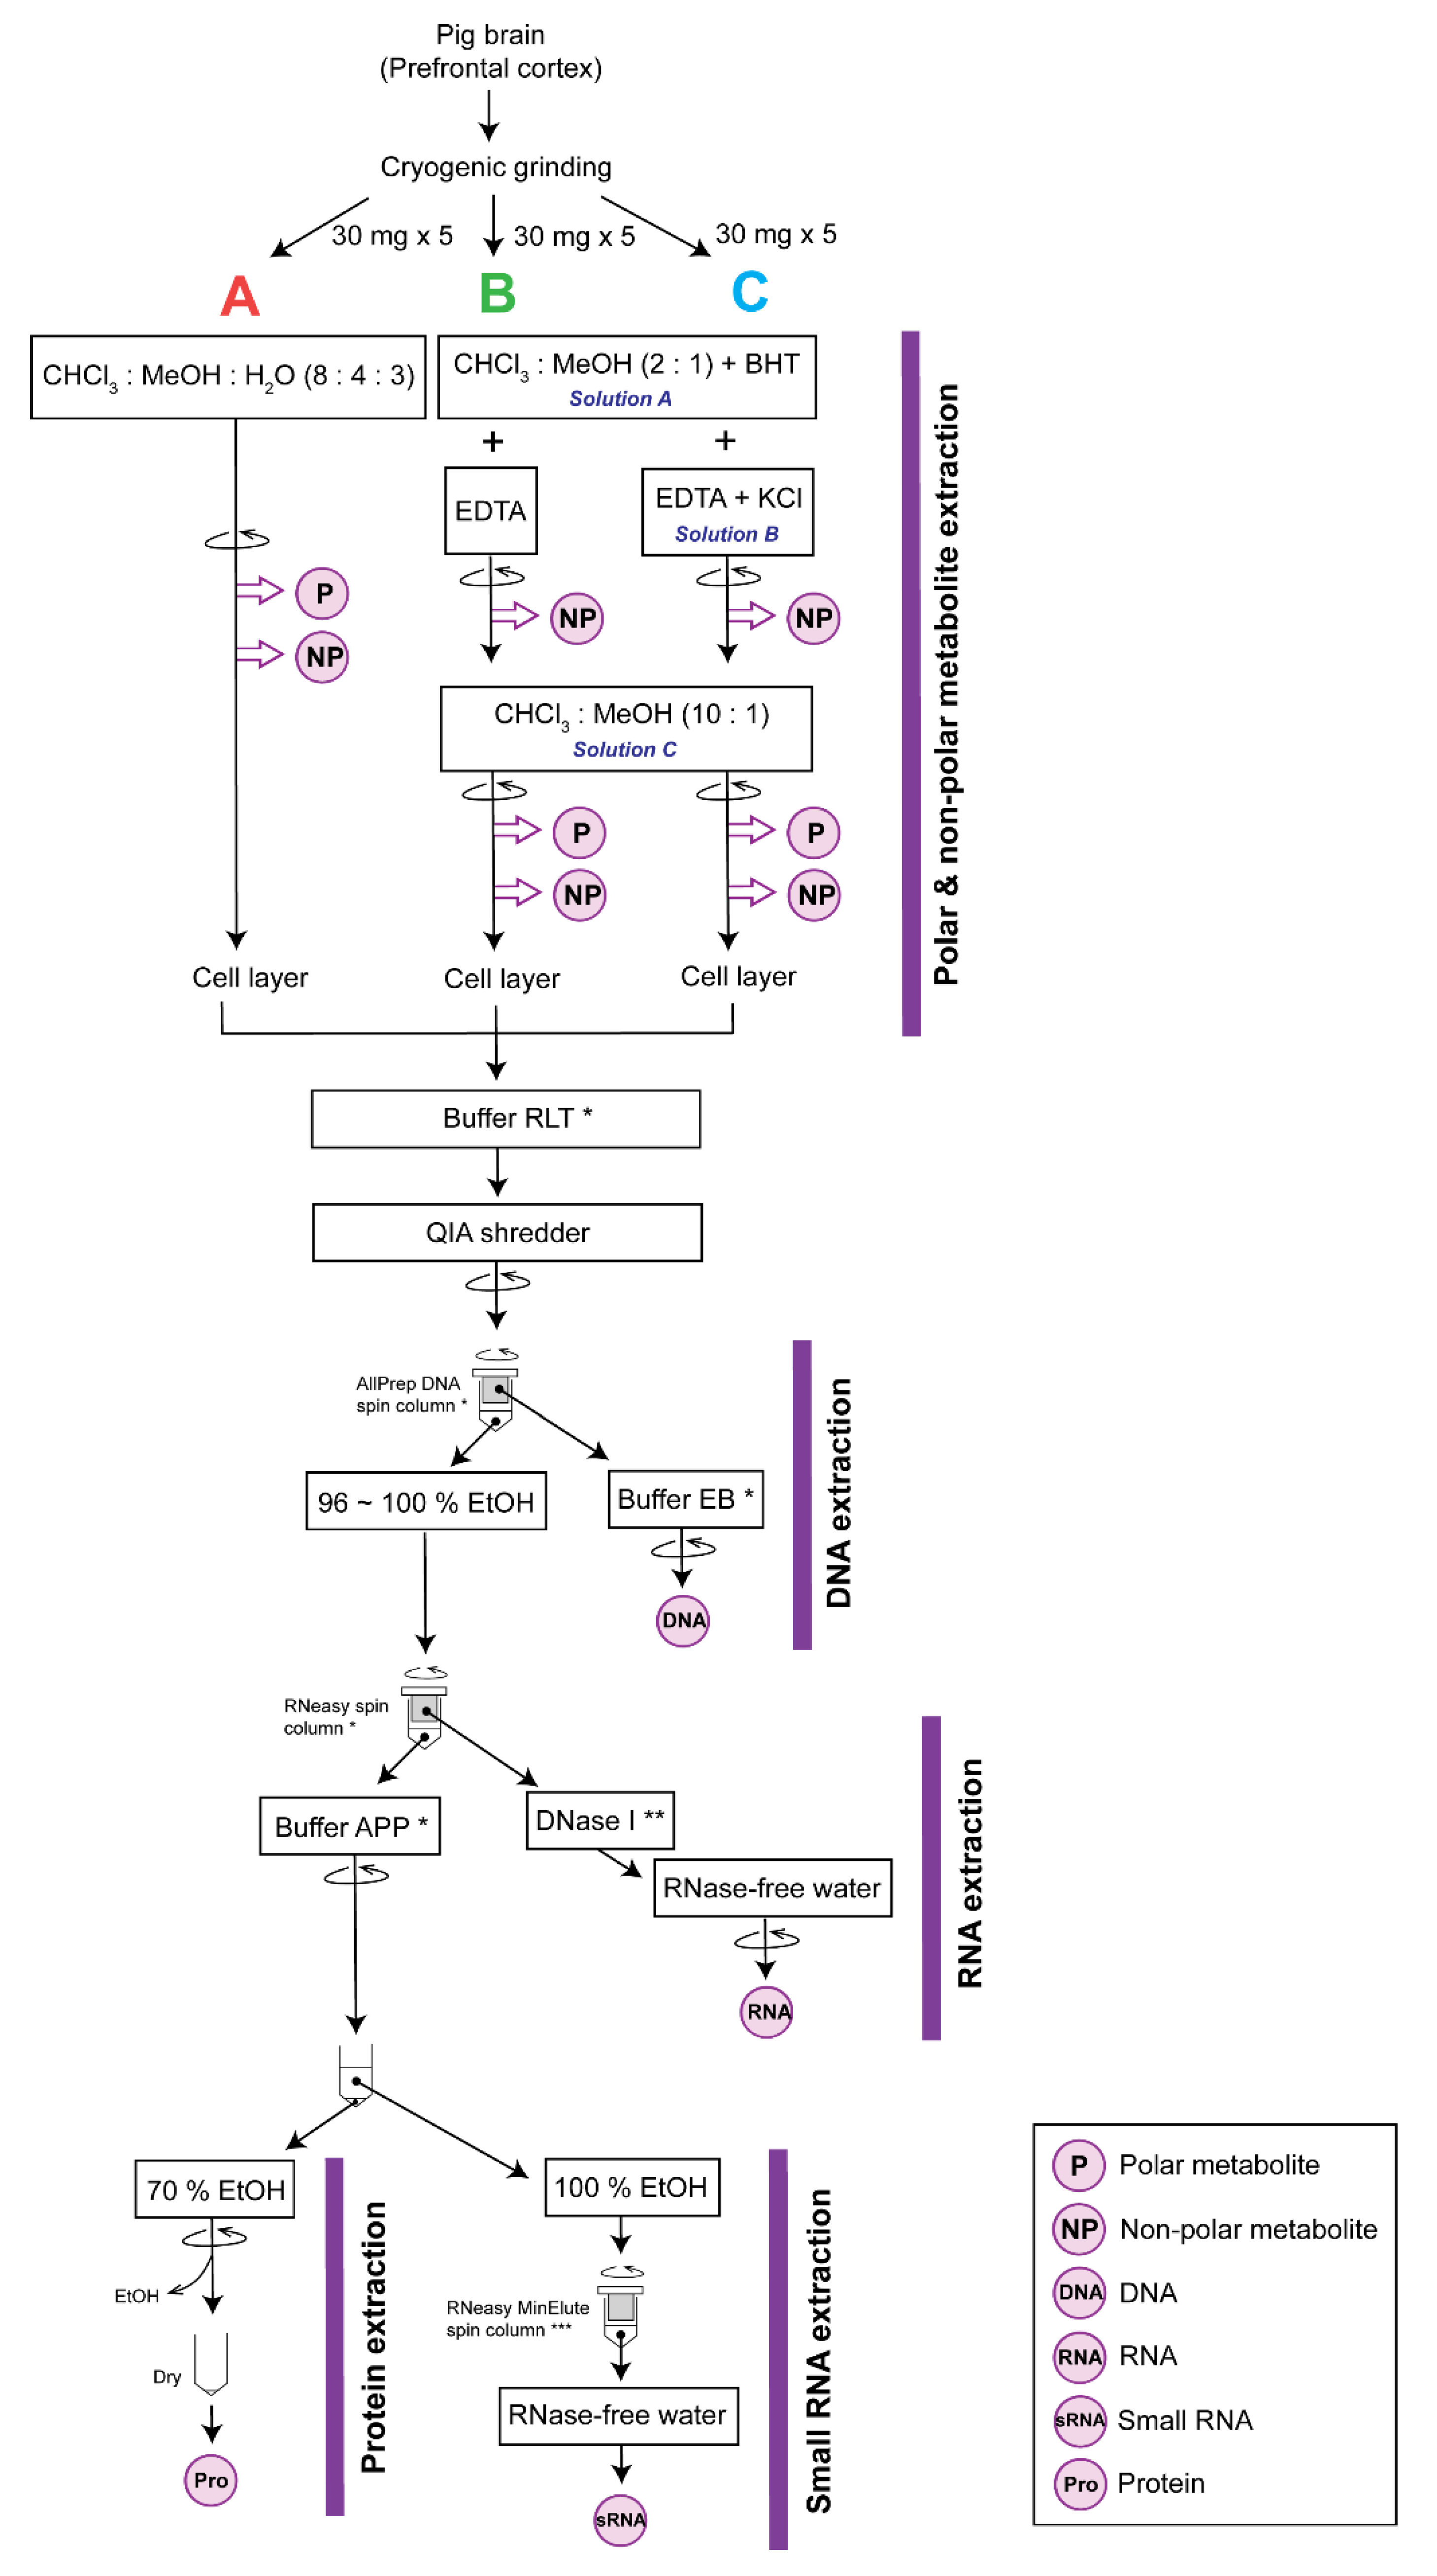
Optimization of a Method for the Simultaneous Extraction of Polar and Non-Polar Oxylipin Metabolites, DNA, RNA, Small RNA, and Protein from a Single Small Tissue Sample


 ,
,
Abstract
:1. Introduction
2. Experimental Design
2.1. Materials
2.1.1. Tissue Preparation
2.1.2. Extraction
- Chloroform (HPLC-grade; Fisher Scientific, Waltham, MA, USA)
- Methanol (HPLC-grade; Fisher Scientific)
- Type I ultrapure water
- BHT (Sigma–Aldrich, St. Louis, MO, USA)
- EDTA (Fisher Scientific)
- KCl (Crystalline/Certified ACS; Fisher Scientific)
2.1.3. Polar Metabolite Analysis
- 10 mM phosphate buffer (pH 6.85)
- 3-(trimethylsilyl)-1-propanesulfonic acid-d6 (DSS-d6) containing 0.2% NaN3 in 98% deuterium oxide (Chenomx Inc., Edmonton, AB, Canada)
- Hydrochloric acid (HCl)
- Sodium hydroxide (NaOH)
2.1.4. Non-polar Oxylipin Metabolite Analysis
- Isopropanol (Fisher Scientific)
- Surrogate standard solution
- Triphenylphosphine
- Sodium carbonate
- Acetic acid
- Ethyl acetate
- Acetonitrile
2.1.5. Cell Lysis and Extraction of DNA, RNA, Small RNA, and Protein
- 2-mercaptoethanol (Sigma–Aldrich)
- AllPrep DNA/RNA/Protein Mini Kit (QIAGEN, Germantown, MD, USA)
- QIAshredder (QIAGEN)
- RNase-Free DNase Set (QIAGEN)
- RNeasy MinElute Cleanup Kit (QIAGEN)
- Ethanol (Decon Labs)
- 5% w/v sodium dodecyl sulfate (SDS) (Sigma–Aldrich)
- Bovine serum albumin (Bio-Rad, Hercules, CA, USA)
2.2. Equipment
2.2.1. Extraction
- Balance
- Biosafety cabinet
- Fume hood
- Pipettes
- DNA AWAY surface decontaminant (Thermo Fisher Scientific, Waltham, MA, USA)
- RNaseZap RNase decontamination solution (Thermo Fisher Scientific)
- Liquid nitrogen
- Sterile razors
- Aluminum foil
- Dry ice
- Ice
- Mortar and pestles
- Disposable standard spoon/spatula (USA Scientific, Ocala, FL, USA)
- 8 mL glass tubes (Fisher Scientific)
- Falcon 15 mL conical centrifuge tubes (Fisher Scientific)
- 9-inch glass Pasteur pipettes (Fisher Scientific)
- Vortexer
- Benchtop centrifuge for 1.5 mL microcentrifuge tubes
- 5 mL tubes
- Benchtop centrifuge for 8 mL glass tubes/15 mL falcon tubes
- Dry baths/block heater (Fisher Scientific)
2.2.2. Polar Metabolite Analysis
- 1.5 mL microcentrifuge tubes
- MiVac Duo concentrator (Genevac Ltd., Ipswich, England)
- −80 and −20 °C freezers
- 4 °C refrigerator
- pH meter
- 3 mm nuclear magnetic resonance (NMR) tube (Bruker, Billerica, MA, USA)
- Bruker Avance 600 MHz NMR spectrometer (Bruker)
2.2.3. Non-Polar Oxylipin Metabolite Analysis
- Waters Oasis HLB 3cc SPE column (Waters, Milford, MA, USA)
- Agilent Eclipse Plus C18 column (2.1 × 150 mm, 1.8 μm) (Agilent Corporation, Folsom, CA, USA)
- Agilent LC system 1290 coupled to an Agilent 6460 Triple Quadrupole mass-spectrometer (Agilent Corporation)
2.2.4. DNA, RNA, Small RNA Assessment
- NanoDrop 2000c spectrophotometer (Thermo Fisher Scientific)
- Qubit Fluorometer 3.0 (Thermo Fisher Scientific)
- Qubit dsDNA BR Assay Kit (Thermo Fisher Scientific)
- Qubit RNA HS Assay Kit (Thermo Fisher Scientific)
- Qubit microRNA Assay Kit (Thermo Fisher Scientific)
- Gel loading dye purple (6X) containing no SDS (New England BioLabs, Ipswich, MA, USA)
- SYBR Safe DNA Gel Stain (Thermo Fisher Scientific)
- Gel Doc XR system (Bio-Rad)
- Agilent 2100 Bioanalyzer (Agilent)
- Agilent RNA 6000 Nano Kit (Agilent)
2.2.5. Protein Assessment
- DC Protein Assay kit (Bio-Rad)
- Synergy H1 hybrid multi-mode reader (BioTek Instruments, Winooski, VT, USA)
- 96-well plate
2.2.6. Further Protein Purification
- Zeba Spin desalting columns, 7K MWCO (Thermo Fisher Scientific)
3. Procedure
3.1. Preparation of Reagents. Time for Completion: 0:10 Hours per Batch of 12 Samples
- Prepare chloroform:methanol (2:1) with 0.002% BHT [Solution A]. Pre-chill in a −20 °C freezer.
- Prepare 1 mM EDTA dissolved in Type I water with 0.9% KCl [Solution B]. Pre-chill to 4 °C.
- Prepare chloroform:methanol (10:1) [Solution C]. Pre-chill in a −20 °C freezer.
3.2. Tissue Disruption. Time for Completion: 2:00 Hours per Batch of 12 Samples
- 4.
- Prior to tissue homogenization and extractions, clean all equipment by either autoclaving or spraying with DNA AWAY surface decontaminant and RNaseZap RNase decontamination solution. All disposable supplies should be purchased sterilized and free of DNase and RNase.
- 5.
- Weigh glass tubes with lids.
- 6.
- In a biosafety cabinet (BSC), cut tissue using a sterile razor on aluminum foil that has been placed on dry ice.
- 7.
- In the BSC, place the tissue into a mortar pre-chilled with liquid nitrogen and grind with a pre-chilled pestle until a frozen, homogeneous, and fine powder is obtained, adding additional liquid nitrogen as needed.
- 8.
- In the BSC, chill a disposable spatula with liquid nitrogen, and transfer 30 mg of the cryoground tissue into a pre-weighed 8 mL glass tube.
3.3. Metabolite Extraction. Time for Completion: 1:20 Hours per Batch of 12 Samples
- 9.
- Add 2.4 mL of cold Solution A into the 8 mL glass tube with the cryoground tissue.
- 10.
- Add 600 μL of Solution B.
- 11.
- Cap carefully and vortex for 20 s at max speed, and centrifuge for 15 min at 2000× g at 0 °C.
- 12.
- Using a 9-inch glass Pasteur pipette, collect the bottom layer and place in a new 8 mL glass tube. Place the tube on ice.
- 13.
- Add 1.4 mL of cold Solution C to the remaining upper and middle layer.
- 14.
- Vortex for 10 s at max speed, and centrifuge for 15 min at 2000× g at 0 °C.
- 15.
- Collect the upper layer into a new 15 mL conical centrifuge tube. Do not disturb the middle layer. Keep the tube on ice.
- 16.
- Collect the bottom layer with a Pasteur pipette, and add to the glass tube from step 12. Keep both tubes on ice.
3.4. Cell Lysis and Homogenization. Time for Completion: 0:20 Hours per Batch of 12 Samples
- 17.
- In a fume hood, modify the Buffer RLT provided from a QIAGEN AllPrep DNA/RNA/Protein Mini Kit by adding 10 µL of 2-mercaptoethanol for each mL of Buffer RLT. Wrap the cap with parafilm and pre-chill the buffer at 4 °C for at least 10 min before use.
- Buffer RLT contains guanidine thiocyanate. The combination of guanidine thiocyanate with 2-mercaptoethanol will ensure the inactivation of enzymes such as RNase as well as proteinases. The modified Buffer RLT can be stored at room temperature for up to 1 month.
- 18.
- Centrifuge the glass tubes with the middle layer for 5 min at 2000× g at 0 °C and remove any potentially remaining polar and non-polar layers.
- 19.
- In the fume hood, add 600 µL of cold modified Buffer RLT to the middle layer left in the 8 mL glass tubes.
- When the tissue is not difficult to lyse and/or less than 20 mg of tissue has been prepared, add 350 µL of the modified Buffer RLT.
- 20.
- Vortex for 30 s at max speed.
- 21.
- In the fume hood, transfer the lysate on to one QIAshredder column placed in a 2 mL collection tube. Centrifuge the loaded QIAshredder column for 2 min at 16,100× g at room temperature.
![Mps 03 00061 i001]() . PAUSE STEP: Close the tube using the cap provided with the QIAshredder, and store the cell lysate at −80 °C until further analysis. Resume from step 42.
. PAUSE STEP: Close the tube using the cap provided with the QIAshredder, and store the cell lysate at −80 °C until further analysis. Resume from step 42.

3.5. Lyophilization of the Polar Metabolite and NMR Analysis. Time for Completion: 2–3 Days
- 22.
- Centrifuge the collected polar layer sample at 10,000× g for 2 min and transfer the supernatant into a new 15 mL falcon tube to avoid potential contaminants such as the non-polar layer or cell debris. Measure and record the volume.
- 23.
- To the polar metabolite layer, add three parts of Type I water.
![Mps 03 00061 i002]() . CRITICAL STEP: Make sure this final volume is not more than half of the tube volume. If it is, then transfer it to a larger tube; this helps prevent sample loss during the drying step.
. CRITICAL STEP: Make sure this final volume is not more than half of the tube volume. If it is, then transfer it to a larger tube; this helps prevent sample loss during the drying step. - 24.
- Store at −80 °C for at least 12 h in an upright or slightly tilted position so that the sample solution does not reach the top of the tube, which could lead to sample loss during the next step
- 25.
- Use a MiVac Duo concentrator to evaporate the methanol and water solvent using the instrument’s suggested settings for this solvent mixture.
![Mps 03 00061 i001]() . PAUSE STEP: Store the dried samples at −80 °C until further analysis.
. PAUSE STEP: Store the dried samples at −80 °C until further analysis. - 26.
- For analysis using NMR spectroscopy, reconstitute the dried sample in 270 µL of 10 mM phosphate buffer (pH 6.85).
- 27.
- Centrifuge the sample for 15 min at 14,000× g at 4 °C, and mix 207 µL of the supernatant with 23 µL of DSS-d6 (internal standard).
- 28.
- Adjust the pH to approximately 6.8 for each sample as needed by adding a small volume of 1 N HCl or NaOH.
- 29.
- Transfer 180 µL of the sample into a 3 mm NMR tube and store at 4 °C until NMR data acquisition, which should be within 24 h of the sample preparation.
- 30.
- Acquire all 1H NMR spectra at 25 °C using the noesypr1d pulse sequence on a Bruker Avance 600 MHz NMR spectrometer as described [3].

3.6. Total Oxylipin (free and bound) Extraction. Time for Completion: 3:00 Hours per Batch of 12 Samples
- 31.
- Dry the collected non-polar chloroform extract under nitrogen and reconstitute with 1500 μL chloroform:isopropanol (2:1).
- 32.
- Dry 500 μL of the reconstituted extract under nitrogen gas and dissolve it in 200 μL of methanol containing 0.1% BHT and 0.1% acetic acid, 10 μL of antioxidant solution containing 0.2 mg/mL BHT, EDTA and triphenylphosphine (TPP) in water:methanol (1:1), and 10 µL of surrogate standard solution containing 2 μM of d11-11(12)-EpETrE, d11-14,15-DiHETrE, d4-6-keto-PGF1α, d4-9-HODE, d4-LTB4, d4-PGE2, d4-TXB2, d6-20-HETE and d8-5-HETE in methanol.
- 33.
- Add 200 μL of 26.5 mg/mL sodium carbonate dissolved in methanol:water (1:1) to the sample, and hydrolyze at 60 °C for 30 min.
- 34.
- After cooling down the sample, add 25 μL of acetic acid and 1575 μL of water.
- 35.
- Confirm that the pH is between 4 and 6 in one or more representative samples, by adding one drop of the mixture (from step 34) to litmus paper and observing the change in color.
- 36.
- Pour the sample into a 60 mg Waters Oasis HLB 3cc SPE column pre-rinsed with one volume of ethyl acetate and two volumes of methanol, and pre-conditioned with two volumes of SPE buffer containing 5% methanol and 0.1% acetic acid in Type I ultrapure water.
- 37.
- Rinse the column twice with SPE buffer before subjecting to 20 min of vacuum (≈20 psi).
- 38.
- Elute oxylipins with 0.5 mL methanol and 1.5 mL ethyl acetate and collect in a 2 mL centrifuge tube.
- 39.
- Dry the samples under nitrogen and reconstitute in 100 µL methanol.
3.7. Ultraperformance Liquid Chromatography-tandem Mass Spectrometer (UHPLC-MS/MS) Analysis. Time for Completion: 6:00 Hours per Batch of 12 Samples
- 40.
- Inject 10 µL of the sample into an Agilent LC system 1290, coupled to an Agilent 6460 Triple Quadrupole MS system (UPLC-MS/MS). The system is programmed to analyze 72 oxylipins species.
- 41.
- Separate oxylipin species on an Agilent Eclipse Plus C18 column (2.1 × 150 mm, 1.8 μm) at 45 °C with a binary gradient consisting of solvent A (water containing 0.1% acetic acid) and solvent B (acetonitrile:methanol (80:15 v:v) containing 0.1% acetic acid) (Table S1). Use electrospray ionization (negative mode) as the ion source with the experimental parameters as follows: gas temperature = 250 °C, gas flow = 10 L/min; sheath gas temperature = 300 °C; sheath gas flow = 11 mL/min; nebulizers = 35 psi; capillary voltage = 3500 V/−3500 V. The optimized mass-spectrometry parameters for measuring oxylipins are summarized in Table S2.
3.8. Cell Lysis Preparation for the Subsequent Extractions. Time for Completion: 0:15 Hours per Batch of 12 Samples
- 42.
- Incubate the frozen cell lysate in a heater set at 30 °C until thawed.
- 43.
- Centrifuge the lysate for 3 min at 14,000× g at room temperature, and transfer the supernatant to an AllPrep DNA spin column placed in a 2 mL collection tube.
- 44.
- Close the lid gently, centrifuge for 30 s at 8000× g.
![Mps 03 00061 i002]() . CRITICAL STEP: Up to 700 μL of sample can be loaded onto the AllPrep DNA spin column. Make sure that no liquid remains on the column membrane after centrifugation. If necessary, repeat the centrifugation until all liquid has passed through the membrane.
. CRITICAL STEP: Up to 700 μL of sample can be loaded onto the AllPrep DNA spin column. Make sure that no liquid remains on the column membrane after centrifugation. If necessary, repeat the centrifugation until all liquid has passed through the membrane. - 45.
- Transfer the AllPrep DNA spin column into a new 2 mL collection tube, and store at 4 °C for later DNA purification (starting at step 72).
3.9. Total RNA Purification. Time for Completion: 1:00 Hours per Batch of 12 Samples
- 46.
- To the flow-through from step 45, add 430 μL of 96–100% ethanol. Mix well using a pipette by drawing the liquid up and down.
- 47.
- To the RNeasy spin column in a 2 mL tube, transfer a maximum of 700 μL of sample onto the top.
- 48.
- Close the lid of each column, place into the centrifuge, and centrifuge for 15 s at 8000× g.
- 49.
- Transfer the flow-through to a 2 mL tube for small RNA and protein precipitation (step 60).
![Mps 03 00061 i002]() . CRITICAL STEP: If the sample volume is more than 700 μL, repeat the process until the entire sample has passed through the same RNeasy spin column. Collect the flow-through after each centrifugation to the same 2 mL tube.
. CRITICAL STEP: If the sample volume is more than 700 μL, repeat the process until the entire sample has passed through the same RNeasy spin column. Collect the flow-through after each centrifugation to the same 2 mL tube. - 50.
- Wash the RNeasy spin column by pipetting 350 μL of Buffer RW1 onto the RNeasy spin column and centrifuge for 15 s at 8000× g.
- Buffer RW1 contains guanidine thiocyanate, which will help to prevent any RNase activity and help to remove carbohydrates, fatty acids, proteins, and other biomolecules.
- 51.
- Mix 10 μL of DNase I stock solution and 70 μL of Buffer RDD (supplied from the RNase-free DNase Set). Gently invert the tube to mix, and centrifuge briefly to collect the solution to the bottom of the tube.
- Buffer RDD is used to prepare the DNase solution.
- 52.
- Add 80 μL of DNase I incubation mix from step 51 directly onto the RNeasy spin column membrane, and incubate for 15 min at room temperature.
- 53.
- Wash the RNeasy spin column again by adding 350 μL of Buffer RW1 to the RNeasy spin column and close the lid of each column. Centrifuge for 15 s at 8000× g and discard the flow-through.
- 54.
- Wash the spin column a third time by adding 500 μL of Buffer RPE. Close the lid of each spin column and centrifuge for 15 s at 8000× g. Discard the flow-through.
- Buffer RPE needs to be diluted with ethanol as instructed before use. Use to wash the spin column membrane to remove traces of salt.
- 55.
- Add another 500 μL of Buffer RPE to the RNeasy spin column and close the lid. Centrifuge for 2 min at 8000× g and discard the flow-through.
- 56.
- Place the RNeasy spin column in a new 2 mL tube. Centrifuge at 16,100× g for 1 min.
- 57.
- Place the RNeasy spin column in a new 1.5 mL tube and add 50 μL of RNase-free water directly to the spin column membrane.
- 58.
- Close the spin column lid, and centrifuge for 1 min at 8000× g to elute the RNA.
- 59.
- Aliquot 1 μL of the flow-through for a quality check via Nanodrop, 4 μL for analysis via the Bioanalyzer (using an Agilent RNA 6000 Nano Kit to prepare the sample), and 3 μL for quantification by Qubit (using the Qubit RNA HS Assay Kit to prepare the sample). The rest should be saved for mRNA analysis. Store samples at −80 °C.
- RNA samples can be stored at −80 °C for 1 year.
3.10. Small RNA Purification. Time for Completion: 1:10 Hours per Batch of 12 Samples
- 60.
- Add 600 μL of Buffer APP to the flow-through from step 49. Vortex for 5 s and incubate at room temperature for 10 min.
- Buffer APP contains zinc chloride to precipitate protein.
- 61.
- Centrifuge at 16,100× g for 10 min, and carefully transfer the supernatant to a new 5 mL tube. While transferring, measure the approximate volume (needed for the next step). Keep the pellet for total protein precipitation at room temperature (Step 69).
- 62.
- Add 1 volume of 100% ethanol to the supernatant from step 61, and mix well using a pipette by drawing the liquid up and down.
- 63.
- To the RNeasy MinElute spin column in a 2 mL tube (supplied in the RNeasy MinElute Cleanup Kit), transfer a maximum of 700 μL of the sample. Close the lid on each tube, and centrifuge for 15 s at 8000× g. Discard the flow-through and repeat until the entire sample has passed through the RNeasy MinElute membrane.
- 64.
- Place the RNeasy MinElute spin column in a new 2 mL tube. Add 500 μL of Buffer RPE to the spin column and close the lid. Centrifuge for 15 s at 8000× g and discard the flow-through.
- 65.
- Add 500 μL of 80% ethanol to the RNeasy MinElute spin column and close the lid. Centrifuge for 2 min at 8000× g and discard the flow-through and carefully place the RNeasy MinElute spin column into a new 2 mL collection tube.
- 66.
- Centrifuge at 16,100× g for 5 min keeping the lid of the spin column open to allow it to dry completely.
![Mps 03 00061 i002]() . CRITICAL STEP: To avoid damage to the lids, place the tubes with spin columns into the centrifuge with at least one empty position between them and orient the lids to point in a direction opposite to the rotation of the rotor.
. CRITICAL STEP: To avoid damage to the lids, place the tubes with spin columns into the centrifuge with at least one empty position between them and orient the lids to point in a direction opposite to the rotation of the rotor. - 67.
- Place the RNeasy MinElute spin column in a new 1.5 mL tube. Pipette 14 μL RNase-free water directly to the center of the spin column membrane and close the lid. Centrifuge for 1 min at 16,100× g to elute the small RNA.
- 68.
- Aliquot 1 μL of the flow-through for a quality check via Nanodrop and 3 μL for quantification by Qubit (using the Qubit microRNA Assay Kit for sample preparation). The remaining sample should be saved for small RNA analysis. Store the samples at −80 °C.
3.11. Total Protein Precipitation. Time for Completion: 0:15 Hours per Batch of 12 Samples
- 69.
- To the protein pellet obtained in step 61, add 500 μL of 70% ethanol.
- 70.
- Centrifuge at 16,100× g for 1 min, and remove the supernatant using a pipette, removing as much liquid as possible.
- 71.
- Dry the protein pellet for 10 min at room temperature until the pellet is completely dried.
![Mps 03 00061 i001]() . PAUSE STEP: Store the protein pellet at −80 °C.
. PAUSE STEP: Store the protein pellet at −80 °C.
3.12. DNA Purification. Time for Completion: 0:20 Hours per Batch of 12 Samples
- 72.
- Aliquot the required amount of Buffer EB and preheat to 70 °C to ensure optimal DNA elution.
- Buffer EB is used to elute DNA.
- 73.
- Add 500 μL of Buffer AW1 to the AllPrep DNA spin column from step 45 and close the lid of the tube. Centrifuge for 15 s at 8000× g and discard the flow-through.
- Buffer AW1 contains guanidine hydrochloride used to wash the spin column membrane. Buffer AW1 needs to be diluted with ethanol before use.
- 74.
- Pipette 500 μL of Buffer AW2 to the AllPrep DNA spin column and close the tube lid. Centrifuge for 2 min at 16,100× g.
- Buffer AW2 is used to wash the column. Buffer AW2 needs to be diluted with ethanol before use.
- 75.
- Carefully place the AllPrep DNA spin column in a new 1.5 mL tube.
![Mps 03 00061 i002]() . CRITICAL STEP: If the column contacts the flow-through, centrifuge the spin column again for 1 min at 16,100× g after emptying the collection tube.
. CRITICAL STEP: If the column contacts the flow-through, centrifuge the spin column again for 1 min at 16,100× g after emptying the collection tube. - 76.
- Add 100 μL Buffer EB preheated to 70 °C directly to the spin column membrane, close the lid, and incubate at room temperature for 2 min. Centrifuge for 1 min at 8000× g to elute the DNA.
- 77.
- Aliquot 1 μL of the flow-through for a quality check via Nanodrop and 3 μL for quantification by Qubit using Qubit dsDNA BR Assay Kit. The rest should be saved for the DNA analysis. Store the samples at −80 °C.
3.13. Protein Reconstitution and Quantification. Time for Completion: 1:10 Hours per Batch of 12 Samples
- 78.
- Set a heat block and benchtop centrifuge at 37 °C.
- 79.
- Add 100 µL of 5% w/v SDS into each tube with protein pellet from step 71.
- 80.
- Using a 100 μL pipette tip, physically poke to disturb the pellet into pieces.
- 81.
- Vortex the sample at high speed for 1 min.
- 82.
- Incubate the sample at 37 °C for 30 min.
- 83.
- Vortex the sample at high speed for 5 min.
- 84.
- If large pellets still remain at the bottom of the tubes, repeat incubation (15 min at 37 °C) and vortex for 5 min.
- 85.
- Centrifuge the sample at 14,000× g at 37 °C for 1 min.
- 86.
- Transfer the supernatant to a new tube.
- 87.
- Quantify the protein using the DC Protein assay kit with Synergy H1 Hybrid multi-mode reader.
3.14. Further Protein Purification. Time for Completion: 0:20 Hours per Batch of 12 Samples
- 88.
- Dilute the reconstituted protein sample to 5–10 mg/mL.
- 89.
- Add 100 µL of the diluted protein sample to a Zeba Spin desalting column (0.5 mL) following the manufacturer’s instructions.
- 90.
- If the volume of the protein sample is <70 µL, 15 μL of Type I water should be loaded as the stacker after the protein solution is fully absorbed to the resin bed.
- 91.
- Centrifuge at 1500× g for 2 min to collect the desalted sample.
4. Results
Supplementary Materials
Author Contributions
Funding
Acknowledgments
Conflicts of Interest
References
- Roume, H.; Heintz-Buschart, A.; Muller, E.E.; Wilmes, P. Sequential isolation of metabolites, RNA, DNA, and proteins from the same unique sample. Methods Enzymol. 2013, 531, 219–236. [Google Scholar] [CrossRef]
- Roume, H.; Muller, E.E.; Cordes, T.; Renaut, J.; Hiller, K.; Wilmes, P. A biomolecular isolation framework for eco-systems biology. ISME J. 2013, 7, 110–121. [Google Scholar] [CrossRef] [PubMed] [Green Version]
- O’Sullivan, A.; Willoughby, R.E.; Mishchuk, D.; Alcarraz, B.; Cabezas-Sanchez, C.; Condori, R.E.; David, D.; Encarnacion, R.; Fatteh, N.; Fernandez, J.; et al. Metabolomics of cerebrospinal fluid from humans treated for rabies. J. Proteome Res. 2013, 12, 481–490. [Google Scholar] [CrossRef] [PubMed] [Green Version]
- Holland, N.T.; Smith, M.T.; Eskenazi, B.; Bastaki, M. Biological sample collection and processing for molecular epidemiological studies. Mutat. Res. 2003, 543, 217–234. [Google Scholar] [CrossRef]
- Sheng, Q.; Vickers, K.; Zhao, S.; Wang, J.; Samuels, D.C.; Koues, O.; Shyr, Y.; Guo, Y. Multi-perspective quality control of Illumina RNA sequencing data analysis. Brief. Funct. Genom. 2017, 16, 194–204. [Google Scholar] [CrossRef] [PubMed] [Green Version]
- Gallego Romero, I.; Pai, A.A.; Tung, J.; Gilad, Y. RNA-seq: Impact of RNA degradation on transcript quantification. BMC Biol. 2014, 12, 42. [Google Scholar] [CrossRef] [PubMed] [Green Version]
- Harlow, E.; Lane, D. Antibodies: A Laboratory Manual, 2nd ed.; Harlow, E., Lane, D., Eds.; Cold Spring Harbor Press: Cold Spring Harbor, NY, USA, 1988; ISBN 0879693142. [Google Scholar]
- Stepanenko, O.V.; Stepanenko, O.V.; Kuznetsova, I.M.; Shcherbakova, D.M.; Verkhusha, V.V.; Turoverov, K.K. Distinct Effects of Guanidine Thiocyanate on the Structure of Superfolder GFP. PLoS ONE 2012, 7, e48809. [Google Scholar] [CrossRef] [PubMed] [Green Version]
- Folch, J.; Lees, M.; Stanley, G.H.S. A Simple Method for the Isolation and Purification of Total Lipides from Animal Tissues. J. Biol. Chem. 1957, 226, 497–509. [Google Scholar] [PubMed]

© 2020 by the authors. Licensee MDPI, Basel, Switzerland. This article is an open access article distributed under the terms and conditions of the Creative Commons Attribution (CC BY) license (http://creativecommons.org/licenses/by/4.0/).
Share and Cite
Hasegawa, Y.; Otoki, Y.; McClorry, S.; Coates, L.C.; Lombardi, R.L.; Taha, A.Y.; Slupsky, C.M. Optimization of a Method for the Simultaneous Extraction of Polar and Non-Polar Oxylipin Metabolites, DNA, RNA, Small RNA, and Protein from a Single Small Tissue Sample. Methods Protoc. 2020, 3, 61. https://doi.org/10.3390/mps3030061
Hasegawa Y, Otoki Y, McClorry S, Coates LC, Lombardi RL, Taha AY, Slupsky CM. Optimization of a Method for the Simultaneous Extraction of Polar and Non-Polar Oxylipin Metabolites, DNA, RNA, Small RNA, and Protein from a Single Small Tissue Sample. Methods and Protocols. 2020; 3(3):61. https://doi.org/10.3390/mps3030061
Chicago/Turabian StyleHasegawa, Yu, Yurika Otoki, Shannon McClorry, Laurynne C. Coates, Rachel L. Lombardi, Ameer Y. Taha, and Carolyn M. Slupsky. 2020. "Optimization of a Method for the Simultaneous Extraction of Polar and Non-Polar Oxylipin Metabolites, DNA, RNA, Small RNA, and Protein from a Single Small Tissue Sample" Methods and Protocols 3, no. 3: 61. https://doi.org/10.3390/mps3030061