Testing Luminescence Dating Methods for Small Samples from Very Young Fluvial Deposits


Abstract
1. Introduction
1.1. Background
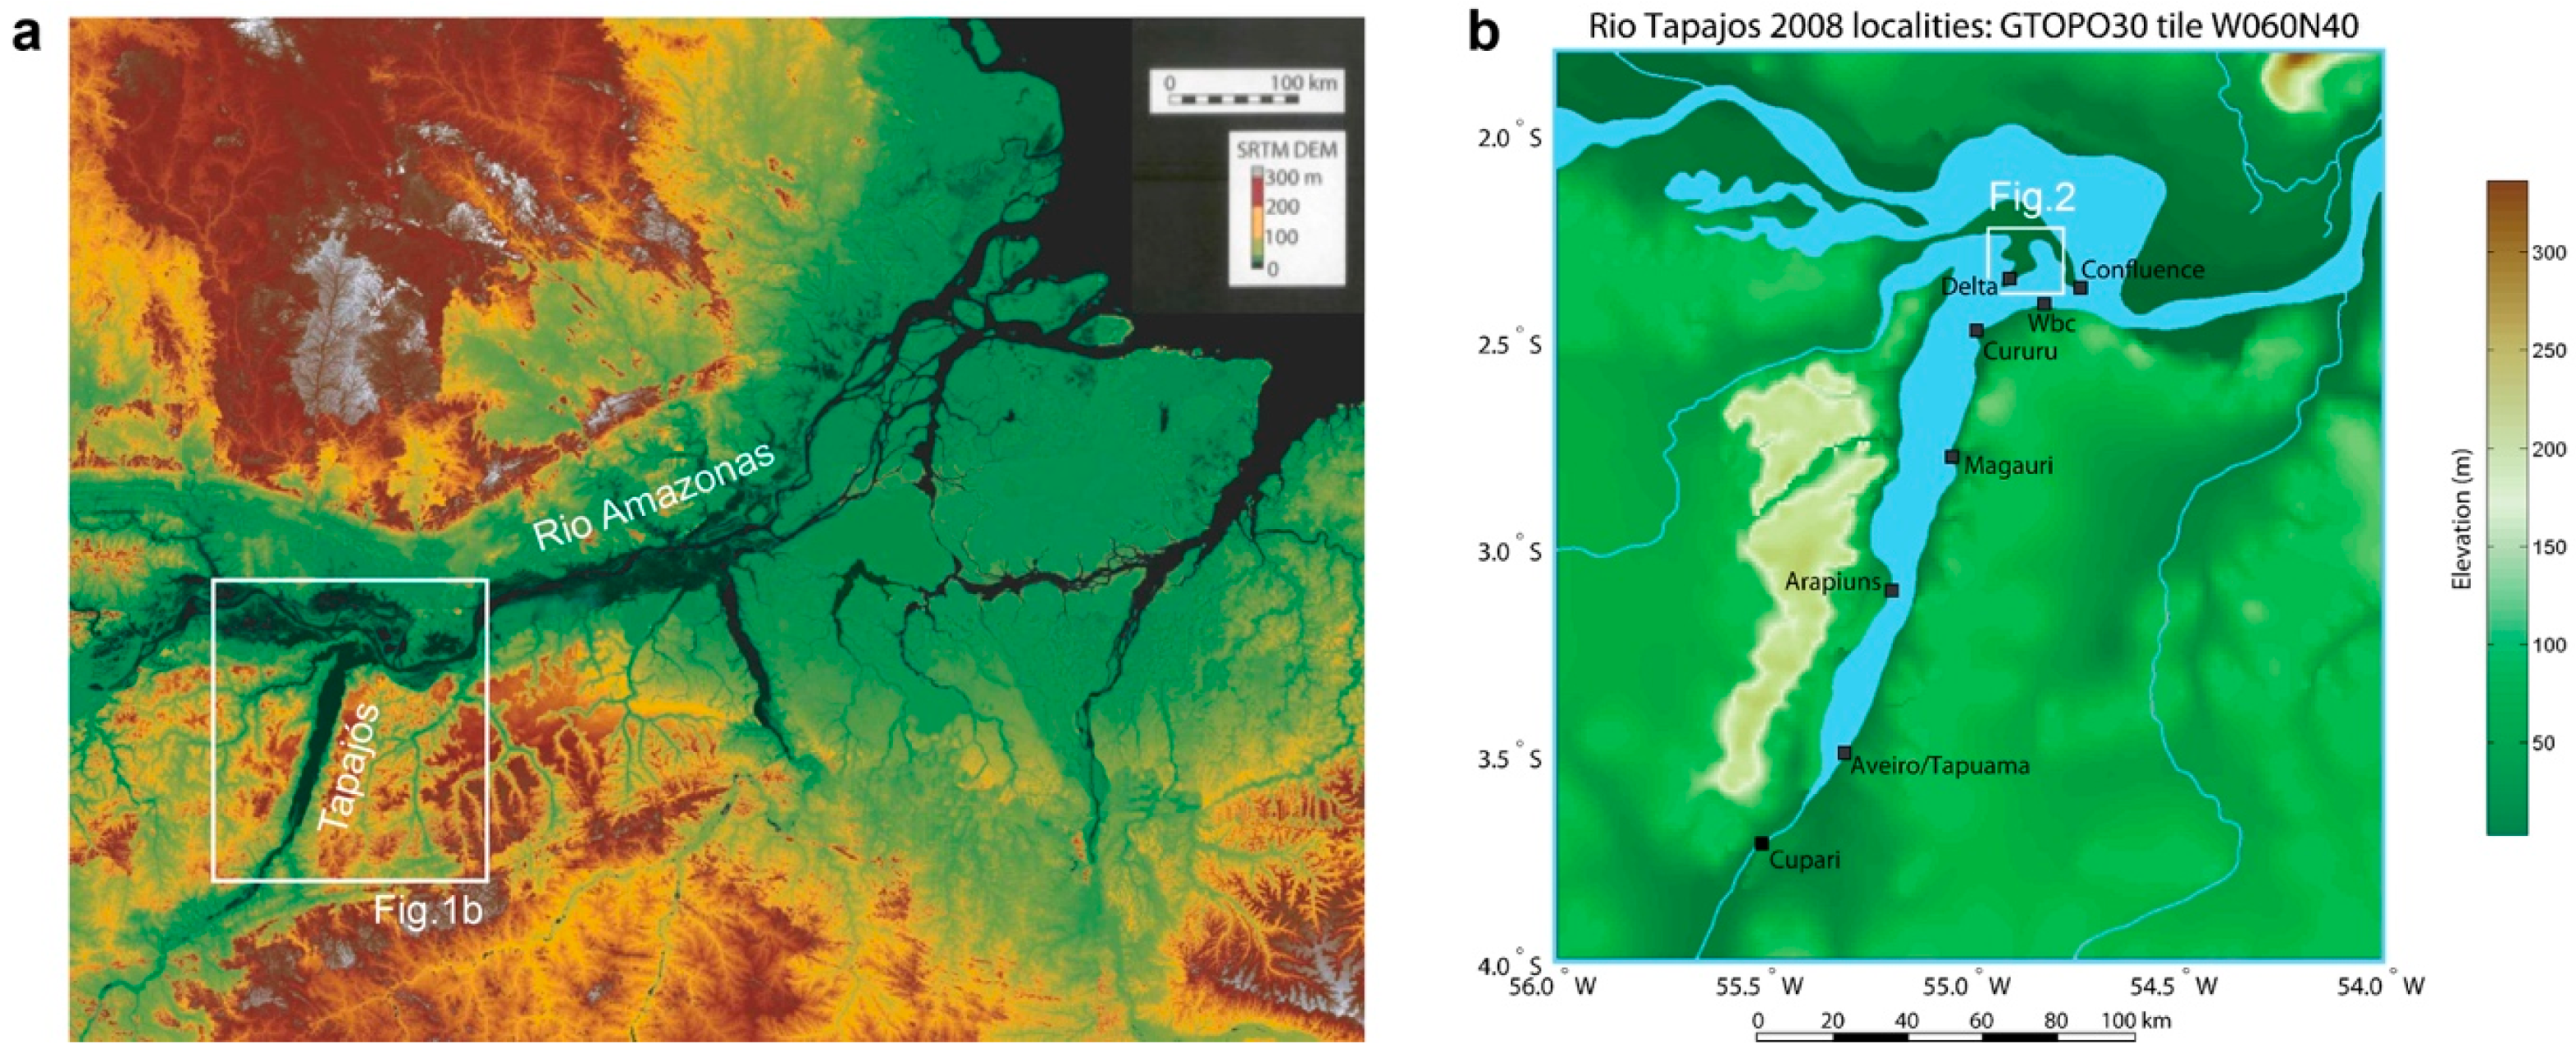
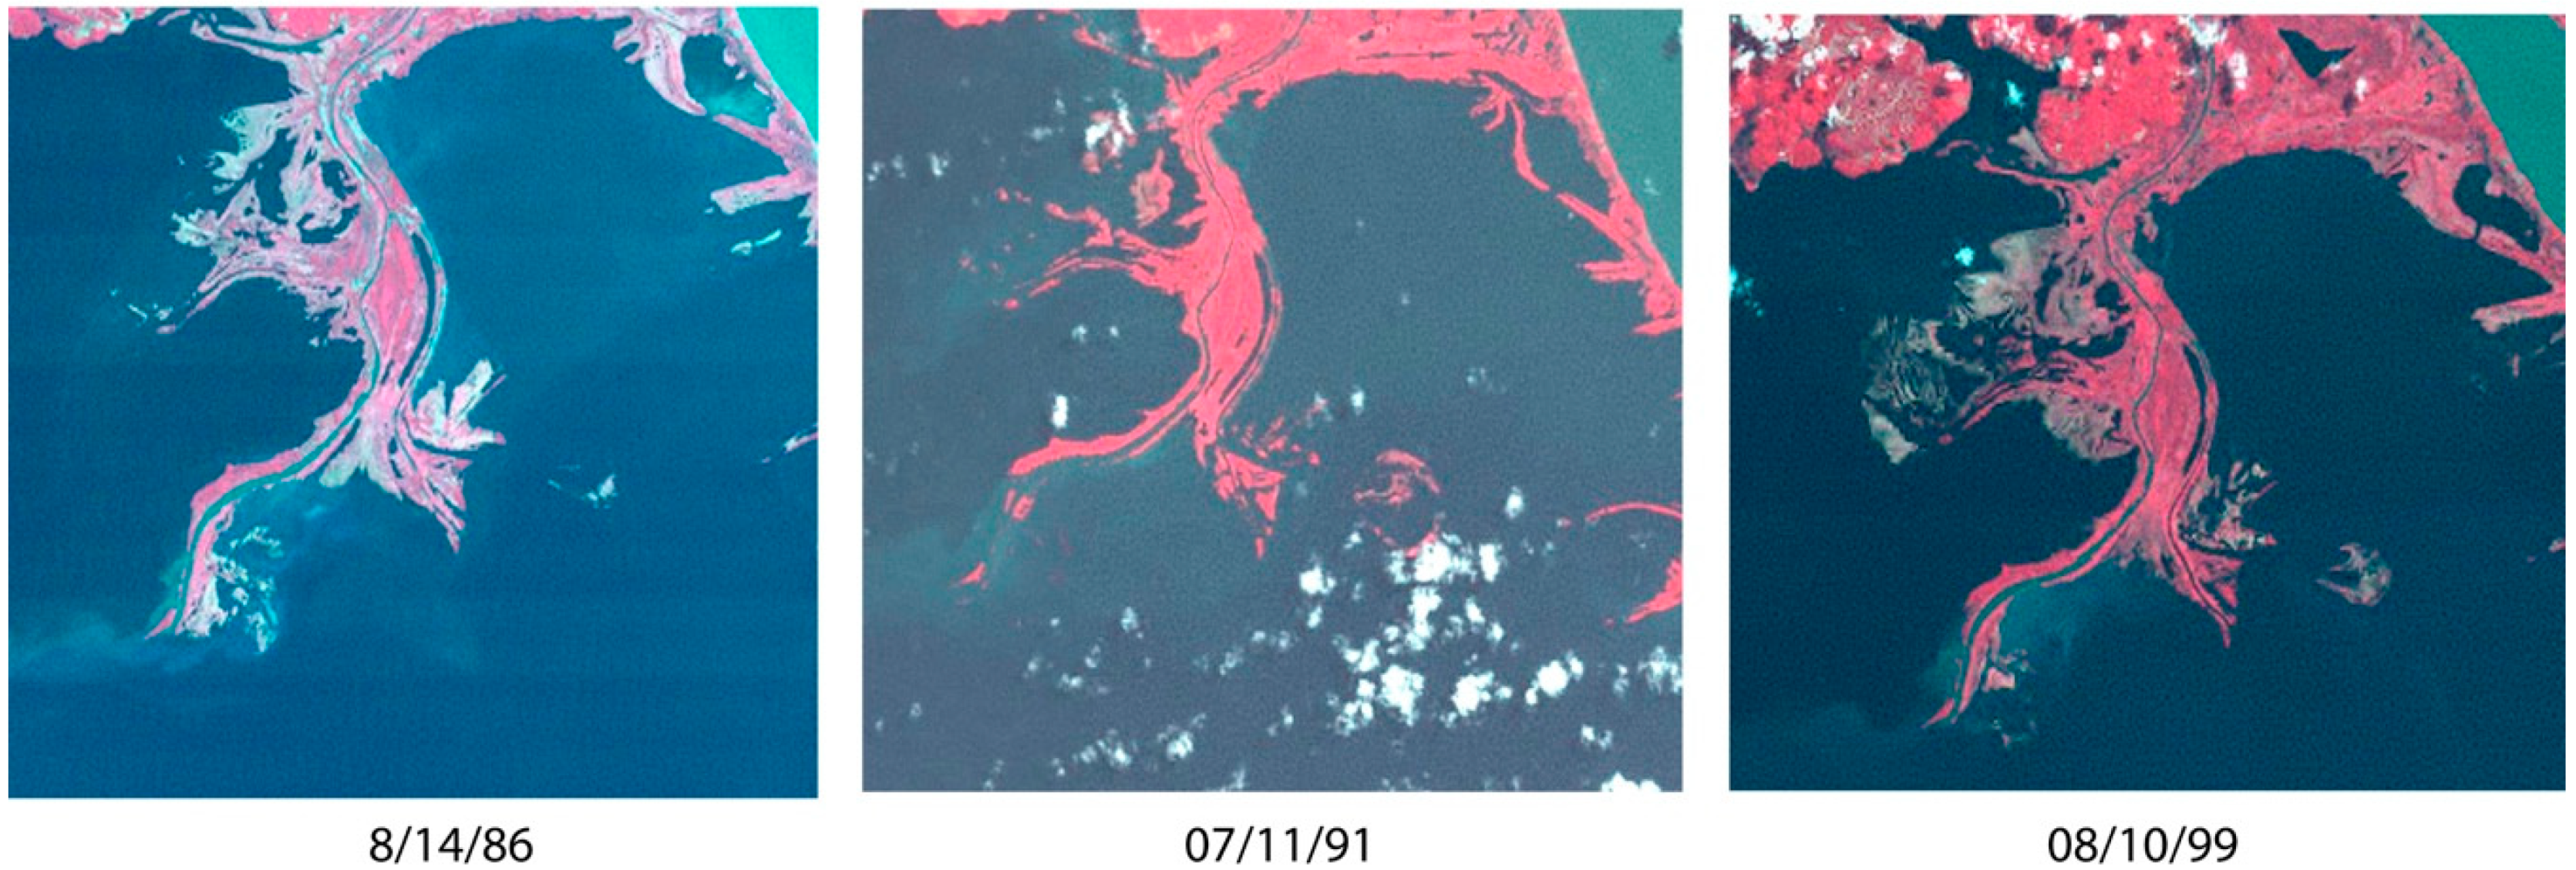
1.2. Geologic Setting
2. Study Area and Sampling
3. Luminescence Studies
3.1. Sample Preparation
3.2. Measurements
3.3. Luminescence Characteristics
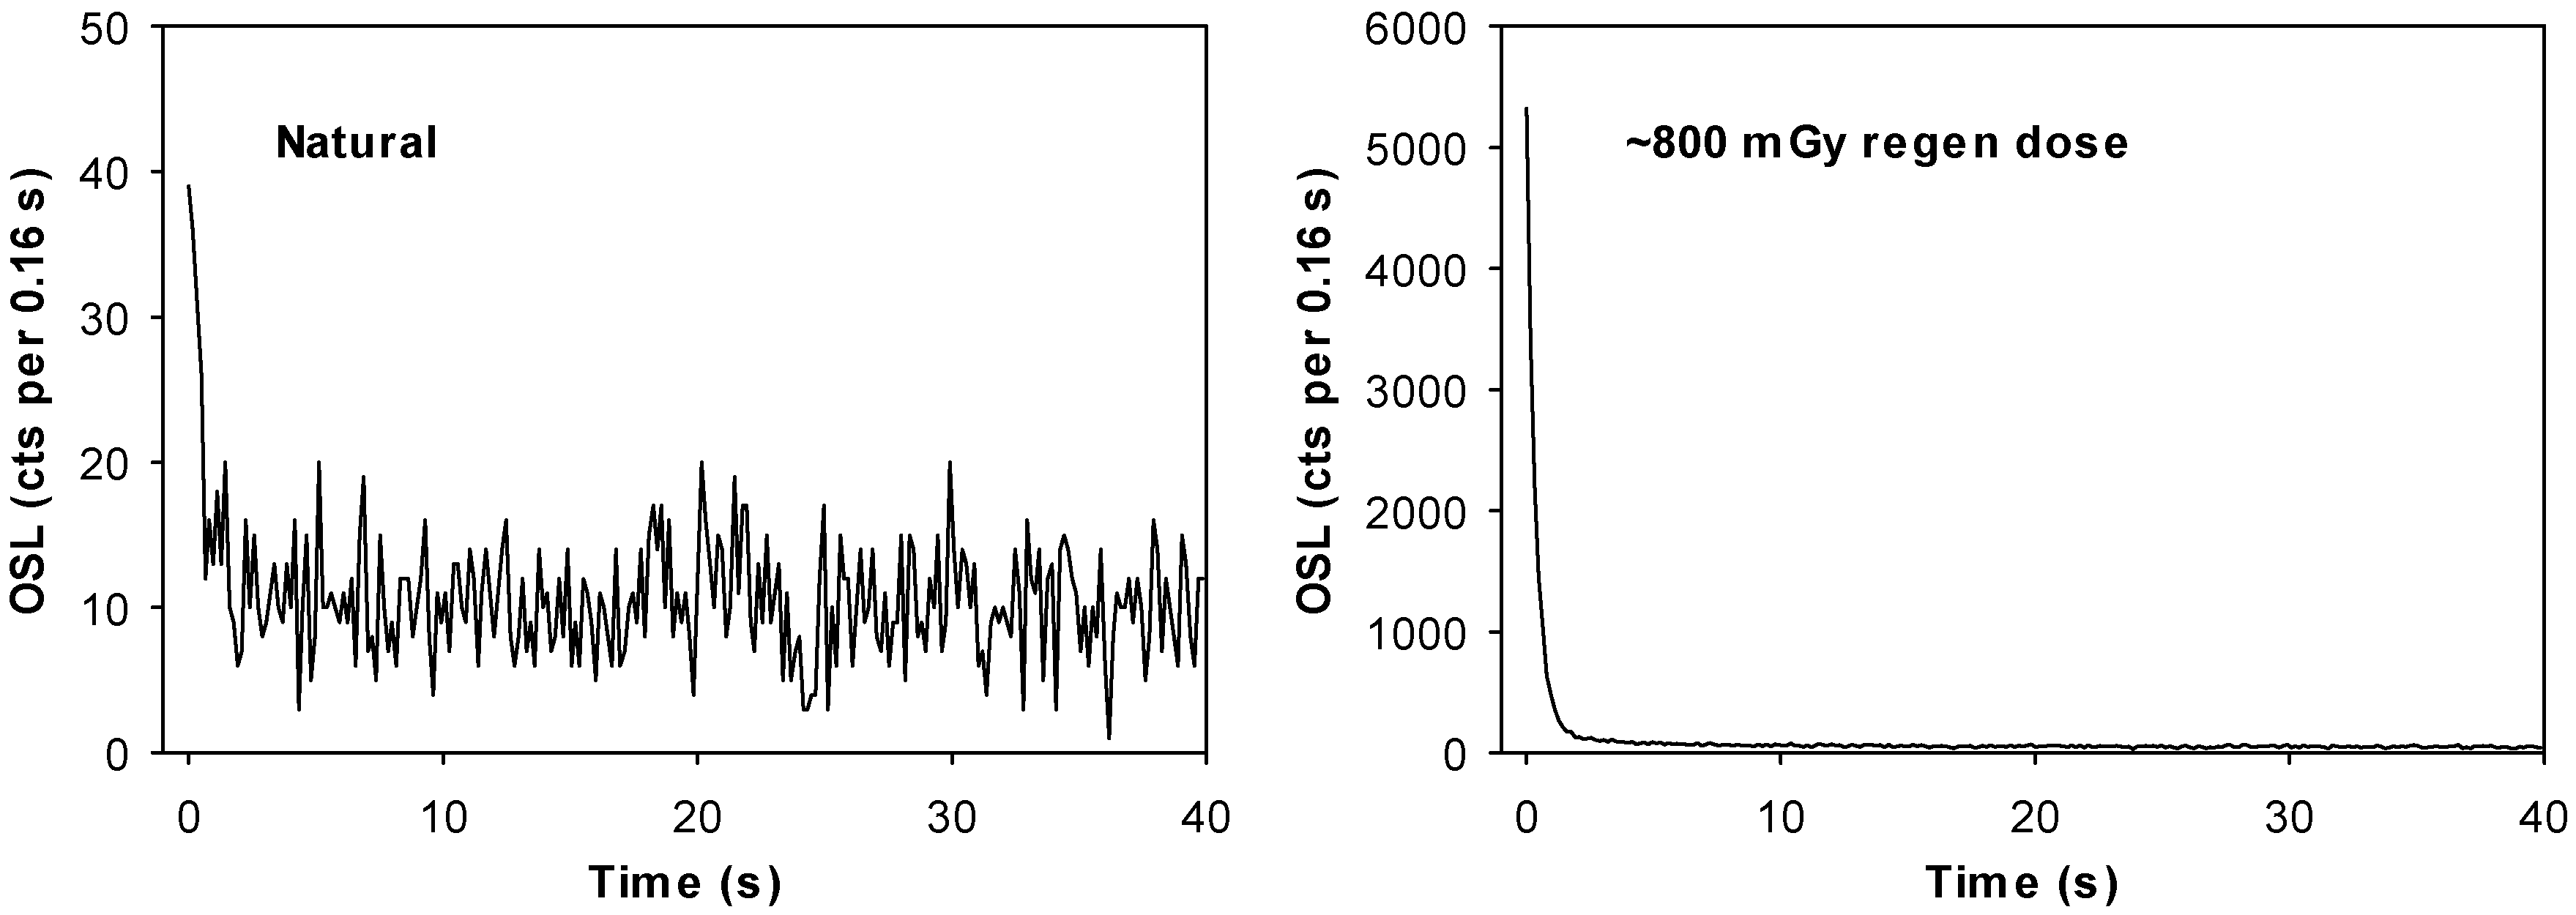
3.3.1. Specific Sensitivity of OSL Signals
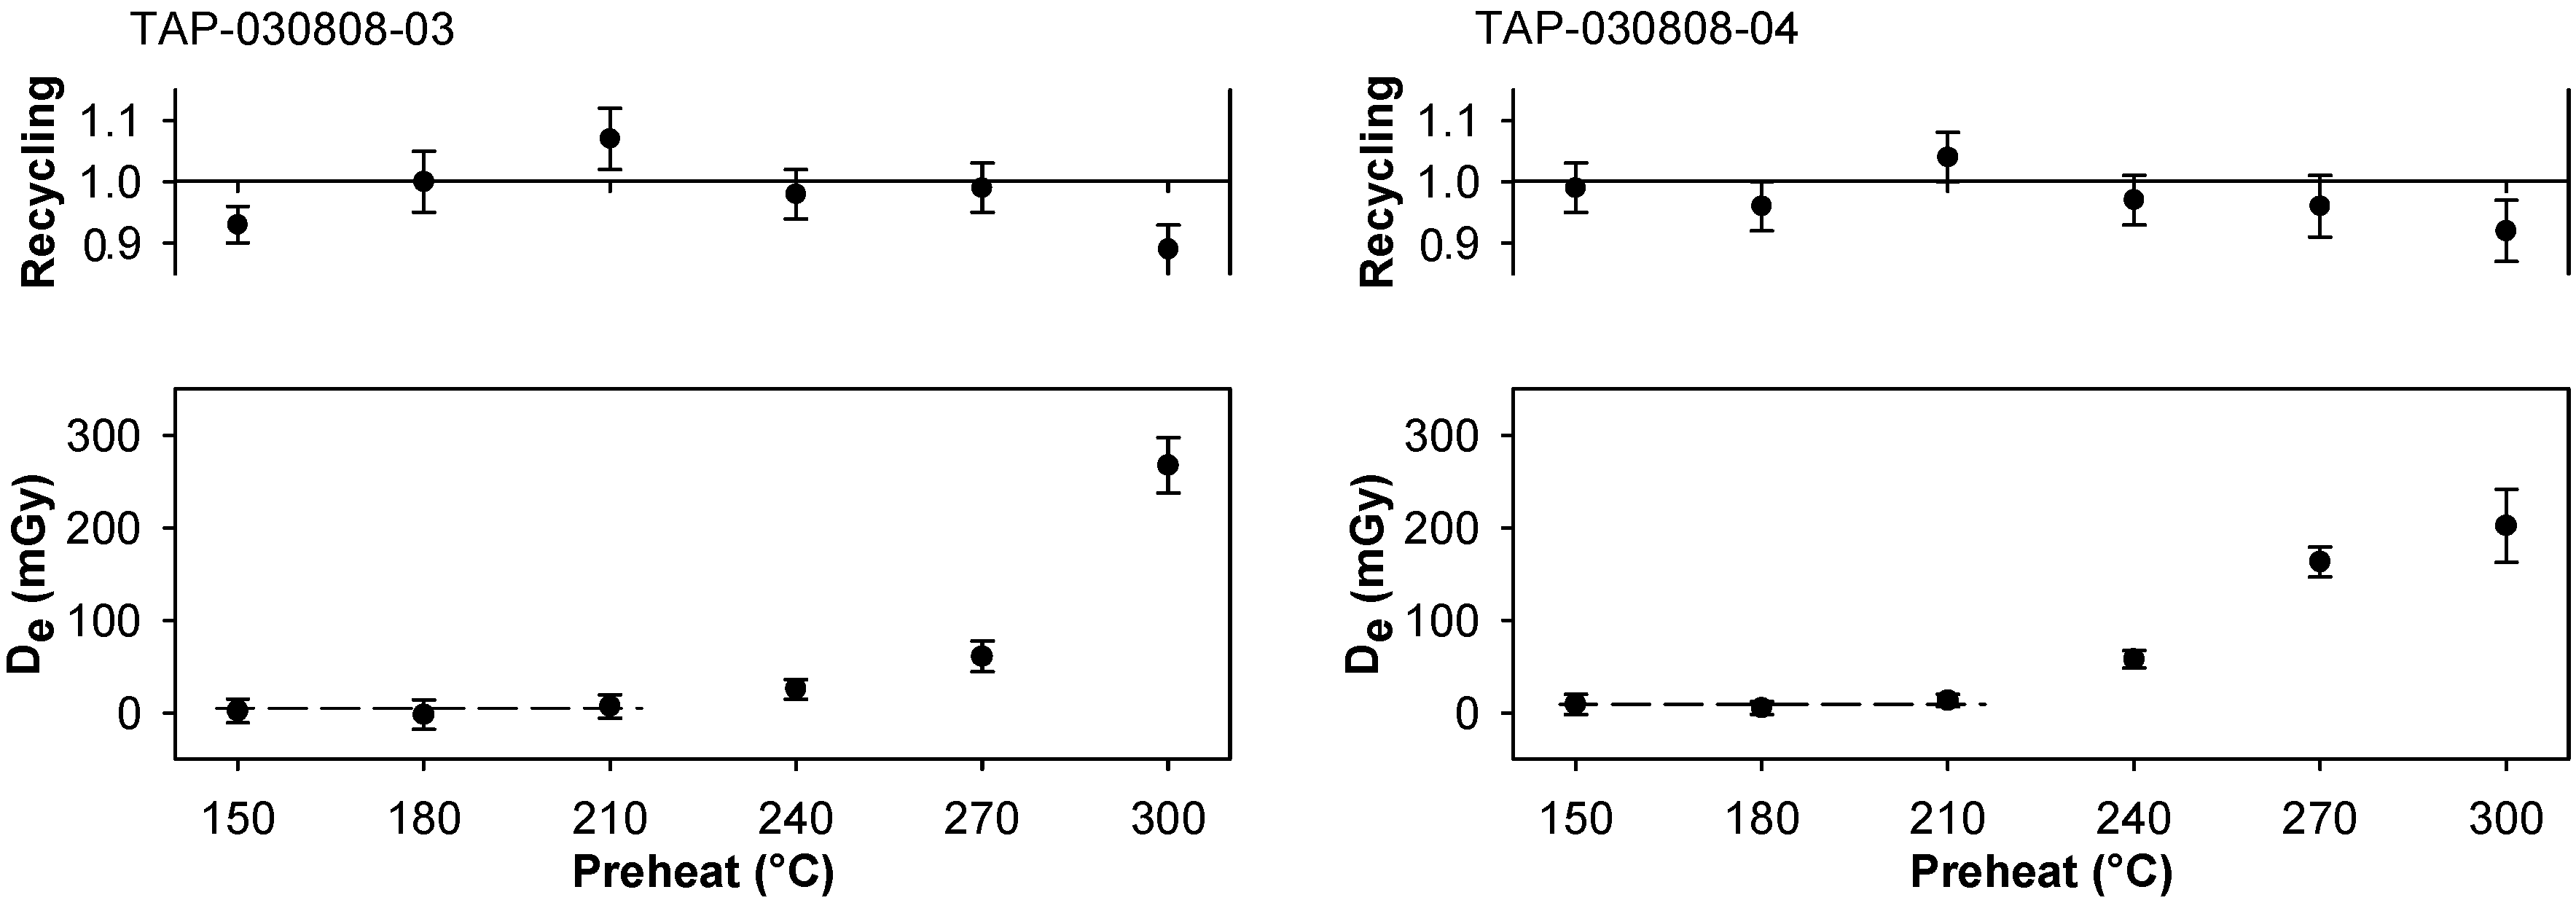
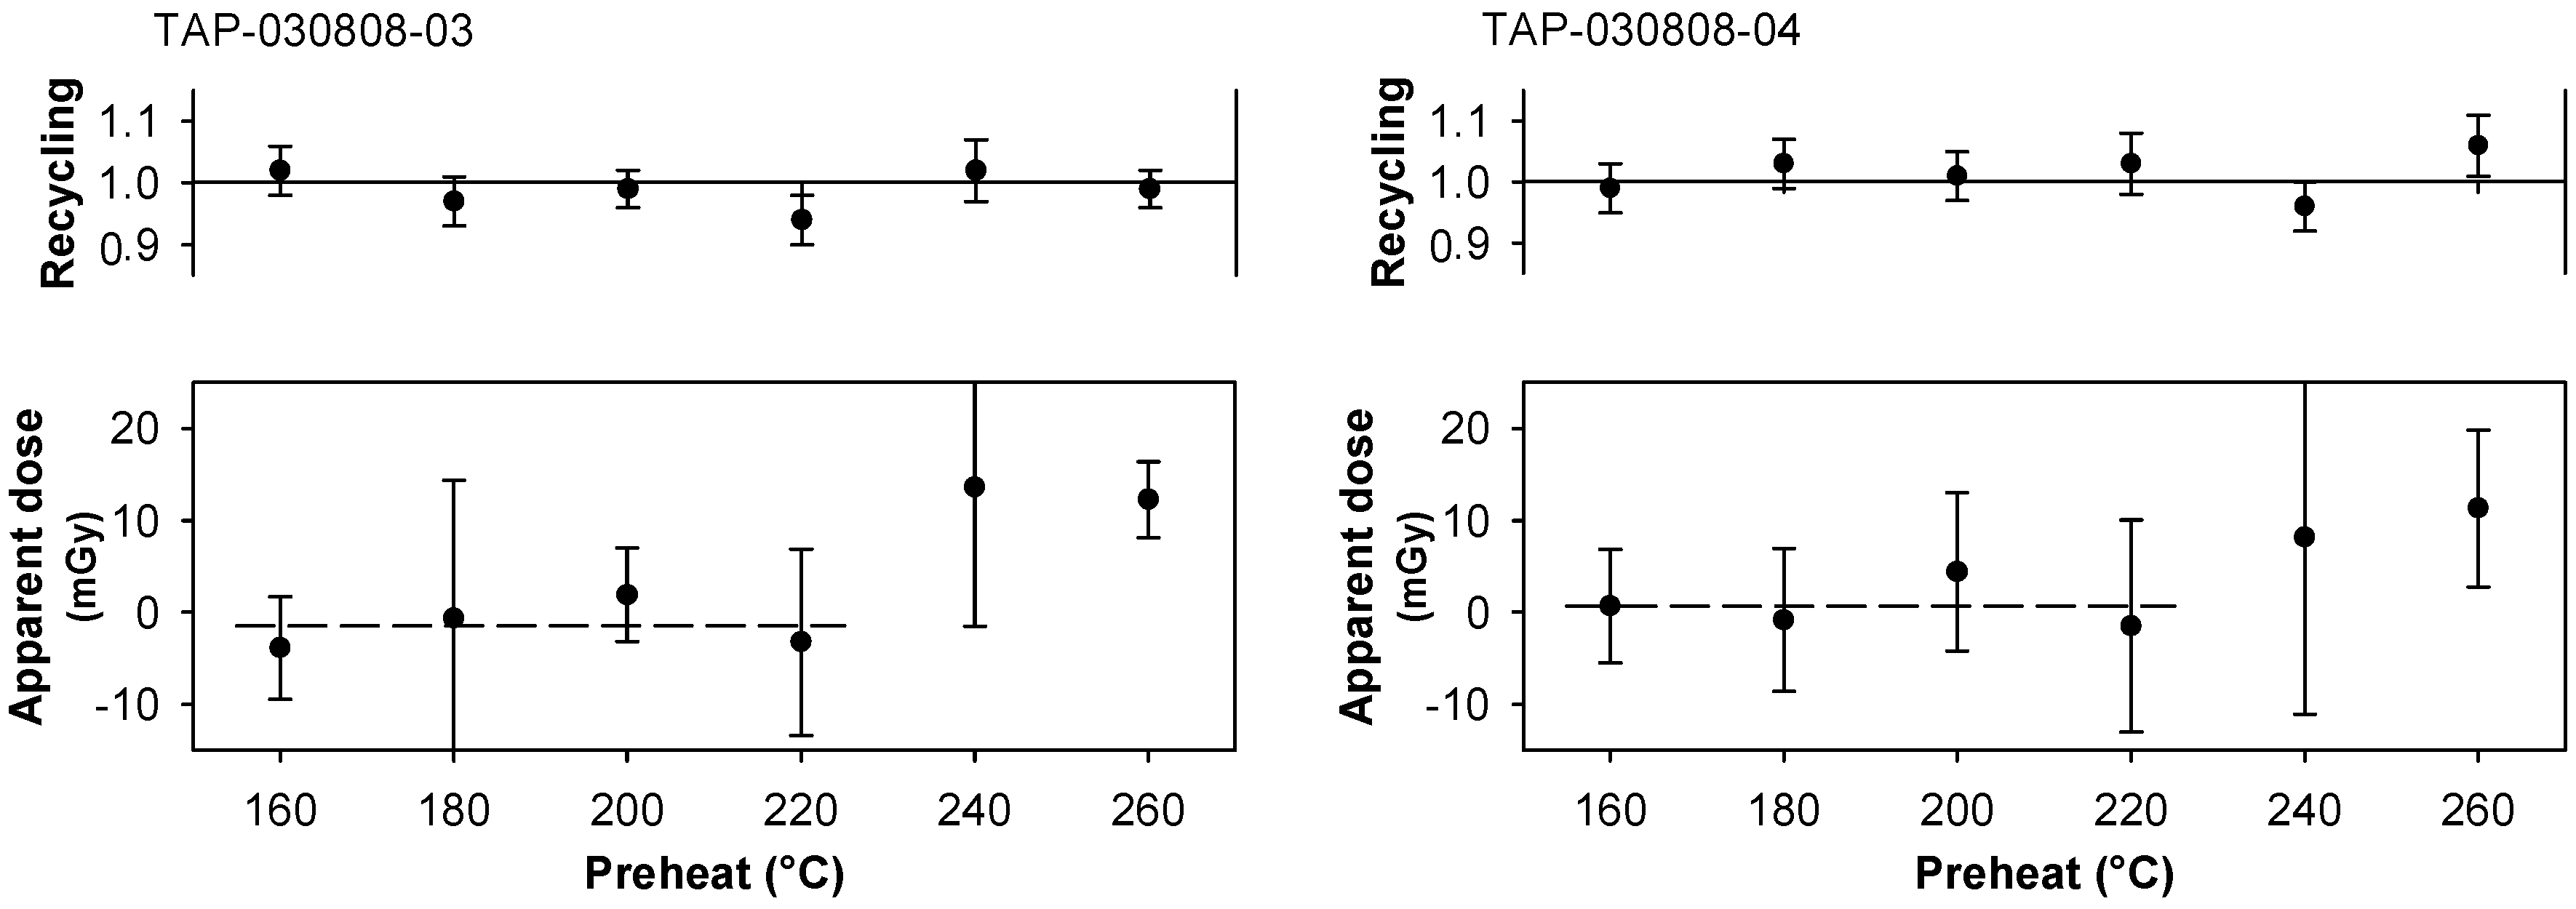
3.3.2. Effect of Preheating
3.3.3. Dose Recovery Tests
3.4. Towards OSL Dating of Multi-Grain Quartz Aliquots
4. Conclusions
Author Contributions
Funding
Acknowledgments
Conflicts of Interest
References
- Thomsen, K.J.; Murray, A.S.; Jain, M.; Bøtter-Jensen, L. Laboratory fading rates of various luminescence signals from feldspar-rich sediment extracts. Radiat. Meas. 2008, 43, 1474–1486. [Google Scholar] [CrossRef]
- Thomsen, K.J.; Murray, A.S.; Jain, M. Stability of IRSL signals from sedimentary K-feldspar samples. Geochronometria 2011, 38, 1–13. [Google Scholar] [CrossRef]
- Olley, J.M.; Caitcheon, G.G.; Murray, A.S. The distribution of apparent dose as determined by optically stimulated luminescence in small aliquots of fluvial quartz: Implications for dating young sediments. Quat. Sci. Rev. 1998, 17, 1033–1040. [Google Scholar] [CrossRef]
- Pietsch, T.J. Optically stimulated luminescence dating of young (<500 years old) sediments: Testing estimates of burial dose. Quat. Geochronol. 2009, 4, 406–422. [Google Scholar] [CrossRef]
- Wallinga, J.; Hobo, N.; Cunningham, A.C.; Versendaal, A.J.; Makaske, B.; Middelkoop, H. Sedimentation rates on embanked floodplains determined through quartz optical dating. Quat. Geochronol. 2010, 5, 170–175. [Google Scholar] [CrossRef]
- Arnold, L.J.; Roberts, R.G.; Galbraith, R.F.; DeLong, S.B. A revised burial dose estimation procedure for optical dating of young and modern-age sediments. Quat. Geochronol. 2009, 4, 306–325. [Google Scholar] [CrossRef]
- Ballarini, M.; Wallinga, J.; Murray, A.S.; van Heteren, S.; Oost, A.P.; Bos, A.J.J.; van Eijk, C.W.E. Optical dating of young coastal dunes on a decadal time scale. Quat. Sci. Rev. 2003, 22, 1011–1017. [Google Scholar] [CrossRef]
- Ballarini, M.; Wallinga, J.; Wintle, A.G.; Bos, A.J.J. Analysis of equivalent-dose distributions for single grains of quartz from modern deposits. Quat. Geochronol. 2007, 2, 77–82. [Google Scholar] [CrossRef]
- Ballarini, M.; Wallinga, J.; Wintle, A.G.; Bos, A.J.J. A modified SAR protocol for optical dating of individual grains from young quartz samples. Radiat. Meas. 2007, 42, 360–369. [Google Scholar] [CrossRef]
- Nielsen, A.; Murray, A.S.; Pejrup, M.; Elberling, B. Optically stimulated luminescence dating of a beach ridge plain in Northern Jutland, Denmark. Quat. Geochronol. 2006, 1, 305–312. [Google Scholar] [CrossRef]
- Buckland, C.E.; Bailey, R.M.; Thomas, D.S.G. Using post-IR IRSL and OSL to date young (<200 yrs) dryland aeolian dune deposits. Radiat. Meas. 2019, 126, 106131. [Google Scholar] [CrossRef]
- Soares, E.A.A.; Tatumi, S.H.; Riccomini, C. OSL age determinations of Pleistocene fluvial deposits in Central Amazonia. Ann. Braz. Acad. Sci. 2010, 82, 691–699. [Google Scholar] [CrossRef]
- Fiore, M.; Soares, E.A.A.; Mittani, J.C.R.; Yee, M.; Tatumi, S.H. OSL dating of sediments from Negro and Solimões rivers – Amazon, Brazil. Radiat. Phys. Chem. 2014, 95, 113–115. [Google Scholar] [CrossRef]
- Rossetti, D.F.; Cohen, M.C.; Tatumi, S.H.; Sawakuchi, A.O.; Cremon, É.H.; Mittani, J.C.; Bertani, T.C.; Munita, C.J.A.S.; Tudela, D.R.G.; Yee, M.; et al. Mid-Late Pleistocene OSL chronology in western Amazonia and implications for the transcontinental Amazon pathway. Sediment. Geol. 2015, 330, 1–15. [Google Scholar] [CrossRef]
- Araki, L.A.; Sawakuchi, A.O.; Nogueira, L.; Turra, B.B. OSL dating of wave-generated sand bars in the lower Tapajós River, eastern Amazônia. In Proceedings of the 9th New World Luminescence Dating Workshop, Logan, UT, USA, 15–18 August 2013. [Google Scholar]
- Caldas, M.M.; Walker, R.T.; Arima, E.; Perz, S.; Aldrich, S.; Simmons, C.; Wood, C. Theorizing Land Cover and Land Use Change: The Peasant Economy of Amazonian Deforestation. Ann. Assoc. Am. Geogr. 2007, 97, 86–110. [Google Scholar] [CrossRef]
- Nepstad, D.C.; Stickler, C.M.; Soares-Filho, B.; Merry, F. Interactions among Amazon land use, forests and climate: Prospects for a near-term forest tipping point. Philos. Trans. R. Soc. B 2008, 363, 1737–1746. [Google Scholar] [CrossRef] [PubMed]
- Arima, E.; Richards, P.; Walker, R.T.; Caldas, M.M. Statistical confirmation of indirect land use change in the Brazilian Amazon. Environ. Res. Lett. 2011, 6, 024010. [Google Scholar] [CrossRef]
- Houghton, R.A. Land-use change and the carbon cycle. Glob. Chang. Biol. 1995, 1, 275–287. [Google Scholar] [CrossRef]
- Dale, V.H.; Pearson, S.M.; Offerman, H.L.; O’Neill, R.V. Relating patterns of land-use change to faunal biodiversity in the Central Amazon. Conserv. Biol. 1994, 8, 1027–1036. [Google Scholar] [CrossRef]
- Farella, N.; Lucotte, M.; Louchouarn, P.; Roulet, M. Deforestation modifying terrestrial organic transport in the Rio Tapajós, Brazilian Amazon. Org. Geochem. 2001, 32, 1443–1458. [Google Scholar] [CrossRef]
- Archer, A.W. Review of Amazonian depositional systems. In Fluvial Sedimentology VII; Blum, M., Marriott, S., Leclair, S.F., Eds.; Blackwell: Oxford, UK, 2005; pp. 17–39. [Google Scholar]
- Hoorn, C.; Roddaz, M.; Dino, R.; Soares, E.; Uba, C.; Mapes, R. The Amazonian Craton and its Influence on Past Fluvial Systems (Mesozoic-Cenozoic, Amazonia). In Amazonia, Landscape and Species Evolution, 1st ed.; Chapter 7; Hoorn, C., Wesselingh, F.P., Eds.; Blackwell Publishing Ltd.: Hoboken, NJ, USA, 2009; pp. 101–122. [Google Scholar]
- Freitas, P.T.A.; Asp, N.E.; Souza-Filho, P.W.M.; Nittrouer, C.A.; Ogston, A.S.; Da Silva, M.S. Tidal influence on the hydrodynamics and sediment entrapment in a major Amazon River tributary—Lower Tapajós River. J. S. Am. Earth Sci. 2017, 79, 189–201. [Google Scholar] [CrossRef]
- Fricke, A.T.; Nittrouer, C.A.; Ogston, A.S.; Nowacki, D.J.; Asp, N.E.; Souza Filho, P.W.M.; Da Silva, M.S.; Jalowska, A.M. River tributaries as sediment sinks: Processes operating where the Tapajós and Xingu rivers meet the Amazon tidal river. Sedimentology 2017, 64, 1731–1753. [Google Scholar] [CrossRef]
- NASA. Shuttle Radar Topography Mission. Available online: http://www2.jpl.nasa.gov/srtm/ (accessed on 6 December 2019).
- Earth Resources Observation and Science Center/U.S. Geological Survey/U.S. Department of the Interior. USGS 30 ARC-Second Global Elevation Data, GTOPO30. Research Data Archive at the National Center for Atmospheric Research, Computational and Information Systems Laboratory. 1997. Available online: https://doi.org/10.5065/A1Z4-EE71 (accessed on 6 December 2019).
- Shen, R.; Pennell, K.; Suuberg, E.M. Influence of Soil Moisture on Soil Gas Vapor Concentration for Vapor Intrusion. Environ. Eng. Sci. 2013, 30, 628–637. [Google Scholar] [CrossRef] [PubMed]
- Spencer, J.Q.G.; Robinson, R.A.J. Dating intramontane alluvial deposits from NW Argentina using luminescence techniques: Problems and potential. Geomorphology 2008, 93, 144–156. [Google Scholar] [CrossRef]
- Bøtter-Jensen, L.; Andersen, C.E.; Duller, G.A.T.; Murray, A.S. Developments in radiation, stimulation and observation facilities in luminescence measurements. Radiat. Meas. 2003, 37, 535–541. [Google Scholar] [CrossRef]
- Murray, A.S.; Wintle, A.G. Luminescence dating of quartz using an improved single-aliquot regenerative-dose protocol. Radiat. Meas. 2000, 32, 57–73. [Google Scholar] [CrossRef]
- Murray, A.S.; Wintle, A.G. The single-aliquot regenerative-dose protocol: Potential for improvements in reliability. Radiat. Meas. 2003, 37, 377–381. [Google Scholar] [CrossRef]
- Wintle, A.G.; Murray, A.S. A review of quartz optically stimulated luminescence characteristics and their relevance in single-aliquot regeneration dating protocols. Radiat. Meas. 2006, 41, 369–391. [Google Scholar] [CrossRef]
- Wallinga, J.; Murray, A.S.; Bøtter-Jensen, L. Measurement of the dose in quartz in the presence of feldspar contamination. Radiat. Prot. Dosim. 2002, 101, 367–370. [Google Scholar] [CrossRef]
- Lukas, S.; Spencer, J.Q.G.; Robinson, R.A.J.; Benn, D.I. Problems associated with luminescence dating of Late Quaternary glacial sediments in the NW Scottish Highlands. Quat. Geochronol. 2007, 2, 243–248. [Google Scholar] [CrossRef]
- Morrocco, S.M.; Ballantyne, C.K.; Spencer, J.Q.G.; Robinson, R.A.J. Age and significance of aeolian sediment reworking on high plateaux in the Scottish Highlands. Holocene 2007, 17, 349–360. [Google Scholar] [CrossRef]
- Ashley, G.M.; Ndiema, E.; Spencer, J.Q.G.; Harris, J.W.K.; Kiura, P.W. Paleoenvironmental context of archaeological sites, implications of subsistence strategies under Holocene climate change, northern Kenya. Geoarchaeology 2011, 26, 809–837. [Google Scholar] [CrossRef]
- Ashley, G.M.; Ndiema, E.; Spencer, J.Q.G.; Du, A.; Lordan, P.T.; Kiura, P.W.; Dibble, L.; Harris, J.W.K. Paleoenvironmental Reconstruction of Dongodien, Lake Turkana, Kenya and OSL Dating of Site Occupation during Late Holocene Climate Change. Afr. Archaeol. Rev. 2017, 34, 345–362. [Google Scholar] [CrossRef]
- Rittase, W.M.; Kirby, E.; McDonald, E.; Walker, J.D.; Gosse, J.; Spencer, J.Q.G.; Herrs, A.J. Temporal variations in Holocene slip rate along the central Garlock fault, Pilot Knob Valley, California. Lithosphere 2014, 6, 48–58. [Google Scholar] [CrossRef]
- Spencer, J.Q.G.; Oviatt, C.G.; Pathak, M.; Fan, Y. Testing and refining the timing of hydrologic evolution during the latest Pleistocene regressive phase of Lake Bonneville. Quat. Int. 2015, 362, 139–145. [Google Scholar] [CrossRef]
- Cunningham, A.C.; Wallinga, J. Selection of integration time intervals for quartz OSL decay curves. Quat. Geochronol. 2010, 5, 657–666. [Google Scholar] [CrossRef]
- Duller, G.A.T. Assessing the error on equivalent dose estimates derived from single aliquot regenerative dose measurements. Anc. TL 2007, 25, 15–24. [Google Scholar]
- Adamiec, G.; Aitken, M.J. Dose-rate conversion factors: Update. Anc. TL 1998, 16, 37–50. [Google Scholar]
- Spencer, J.Q.; Owen, L.A. Optically stimulated luminescence dating of Late Quaternary glaciogenic sediments in the upper Hunza valley: Validating the timing of glaciation and assessing dating methods. Quat. Sci. Rev. 2004, 23, 175–191. [Google Scholar] [CrossRef]
- Prescott, J.R.; Hutton, J.T. Cosmic ray contributions to dose rates for luminescence and ESR dating: Large depths and long-term time variations. Radiat. Meas. 1994, 23, 497–500. [Google Scholar] [CrossRef]
- Spencer, J.Q.G.; Alghamdi, A.G.; Presley, D.; Huot, S.; Martin, L.; Mercier, N. Attic dust from historic buildings: Progress dating young mm-thick layers. In Proceedings of the 15th International Conference on Luminescence and Electron Spin Resonance Dating, Capetown, South Africa, 11–15 September 2017. [Google Scholar]
- Vandenberghe, D.; De Corte, F.; Buylaert, J.P.; Kučera, J.; Van den haute, P. On the internal radioactivity in quartz. Radiat. Meas. 2008, 43, 771–775. [Google Scholar] [CrossRef]
- Sawakuchi, A.O.; Mineli, T.D.; Nogueira, L.; Henrique Grohmann, C.; Guedes, C.C.F. OSL and IRSL as a proxy for the origin and transport of sands in the Amazon river. In Proceedings of the 14th International Conference on Luminescence and Electron Spin Resonance Dating, Montréal, QC, Canada, 7–11 July 2014. [Google Scholar]
- Markey, B.; Bøtter-Jensen, L.; Duller, G.A.T. A new flexible system for measuring thermally and optically stimulated luminescence. Radiat. Meas. 2007, 27, 83–89. [Google Scholar] [CrossRef]
- Aitken, M.J.; Smith, B.W.; Rhodes, E.J. Optical dating: Recapitulation on recuperation. In Proceedings of the a Workshop on Long and Short Range Limits in Luminescence Dating, Oxford, UK, 11–13 April 1989. [Google Scholar]
- Galbraith, R.F.; Roberts, R.G.; Yoshida, H. Error variation in OSL palaeodose estimates from single aliquots of quartz: A factorial experiment. Radiat. Meas. 2005, 39, 289–307. [Google Scholar] [CrossRef]
- Galbraith, R.F.; Roberts, R.G.; Laslett, G.M.; Yoshida, H.; Olley, J.M. Optical dating of single and multiple grains of quartz from Jinmium rock shelter, northern Australia: Part I, experimental design and statistical models. Archaeometry 1999, 41, 339–364. [Google Scholar] [CrossRef]
- Spencer, J.Q.; Sanderson, D.C.W.; Deckers, K.; Sommerville, A.A. Assessing mixed dose distributions in young sediments identified using small aliquots and a simple two-step SAR procedure: The F-statistic as a diagnostic tool. Radiat. Meas. 2003, 37, 425–431. [Google Scholar] [CrossRef]


| Sample a | Lat., Long. (°S, °W) | n b | Preheat c (°C) | Recuperation threshold d | σb, Dee (%) | Def (mGy) | Dose Rate (mGya−1) | Age g (a) |
|---|---|---|---|---|---|---|---|---|
| ARA-040808-05 | 3°6′3″ | 18 (22) | 220 | 35% | 0 | 10.1 ± 0.86 c | 0.42 ± 0.04 | 24 ± 3 |
| 55°13′39″ | ||||||||
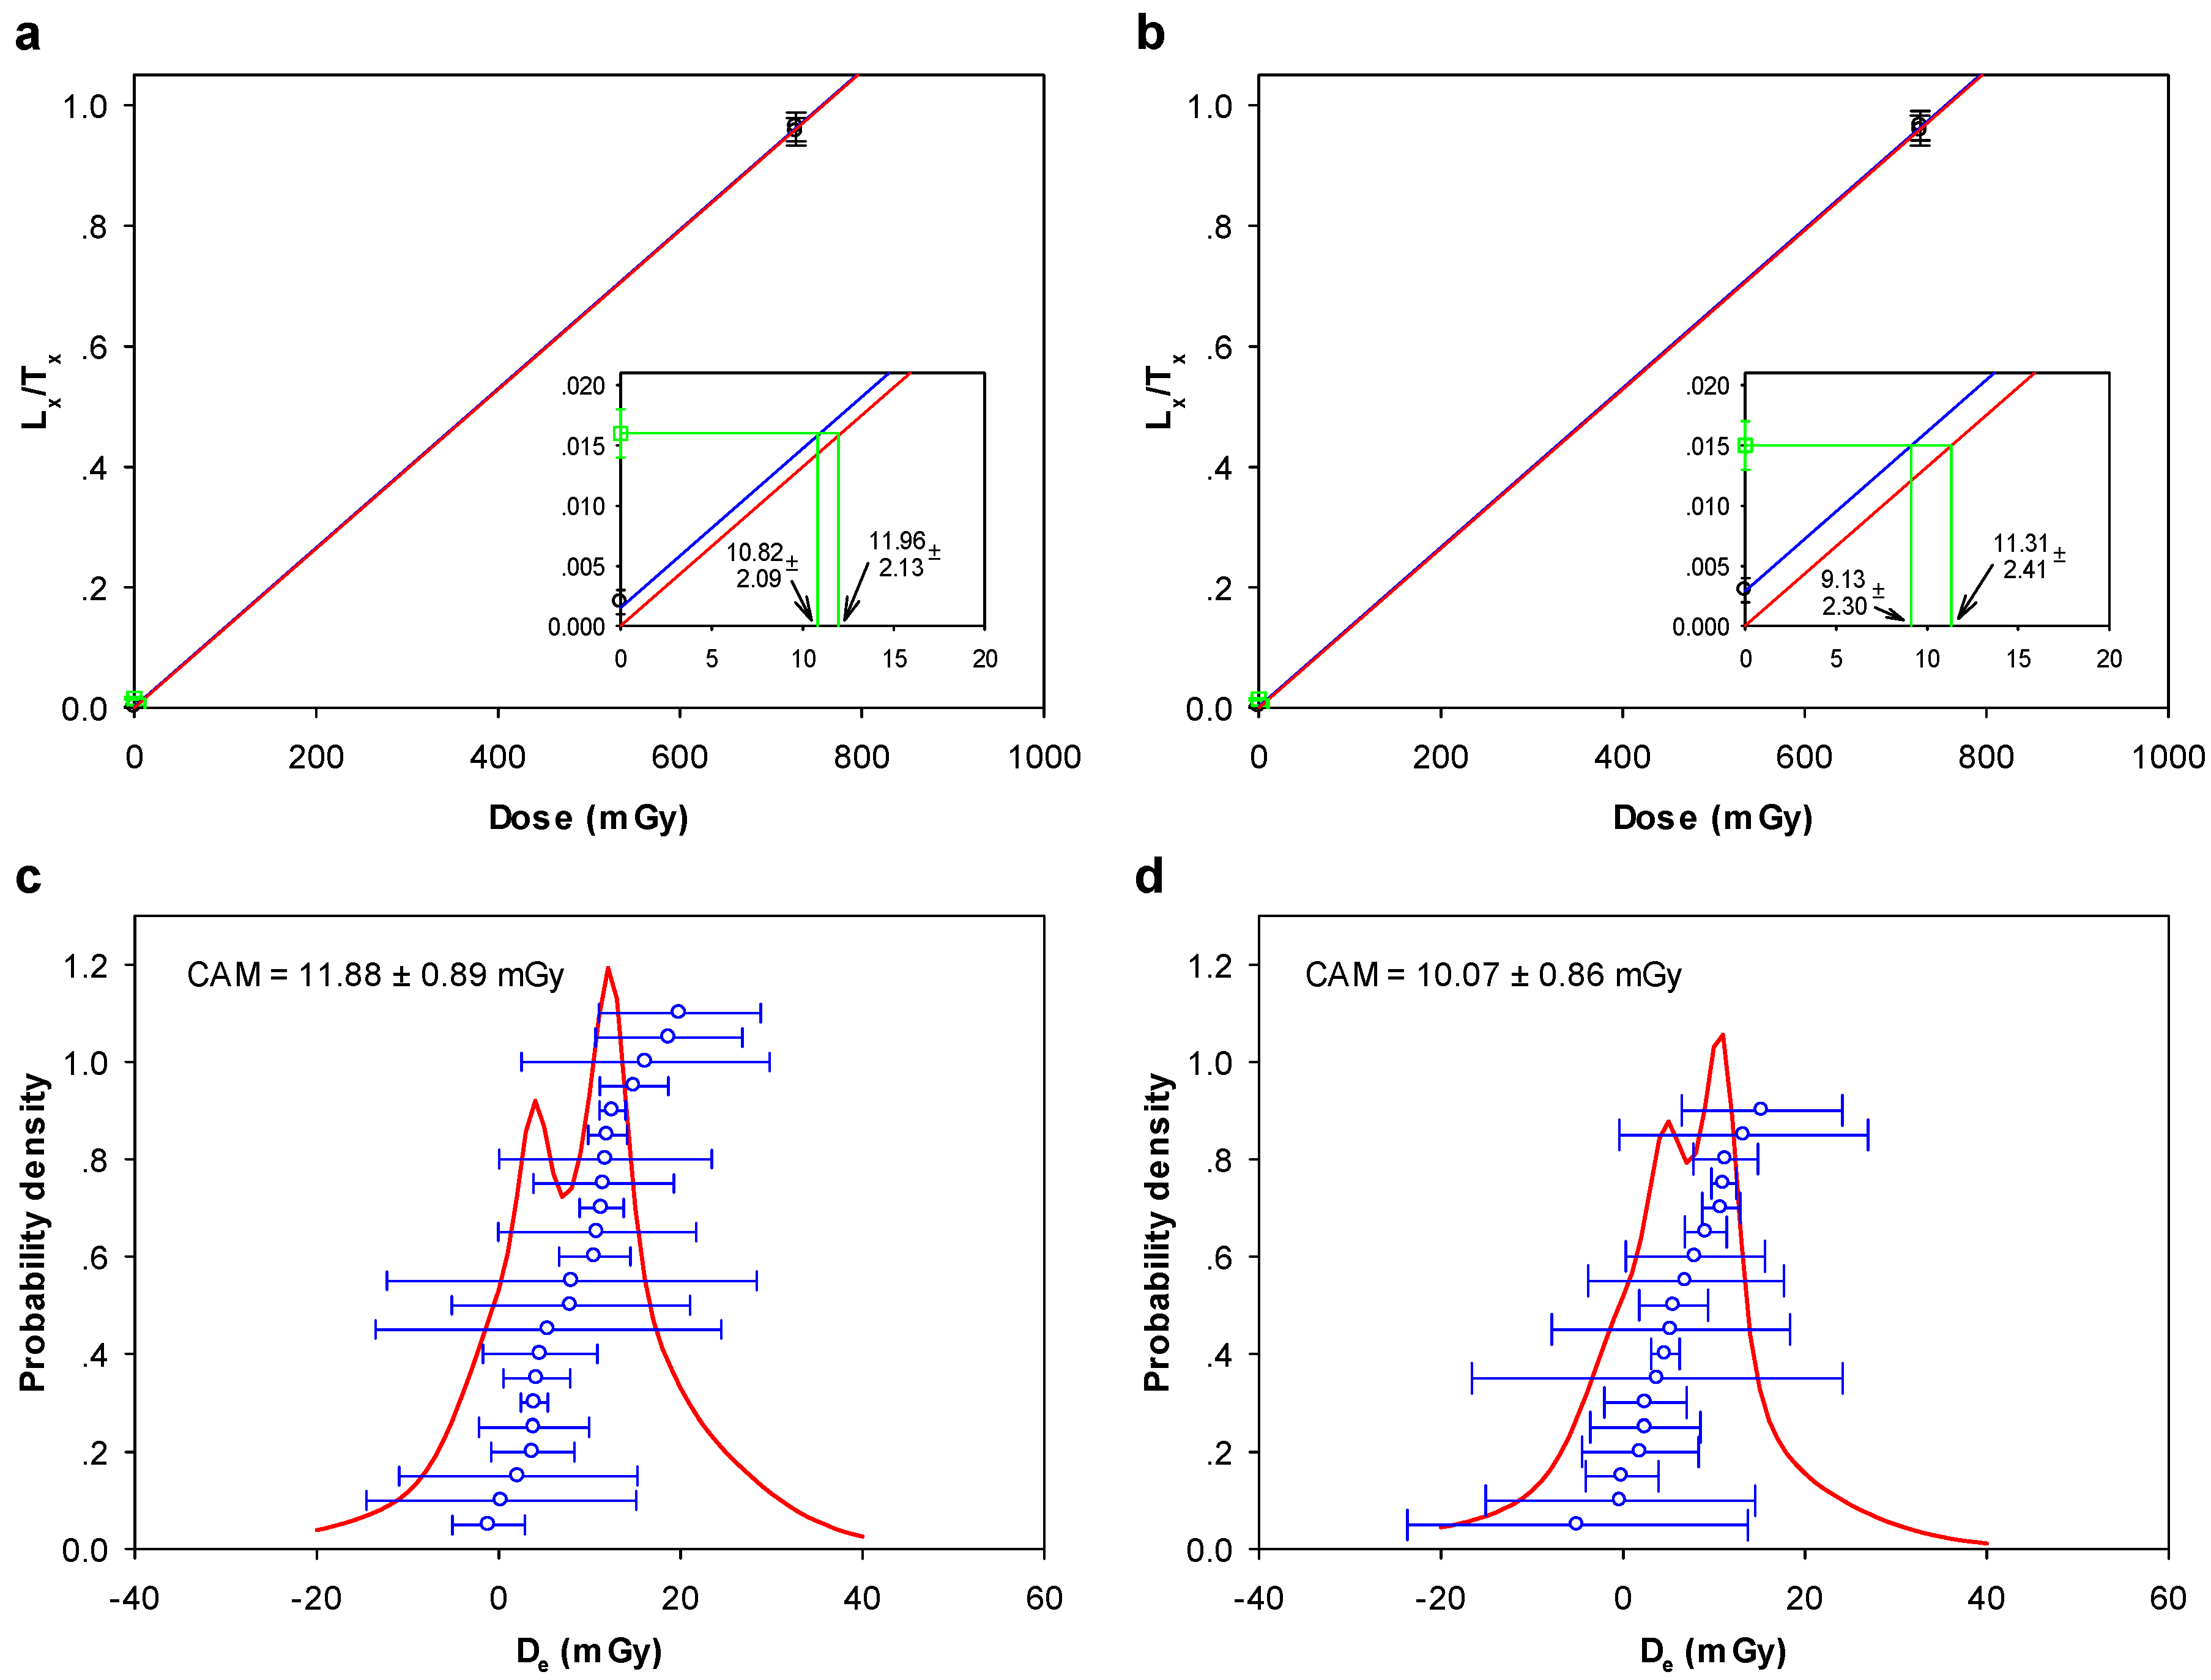
| TAP-030808-03 | 3°29′33″ | 12 (12) | 200 | Origin fit | 0 | 4.10 ± 1.56 c | 0.31 ± 0.02 | 13 ± 5 |
| 55°15′41″ | ||||||||
| TAP-030808-04 | 3°29′31″ | 12 (12) | 200 | Origin fit | 0 | 12.2 ± 2.83 c | 0.36 ± 0.03 | 34 ± 8 |
| 55°15′39″ | ||||||||
| CUP-030808-01 | 3°42′44″ | 10 (10) | 200 | 5% | 20.1 | 147 ± 9.80 m | 0.46 ± 0.03 | 324 ± 29 |
| 55°23′45″ | ||||||||
| CUP-030808-02 | 3°42′44″ | 23 (23) | 220 | 5% | 13.3 | 261 ± 7.48 c | 0.47 ± 0.03 | 557 ± 35 |
| 55°23′45″ |
© 2019 by the authors. Licensee MDPI, Basel, Switzerland. This article is an open access article distributed under the terms and conditions of the Creative Commons Attribution (CC BY) license (http://creativecommons.org/licenses/by/4.0/).
Share and Cite
Spencer, J.Q.G.; Huot, S.; Archer, A.W.; Caldas, M.M. Testing Luminescence Dating Methods for Small Samples from Very Young Fluvial Deposits. Methods Protoc. 2019, 2, 90. https://doi.org/10.3390/mps2040090
Spencer JQG, Huot S, Archer AW, Caldas MM. Testing Luminescence Dating Methods for Small Samples from Very Young Fluvial Deposits. Methods and Protocols. 2019; 2(4):90. https://doi.org/10.3390/mps2040090
Chicago/Turabian StyleSpencer, Joel Q. G., Sébastien Huot, Allen W. Archer, and Marcellus M. Caldas. 2019. "Testing Luminescence Dating Methods for Small Samples from Very Young Fluvial Deposits" Methods and Protocols 2, no. 4: 90. https://doi.org/10.3390/mps2040090
APA StyleSpencer, J. Q. G., Huot, S., Archer, A. W., & Caldas, M. M. (2019). Testing Luminescence Dating Methods for Small Samples from Very Young Fluvial Deposits. Methods and Protocols, 2(4), 90. https://doi.org/10.3390/mps2040090