Abstract
In this third paper in a series of four, the focus is to investigate the modern UK economy, considering a wider scope than economic growth and national performance. Since the beginnings of sustained economic growth, standard of living has increased dramatically in the UK and life expectancy and health outcomes have improved. Economic growth has proven itself throughout history, and globally, as a transformative force to lift people out of poverty and improve standard of living. However, significant inequalities, which are contributing to negative health, social and economic outcomes for groups of the population, persist. A growing nation has become a divided nation.
JEL Classification:
O1
1. Introduction
Purpose of the paper: Our foremost goal is to offer a concise, non-specialist coverage of economic growth and its contribution to transforming the world. How better to tell its story than through the lens of the world’s first growing economy?
In this third paper in a series of four, we approach economic growth from a new perspective: access to growth’s benefits. We survey literature to present the current socio-economic landscape of the UK and its structural and historical origins, in a manner accessible to those with or without a background in Economics.
First, we investigate whether the allocation of increasing national wealth as a result of growth has facilitated an equitable distribution of standards of living and opportunity. We learn that economic inequality in the UK is a complex web of spatial and skills mismatches, irregular dispersions of poverty and pockets of disconnection that struggle to access the benefits of economic growth. We discuss interregional and intraregional variation in economic outcomes, the role of employment in income and wealth discrepancies and the historical roots of the modern-day UK economic landscape.
We consider the societal and health impacts of these disparities, detailing the widening gaps in life expectancies, educational outcomes and employment prospects across the UK. Further, we assess the political-economics that have coincided with, and contributed to, an economically divided nation.
Next, we welcome you to the knowledge economy—the current phase of economic development, where intangible goods and services drive a digital era of economic growth. We investigate whether the era of knowledge is thus far alleviating or compounding accrued inequalities from previous periods of growth. For instance, will new horizons close the gaps in access to growth?
We then explore wellbeing trends in the UK, displaying the toll on mental health that can accompany an economy viewed as healthy through GDP, where rising trends in underemployment and work-related stress span salaries and education levels.
Finally, we examine ‘economic scarring’, the lasting trauma embedded in the structure of the economy as a result of the growth contraction and economic fallout from crisis. In light of the long-term impacts of economic crisis on health, opportunities and inequalities, we want to identify how crisis recovery impacts future productivity needed for growth.
Over the previous two papers in this series, we explored the origins of economic growth in the UK and surveyed the UK’s turbulent experience with recurrent economic crisis. We discovered that although economic growth has altered way of life and elevated standards of living, the UK’s past industry and crisis recovery has continued to influence growth and productivity, and shaped an economy where GDP alone does not tell the full story.
This essay is structured as follows: Section 2 explores the UK economic landscape of disparities in access to growth’s benefits. Section 3 surveys the socio-economic costs of economic inequalities. Section 4 considers the political-economic policies and attitudes to tackle UK inequality. Section 5 assesses the Knowledge Economy, whilst Section 6 addresses wellbeing. Finally, Section 7 discusses economic scarring and Section 8 concludes and presents some thoughts on policies for long-term productivity and growth.
2. The Great Divide
Despite sustained growth, there remains a persistence of income and material inequalities, and significant discrepancies in the economic development of different areas and regions of the UK. Local disparities in wages, opportunities and employment, along with investment inequalities and inequalities in wealth accumulation, influence regional productivity and prosperity.
The UK suffers from inequalities that are both spatial (the UK displays interregional, urban-rural, intraurban and intraregional inequalities) and socio-economic due to occupation and class, Rae et al. (2016). Increased income per capita can improve standards of living if all groups within the population can benefit from it.
The decision of access to economic growth—the organisation of the economy as a distribution mechanism for allocating its benefits—is a political choice. So far, the UK has been unable to configure a system of economic policy that can enable an equitable, fair and poverty alleviating distribution of the benefits of growth.
The UK has succeeded in achieving continuing growth, even though productivity falls behind international counterparts. However, the distribution of the benefits of growth is not equitable. Inequality will exist within any market capitalist economy. Problems arise when unequal distribution significantly and persistently reduces health outcomes, life opportunities and standard of living. Inequitable distributions are maintaining preventable barriers to success for groups within the population. In this case, inequality is inefficient.
Aside from social inequity, there is a financial cost to maintaining high levels of poverty and deprivation through unemployment benefits, increased need for health coverage and the opportunity cost of lost contribution to national output. A healthy population, who have safe, meaningful work that pays fairly is a greater economic advantage.
2.1. Interregional Inequality and Poverty
Multiple articles and reports indicate that the governmental system in the UK, which is, according to McCann (2020), ‘highly centralized, top-down, largely space-blind and sectorally dominated’, is ‘ill-equipped’ to tackle the level of interregional inequality and deprivation in the UK. Although one-third of UK large urban areas are poorer than their rural surroundings and ‘two-thirds of UK large cities are less prosperous than the UK average’ (McCann 2020), UK inequality is more interregional than urban vs non-urban.
In the UK, a large portion of inequality centres around the legacy of industry, creating spatially disconnected areas—such as Aberdeen and Dundee (Scotland), the South Wales Valleys and Teeside (North East England), which experience levels of economic decay commonly associated with urban areas. The industrial heartlands and periphery (the tributaries of supply to major industry, such as coalmining and smaller manufacturing bases) experienced the deprivation caused by loss of industry and have not benefited from the prosperity of economic growth.
Governments on both sides of the political spectrum have struggled to enact government intervention in such a way that an equitable distribution of wealth and opportunities can be achieved throughout the nation. Instead of setting long-term policy objectives, the government favoured short-term growth opportunities throughout the latter half of the 20th century, neglecting the long-term survival of industrial bases.
Although rationalisation and efficiency improvements were inevitable in UK industry, the sudden economic reform that occurred around the 1980–1981 recession is a contentious issue due to the speed and intent with which communities were dismantled. The post-war decades of restructuring were forced over a few years, creating a long-term detrimental effect to the local economies on which it was imposed.
Forty years of productivity gains cannot be accomplished in the blink of an eye. Regions undergoing rapid thinning, to conform to economic modernisation aims of the government, experienced destruction without the creativity—or the liquidity injection—to rejuvenate. Areas that did not facilitate heavy industry have not only escaped much of the damaging consequence of deindustrialisation but had sufficient wealth to kickstart new investments and benefit from new innovations for soaring economic growth (Figure 1).
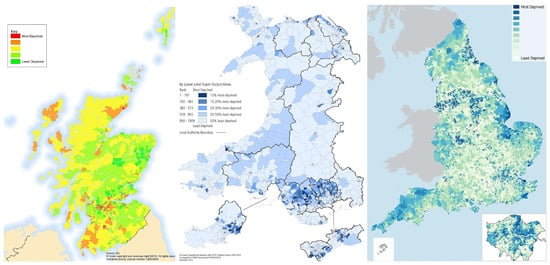
Figure 1.
Index of multiple deprivation for Scotland, Wales and England. Darker regions display areas of most deprivation. Former industrial areas have the highest levels of most deprived areas.1
London has a disproportionate influence over the national UK GDP per capita. It has been estimated that for New York to have the warping effect on the US economy that London has on the UK, it would need to have a population of 65 million. London’s urban metropolitan area (which encompasses commuters) is larger than Greater London—this is an oddity.
The urban metro areas of Birmingham and Manchester have smaller populations than the West Midlands and Greater Manchester, whereas London’s urban metro population is nearly 4 million greater than Greater London. This is due to smaller inflows to Manchester and Birmingham from surrounding urban hubs but a large number of commuters into London (from towns such as Guildford and St Albans).
Regional inequality can be well proxied by GDP per capita (which includes factors beyond wage income), in the same manner that nations can be compared to one another. Using 28 metrics of inequality (including, but not limited to, the Gini coefficient, ratios of top 10% of regional GDP per capita to bottom 10% amongst others) across all regional classifications defined by the OECD, McCann (2020) found that the UK is an outlier amongst its peers for its levels of regional inequality. In some of the metrics, the UK is only outranked by small nations in Europe or former Communist countries with populations smaller than 11 million.
In comparison to other large industrialised economies, such as Germany, France, the US, Japan and Sweden (through comparing OECD members) the UK displays most interregional inequality. Only Italy comes close—of the 21 metrics of comparison with Italy, the UK outranked Italy on 11 and Italy outranked the UK on 10. Where Germany outranks the UK, this is due to lingering inequalities between the former West and East following unification.
Countries that display similar levels of inequality in some metrics are those which have undergone significant restructuring (such as the unifications of Germany and Italy) or have long-standing regional divides, such as Spain. It is highly unusual that the UK, a large, highly industrialised economy, displays such persistent and large regional inequalities.
2.2. Disconnection
‘On many levels the UK economy is internally decoupling, dislocating and disconnecting’ (McCann 2020 in ‘Perceptions of regional inequality and the geography of discontent: Insights from the UK’, Regional Studies).
The UK has areas of deprivation which stand shoulder to shoulder with areas that are major drivers of economic growth on a national scale. A series of disconnections—economic, social, institutional and physical—have meant that the most deprived areas have not been able to access the benefits from this growth. Cities are seen as some of the main drivers of growth but also contain areas which struggle to gain access to the wider economy.
Urban areas such as Greater Manchester are becoming patchworks of isolated deprived areas (experiencing multi-generational disconnection from the benefits of economic growth), gentrified areas (where high-income residents have moved into poorer areas) and frequent reshuffling and displacement. Close proximity between more wealthy residents and poorer residents can warp the average wealth profile of a neighbourhood, meaning it can be difficult to determine the areas needing most intervention. As such, these areas are not conducive to benefitting from national level one-size-fits-all policy.
Deprived areas have experienced residualisation, reducing social mobility—over generations, the benefits of nearby regional and urban growth have not enabled employment, housing and income to flourish, trapping the local area in economic stagnation. The nation is dappled with spatial mismatch (where jobs and employees are available but geographical distance prevents employment) and skills mismatch (where there are vacancies and unemployed but those unemployed do not have the necessary skills to fulfil the jobs).
Skills mismatches can create frictions in the employment matching process—jobs and unemployed people can coexist and not create employment. This can occur in inner cities (particularly evidenced in Glasgow) but also on urban fringes such as Speke, Liverpool. In Speke, it has been identified that a primary employment zone rubs shoulders with a deprived area where more people travel more than 5 km to work than in similarly deprived areas, indicating that the employment in the nearby zone does not cater for the local workforce.
No area containing deprivation is the same. In Manchester, Liverpool and Glasgow, deprivation is spatially dispersed (the patchwork pattern discussed above) but in Cardiff, Leeds, Sheffield and Birmingham deprivation and affluence are more spatially divided (more prominent poor-rich spatial segregation). In isolated deprived areas, clusters of deprivation emerge. Pushing people into these areas through community displacement (as often occurs during new property development) creates a one-way street as the only areas for movement are into other deprived areas. Many cities (such as Liverpool, Manchester, Birmingham, Belfast and Glasgow) display clusters of deprivation which have little functional connection to less deprived areas with regard to residential mobility.
Cities such as Belfast and Salford have experienced regeneration in singular areas—the Titanic Docks and MediaCityUK—but there is little evidence that this influx of investment has filtered into the wider urban area. City regeneration that favours private investment can result in higher value housing to increase profit, reducing the size of the affordable housing market.
New housing is targeted at private buy-to-let markets for young professionals and students, which masks underlying deprivation due to a fast turnover of relatively wealthier tenants. Gentrification displaces poverty, whilst residualisation traps it—neither removes it altogether. There is evidence that gentrifying areas are experiencing increasing levels of poverty despite wealthier incomers, as gentrification can reduce social mobility—people in poor areas may have to move to poorer areas as property prices increase beyond their reach in their area and surrounding areas.
In former industrial areas such as Aberdeen, Dundee and South Wales, there are limited job opportunities within the area but also geographical detachment, reducing scope for job opportunities in close proximity to these areas. The increasing centralisation of employment in city centres ostracises ex-industrial areas such as mining, which, by the nature of pit locations, are distanced from urban hubs, such as in Newcastle and South Wales. Decentralisation of employment hubs in urban areas often occurs as an outpost of a central organisation, creating a skills mismatch problem despite close proximity to areas of unemployment.
2.3. Work for Work’s Sake Does Not Work
Evidence from a 2016 Joseph Rowntree report (Tinson et al. 2016) indicates that areas with high vacancies have high levels of deprivation and do not have higher employment. Almost 33% of Northern Ireland’s most deprived areas and nearly 25% of Scotland’s most deprived areas coincide with high numbers of jobs. Increasing the number of high-paid jobs does not increase local wealth if local people do not have the necessary skills to undertake those employment opportunities. Further, surges in high-paid jobs can encourage commuting into the area, restricting employment opportunities for unemployed and underemployed city residents. Decreasing the distance between work and unemployed people also does not increase employment if there is a skills mismatch.
Job polarisation (where high-pay jobs and low-pay jobs increase in number, but middle-income jobs decline) reduces social mobility, perpetuating poverty and low incomes. In the period 1997–2002, although low-income rates increased faster than middle incomes, high incomes continued to outpace this faster rate, increasing the income gap.
Polarisation also exists between work-rich and work-poor households—if new employment opportunities go to households where there is already a member in full-time employment, it will exaggerate the income gap between poor and rich households. A ‘jobs gap’ has emerged between areas of affluence and poorer areas—the job polarisation is both occupation-based and spatial. The type of jobs now available in the former industrial areas do not, in the majority, provide the opportunities for increased income associated with the average job opportunity of the South-East.
The UK has high levels of in-work poverty, indicating that recurrent policy objectives of achieving 100% employment do not reduce poverty levels if there is a rise in low-paid work. In-work poverty is most prevalent in the sectors that the government is keen to ‘open up’ following COVID-19 lockdowns (temporary or low-paid work and those in hospitality, catering, retail and care occupations) instead of undertaking labour market and economic reforms.
This neglects to resolve the root employment causes of in-work poverty and persistent deprivation. Further, creating low-paid employment opportunities can create a dip in standard of living for the poorest—net incomes from low-paid employment and the costs of facilitating work (for example, transport) can be lower than solely receiving benefits. Undertaking employment following receipt of benefits creates a decline in standard of living, perpetuating in-work poverty.
2.4. Geography of Discontent
The ‘North–South’ divide is more than a cultural dialogue—it is the result of the UK’s vast interregional economic inequality (Martin 1988). As the drivers of growth in the UK have evolved, through new industries and into new technologies, previous sources of growth have successively become obsolete, and the number of areas encompassed by the ‘North’ have increased.
Ron Martin noted in 1988 that the ‘North’ over time has expanded to engulf all regions of the country excluding the South East, London, the East Midlands and East Anglia. The entirety of post-industrial England, along with Scotland, Wales and Northern Ireland, fall on the unfavoured side of the divide.
The divide is not a new phenomenon. As early as the 19th century, unemployment was disproportionately high in northern Britain in comparison to London and the South East, despite the prevalence of industry. Wage discrepancies between London and industrial areas were visible, whilst London displayed a high concentration of employment in services and finance. The wealth of bankers and financiers in London trumped the wealth of industrialists in the industrial heartlands of the ‘North’.
Regional disparities intensified during the interwar years as the UK’s heavy industry began to decline and manufacturing for new industries arose in the South—the ‘North’ suffered the largest burden of unemployment. Following the Second World War, the manufacturing bases providing the ‘Golden Age’ were largely in the South East and West Midlands. The post-war economic boom did little to reignite the industrial strength of the former powerhouses of the North, Scotland and Wales, but made great strides in increasing regional wealth in the South-East. Employment in Scotland and North West England failed to reach pre-1930s levels despite manufacturing in the ‘Golden Age’.
Throughout the post-war period, successive governments failed to address the widening North–South divide. From the mid-1960s, the divide began to grow. Through the latter half of the 20th century, the proportion of the population benefiting from the prosperity gains from economic growth dwindled and the economic ‘North’ swelled.
As manufacturing and heavy industry began to collapse, the banking and insurance centre weathered the economic storm. The fallout from the 1980–1981 recession dealt the final blow to regional recovery. Shifts towards neoliberal economic policies accelerated UK inequalities—the ideological standpoint that accompanied the new rendition of the ‘free market’ reduced national equity in health outcomes, education and other areas of life.
Scott-Samuel et al. (2014) note that ‘the 1980s saw a rapid increase in income inequalities and poverty rates. By the 1990s and 2000s, these new high levels became normalized [sic].’ Although the ‘South’ is not without poverty, deprivation and unemployment, there is a marked divide between the ‘southern’ and ‘northern’ regions on aggregate—McCann (2020) summarises that ‘many of the UK’s most prosperous places are small and medium sized towns, especially in the south of England, whereas many of the UK’s poorest places are small and medium sized towns in the Midlands, North and Wales.’ Disparities in city productivity between the north and south of England have also emerged.
During 1970–2000, the spatial concentration of poverty in Britain increased, particularly due to areas suffering industrial decline experiencing high levels of unemployment and economic inactivity. The North–South divide grew between 2001 and 2008 and the economy displayed large growth spatial inequality—only a few geographical areas benefited from prosperity brought by growth; urban growth was not found to improve the rate of low-skilled employment.
McCann (2020) notes that ‘higher interregional inequality is associated with higher nationwide interpersonal inequality’. It is evidenced that people’s perceptions of their region and nation are heavily influenced by wealth and their experiences of other regions and those who live there. Those who live in the UK’s ‘North’ will see a different picture of the UK from those who live in its ‘South’. The North–South divide and interregional inequality has a large political and cultural aspect influencing the perception of the scale of the inequality and the lack of emphasis on measures to rectify it.
3. Socio-Economic Costs
Preventable inequality poses direct and indirect costs to the economy, through public sector spending on healthcare and benefits and productivity losses. Since the shock ‘identity change’ in the UK’s political attitude towards government spending and the health and wellbeing of the population that occurred in the 1980s, the UK has struggled to regain lost ground in reducing inequality and improving access to growth.
It is evidenced that Thatcherist policies significantly increased socio-economic inequalities in the UK due to cuts to social welfare, reordering of areas of the public sector such as the NHS, sudden structural reform to labour and encouragement of home-ownership. Areas where deindustrialisation was concentrated were thrust into poverty and many have not recovered.
The pertinent aspect of 1980s UK policy was its legacy—despite decreases in all-cause mortality rates, life expectancies improved more slowly than comparable counterparts. Scott-Samuel et al. (2014) highlight that ‘alcohol-related mortality increased dramatically during the late 1980s and early 1990s in the UK in contrast to the improving trends in other parts of Europe.’ Further, in the UK drug-related mortality, suicide and violence—socially-produced causes of death—increased. Scott-Samuel et al. noted that even in areas where complete structural reform was not completed during the Thatcher era (such as the NHS), ‘she did enough to allow her legacy to be built on and taken further by her successors from both main political parties.’
3.1. Housing and Homelessness
Increasing trends in home ownership and reduction of social housing increases homelessness. Home ownership trends foster a society dependent on accumulating wealth, creating a material wealth gradient. People can become both isolated from employment and housing. Persistently low wages prevent wealth storage (e.g., savings, property investment, human capital accumulation (education)), meaning those with high disposable incomes also have an advantage in accumulating wealth, contributing to multi-generational earnings gaps, perpetuating economic costs of inequality.
The reduced supply of social housing since Thatcher’s ‘right-to-buy’ scheme has concentrated poverty and deprivation around remaining council-owned estates. The most disadvantaged must be prioritised due to reduced supply of housing. In addition, there is residualisation of poverty due to low employment opportunities and economic disconnection. As a result, residents of social housing suffer double the poverty rates of those experienced by the population in its entirety, as of 2010 estimates. This is significant—originally social housing was the norm for employed households.
Surveys showed that in 1948, experiencing social housing in childhood showed no indication of increased adult unemployment and deprivation. By 1970, there was evidence that it created a differential in socio-economic conditions in later life compared to the wider population for both men and women. The shift to home ownership has concentrated the deprived into grouped social housing but significantly, has posed more of a strain on low to middle earners as they must now reduce disposable income to incur home ownership costs/high private rentals, perpetuating in-work poverty and lower standard of living despite regular wages.
3.2. Disparities in Life Expectancy
UK life expectancy improvements have stalled in recent years, whilst healthy life expectancy—the average number of years a person is expected to live in ‘good’ health—has displayed widening regional discrepancies. Life expectancies closely mimic uneven socio-economic conditions, dependent on living standards and income, along with lifestyle factors (Figure 2). In the UK, discrepancies are pronounced due to areas that witnessed decline in industry. In addition to the sources cited in-text, this section also draws on references Bibby (2017); Burch (2018); Education Policy Institute (2020b); Kontopantelis et al. (2018) and The Health Foundation (2019).
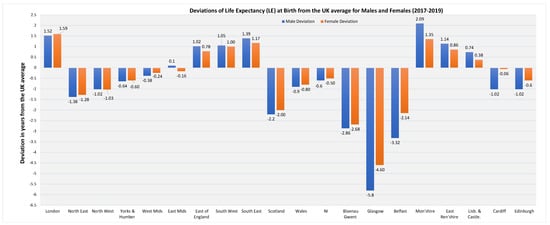
Figure 2.
Deviations from the UK average life expectancy (LE) for selected UK regions and districts.2
The UK also exhibits phenomena such as the ‘Scottish Effect’ and more acutely the ‘Glasgow Effect’, attributed to lower deprivation-adjusted life expectancies in Scotland (particularly Glasgow) than the UK and Europe. Disposable income, health outcomes, education, lifestyle and employment all contribute to standard of living, hence health, impacting on life expectancy.
Gross disposable household income (GDHI) measures the average household money available for spending and investment, “seen to reflect the ‘material welfare’ of the household sector” (Office for National Statistics 2020a). Disposable income levels indicate capacity to spend on housing, diet, education and goods—lower income reduces diet quality, and increases prevalence of poor housing and fuel poverty, all of which reduce standards of health. Reduced material wealth can impact mobility (e.g., securing transport), which can influence employment, whilst lower educational outcomes due to wealth can decrease employment prospects.
GDHI between 1997–2017 surpassed the UK average in only three regions: London, the South-East and the East of England. London grew fastest, whilst in Yorkshire and the Humber GDHI fell. Wales, Scotland and Northern Ireland trailed behind the UK average, with Wales and Northern Ireland aligned to the North East, England’s lowest disposable income. Unemployment can worsen health and wellbeing due to increasing levels of depression, anxiety and disillusionment, reducing life satisfaction. It can reduce future employment prospects, hence future earnings, further impacting on standards of living.
Unemployment-induced unhealthy behaviours vary, yet long-term unemployment can be associated with increased alcohol consumption. The worst life expectancies in the UK correspond with a high prevalence of lifestyle-related causes of ill-health. In Glasgow during 2003–2007 “approximately half of ‘excess’ deaths under 65 years of age were directly related to alcohol and drugs.” (Walsh et al. 2010).
Despite negligible differences between premature deaths in the North and South in the mid-1990s, stark disparities were evident by 2016, with major causes being alcohol, drugs and suicide. Analysts attribute the deaths gap to persistent deprivation in the North as a result of long-lasting poor employment prospects due to the decline in industry in the 1980s. Lower funding for GP practices in the North reduces primary care outcomes, needed as the first port of call to maintain health. Failings at primary care level can exacerbate health conditions and overwhelm hospitals. Successful preventative care is a major factor in closing health inequalities.
Despite upward trends in life expectancy in all English regions (Figure 3), life expectancy rate of increase has slowed in recent years. Further, regions that fall behind have not caught up with the highest life expectancies during the 21st century. In recent years, London’s life expectancy surpasses all other English regions. The North East and North West continue to lag behind the next lowest, Yorkshire and the Humber, for males and females.
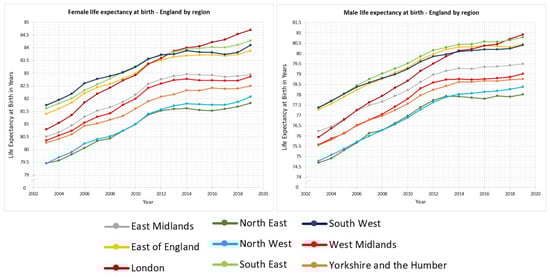
Figure 3.
Life expectancy by region for England 2002–2019. Note: Life expectancies represent the average for the preceding two years.3
Healthy life expectancy is the number of years lived in ‘good’ health. Healthy life expectancies show little variation between genders, yet in some areas female healthy life expectancy is lower than for males, indicating females, on average, spend more years of their lives in poor health. “Those living in the most deprived areas could expect to live the smallest proportion of their lives in ‘Good’ health”, according to the Office for National Statistics (2021b).
Poor health reduces employment productivity and can impact on ability to maintain work, further reducing income, hence living standards. The healthy male life expectancy gap in the UK stood at 18.6 years in 2016–2018—Richmond-Upon-Thames topped the table at 71.9 years, whilst in the lowest, Blackpool—one of England’s most deprived areas—it was 53.3 years. Blackpool male life expectancy fell 8 years behind Richmond-Upon-Thames. The healthy life expectancy gap for females stood at 19.1 years between the Orkney Islands (73.3) and Nottingham (54.2).
Education influences lifestyle habits and enables higher paid work, which is less likely to correspond with unsafe working environments and job insecurity. Educational attainment gaps between richer and poorer areas of England are stagnating at early years and secondary school leavers, whilst growing at primary school level. Average teacher salaries in shortage subjects (such as maths and sciences) are GBP1500 lower in disadvantaged than affluent schools, attributed to a ‘much larger share of less experienced teachers’ (Education Policy Institute 2020a).
However, when educational attainment is deprivation-adjusted, the gap largely closes in London, but persists for other areas, indicating that disparities are not limited to deprivation levels. As educational attainment is a key determinant of future salary, persistent attainment gaps preserve income discrepancies. Given education builds human capital, areas with low educational attainment have less human capital to call upon for regional growth, stagnating wealth, hence standards of living. Further, investment inequalities are evidenced to reduce education and training opportunities.
Why are disparities in life expectancy an economic problem? Poor life expectancies point to underlying persistent health inequalities, which can be caused by (and contribute to) economic inequalities. Health and socio-economic status are self-reaffirming—those with a more favourable socio-economic position in society have better health. Persistent deprivation and decline feeds into permanent health inequalities, which pose significant direct and indirect costs to the economy as a whole, hence will also impact the healthy and the wealthy.
In 2010, it was estimated that ‘inequality in illness accounts for productivity losses of GBP31–33 billion per year’ (Marmot 2010) in England, with an extra GBP20–32 billion incurred due to lost taxes and higher welfare benefits for a population that recurrently misses or cannot secure work due to ill-health. Given that efficient operations of an economy are contingent on the inter-relations between various people and groups, the health status and socio-economic opportunity of groups within society impacts on the functioning of the overall economy and creates economic costs that impair national productivity performance, especially given healthier people are more productive at work, miss fewer days due to ill-health and create fewer direct healthcare costs.
4. Political Economics of a Divided Nation
4.1. Trickle-Down Regeneration
Many government initiatives have fostered a ‘personal capitalism’ or ‘entrepreneurship’ attitude towards poverty alleviation and tackling deindustrialisation decline, however lack of impetus to connect stranded areas to the wider economy has limited people’s abilities to undertake ‘entrepreneurial’ activities. Lee and Sissons (2016) note that in the UK, productivity increases have benefited high wage earners instead of low earners.
Evidence shows no correlation between growth and poverty reduction, even in areas of poverty in the ‘South’ such as London. (Poverty has increased in London as the local economy has grown.) Once a wage is over the threshold of the national median, the worker benefits from economic growth. For those who drop below the threshold, as the economy continues to grow, it becomes more difficult to climb up and over the threshold. As a result, wage inequality is associated with growth—as higher percentile wages grow due to benefiting from growth, the lower wages fall further behind.
As potential for economic growth gravitates towards new technologies and sources of productivity gains, those who are ostracised from taking part in these opportunities, due to education, training, financial position or regional distribution of growth opportunities, benefit less from the rising tide of national economic growth.
Although there are suggestions that ‘spillovers’ from clusters of high-income individuals can benefit local communities, the extent to which spillovers can reduce poverty is debatable. The Marmot Review Marmot (2010) emphasised that in the 30 years up to 2010, tax had ‘seldom had a redistributive effect’. In the decade after 1978, the pattern of gross income distribution flipped, and never reverted again, leading to a minority share of income for the bottom 60% of the population and a concentration of income held by the top 20%.
Areas of deprivation and industrial decline struggle to benefit from ‘trickle-down’ policies, as decline can be self-enforcing. A deteriorating local economy reduces employment prospects and skills-training, creating further unemployment and the area sinks deeper. Areas with struggling local economies do not have the start-up capital necessary to access the wider market economy in order to lift the region.
Strategies to enable depressed regions to ‘help themselves’ through entrepreneurialism have struggled to gain ground. Economic stagnation fuels poverty and poverty fuels stagnation, limiting pathways for depressed areas to grow their way out of decline. As property prices in the ‘South’ have boomed, limits to southward migration for employment have emerged—a combination of lower wages in the ‘North’ and high property prices in the ‘South’ severely limits ability to move from ‘North’ to ‘South’.
4.2. Political Attitudes towards Bridging the Gap
As inequalities have widened, the government has sought to rescue the situation, but successive governments have struggled to land on the necessary policies to do so. In the 1960s, poverty was viewed as ‘pathological’—originating from personal and social characteristics. It was believed that changing housing and reshuffling communities would solve the problem.
Over time, there was a greater understanding that economic structural factors are major driving forces of poverty. However, government programmes attempted to create ‘entrepreneurial’ mindsets within deprived and declining areas in the 1980s, in the belief that people could gain access to the wealth ‘trickling down’ from growth.
In the 1990s, dysfunctional labour and housing markets, along with supply-side mismatches, such as skills training, were identified as perpetuators and instigators of poverty; in the late 1990s–2000s, poverty alleviation became seen as a multi-agency strategy. However, in 2010, post-Financial Crisis economic policy saw a return to the idea that the free-market will determine which areas have long-term economic stability, neglecting direct government intervention to restabilise local economies.
As policies develop, generations pass and areas become more entrenched, and increasingly trapped, in deprivation. Wales, Scotland and Northern Ireland have begun to incorporate more localist approaches to poverty alleviation, with strategic regeneration frameworks in place. However, England is stuck in a vertical, top-down approach.
5. Welcome to the Knowledge Economy
We now turn to the sources of growth in the modern UK economy. Having identified the impacts of deindustrialisation and disconnection, we discuss the new ‘intangible’ era of ‘knowledge’, considering whether it can bridge the gaps formed during previous eras of growth. In addition to the sources cited in-text, this section also draws on references Borgo et al. (2013); Creative Industries Clusters (2021); Fauth (2009); Hutton et al. (2021); The Mersey Partnership (2015); Stanley and Gabriel (2019) and Unger et al. (2019).
During the 20th century, the world transitioned into the Information Age. Rapid increases in information and communication technologies (ICT) began to shape human civilisation, a marked shift from the traditional industries defining the ‘Industrial Age’. With the expansion of ICT and later, the rise of the Internet, the world became more connected, scientific research became commercialised and intellectual property became commoditised.
Thrust into the era of Arthur C. Clarke and visions of an interconnected future, centred around computers, by the mid to late 20th century, science fiction was becoming reality. In recent generations, the UK (and most developed economies) has evolved into a ‘knowledge economy’. In the knowledge economy, economic growth is driven by intellectual capital and knowledge is viewed as an infinite and easily transferable resource.
Despite the deindustrialisation that has plighted much of the UK workforce, the national GDP still throws strong punches at international competitors. Throughout this paper, we have discussed technological innovation leading to increased manufacturing output as a major driver of the UK’s transition into a growing economy. How can we grow without traditional industries? A complex puzzle to unravel. The sources of economic growth remain unchanged in this brave new world—technological advances and human capital still improve productivity.
Innovation is not merely technical improvements but encompasses intangible capital, intellectual property and research. Knowledge-intensive sectors are driven by expanding the known world and designing a new future. Drivers of growth exceed the traditional definition of total factor productivity (labour and capital), encompassing intangible inputs, organisational structure and significantly, computer software.
The Office for National Statistics (2019) notes that the dominance of manufacturing was reversed in the final decades of the 20th century, to be replaced by ‘professional, scientific and technical services including education and health’ and services including hotels and catering. Together, these two categories rose from a combined share of the employment market of 24.7% between 1960 and 1979 to 48.43% between 2000 and 2016. By the 2000–2016 period, primary sector employment (agriculture) was all but eliminated, contributing only 1.42% of employment.
Retail and wholesale distribution, and transport, storage information and communications—all necessary for ordinary operations of UK daily life and consumer culture—together contributed 24.23% of employment. In terms of GDP, in 2019, services contributed 79% of output, with production falling behind at a mere 13%—a stark contrast to the trends of previous decades (Figure 4). Manufacturing that remains has undergone significant evolution—nowadays, the majority is dedicated to food production. High-end technology, particularly aerospace, contributes GBP35 billion to the UK economy and is the world’s second-largest aerospace sector behind the US.
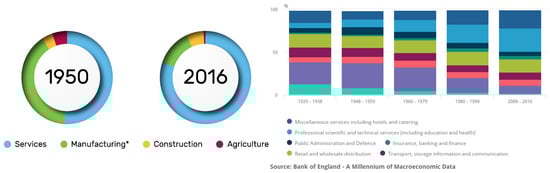
Figure 4.
The changing face of UK employment. (Left) The UK economy by sector (in terms of output), * includes utilities and mining. (Right) UK sectoral shares of employment disaggregated by subsector, 1920–2016. Purple shows manufacturing, and blue represents services.4
‘Creative industries’—defined by the Scottish Government (2019) as industries ‘based on individual creativity, skill and talent, or which have the potential to create wealth and jobs through the development or production of intellectual property’—contribute a remarkable tranche of the UK economy.
Prior to the 2020/21 pandemic, these industries were growing at more than 4-times the rate of the economy as a whole—the Creative Industries Federation (2021) highlight that the contribution of these industries in terms of GVA (gross value-added) was ‘greater than the automotive, aerospace, life sciences and oil and gas industries combined’ in 2018 and accounted for 12% of UK services exports.
These industries have been brought to national attention during the COVID-19 lockdowns due to the prevalence of self-employed individuals, small businesses (95% of creative industries businesses employ fewer than 10 people) and often the reliance on face-to-face customers as a sole revenue source. Tourism, like the creative industries, is reliant on footfall for revenue. It provides a large financial gain to the UK economy, with the Office for National Statistics (2020b) stating that residents of other countries contributed GBP28.4 billion through travel and tourism in 2019.
5.1. An Intangible Era
The economic landscape of the modern developed economy is much more abstract and less tactile than the heavy industry of yesteryear. Investment in intangibles now surpasses investment in tangible assets in the UK. With the internet boom of the 1990s, although tangible investment increased due to computer hardware, ‘intangible capital deepening’ (increasing the proportion of intangibles per labour hour worked) was rapid. Even though the 2000s saw a decreasing rate of intangible investment, investment in intangibles firmly surpassed tangibles. In 2008, the largest fraction of intangibles was training and organisational capital (structures in a business which enable employees to be more productive). Significantly, training and upskilling alters the productivity of a working hour, altering the contribution of labour hours to total factor productivity.
Intangibles are commonly ‘non-rival’ assets—as usage is distributed amongst individuals, any individual’s usage is not impaired, unlike tangible assets which cannot be used by more than one group of workers at the same time. Corrado, Huckel and Sichen define measurement of intangible assets into three categories: computerised information (computer software and computerised databases), innovative property (research and development, design and original intellectual work) and economic competencies (advertising, brand-equity, employee training and organisational capital). A large portion of intangible investment is own-account (completed in-house for in-house use).
Intangible assets are difficult to define, quantify and incorporate into growth accounting. In-house intangibles can be firm-specific so are difficult to classify on a national scale. To quantify the contribution of intangible assets to national UK growth, analysts must determine—by interviews or employment surveys—job titles that undertake work in intangibles (such as product development) and those that produce intangibles as output. The proportion of their working hours dedicated to this activity is then estimated and its value measured through the average wages for that job role. The job title technique can also be used to measure the spatial distribution of intangible contribution to the economy, which can be proxied by the national distribution of job roles that most commonly contribute to intangible development and investment.
Unlike physical (tangible) capital—a machine or a factory—it is difficult to assess the life-span of intangible capital. How does one determine the amount of time that an employee becomes more productive as a result of ‘firm-specific human capital’ (in-house employee training)? However, in order to capitalise intangible assets, one must be able to measure their life-span and apply depreciation. Capitalisation—an accounting technique which expenses the cost of an asset over the course of its useful life—of knowledge and intellectual property is a key feature of the modern sources of growth. The measurement and collection of national statistics is regularly evolving to account for intangible sources of productivity, in an attempt to quantify the missing aspects of national growth, not represented in tangible capital. However, there are still difficulties in accurately—and comparatively—assessing the contribution of intangible assets to national GDP. In 2008, the UK government decided to treat Research and Development (R&D) expenditure as investment, first amalgamated into National Accounts in the 2014 Blue Book. The 2019 Blue Book saw the inclusion of in-house business software and updates to investment in copyrighted assets.
5.2. Tangible Inequalities
Has the ‘Knowledge Economy’ alleviated the problems with disconnection and access to growth? Tertiarisation is occurring in all regions of the UK, as the nation transitions towards a services economy, however the tertiary shift is not facilitating a transition to more creative, skilled or higher-paid work for many. Access to the knowledge economy’s surging success is confined to its frontiers.
Limited access to the frontiers confines the wider population’s creative talents and does not allow the knowledge-sectors to fully benefit from the proviso of the ‘knowledge economy’. Frontiers employ a small number of people relative to the workforce and often require higher education or training, formalising the ‘open-to-all’ creativity of the ‘knowledge’ ideology.
Life sciences (including pharmaceuticals), advanced manufacturing, creative and digital industries, enabled by financial and professional services are seen as major drivers of the UK’s knowledge economy growth. A five-year ‘Creative Cluster’ programme has been developed to foster creative industries in hubs throughout the UK, aiming to build networks between organisations, businesses and universities.
The locations of the nine ‘clusters’, however, neglect to include the North West, North East, North Wales, the former industrial West Midlands, the Valleys and rural areas. Manchester represents a Northern outpost of knowledge-intensive sectors and creative industries, however, there is little evidence of a spillover of benefit into surrounding areas.
As we have seen, there are prevalent disconnection barriers preventing the benefits of growth dispersing throughout the regions and population. The UK has prominent difficulties in matching jobs to unemployed workers. It seems unlikely that disconnected areas would have the qualifications to participate at the frontiers, or access to the networks necessary to participate in creative hubs. Further, creative industries do not necessarily provide the type of work needed to reduce the socio-economic divide.
Although creative industries constitute over 3 million of the UK workforce, the Creative Industries Council (2019) reported in 2019 that ‘there is little insight into the quality’ of the growing number of jobs in the sector and that greater visibility of career progression and evidence on local skills and talent are still required. The House of Commons Library highlights that 53% of the UK total R&D was performed in the three regions of the South East, London and the East of England in 2018. Research and Development related roles employed 263,000 of the population in 2019. The majority were scientists or engineers (50%) or technicians (29%).
With the rise of knowledge-intensive sectors, how does inclusion of intangibles affect interregional output inequalities? Research has demonstrated that including intangible output in gross-value added (GVA) for Great Britain exhibits more pronounced regional disparities than GVA without intangibles. Regional distribution in intangible investments remains relatively unchanged in Great Britain—the majority of investment occurred in London and the South East in 1991, a trend which had not reversed through the early 2000s (Figure 5).
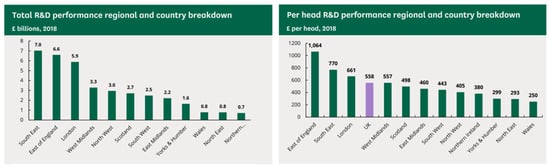
Figure 5.
Research and development expenditure by region in England.5
During the early 2000s, the share of intangible investment contributed by the East of England increased. The unequal GVA distribution between the tri-region (London, South East and East of England) and other regions of Great Britain grew in the 1990s and early 2000s. The extent of the ‘asymmetric territorial effect’ (Melachroinos and Spence 2013) suggests that if the regional economic make-up of the nation does not adapt, it is increasingly unlikely that regional convergence will occur.
As intangibles grow faster than the economy as a whole, where there are concentrations of intangible production and investment (London, the South East and East of England), these regional economies grow apart from other regions at an increasing rate. Although intangibles are growing throughout the UK, the existence of pockets of concentration indicates that increasing government impetus to fund existing R&D facilities and knowledge-intensive sectors will further concentrate wealth and development in regions with an existing density of intangibles in the economy, worsening spatial inequalities.
6. Wellbeing
Restructuring of the UK economy over recent decades has had significant negative effects on societal wellbeing. Surveys showed that the era of deindustrialisation, beginning as early as the late 1960s, constituted a shift in the national sense of self and purpose—optimism and collective social purpose forged after the war had transitioned to resignation, disillusionment and cynicism about future prospects. When asked if the next year will be better, worse or the same, those surveyed began to report that they believed the next year would be worse than their current year—a reversal of previous trends. Wellbeing from job satisfaction has been in decline since the 1970s.
With any level of lingering unemployment above the natural rate, the wellbeing of workers will be suffering, given that it has been evidenced that employed workers experience greater subjective wellbeing than their unemployed counterparts. Further, workers who earn a wage, rather than a salary, experience lower levels of wellbeing, highlighting that the prevalence of uncertain working environments (temporary, casual and zero-hours work) in the UK will worsen wellbeing. Economic crises negatively impact worker wellbeing, with Heyes et al. (2017) highlighting that ‘employees who directly experienced changes to their pay, conditions and working practices as a result of the [2008 Financial] crisis experienced a decrease in wellbeing.’
Research into associations between consumerist culture and wellbeing has suggested a negative impact on wellbeing from over-consumption and status through material wealth. This is pertinent to the UK economy given the high proportion of service-sector jobs fulfilling consumer culture (such as retail, hospitality and marketing). Further, higher levels of personal debt are evidenced to influence wellbeing and mental health, with those in high debt reporting higher levels of stress and depression. There was a marked shift to individualism and material status in UK society following the 1980–1981 recession, coinciding with a substantial increase in consumer credit and the trend has continued in UK households, with persistently high average levels of personal debt.
6.1. Underemployment
In the 1920s, the International Labour Organisation identified that unemployment and employment in aggregate are not sufficient to ascertain the condition of the employment market and highlighted ‘hours underemployment’—when workers are involuntarily working fewer hours than they would like to. Since, the definition of underemployment has been widened to encompass work below the skill level or qualifications of an individual (‘overqualified’) and pay below that which qualifications and experience should demand (‘underpaid’).
Underemployment incurs an opportunity cost of lost productivity and underutilisation of skills (human capital) in the labour market and is a measure of the quality of work. The levels of underemployment have been rising in recent decades and the race to raise employment in a market suffering from extreme polarisation does not consider the economic impacts of vast underemployment.
Despite employment levels returning to their pre-recession value in spring 2015 following the Financial Crisis, shifts in the labour market that had begun before the Financial Crisis were becoming more extreme. Underemployment (involuntary part-time work) became more prevalent following the Financial Crisis. Although employment levels began to rise after 2013, there was also a rise in underemployment.
The number of people working fewer hours than they would like rose and the proportion of underemployment in graduates—which had been increasing since 2001—increased at a faster rate after 2008 (university graduates working in non-graduate jobs). Further, the proportion of recent university graduates employed in low-skilled jobs increased. This represents a significant shift in UK employment, as the investment-reward trade-off of university qualifications is reduced.
The recession had a downward-shifting effect on workers—skilled workers filled low-skill vacancies, whilst there was a higher proportion of unskilled young workers unable to move out of unemployment. Both underemployment and unemployment negatively impact on wellbeing, with underemployment reducing job satisfaction.
Underemployment is subjective and the level to which it is experienced varies based on a number of demographic and personal factors, however, surveys indicate that it is felt more commonly by graduates than non-graduates. This has pertinent effects for the UK economy, which has encouraged mass university education in recent years—despite a decline in university applications in 2012 when fees increased, the bounce-back in 2013 set a new record for applications, which was successively broken in each of the subsequent three years, Bolton (2021).
Given the evidence that underemployment is rising, sectoral structural change is slow and economic adaptability to new opportunities has been weak in recent history, this may suggest that the UK is persistently over-skilling groups of young people whilst under-skilling work, and suffering the efficiency losses, opportunity costs and missed growth potential of the surplus skill. Arbitrary skilling does not create jobs in these skill sets hence the working population must conform to either low-paid or high-paid work, with nothing in between. Further, hours overemployment—when workers must work longer hours than they would like to—has also been noted as a cause of decreased wellbeing in UK workers. It is evidenced to be a contributory factor for emotional and physical exhaustion.
6.2. Work-Related Stress
In the 1990s, knowledge sector workers reported reduced autonomy in work, contributing to underemployment through lack of opportunities to employ the extent of their skills. The period also saw an increase in work intensification—when more tasks are demanded of an employee in a fixed amount of time, increasing the effort that an employee must exert to maintain the workload that an employer expects of them.
This trend has accelerated to the present day. The UK Health and Safety Executive (2020) (HSE) reports that work-related stress is on the rise in the UK (2020 report). The 2019–2020 Labour Force Survey evidenced that 17.9 million work days were lost in Great Britain due to work-related stress, depression or anxiety. The highest prevalence of cases occurred in higher level professional positions and managerial roles, along with public sector employees such as police officers, teachers, medical professionals and health professionals.
Work-related stress, however, can impact employees in any sector or at any level of work. Work is cited as the primary cause of stress in the UK, with workload, pressure, lack of autonomy at work, workplace relationships (hostile working environment due to colleagues or managers), job security and work-life balance as major contributors. Workload pressures have been identified as the main cause of mental ill-health due to work. In addition to the source cited in-text, this section also draws on the report of the University of Cambridge (2017).
7. Economic Scarring
As we saw in the analysis of crises in our second paper of this series Wardley-Kershaw and Schenk-Hoppé (2022b), the effects on financial markets and monetary economies of crisis recovery can differ from the impacts on the real economy (unemployment, education, public sector funding for services etc.). Although an economy can ‘rebound’ through reactive short-term growth, implementing policies in recessions and crises that are too myopic and do not lay roots for long-term growth potential can have ‘scarring’ effects on the real economy.
Although the cost of stimulating GDP in the depths of crisis can seem high, Irons (2009) identifies that the long-term positive impact to the job market and educational outcomes of preserving employment, and government spending in crisis, can outweigh the short-term expenditure. Financing the growth boost via deficit spending further distributes the cost of the stimulus over many years, during which the economy should be more buoyant as a result of the stimulus and able to finance the debt interest repayments. As such, the value of interest payments decreases relative to the upward-trending economy. Future buoyancy also increases future tax revenues.
Financial crises alter financial courses and force households, individuals and businesses to undertake decisions that impact their long-term futures, whilst financially constrained in the present. Thus, mis-managing a crisis can reduce investments in new technologies needed to foster future growth potential. It can restrict access to education (hence limit future potential earnings), implicate health and nutrition, and prevent individuals from undertaking long-term investments, such as housing, business start-ups and career progression objectives.
All of these factors can reduce the future economic output of the economy, and individuals’ future prosperity and standard of living. Failing to implement long-term policy objectives in times of crisis will reduce future economic potential. As with health and social investment in childhood that can only reap dividends in later life, instant rebound policies in crises can push the cost of the crisis further down the line, felt in the missed opportunities for economic growth opportunities.
7.1. Shutting the Gate Once the Horse Has Bolted
Once the economy has re-established growth after having rebounded from a crisis, it is already too late to implement catch-up programmes to recover lost ground suffered due to the recessionary environment. Early childhood educational deficiencies cannot be recovered at high school or university level. Decisions made on early childhood development whilst parents are financially strained can impact the future development of their children.
Nutrition and ‘food insecurity’, along with poverty and homelessness, impacts a child’s physical, cognitive and mental development. Impacting children’s early development will create long-term health and social implications. For those at school-leaving age during a recession, opting to delay or forgo university or skilled training due to short-term financial limitations prevents young people fulfilling their educational potential and reduces their future earnings.
Higher education is evidenced to reduce future unemployment and improve health and social outcomes. We can see clearly that impacting a young person directly impacts their future children’s opportunities. In addition, human capital—accumulating education and skills—is a direct driver of economic growth. Educating people leads to a higher skilled and more productive workforce, and sparks opportunity for new ideas, research, evolving technologies, methods and knowledge, which improve future growth.
Restricted funding and access to healthcare services can reduce future wellbeing and health outcomes, impairing future earnings and workplace productivity, directly pushing healthcare costs and the costs of lost productivity into the future economy. With health insurance systems, this is reflected in inability to pay insurance premiums, in public healthcare, such as the NHS, this manifests as fiscal squeezing, creating health backlogs and reduced standard of care.
Employment and earnings strategies, along with business plans, that function adequately in a non-recessionary environment can become unsustainable in economic crises. Existing start-ups become starved of market share as larger companies dominate the decreased demand market, whilst new businesses struggle to get off the ground. This is significant as the opportunity to seize a market gap for new businesses is often fleeting. Workers are demoted on the skills and hours ladder. Prevalence of graduates in low-skilled jobs increases, whilst unskilled candidates often become unemployed. Full-time workers who become unemployed often become re-employed in part-time work. Losing employment or involuntary low-paid or part-time employment implicates earnings accumulation for wealth storage and capital accumulation (both physical and human) and also reduces future earnings potential. Taking a lower-paid job to recover from unemployment can negatively impact future career progression.
There are, of course, mental and physical health implications to long-term unemployment and low-pay that are incurred in the long-term through temporary economic crisis. Further, unemployment and temporary employment reduce ability to secure loans, forcing people to burn through liquidity and savings, reducing future investment opportunities in capital, training and education. Job loss and difficulty finding re-employment can occur in all age groups and thus, can directly impact all family members. People who become unemployed at an older age are less likely to become re-employed as easily as younger candidates.
As we saw in previous parts of this paper, the driver of economic growth with the most impact is productivity growth. The key to a dynamic, buoyant and resilient economy is research and development to maintain adaptability to rapid economic changes and technological gains. There is a spiral of reduced business development in a recessionary environment—reduced consumer demand stifles revenue, low liquidity calls for debt financing but costs of credit rise in economic downturns. As a result of reduced investment capacity, businesses withdraw towards their staple services and products, reducing expansion into innovative new business directions. Reduced investment in physical capital reduces future productivity but also restricts employees’ upskilling opportunities to train on new technologies. Lower future production reduces future revenue hence dampens future wages.
7.2. Salt to the Wounds
As we saw during our second paper Wardley-Kershaw and Schenk-Hoppé (2022b), there is evidence of significant post-crisis scarring as a result of the major recessionary periods of the 20th and early 21st centuries. Reforms to labour relations and corporations were not undertaken following the Second World War, leading to weak future productivity performance. Recurrent recession throughout the 1970s led to the 1980–1981 recession, culling the remains of British industry and creating a generation of long-term unemployed, whilst widening the inequality gap.
The 2008 Financial Crisis permanently depressed employment levels, productivity and increased underemployment. Given the evidence that economic outcomes and opportunities transcend one generation, one can infer that recurrent crises and reactive rebound growth stimuli (without implementing structural alterations necessary for long-term productivity), have had a compounding effect on the economic and social opportunities available to every post-war generation in the UK.
8. Conclusions
In this paper, we surveyed the literature to assess disparities in health, education, income and wealth in the UK economy, due to uneven access to the increases in wealth and standard of living brought about by economic growth. We built on the geography of industry introduced in our first paper Wardley-Kershaw and Schenk-Hoppé (2022a) and the socio-cultural restructuring effects of crisis discussed in our second paper Wardley-Kershaw and Schenk-Hoppé (2022b), to develop a more holistic picture of UK standard of living.
Firstly, we explored the ways in which disconnection from growth’s benefits can arise and persist through generations. We examined how city developments can mask areas of deprivation, and whether regeneration strategies on a national scale have proven successful at a local level. We explored the economic contribution of different areas of the UK to national growth and delved into some of the causes of regional disparities, uncovering an uneven economic landscape that laid down roots as early as the Industrial Revolution.
We then considered the socio-economic impacts of maintaining long-term disparities in access to the benefits of growth, focusing on housing and homelessness, and the stark variation in life expectancy aligned with economic status and a region’s economic development. Further, we viewed the situation from a political-economic perspective, assessing the political initiatives, policy directions and government philosophies that have accompanied the development of inequalities in the present-day UK economy.
Next, we introduced readers to the Knowledge Economy and discussed the potential socio-economic consequences of this phase of economic evolution. We reviewed the extent of transitions to new employment sectors and examined challenges that have arisen in modernising the measurement of growth to include intangible production. We then assessed how the nature of work in the UK economy can affect wellbeing, by exploring underemployment and work-related stress.
Finally, we discussed economic scarring as a result of economic crisis. We surveyed the costs incurred to individuals, in terms of employment, human capital accumulation and health outcomes, and the associated impacts on future productivity needed for long-term growth.
UK industrialisation provided a trailblazing model for economic transformation across the world. Growth has vastly increased standard of living, alleviated poverty and enabled advances in healthcare and technology. However, it set into motion an industrial landscape that continues to influence socio-economic outcomes in the UK. Further, the UK’s relationship with crisis recovery has caused it to fall behind its industrialised competitors and has left some regions struggling.
In our next paper Wardley-Kershaw and Schenk-Hoppé (2022c), we reflect on some of the challenges that will affect future growth and development in the UK and abroad, and survey suggestions from literature as to how these challenges may be addressed. We consider how growth can enable a more equitable and resilient economy. This includes discussion of policy to foster accessible growth: inclusive growth, area-specific strategy and integrated policy that combines transport, education, housing and healthcare. This could improve regional human capital accumulation, and reduce disconnection and spatial mismatches, in order to promote self-sufficient local economic growth.
In our paper Wardley-Kershaw and Schenk-Hoppé (2022b), we assessed that lack of focus in relevant human capital accumulation when compared to other major industrialised economies, particularly in the post-WW2 period, negatively impacted the UK’s prospects for the long-term productivity advances needed for future growth. We also discovered that favouring a fast return to growth trends has often been the priority of crisis management; however, this has isolated former industrial areas. In our paper Wardley-Kershaw and Schenk-Hoppé (2022c), we examine how economic policy can be proactive, to implement the long-term structural changes needed for future growth. We survey the human capital requirements of the future economy to prevent skills mismatches, such as the skilling required for an economy that is increasingly automated, and discuss the interwoven nature of climate, health and economic inequalities when considering policy surrounding growth.
Future directions for research into the inequalities explored in this paper could include empirical comparisons between the UK and its industrialised counterparts, to assess the impacts of policy surrounding growth and productivity following periods of economic distress and transition. This could provide a starting point for informing future UK economic policy needed for long-term productivity and growth. Further, research into the regional impacts of the COVID-19 pandemic could provide an up-to-date empirical basis with which to consider suitable localised economic strategy.
Author Contributions
Conceptualization, J.W.-K. and K.R.S.-H.; methodology, J.W.-K. and K.R.S.-H.; writing—original draft preparation, J.W.-K.; writing—review and editing, J.W.-K. and K.R.S.-H.; supervision, K.R.S.-H.; funding acquisition, K.R.S.-H. All authors have read and agreed to the published version of the manuscript.
Funding
This research received no external funding.
Acknowledgments
We gratefully acknowledge financial support by The University of Manchester’s SEI programme.
Conflicts of Interest
The authors declare no conflict of interest.
Notes
| 1 | Sources: Scotland: The Scottish Government (2019) (Scottish Index of Multiple Deprivation 2012), Wales: Welsh Government (Welsh Index of Multiple Deprivation 2019), England: Ministry of Housing, Communities & Local Government (English Indices of Multiple Deprivation 2019), licensed under Open Government Licence v3.0. Note: Northern Ireland not featured due to copyright restrictions. |
| 2 | Source: Life expectancy for local areas of the UK: between 2001 to 2003 and 2017 to 2019, Office for National Statistics (2021a), licensed under the Open Government Licence v.3.0. |
| 3 | Source: Office for National Statistics (2020a), licensed under the Open Government Licence v.3.0. |
| 4 | Source: Bank of England, featured in‘How has GDP growth changed over time’ and Bank of England via Office for National Statistics (2019), licensed under the Open Government Licence v.3.0, featured in ‘Long-term trends in UK employment: 1861–2018’. |
| 5 | Source: Office for National Statistics (2021c), Gross domestic expenditure on research and development, Regional tables, via House of Commons Library, licensed under Open Parliament Licence v3.0. |
References
- Bibby, Jo. 2017. How Do Our Education and Skills Influence Our Health? The Health Foundation. Available online: https://www.health.org.uk/infographics/how-do-our-education-and-skills-influence-our-health (accessed on 20 August 2021).
- Bolton, Paul. 2021. Higher Education Student Numbers. House of Commons Library, Research Briefing. February 26. Available online: https://commonslibrary.parliament.uk/research-briefings/cbp-7857/ (accessed on 8 August 2021).
- Borgo, Mariela D., Peter Goodridge, Jonathan Haskel, and Annarosa Pesole. 2013. Productivity and Growth in UK Industries: An Intangible Investment Approach. Oxford Bulletin of Economics and Statistics 75: 806–34. [Google Scholar] [CrossRef]
- Burch, Patrick. 2018. NHS Funding’s North-South Divide: Why the ‘Sicker’ North Gets Less Money. The Conversation. March 21. Available online: https://www.manchester.ac.uk/discover/news/nhs-fundings-north-south-divide-why-the-sicker-north-gets-less-money/ (accessed on 20 August 2021).
- Creative Industries Clusters. 2021. Creative Industries Clusters Programme, Arts & Humanities Research Council. Available online: https://creativeindustriesclusters.com/ (accessed on 8 August 2021).
- Creative Industries Council. 2019. Employment Figures—The Creative Industries. Available online: https://www.thecreativeindustries.co.uk/facts-figures/uk-creative-overview-facts-and-figures-employment-figures (accessed on 8 August 2021).
- Creative Industries Federation. 2021. Industry Statistics. Available online: https://www.creativeindustriesfederation.com/statistics (accessed on 8 August 2021).
- Education Policy Institute. 2020a. Education in England: Annual Report 2020, Education Policy Institute. Available online: https://epi.org.uk/publications-and-research/education-in-england-annual-report-2020/ (accessed on 20 August 2021).
- Education Policy Institute. 2020b. Teacher Shortages in England: Analysis and Pay Options, Teaching and Leadership: Supply and Quality Report, Education Policy Institute. March 2. Available online: https://epi.org.uk/publications-and-research/teacher-shortages-in-england-analysis-and-pay-options/ (accessed on 20 August 2021).
- Fauth, Becky. 2009. ‘Good Work’ in the Knowledge Economy: Evidence from Two Studies. Centre for Local Economic Strategies, Issue 83. Available online: https://cles.org.uk/wp-content/uploads/2011/01/LW83-Good-work.pdf (accessed on 8 August 2021).
- Health and Safety Executive. 2020. Work-Related Stress, Anxiety or Depression Statistics in Great Britain, 2019. In Annual Statistics. Available online: https://www.hse.gov.uk/statistics/causdis/stress.pdf (accessed on 8 August 2021).
- Heyes, Jason, Mark Tomlinson, and Adam Whitworth. 2017. Underemployment and Well-Being in the UK Before and After the Great Recession. Work, Employment and Society 31: 71–89. [Google Scholar] [CrossRef]
- Hutton, Georgina, Chris Rhodes, and Matthew Ward. 2021. Research & Development Spending. House of Commons Library, Briefing Paper No. SN04223. Available online: https://researchbriefings.files.parliament.uk/documents/SN04223/SN04223.pdf (accessed on 8 August 2021).
- Irons, John. 2009. Economic Scarring: The Long-Term Impacts of the Recession, Economic Policy Institute Briefing Paper #243. September 30. Available online: https://www.epi.org/publication/bp243/ (accessed on 8 August 2021).
- Kontopantelis, Evangelos, Iain Buchan, Roger T. Webb, Darren M. Ashcroft, Mamas A. Mamas, and Tim Doran. 2018. Disparities in Mortality among 25–44-year-olds in England: A Longitudinal, Population-Based Study. The Lancet Public Health 3: e567–e75. [Google Scholar] [CrossRef]
- Lee, Neil, and Paul Sissons. 2016. Inclusive Growth? The Relationship between Economic Growth and Poverty in British Cities. Environment and Planning A: Economy and Space 48: 2317–39. [Google Scholar] [CrossRef]
- Marmot, Michael. 2010. Fair Society, Healthy Lives, The Marmot Review, Report 2/2010, Institute of Health Equity. Available online: https://www.instituteofhealthequity.org/resources-reports/fair-society-healthy-lives-the-marmot-review/ (accessed on 20 August 2021).
- Martin, Ron. 1988. The Political Economy of Britain’s North-South Divide. Transactions of the Institute of British Geographers 13: 389–418. [Google Scholar] [CrossRef]
- McCann, Philip. 2020. Perceptions of Regional Inequality and the Geography of Discontent: Insights From the UK. Regional Studies 54: 256–67. [Google Scholar] [CrossRef]
- Melachroinos, Konstantinos A., and Nigel Spence. 2013. The Territorial Impact of the Knowledge Economy: Intangibles and Regional Inequality in Great Britain. European Planning Studies 21: 1491–508. [Google Scholar] [CrossRef]
- Office for National Statistics. 2019. Long-term Trends in UK Employment: 1861 to 2018, Compendium, Office for National Statistics. April 29. Available online: https://www.ons.gov.uk/economy/nationalaccounts/uksectoraccounts/compendium/economicreview/april2019/longtermtrendsinukemployment1861to2018 (accessed on 8 August 2021).
- Office for National Statistics. 2020a. Regional Gross Disposable Household Income, UK: 1997 to 2018. In Statistical Bulletin, Office for National Statistics; June 4. Available online: https://www.ons.gov.uk/economy/regionalaccounts/grossdisposablehouseholdincome/bulletins/regionalgrossdisposablehouseholdincomegdhi/1997to2017 (accessed on 20 August 2021).
- Office for National Statistics. 2020b. Travel Trends: 2019, Article, Office for National Statistics. May 22. Available online: https://www.ons.gov.uk/peoplepopulationandcommunity/leisureandtourism/articles/traveltrends/2019 (accessed on 8 August 2021).
- Office for National Statistics. 2021a. Health State Life Expectancies, UK: 2017 to 2019. In Statistical Bulletin, Office for National Statistics; January 25. Available online: https://www.ons.gov.uk/peoplepopulationandcommunity/healthandsocialcare/healthandlifeexpectancies/bulletins/healthstatelifeexpectanciesuk/2016to2018 (accessed on 20 August 2021).
- Office for National Statistics. 2021b. Health State Life Expectancies by National Deprivation Deciles, England: 2017 to 2019. In Census 2021, Office for National Statistics; March 22. Available online: https://www.ons.gov.uk/peoplepopulationandcommunity/healthandsocialcare/healthinequalities/bulletins/healthstatelifeexpectanciesbyindexofmultipledeprivationimd/2017to2019 (accessed on 20 August 2021).
- Office for National Statistics. 2021c. Gross Domestic Expenditure on Research and Development, UK: 2019. In Statistical Bulletin, Office for National Statistics; August 4. Available online: https://www.ons.gov.uk/economy/governmentpublicsectorandtaxes/researchanddevelopmentexpenditure/bulletins/ukgrossdomesticexpenditureonresearchanddevelopment/2019 (accessed on 8 August 2021).
- Rae, Alasdair, Ruth Hamilton, Rich Crisp, and Ryan Powell. 2016. Overcoming Deprivation. Available online: https://www.jrf.org.uk/report/overcoming-deprivation-and-disconnection-uk-cities (accessed on 20 August 2021).
- Scott-Samuel, Alex, Clare Bambra, Chik Collins, David J. Hunter, Gerry McCartney, and Kat Smith. 2014. The Impact of Thatcherism on Health and Well-Being in Britain. International Journal of Health Services 44: 53–71. [Google Scholar] [CrossRef] [PubMed]
- Scottish Government. 2019. Creative Industries: Policy Statement. October 11. Available online: https://www.gov.scot/publications/policy-statement-creative-industries/ (accessed on 8 August 2021).
- Stanley, Isaac, and Madeleine Gabriel. 2019. A Knowledge Economy that Works for All, Nesta Report. March 18. Available online: https://www.nesta.org.uk/blog/knowledge-economy-works-all/ (accessed on 8 August 2021).
- The Health Foundation. 2019. Employment and Unemployment: How Does Work Affect Our Health? Available online: https://www.health.org.uk/news-and-comment/charts-and-infographics/unemployment (accessed on 20 August 2021).
- The Mersey Partnership. 2015. Liverpool City Region’s Knowledge Economy: Delivering New Opportunities for Growth. Available online: https://www.liverpoollep.org/wp-content/uploads/2015/06/wpid-lcr-knowledge-economy-plan-summary-02-2011.pdf (accessed on 8 August 2021).
- Tinson, Adam, Carla Ayrton, Karen Barker, Theo Barry Born, Hannah Aldridge, and Peter Kenway. 2016. Monitoring poverty and social exclusion 2016 (MPSE). Joseph Rowntree Report. Available online: https://www.jrf.org.uk/report/monitoring-poverty-and-social-exclusion-2016 (accessed on 20 August 2021).
- Unger, Roberto, Isaac Stanley, Madeleine Gabriel, and Geoff Mulgan. 2019. Imagination Unleashed: Democratising the Knowledge Economy, Nesta Report. March. Available online: https://media.nesta.org.uk/documents/Imagination_unleashed-_Democratising_the_knowledge_economy_v6.pdf (accessed on 8 August 2021).
- University of Cambridge. 2017. Causes of Work-Related Stress, Human Resources, University of Cambridge. Available online: https://www.hr.admin.cam.ac.uk/policies-procedures/managing-stress-and-promoting-wellbeing-work-policy/policy-statement/causes-work (accessed on 8 August 2021).
- Walsh, David, Neil Bendel, Richard Jones, and Phil Hanlon. 2010. It’s Not “Just Deprivation”: Why Do Equally Deprived UK Cities Experience Different Health Outcomes? Public Health 124: 487–95. [Google Scholar] [CrossRef] [PubMed]
- Wardley-Kershaw, Julia, and Klaus R. Schenk-Hoppé. 2022a. Economic Growth in the UK: The Inception. World 1: 162–74. [Google Scholar] [CrossRef]
- Wardley-Kershaw, Julia, and Klaus R. Schenk-Hoppé. 2022b. Economic Growth in the UK: Growth’s Battle with Crisis. Histories 2: 374–404. [Google Scholar] [CrossRef]
- Wardley-Kershaw, Julia, and Klaus R. Schenk-Hoppé. 2022c. Perspectives on the Future of Growth. World 3: 299–312. [Google Scholar] [CrossRef]


Publisher’s Note: MDPI stays neutral with regard to jurisdictional claims in published maps and institutional affiliations. |
© 2022 by the authors. Licensee MDPI, Basel, Switzerland. This article is an open access article distributed under the terms and conditions of the Creative Commons Attribution (CC BY) license (https://creativecommons.org/licenses/by/4.0/).