Case Report

Brain Biomarkers of Long-Term Outcome of Neonatal Onset Urea Cycle Disorder

1
Touro College of Osteopathic Medicine, Middletown, NY 10940, USA
2
University Children’s Hospital and Children’s Research Center, Zurich 8091, Switzerland
3
Department of Neurology, Children’s National Health System, 111 Michigan Avenue, N.W., Washington, DC 20010, USA
4
Georgetown University Hospital, Washington, DC 20010, USA
*
Author to whom correspondence should be addressed.
Int. J. Neonatal Screen. 2016, 2(4), 10; https://doi.org/10.3390/ijns2040010
Submission received: 11 July 2016 / Accepted: 12 October 2016 / Published: 15 November 2016

Abstract

:
Urea cycle disorders (UCDs) are common inborn errors of metabolism, with an incidence of one in 30,000 births. They are caused by deficiencies in any of six enzymes and two carrier proteins, the most common being Ornithine Transcarbamylase Deficiency (OTCD). OTCD results in impairment to excrete nitrogen, causing toxic buildup of ammonia with resultant encephalopathy. Hyperammonemia (HA) induces the conversion of glutamate to glutamine in the brain. Excess glutamine in the brain causes osmotic changes, cerebral edema, changes in astrocyte morphology, and cell death. Acute symptoms of HA include vomiting, hyperventilation, seizures, and irritability. Long-term neurological effects include deficits in working memory and executive function. To date, there are no predictors of prognosis of infants with neonatal onset OTCD outside of the plasma ammonia level at presentation and duration of a hyperammonemic coma. We provide a comprehensive analysis of a 16-year-old male with neonatal onset of OTCD as an example of how brain biomarkers may be useful to monitor disease course and outcome. This male presented at 8 days of life with plasma ammonia and glutamine of 677 and 4024 micromol/L respectively, and was found to have a missense mutation in Exon 4 (p. R129H). Treatment included protein restriction, sodium benzoate, and citrulline, arginine, and iron. Despite compliance, he suffered recurrent acute hyperammonemic episodes triggered by infections or catabolic stressors. We discuss the long-term effects of the hyperammonemic episodes by following MRI-based disease biomarkers.

1. Introduction

The urea cycle disorders (UCDs) represent a group of rare inborn errors of metabolism characterized by a defect in the metabolism of waste nitrogen from the breakdown of protein and other nitrogen-containing molecules (Figure 1) [1,2]. Severe deficiency or total absence of activity of any of the first four enzymes in the urea cycle (Carbamoyl phosphate Synthetase 1, CPS1; Ornithine transcarbamylase, OTC; Argininosuccinate Synthetase, ASS; and Argininosuccinate Lyase, ASL) or the cofactor producer (N-Acetyl glutamate Synthase, NAGS) results in the accumulation of ammonia and other precursors. Infants with severe UCDs appear normal at birth but quickly develop cerebral edema with resultant lethargy, anorexia, hyper- or hypoventilation, hypothermia, seizures, and coma. In milder (or partial) deficiencies of these enzymes and in arginase (ARG) deficiency, ammonia accumulation may be transient and triggered by illness or stressors.
Proximal UCDs (CPS1, NAGs and OTC deficiencies) lead to accumulation of ammonia and glutamine (gln), which may be toxic products of protein metabolism when elevated [3]. The symptoms of these disorders may become present at any age and the consequences are neurological of varying severity. Neonatal proximal UCDs are usually associated with severe disabilities including encephalopathy, seizures and coma. Without proper treatment, many will succumb to the illness. Increased awareness and institution of early therapy has resulted in less mortality and outcomes, but cognitive sequelae persist [4]. The outcome in childhood onset disease ranges from very mild to severe cognitive and behavioral sequelae [5]. An emerging group of UCD patients are adolescents and adults with psychiatric manifestations [6] revealing inborn errors of metabolism in adolescents and adults.
A common theme of proximal UCDs is hyperammonemia (HA). The majority of patients have substantial cognitive and motor deficits due to HA episodes that may be clinical or subclinical.
In the distal disorders (argininosuccinate synthase (ASD), or argininosuccinate lyase (ALD)), cognitive outcomes may be due to additional brain toxins. Acute and chronic changes in behavior and level of consciousness are reflected in the findings of seizures encephalopathy, brain edema, and coma.
The pathophysiology by which HA leads to brain injury in UCDs is only partially understood. Episodes of HA cause injury to the brain’s white matter. We and others have shown that even “asymptomatic” OTCD is associated with an altered neurocognitive profile in an array of cognitive subdomains based in the prefrontal cortex (PFC), such as working memory, executive cognition and attention [7,8,9]. These deficits contribute significantly to disability.
Neuroimaging can help us probe markers of neurological dysfunction in inborn errors of metabolism (IEMs). Magnetic resonance imaging (MRI) can demonstrate microscopic anatomic damage that precedes clinical symptoms [10]. Functional MRI (fMRI) and white matter tractography help one to understand how the brain constructs neural networks to perform cognitive tasks and how these networks are altered in brain disorders and recovery [7,8,9,11,12].
Magnetic resonance spectroscopy (MRS) can allow quantitative sampling of regional, focal, and global changes in metabolism with regard to preclinical changes and response to therapies [13]. Recognition of a number of in vivo neuroimaging techniques, which can reliably and noninvasively assess aspects of neuroanatomy, chemistry, physiology, and pathology, hold promise as biomarkers.

2. Patient and Methods

We conducted a retrospective chart review of a 16-year-old male patient who presented with neonatal onset OTCD at University Children’s Hospital in Zurich, Switzerland. The patient’s parents signed ethics consent to participate in the UCDC studies. The patient had undergone repeated MRI and MR spectroscopy on a 1.5 Tesla Siemens scanner and blood analyses of ammonia and glutamine over the course of several years with closer monitoring of plasma ammonia and glutamine in the infancy period. We abstracted the following data: Plasma glutamine and ammonia levels when available, 1H MRS of white matter and basal ganglia at several key time intervals, routine MRI Images, hospitalization records and neuropsychological testing results.

2.1. Presentation of the Case

The patient is the second child of healthy, non-consanguineous Swiss parents. The mother was an asymptomatic carrier. The older sister is not a carrier, and is healthy. Diagnosis of OTC deficiency was made after neonatal onset HA with typical laboratory signs including elevated plasma glutamine and urinary orotic acid. The patient required numerous hospitalizations during infancy to treat symptomatic HA. During early childhood, the metabolic situation was more stable but the patient was still hospitalized a few times a year. In later childhood and before and during puberty, the situation worsened, rendering frequent hospitalizations necessary (Figure 2 and Figure 3). Finally, the patient successfully received a liver transplant at 15 years of age. Details of the years before liver transplantation were published elsewhere [14].
Metabolic crises were preceded in most cases by typical triggers including viral infections but there were also several episodes in which no clear trigger was identified. The majority of the crises could be managed by standard medical treatment with infusions of high glucose, and boluses of nitrogen scavenger drugs (sodium benzoate and/or sodium phenylacetate) followed by continuous infusions of the same drugs. The patient’s clinical situation rarely required monitoring in the intensive care unit, although several of the episodes were accompanied by severe encephalopathy. There was no need for repeated hemodialysis outside of the neonatal period.
During long-term management, the patient received a strict protein-restricted diet allowing only intake of the minimal required amount of protein necessary for normal growth. In addition, essential amino acids, trace elements and vitamins were given. As well, the patient needed all available drugs including l-arginine and l-citrulline, and sodium benzoate and sodium phenylbutyrate, which were all given at the maximum recommended dosages. Despite this very challenging treatment, compliance was excellent. The patient underwent brain imaging with MRI/MRS during and after some of the HA episodes (Figure 4), as well as almost 2 years after liver transplantation.
The MRS on 3 October 2008 was done shortly after a hyperammonemic event (HA). The MRI on 11 August 2008 was performed after resolution of HA. Here are some of the ammonia levels from the preceding days (all in µmol/L) (Table 1).
The neurological development of the patient was compromised by the recurrent HA crises as well as by the many days he spent in hospital. Formal developmental testing revealed a global DQ (Developmental Quotient) score of 73 and 74 (Average is 100; ±15 points, so clearly below average) at ages 9 and 14 years, respectively (Table 2), and he required transfer to a special school for children with disabilities.

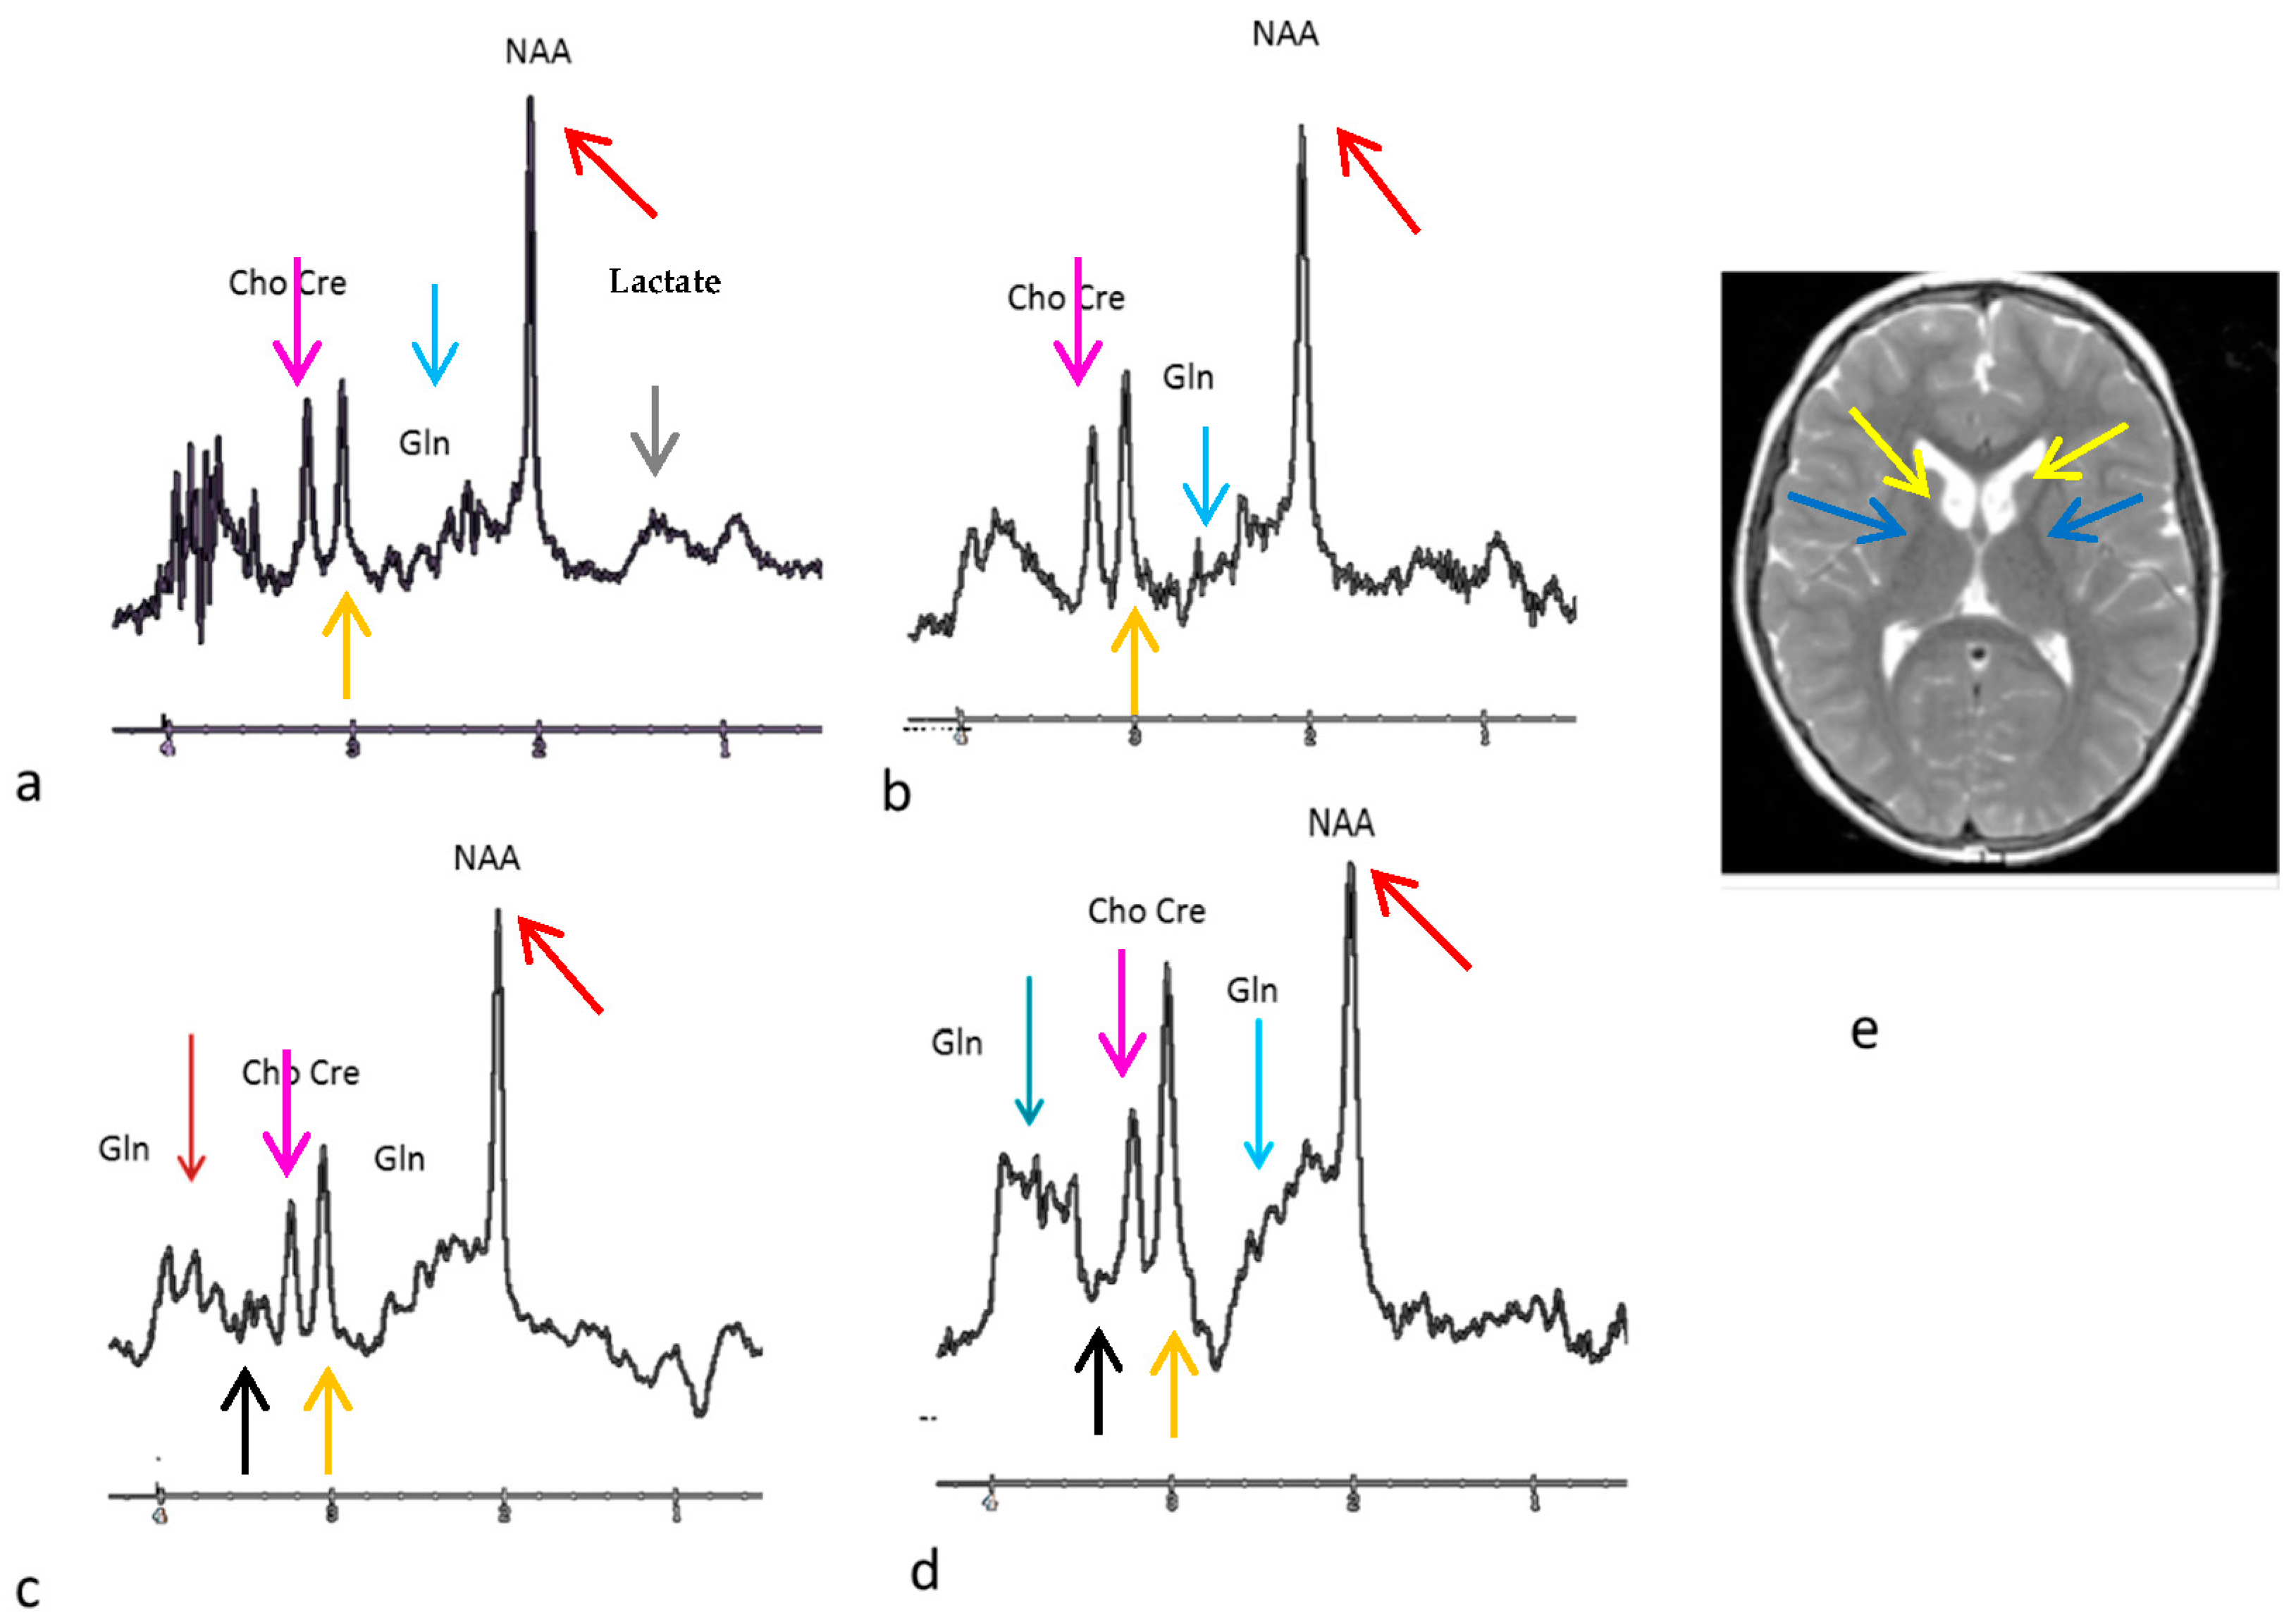
2.2. Neuroimaging Collection

Imaging was performed on a Siemens 1.5 T Trio system which is a whole body system. 1H MRS was used to generate a metabolite profile using single voxel approaches. All measurements were acquired using a manufacturer supplied phased array head coil. For single-voxel spectroscopy, a volume localized PRESS sequence with echo time (TE) of 30 ms, repetition time (TR) of 2000 ms, with a voxel of 2.0 cm on edge (8 mL) centered at the various points of interest was used.

3. Results

Several observations are noteworthy and have been observed by others. Plasma glutamine and ammonia levels were not always correlated with one another and glutamine increase may precede the development of HA. Likewise, a return to normal plasma ammonia may not be associated with normalization of the plasma ammonia. In this patient, plasma glutamine and brain glutamine levels (measured by 1H MRS) both remained elevated during the HA episode even after plasma ammonia levels return to normal following a hyperammonemic episode, (elevated concentrations >60 umol/L). Decreased N-acetylaspartate (NAA) peak on MR spectroscopy was observed following a hyperammonemic episode. This has not been seen in all patients with ornithine transcarbamylase deficiency, especially those with late onset OTCD [15] and suggests neuronal loss or dysfunction. In routine T1 and T2 MRI, the brain appears to be relatively normal, without signal alterations despite elevated glutamine levels, pointing to the utility of 1H MRS in the acute and chronic stages of recovery.

4. Conclusions

This study represents the first comprehensive long-term analysis of a patient with neonatal onset of OTCD. The mechanism leading to ammonia-induced neuropathology in UCD remains uncertain. Clinical signs of hyperammonemia can occur in some patients even at concentrations <60 µmol/L and may include anorexia, irritability, lethargy, somnolence, disorientation or other mental status changes. Accumulations of ammonia, Gln, and Glu have been shown to exert toxic effects upon the brain. In animal models, the HA state leads to excitotoxic cell death and, with prolonged exposure, to the loss of N-methyl-d-aspartate receptor (NMDA) receptors. These same receptors are altered in the sparse fur (Spf) mouse model of OTCD [16].
The postulated effects of elevated ammonia and Gln include astrocytic swelling [17], an increase in blood–brain barrier permeability, disruption of energy through the depletion of intermediaries of metabolism including altered amino acid and neurotransmitter levels [18,19,20]. A rise in plasma Gln levels has also been found to proceed HA. Additional evidence for this hypothesis is the presence of elevated brain Gln as measured by 1H MRS in patients with OTCD with HA encephalopathy [15]. The results support the view that the encephalopathy associated with HA is related to the elevated concentration of brain Gln.
Gln accumulation is considered neurotoxic and has been implicated in the neuropathology of OTCD. Previous studies in UCD have involved small case series using clinical CT/MRI. Survivors of a prolonged HA coma were shown to sustain severe brain pathology including, ventriculomegaly and cortical atrophy. Patients with milder deficits showed bilateral, a/symmetrical low density white matter lesions that were found to be reversible with treatment. The brain biochemical findings resemble those in hepatic encephalopathy. Previous 1H MRS studies in patients with hepatic encephalopathy revealed a triad of findings including choline depletion, myoinositol depletion and increased Gln [21,22,23].
Recently, non-interventional variables of disease severity, such as age at disease onset and peak ammonium level of the initial hyperammonemic crisis (cut-off level: 500 μmol/L) best predicted the neurological outcome [24,25].
Elevated levels of plasma and brain glutamine, despite normal plasma ammonia levels following HA episodes, suggest that glutamine may be a better indicator of neurotoxicity. This has been observed in other settings, such as acetaminophen toxicity as reported by Brusilow and Cooper [26]. Furthermore, because plasma glutamine and ammonia were not always related, plasma ammonia cannot serve as a reliable clinical marker for neuronal damage. Elevated glutamine and decreased NAA on MR spectroscopy, indicating possible neuronal apoptosis, support this finding. Normal MRI results, despite neurocognitive changes, impaired growth, and delayed development suggest that routine imaging may not include the optimal imaging technique to monitor neuronal damage. Our findings have implications for clinical practice and dietary management to prevent cognitive sequelae of hyperammonemia or its effects. Based on this fact and findings on 1H MR spectroscopy, we posture that 1H MRS should be considered as part of the routine clinical work up in OTCD patients to monitor acute and long-term changes. Further research is needed to prospectively examine the relationship between adverse events and neurocognitive function in OTCD patients.

Author Contributions

For research articles with several authors, a short paragraph specifying their individual contributions must be provided. Maha Mourad, Johannes Häberle, and Andrea Gropman conceived and designed the study; Johannes Häberle and Tamar Stricker cared for the patient and collected the data; Matthew T. Whitehead, Andrea Gropman, and Maha Mourad analyzed the data; Maha Mourad, Johannes Häberle, and Andrea Gropman wrote the paper.

Conflicts of Interest

The authors declare no conflict of interest.

References

  1. Applegarth, D.A.; Toone, J.R.; Lowry, R.B. Incidence of inborn errors of metabolism in British Columbia, 1969–1996. Pediatrics 2000, 105, E10. [Google Scholar] [CrossRef] [PubMed]
  2. Nagata, N.; Matsuda, I.; Oyanagi, K. Estimated frequency of urea cycle enzymopathies in Japan. Am. J. Med. Genet. 1991, 39, 228–229. [Google Scholar] [CrossRef] [PubMed]
  3. Jayakumar, A.R.; Rao, K.V.; Murthy, Ch.R.K.; Norenberg, M.D. Glutamine in the mechanism of ammonia-induced astrocyte swelling. Neurochem. Int. 2006, 48, 623–628. [Google Scholar] [CrossRef] [PubMed]
  4. Gropman, A.L.; Summar, M.; Leonard, J.V. Neurological implications of urea cycle disorders. J. Inherit. Metab. Dis. 2007, 30, 865–879. [Google Scholar] [CrossRef] [PubMed]
  5. Krivitzky, L.; Babikian, T.; Lee, H.S.; Thomas, N.H.; Burk-Paull, K.L.; Batshaw, M.L. Intellectual, adaptive, and behavioral functioning in children with urea cycle disorders. Pediatr. Res. 2009, 66, 96–101. [Google Scholar] [CrossRef] [PubMed]
  6. Sedel, F.; Baumann, N.; Turpin, J.C.; Lyon-Caen, O.; Saudubray, J.M.; Cohen, D. Psychiatric manifestations revealing inborn errors of metabolism in adolescents and adults. J. Inherit. Metab. Dis. 2007, 30, 631–641. [Google Scholar] [CrossRef] [PubMed]
  7. Gropman, A.L.; Shattuck, K.; Prust, M.J.; Seltzer, R.R.; Breeden, A.L.; Hailu, A.; Rigas, A.; Hussain, R.; VanMeter, J. Altered neural activation in ornithine transcarbamylase deficiency during executive cognition: An fMRI study. Hum. Brain Mapp. 2013, 34, 753–761. [Google Scholar] [CrossRef] [PubMed]
  8. Sprouse, C.; King, J.; Helman, G.; Pacheco-Colón, I.; Shattuck, K.; Breeden, A.; Seltzer, R.; VanMeter, J.W.; Gropman, A.L. Investigating neurological deficits in carriers and affected patients with ornithine transcarbamylase deficiency. Mol. Genet. Metab. 2014, 12, 136–141. [Google Scholar] [CrossRef] [PubMed]
  9. Pacheco-Colón, I.; Washington, S.D.; Sprouse, C.; Helman, G.; Gropman, A.L.; VanMeter, J.W. Reduced Functional Connectivity of Default Mode and Set-Maintenance Networks in Ornithine Transcarbamylase Deficiency. PLoS ONE 2015, 10, e0129595. [Google Scholar] [CrossRef] [PubMed]
  10. Dickson, P.I.; Pariser, A.R.; Groft, S.C.; Ishihara, R.W.; McNeil, D.E.; Tagle, D.; Griebel, D.J.; Kaler, S.G.; Mink, J.W.; Shapiro, E.G.; et al. Research challenges in central nervous system manifestations of inborn errors of metabolism. Research challenges in central nervous system manifestations of inborn errors of metabolism. Mol. Genet. Metab. 2011, 102, 326–338. [Google Scholar] [CrossRef] [PubMed]
  11. Almeida, S.R.; Vicentini, J.; Bonilha, L.; De Campos, B.M.; Casseb, R.F.; Min, L.L. Brain Connectivity and Functional Recovery in Patients with Ischemic Stroke. J. Neuroimaging 2016. [Google Scholar] [CrossRef] [PubMed]
  12. Gropman, A.L.; Gertz, B.; Shattuck, K.; Kahn, I.L.; Seltzer, R.; Krivitsky, L.; VanMeter, J. Diffusion tensor imaging detects areas of abnormal white matter microstructure in patients with partial ornithine transcarbamylase deficiency. Am. J. Neuroradiol. 2010, 31, 1719–1723. [Google Scholar] [CrossRef] [PubMed]
  13. Vafaeyan, H.; Ebrahimzadeh, S.A.; Rahimian, N.; Alavijeh, S.K.; Madadi, A.; Faeghi, F.; Harirchian, M.H.; Rad, H.S. Quantification of diagnostic biomarkers to detect multiple sclerosis lesions employing (1) H-MRSI at 3T. Australas. Phys. Eng. Sci. Med. 2015, 38, 611–618. [Google Scholar] [CrossRef] [PubMed]
  14. Laemmle, A.; Stricker, T.; Häberle, J. Switch from Sodium Phenylbutyrate to Glycerol Phenylbutyrate Improved Metabolic Stability in an Adolescent with Ornithine Transcarbamylase Deficiency. JIMD Rep. 2016. [Google Scholar] [CrossRef]
  15. Gropman, A.L.; Fricke, S.T.; Seltzer, R.R.; Hailu, A.; Adeyemo, A.; Sawyer, A.; VanMeter, J.; Gaillard, W.D.; McCarter, R.; Tuchman, M.; et al. Urea Cycle Disorders Consortium. 1H MRS identifies symptomatic and asymptomatic subjects with partial ornithine transcarbamylase deficiency. Mol. Genet. Metab. 2008, 95, 21–30. [Google Scholar] [CrossRef] [PubMed]
  16. Qureshi, I.A.; Rao, K.V. Sparse-fur (Spf) mouse as a model of hyperammonemia: Alterations in the neurotransmitter systems. Adv. Exp. Med. Biol. 1997, 420, 143–158. [Google Scholar] [PubMed]
  17. Norenberg, M.D.; Rao, K.V.; Jayakumar, A.R. Mechanisms of ammonia-induced astrocyte swelling. Metab. Brain Dis. 2005, 20, 303–318. [Google Scholar] [CrossRef] [PubMed]
  18. Bachmann, C.; Colombo, J.P. Increase of tryptophan and 5-hydroxyindole acetic acid in the brain of ornithine carbamoyltransferase deficient sparse-fur mice. Pediatr. Res. 1984, 18, 372–375. [Google Scholar] [CrossRef] [PubMed]
  19. Butterworth, R.F. Effects of hyperammonaemia on brain function. J. Inherit. Metab. Dis. 1998, 21 (Suppl. 1), 6–20. [Google Scholar] [CrossRef] [PubMed]
  20. Watanabe, A.; Shiota, T.; Takei, N.; Nagashima, H. Excitatory and inhibitory amino acid neurotransmitters and ammonia metabolism in hepatic failure rats. Res. Exp. Med. 1985, 185, 399–404. [Google Scholar] [CrossRef]
  21. Connelly, A.; Cross, J.H.; Gadian, D.G.; Hunter, J.V.; Kirkham, F.J.; Leonard, J.V. Magnetic resonance spectroscopy shows increased brain glutamine in ornithine carbamoyl transferase deficiency. Pediatr. Res. 1993, 33, 77–81. [Google Scholar] [CrossRef] [PubMed]
  22. Takanashi, J.; Barkovich, A.J.; Cheng, S.F.; Kostiner, D.; Baker, J.C.; Packman, S. Brain MR imaging in acute hyperammonemic encephalopathy arising from late-onset ornithine transcarbamylase deficiency. Am. J. Neuroradiol. 2003, 24, 390–393. [Google Scholar] [PubMed]
  23. Gunz, C.; Choong, K.; Potter, M.; Miller, E. Magnetic resonance imaging findings and neurodevelopmental outcomes in neonates with urea cycle disorders. Int. Med. Case Rep. J. 2013, 6, 41–48. [Google Scholar] [CrossRef] [PubMed]
  24. Posset, R.; Garcia-Cazorla, A.; Valayannopoulos, V.; Teles, E.L.; Dionisi-Vici, C.; Brassier, A.; Burlina, A.B.; Burgard, P.; Cortès-Saladelafont, E.; Dobbelaere, D.; et al. Additional individual contributors of the E-IMD consortium. Age at disease onset and peak ammonium level rather than interventional variables predict the neurological outcome in urea cycle disorders. J. Inherit. Metab. Dis. 2016, 39, 661–672. [Google Scholar] [CrossRef] [PubMed]
  25. Rüegger, C.M.; Lindner, M.; Ballhausen, D.; Baumgartner, M.R.; Beblo, S.; Das, A.; Gautschi, M.; Glahn, E.M.; Grünert, S.C.; Hennermann, J.; et al. Cross-sectional observational study of 208 patients with non-classical urea cycle disorders. J. Inherit. Metab. Dis. 2014, 37, 21–30. [Google Scholar] [CrossRef] [PubMed]
  26. Brusilow, S.W.; Cooper, A.J. Encephalopathy in acute liver failure resulting from acetaminophen intoxication: New observations with potential therapy. Crit. Care Med. 2011, 39, 2550–2553. [Google Scholar] [CrossRef] [PubMed]
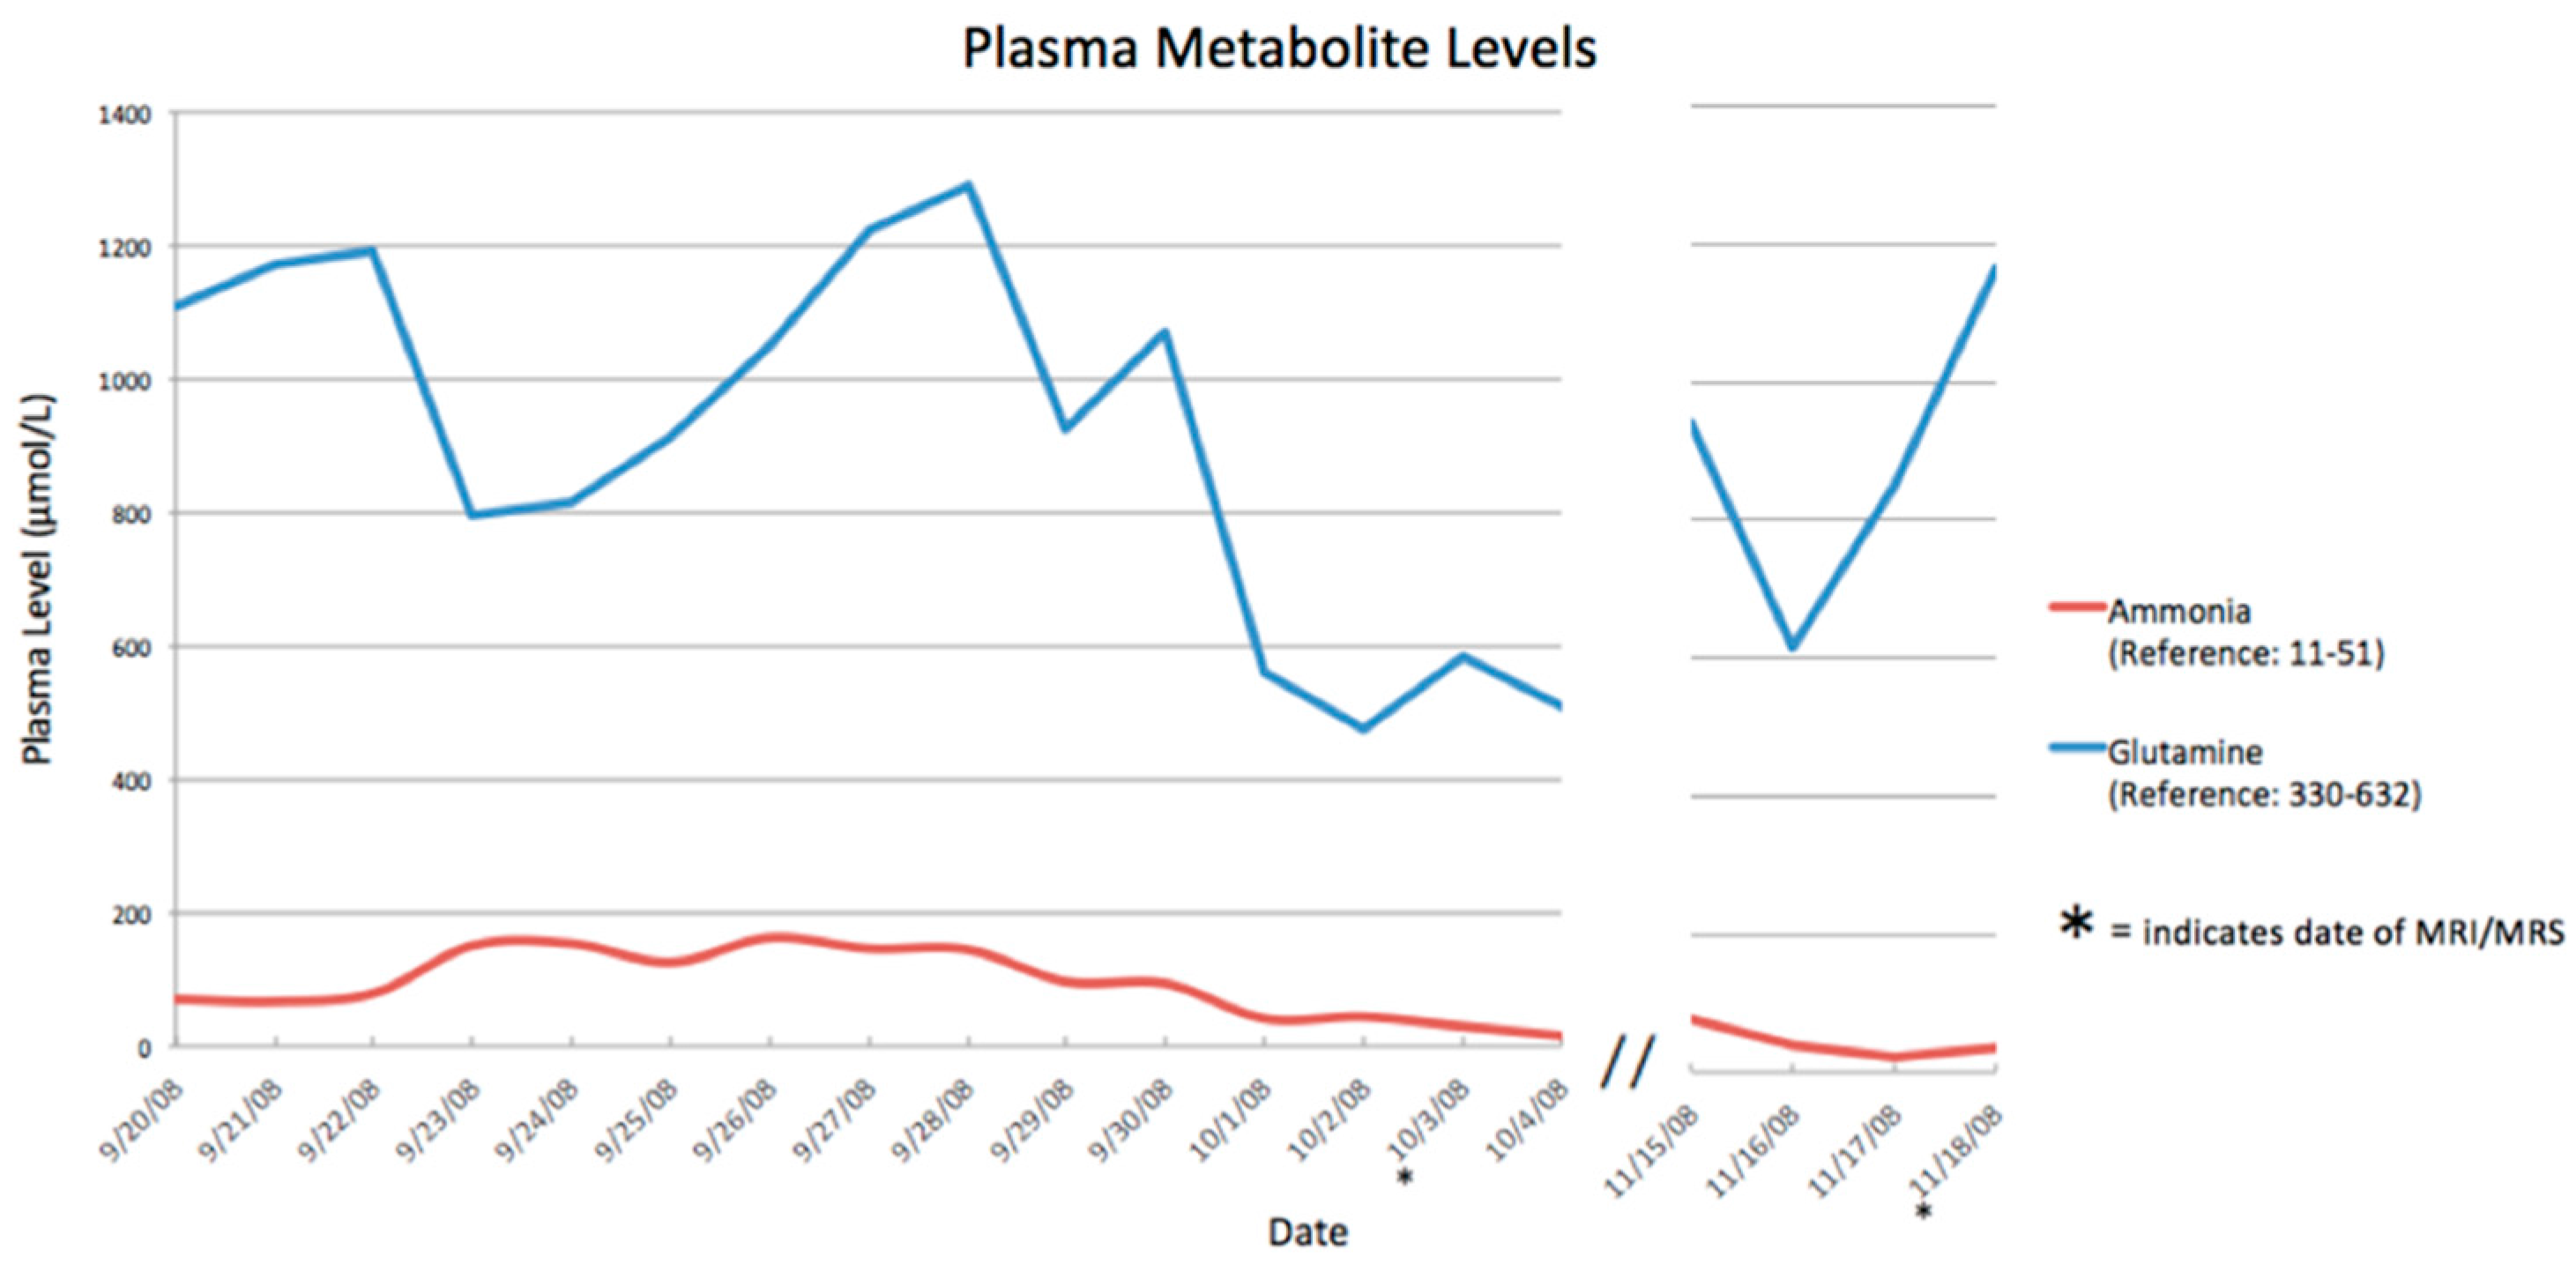
Figure 1. Urea cycle enzymes.
Neonatalscreening 02 00010 g001
Figure 2. This figure shows the number of Hyperammonemic events that occurred in the patient each year. This figure shows the distribution of the 147 Hyperammonemic HA episodes over a 15-year span, with many more events in the teenage years. We define ‘hyperammonemic event’ as increased level of plasma ammonia PLUS clinical symptoms of lethargy or change in mental status, emesis and/or anorexia. Thus, a level of 80 µmol/L would not be a HA if the patient was asymptomatic.
Neonatalscreening 02 00010 g002
Figure 3. Metabolic crises. Sequential ammonia and glutamine levels obtained through daily monitoring over a 19-day period. The most striking observation is the persistent elevation of glutamine (normal in our lab is 396–740 µmol/L). Despite normal ammonia levels (normal in our lab is <50 µmol/L).
Neonatalscreening 02 00010 g003
Figure 4. Voxel locations include left parietal white matter on 3 October 2008 (a) and on 18 November 2008 (c) and left basal ganglia on 3 October 2008 (b) and on 18 November 2008 (d) following HA episodes. Glutamine/Glutamate (blue arrow shows beta and gamma proton; green and brown arrows show the alpha proton), N-acetylaspartate (NAA) (red arrow), myoinositol (black), choline (purple), and creatine (orange) peak heights are shown. Elevated glutamine peaks are apparent in 4b4d. 4a depicts mildly elevated lactate (gray) and decreased myoinositol peaks. Decreased myoinositol (essentially undetectable on the panels; the arrow shows the location of where the peak resonates) and choline peaks can be seen in 4c. A notably decreased NAA peak in the basal ganglia is shown in 4d. 4e: Axial MR image on 18 November 2008 through the basal ganglia demonstrating normal brain signal on the T2-weighted image. Mild striatal atrophy is present with volume loss involving the caudate (yellow arrows) and lentiform nuclei (blue arrows).
Neonatalscreening 02 00010 g004
Table 1. The ammonia levels from the preceding days (all in µmol/L).
Date (Day/Month)Ammonia Level (Normal <50 µmol/L)
23 September 2008233
24 September 2008204
25 September 2008145
26 September 2008194
27 September 2008213
28 September 2008269
29 September 2008155
30 September 2008145
01 October 200857
02 October 200850
27 October 200833
28 October 200822
29 October 200827
15 November 200833
16 November 200824
17 November 200822
18 November 200837
Table 2. Cognitive testing results show decreases in working memory and analysis speed from age 9 years to age 14 years. (Average IQ is 100; standard deviation is ±15 points).
TestAge 9 YearsAge 14 Years
Total IQ7374
Verbal IQ8185
Performance IQ8185
Working Memory7762
Analysis Speed8376

