Figure 1.
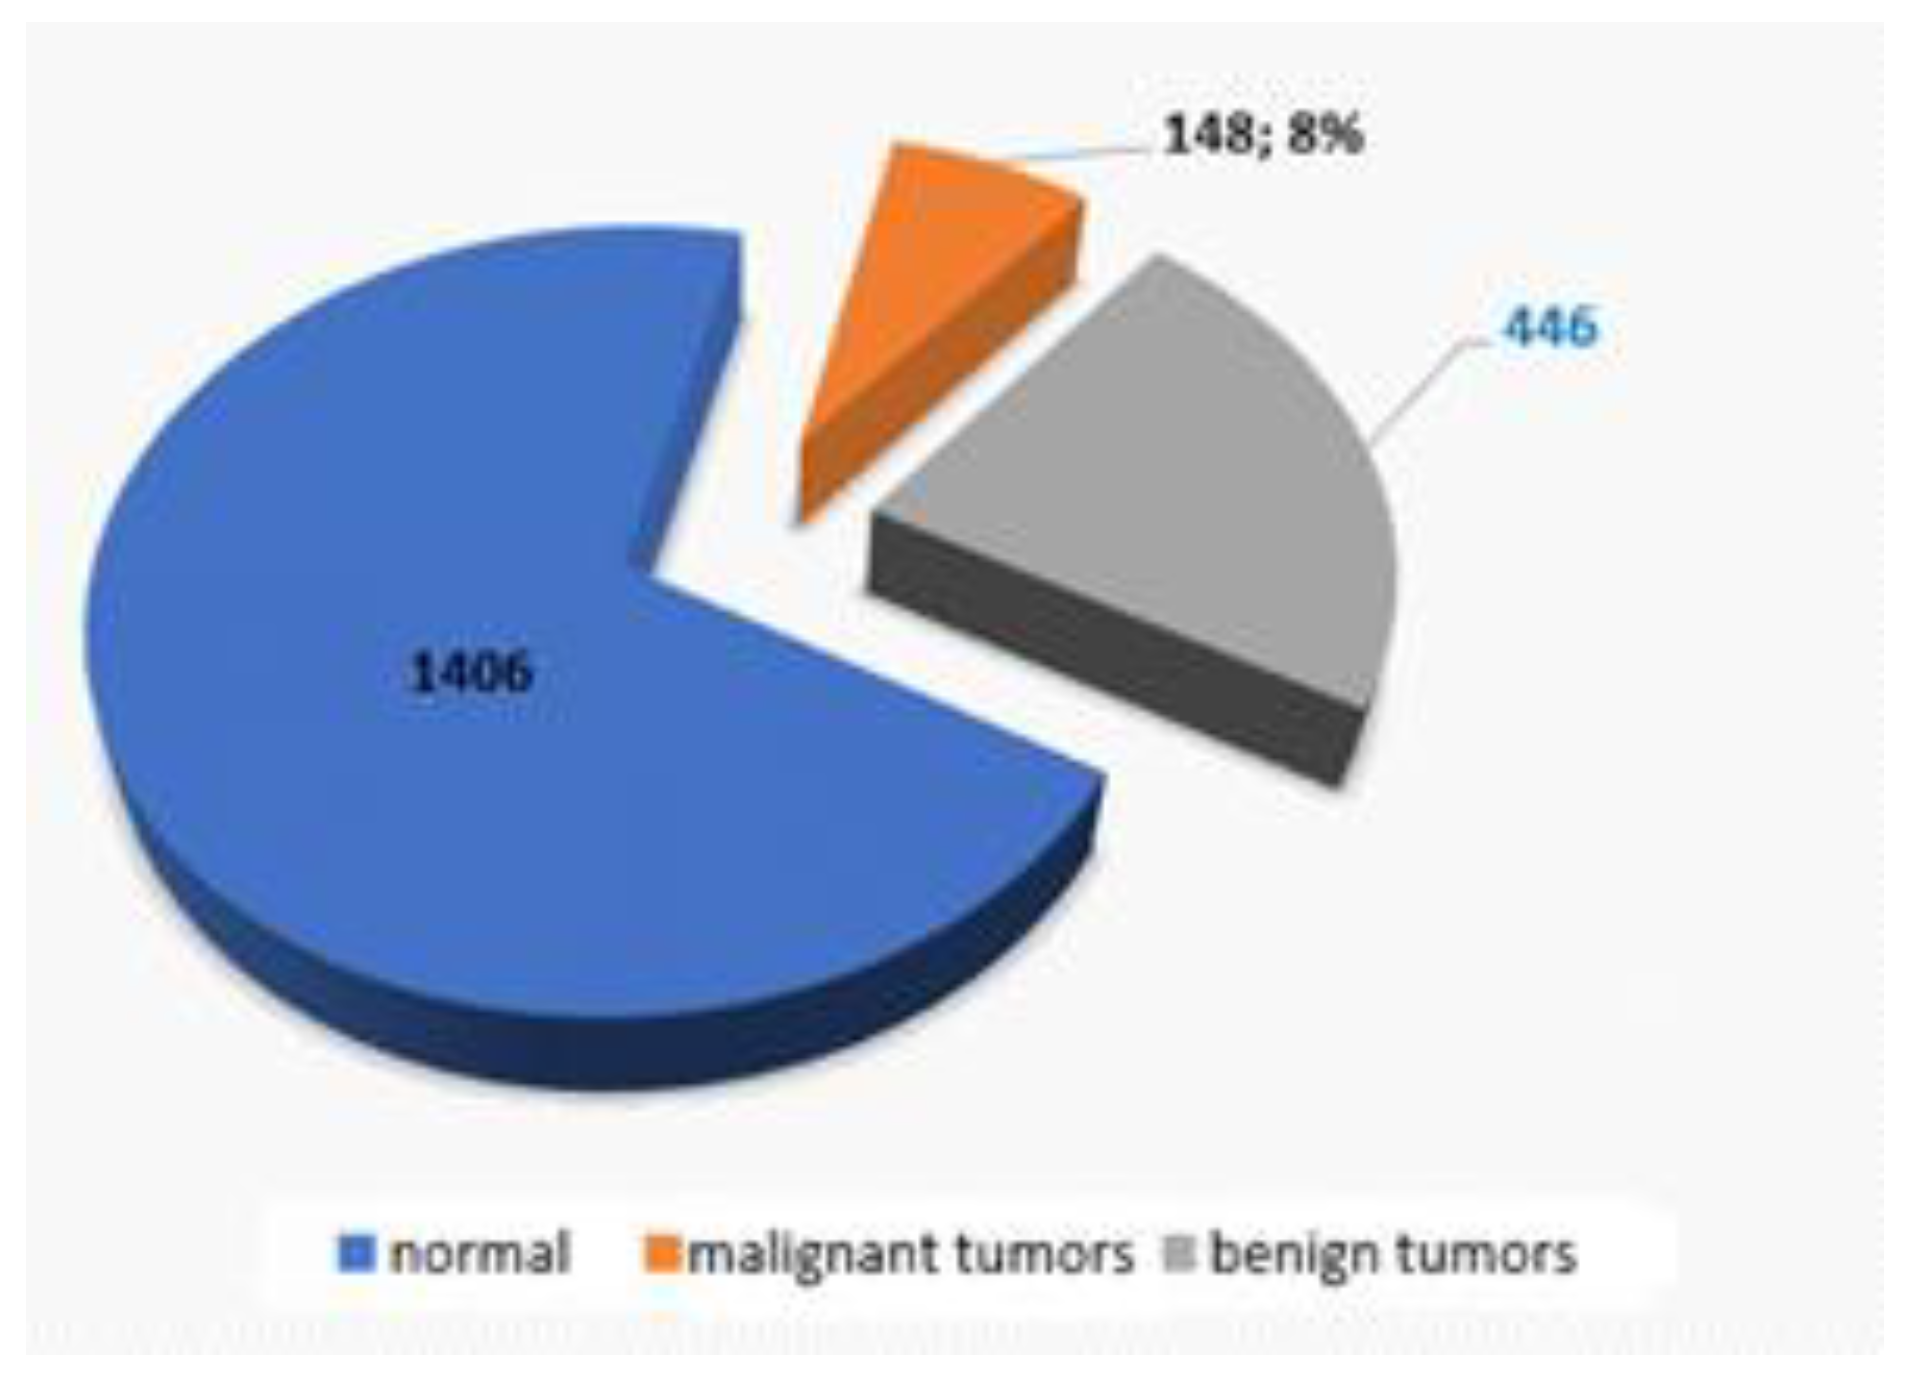
Distribution of malignant and benign tumors as for the entire lot of colonoscopies.
Figure 1.
Distribution of malignant and benign tumors as for the entire lot of colonoscopies.
Figure 2.
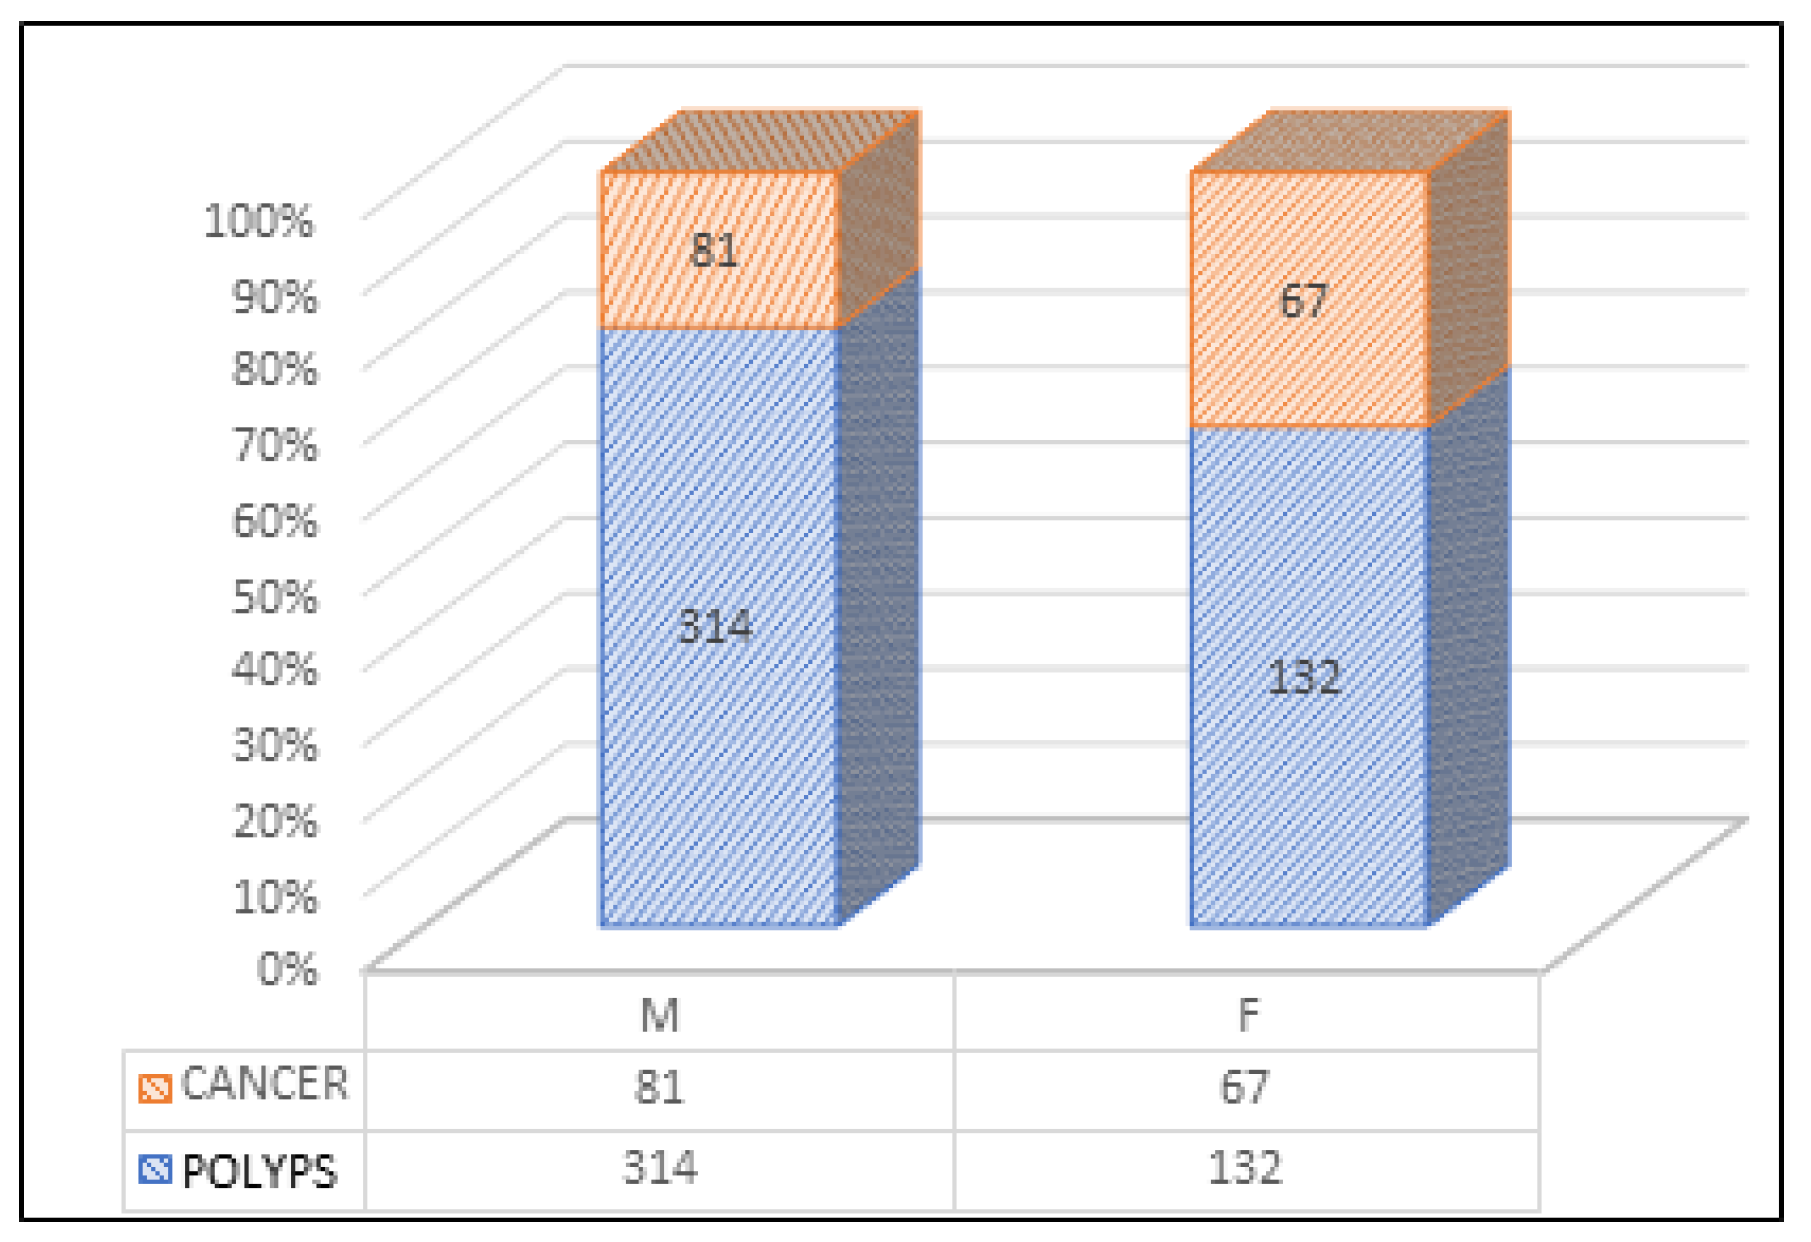
Distribution of colonoscopies by sex and the type of tumor formations detected.
Figure 2.
Distribution of colonoscopies by sex and the type of tumor formations detected.
Figure 3.
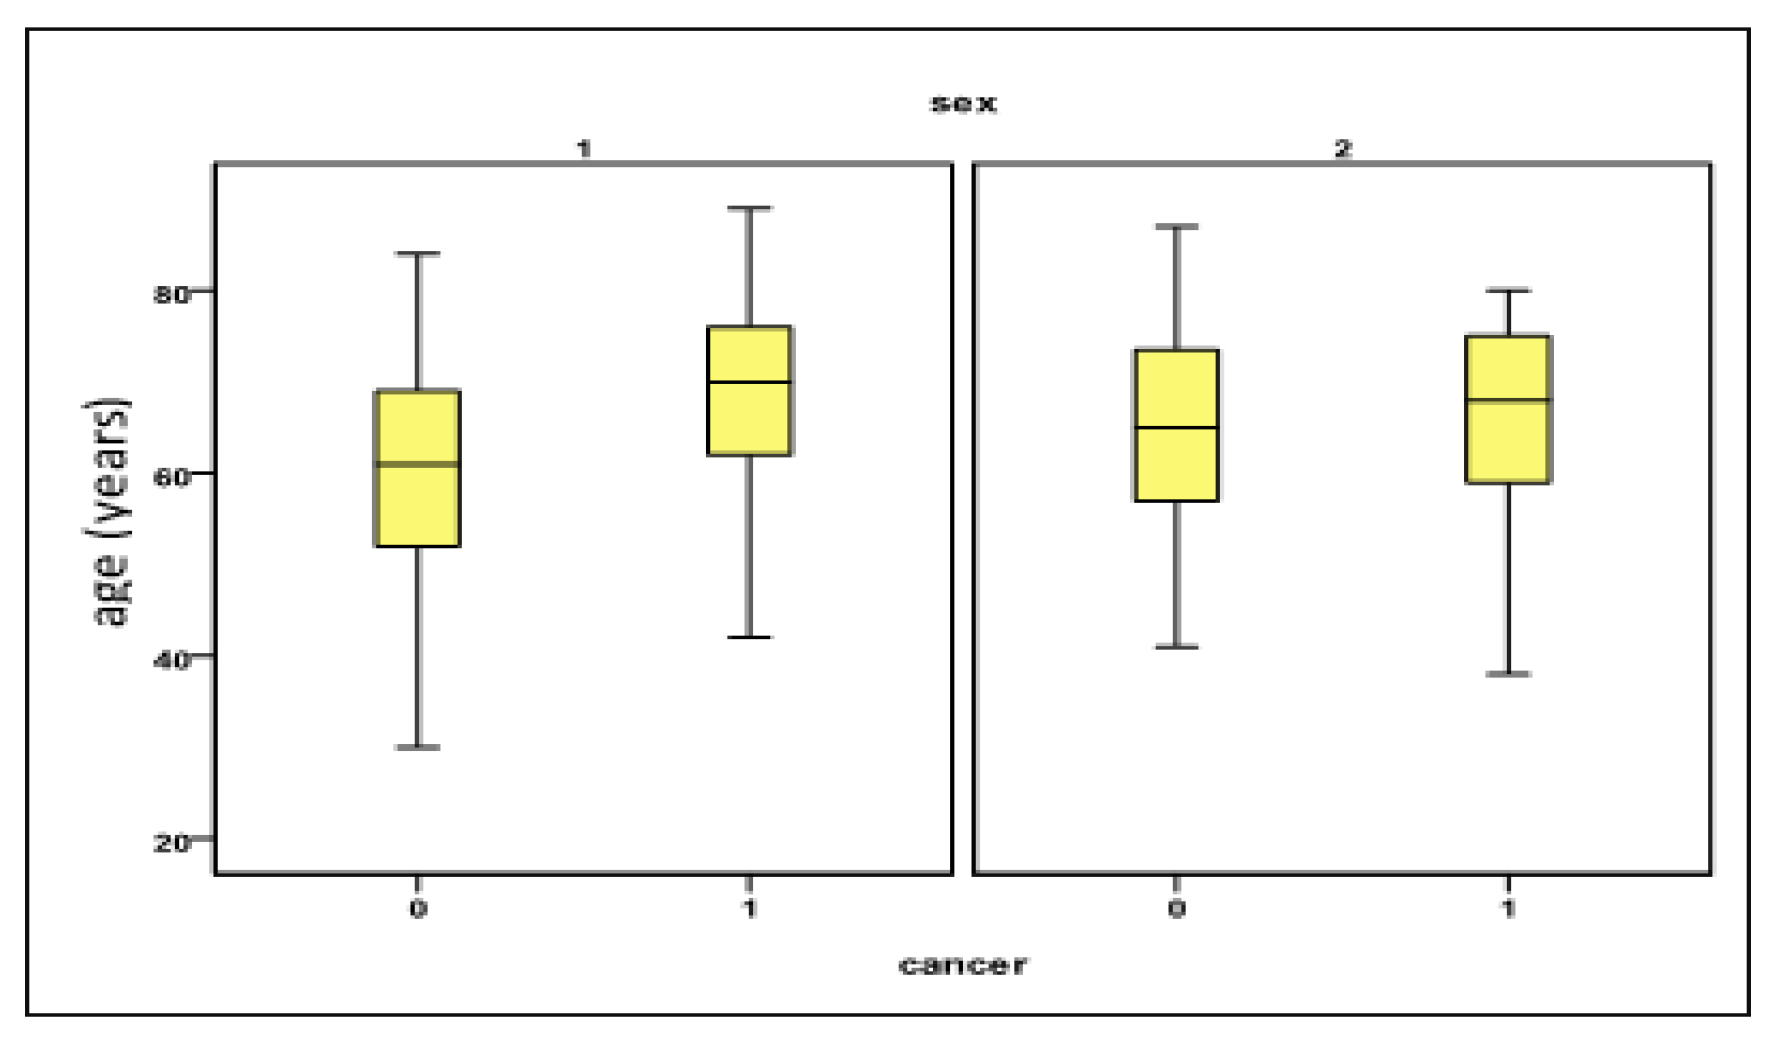
Variation of the “age” parameter in relation to the presence of CRC and the sex of the investigated patients. Legend Sex 1 = male; 2 = female; Cancer 0 = absent (polyps present); 1 = present.
Figure 3.
Variation of the “age” parameter in relation to the presence of CRC and the sex of the investigated patients. Legend Sex 1 = male; 2 = female; Cancer 0 = absent (polyps present); 1 = present.
Figure 4.
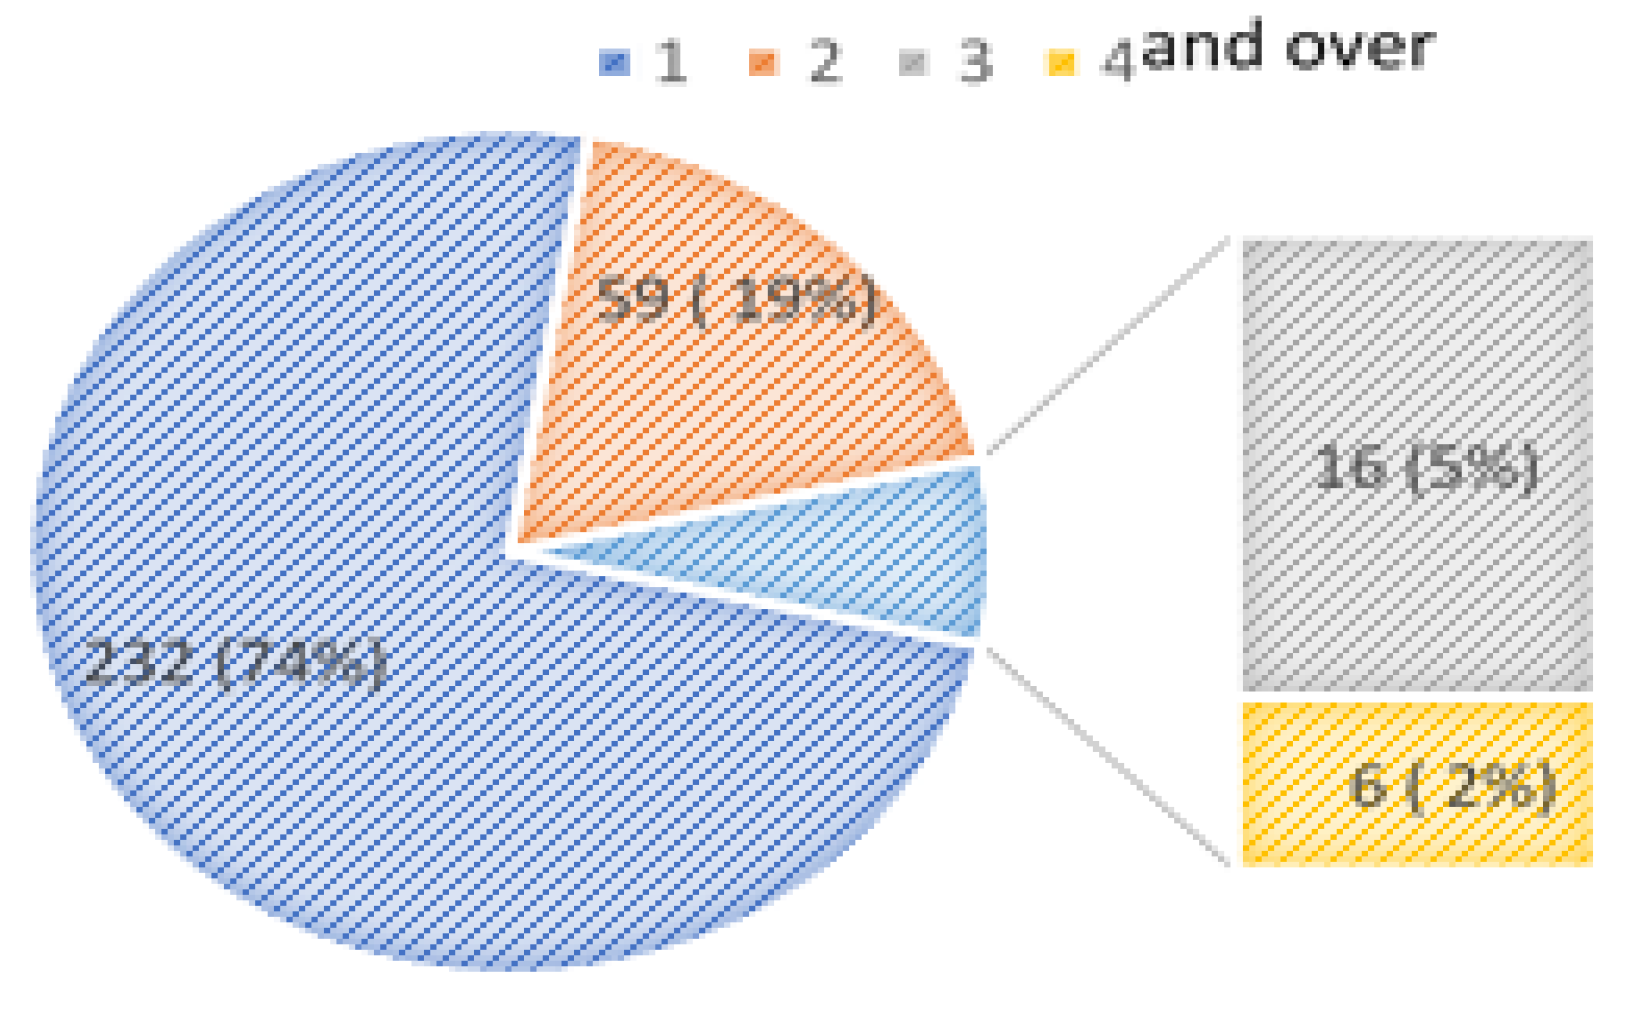
Distribution of patients in relation to the number of polyps researched per session.
Figure 4.
Distribution of patients in relation to the number of polyps researched per session.
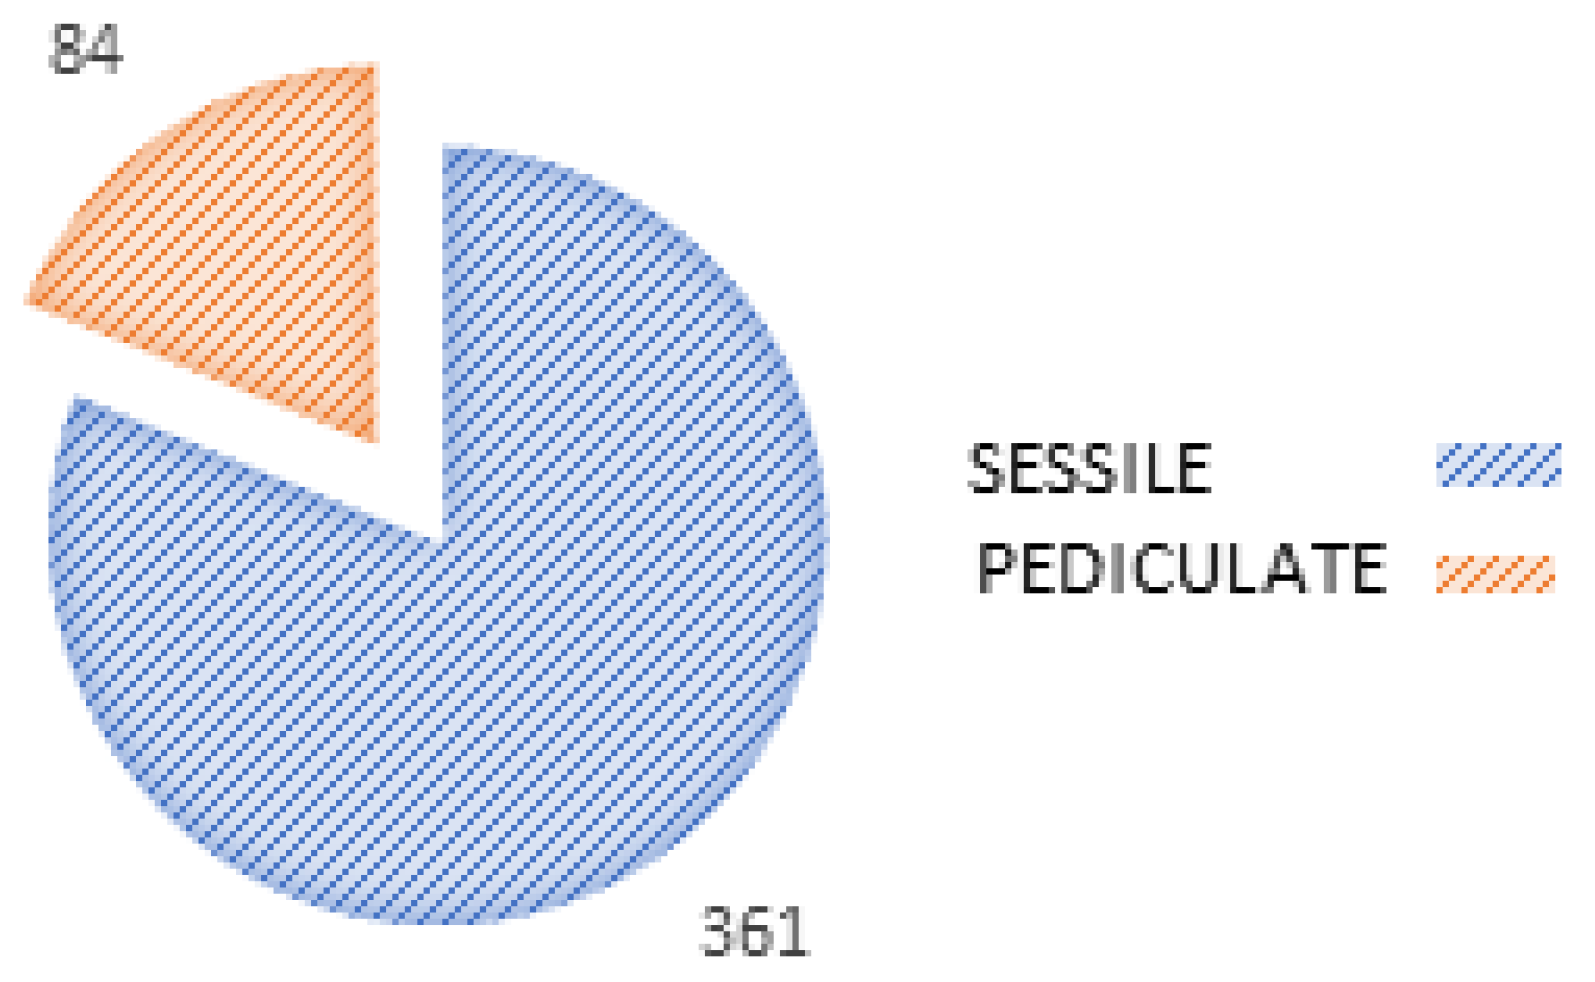
Figure 5.
Distribution of polypectomies in relation to the form of polyps resected.
Figure 5.
Distribution of polypectomies in relation to the form of polyps resected.
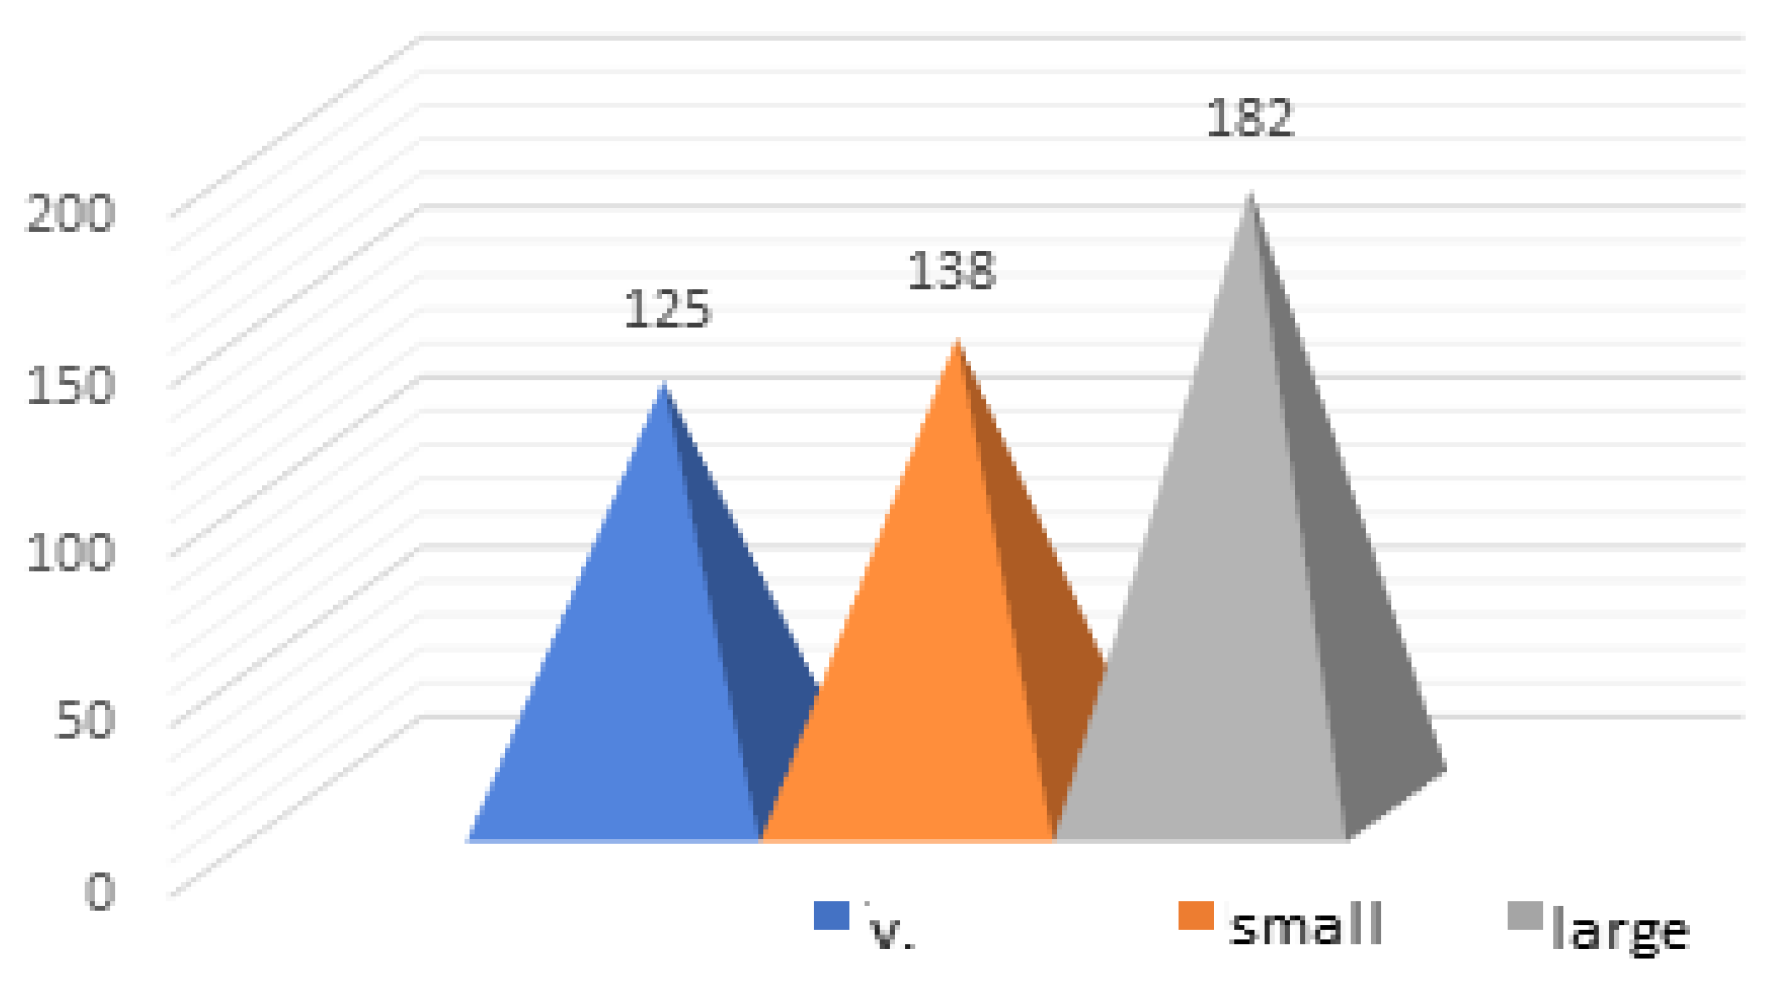
Figure 6.
Distribution of polypectomies in relation to the size of the resected polyps.
Figure 6.
Distribution of polypectomies in relation to the size of the resected polyps.
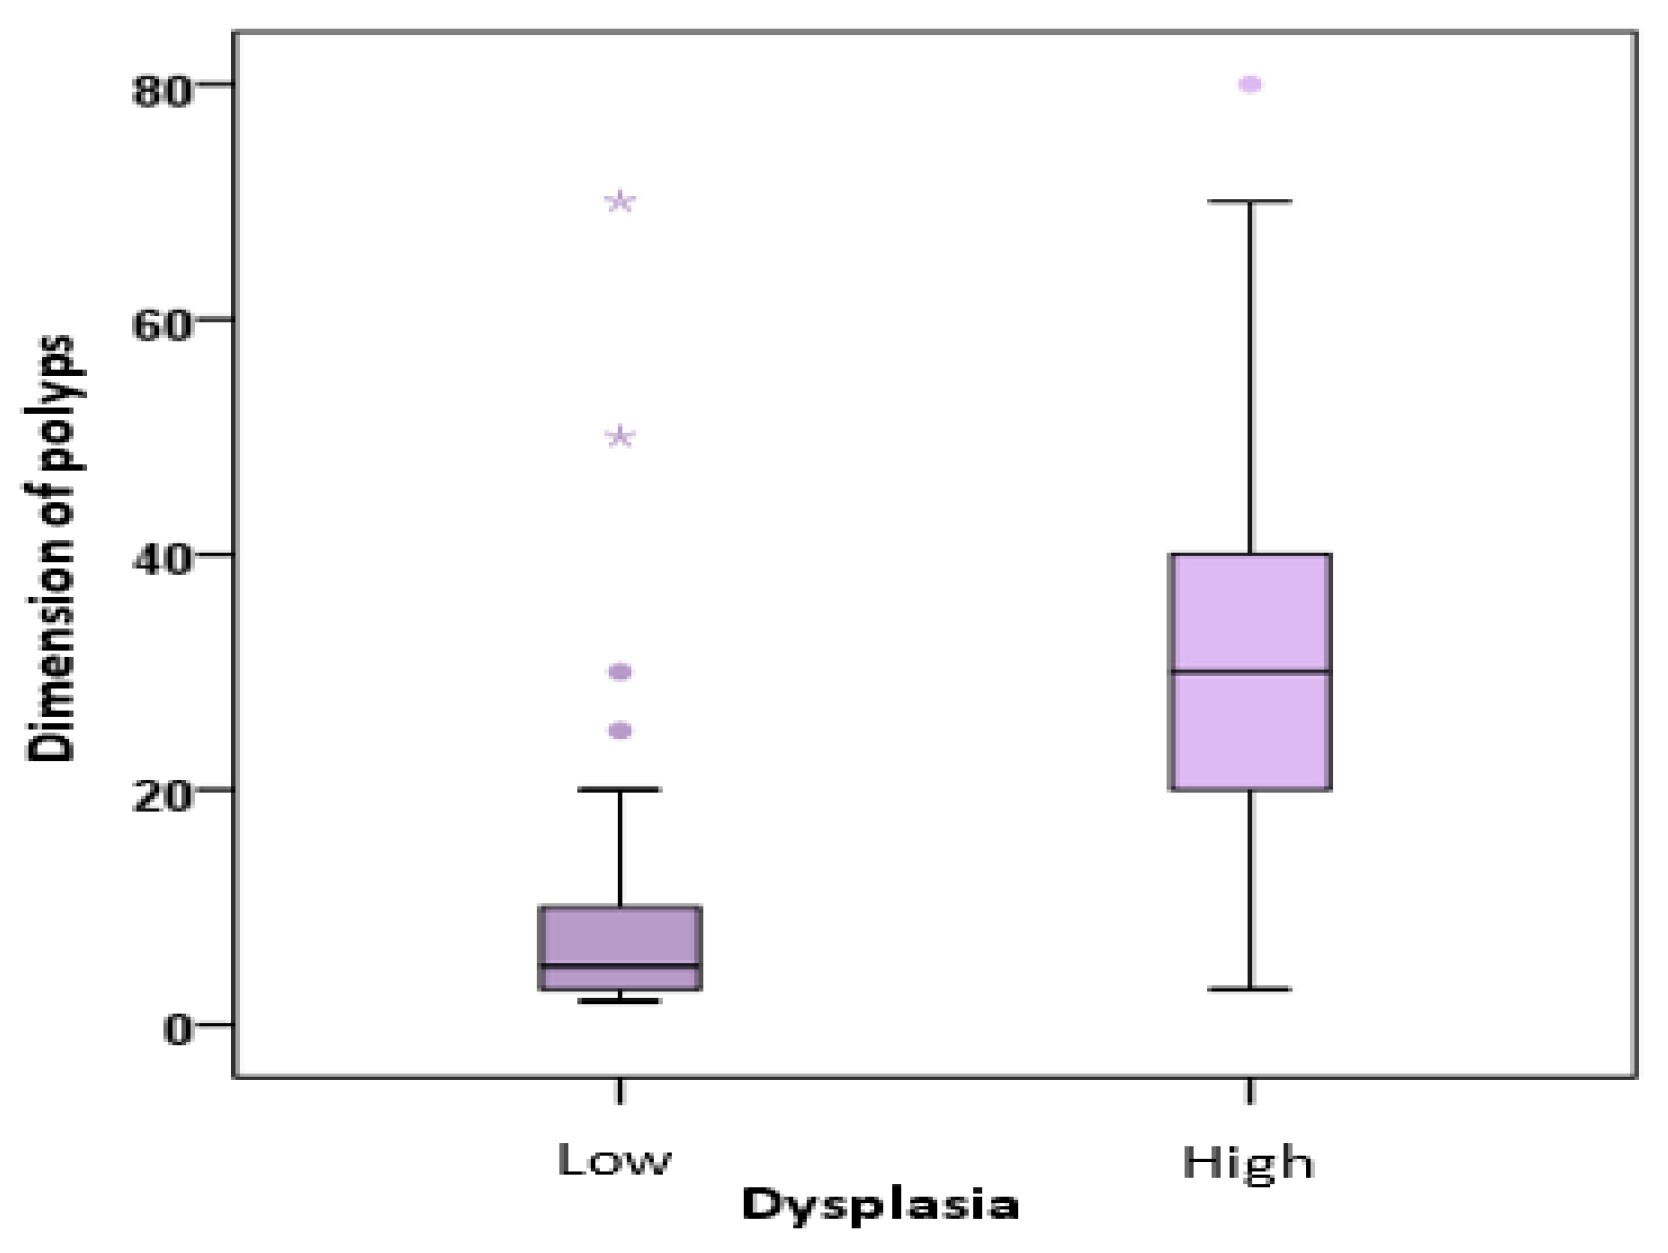
Figure 7.
The variation of the "polyp size" parameter (mm) in relation to the degree of malignancy of the polyps removed.
Figure 7.
The variation of the "polyp size" parameter (mm) in relation to the degree of malignancy of the polyps removed.
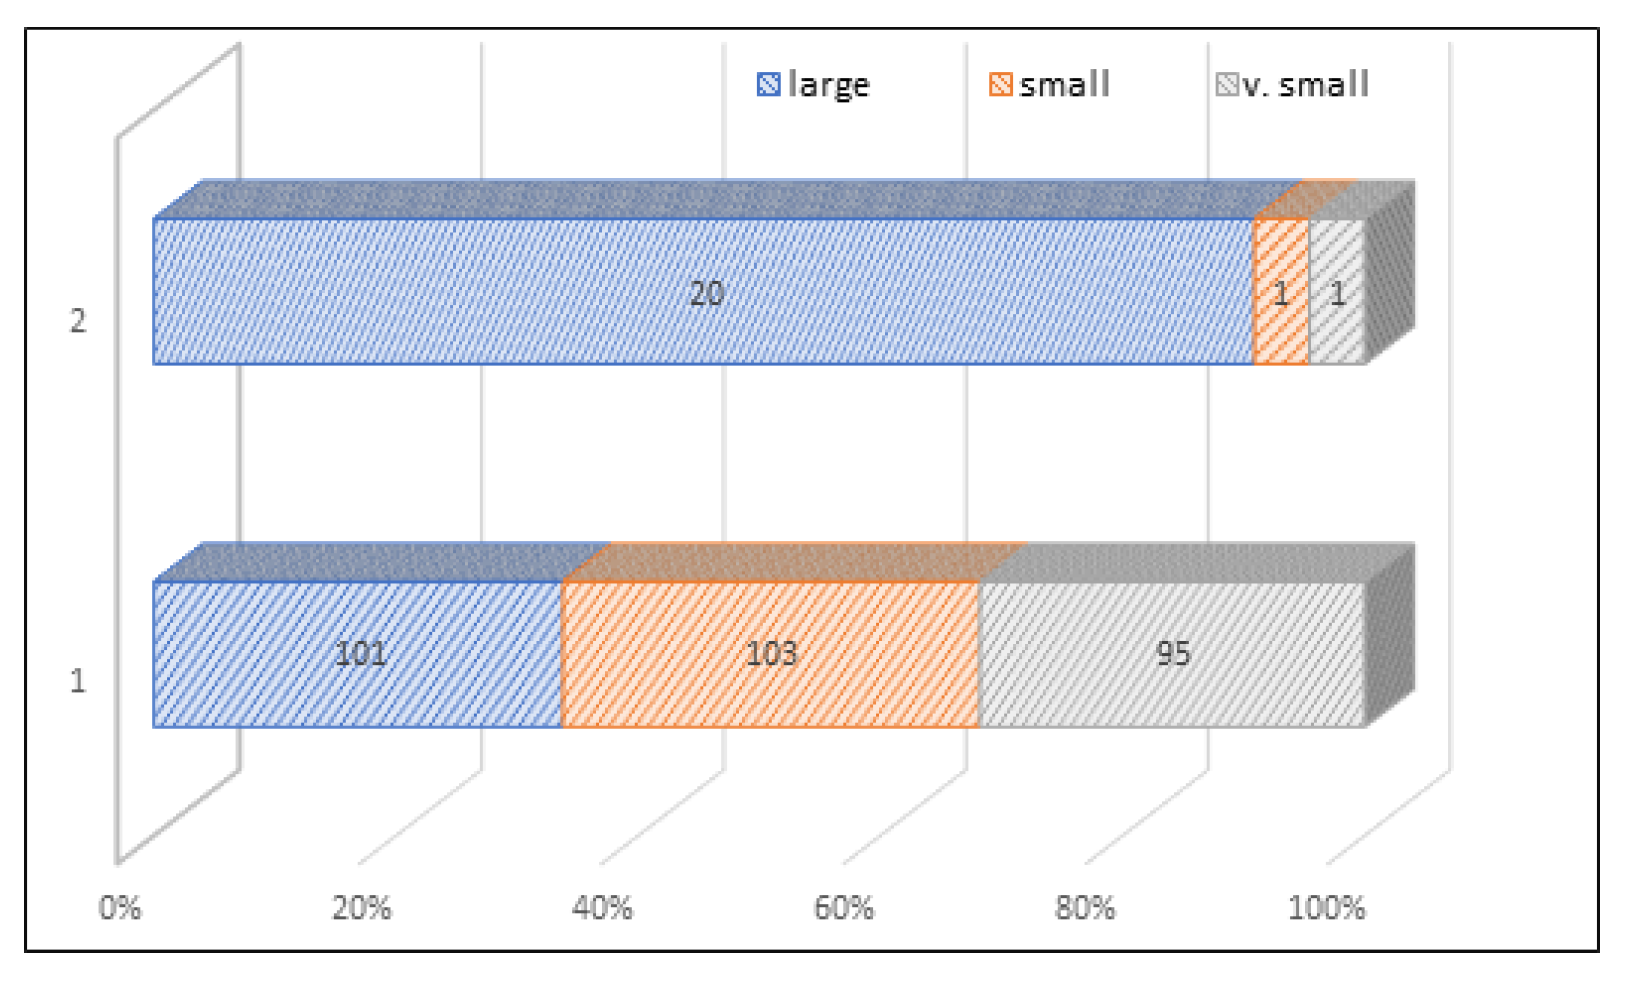
Figure 8.
Distribution of polyps in relation to the size of the polyps and their degree of dysplasia. Legend: 1= low, 2= high.
Figure 8.
Distribution of polyps in relation to the size of the polyps and their degree of dysplasia. Legend: 1= low, 2= high.
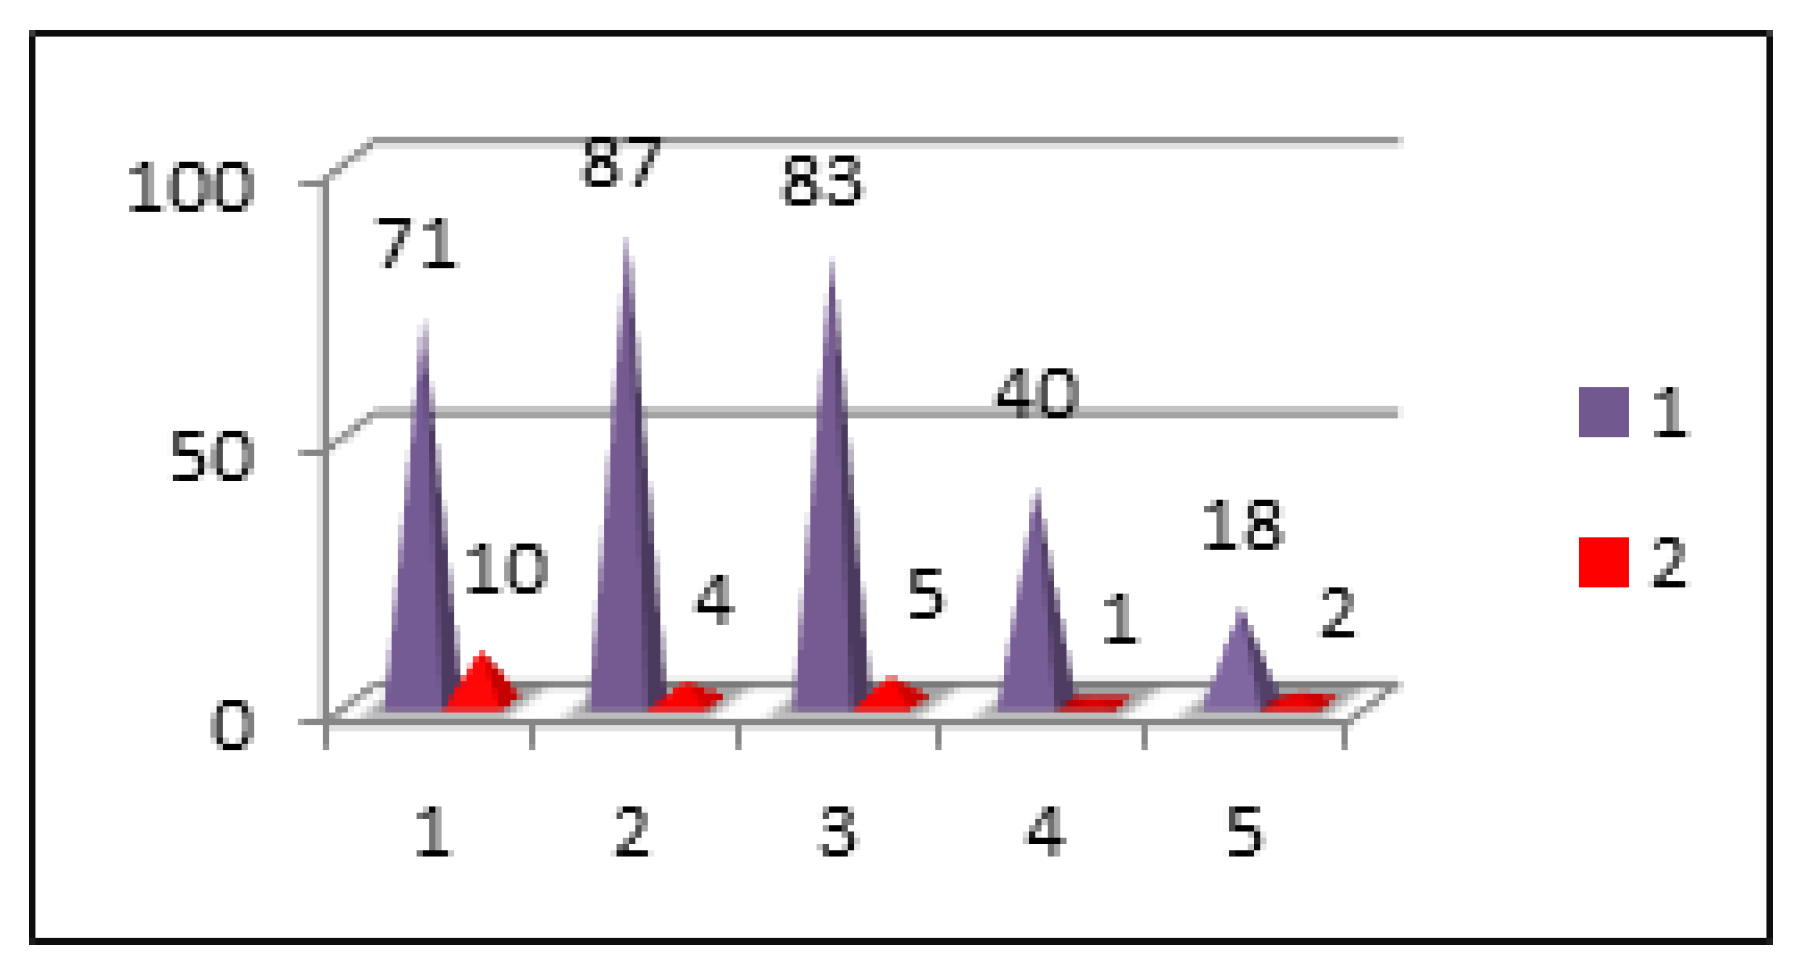
Figure 9.
Distribution of polypectomies in relation to the location of polyps and their degree of dysplasia. Legend. Location: 1= rect, 2= sigmoid, 3= descendant, 4= transverse, 5= ceco-ascendent | Type of dysplasia: 1= low, 2= high.
Figure 9.
Distribution of polypectomies in relation to the location of polyps and their degree of dysplasia. Legend. Location: 1= rect, 2= sigmoid, 3= descendant, 4= transverse, 5= ceco-ascendent | Type of dysplasia: 1= low, 2= high.
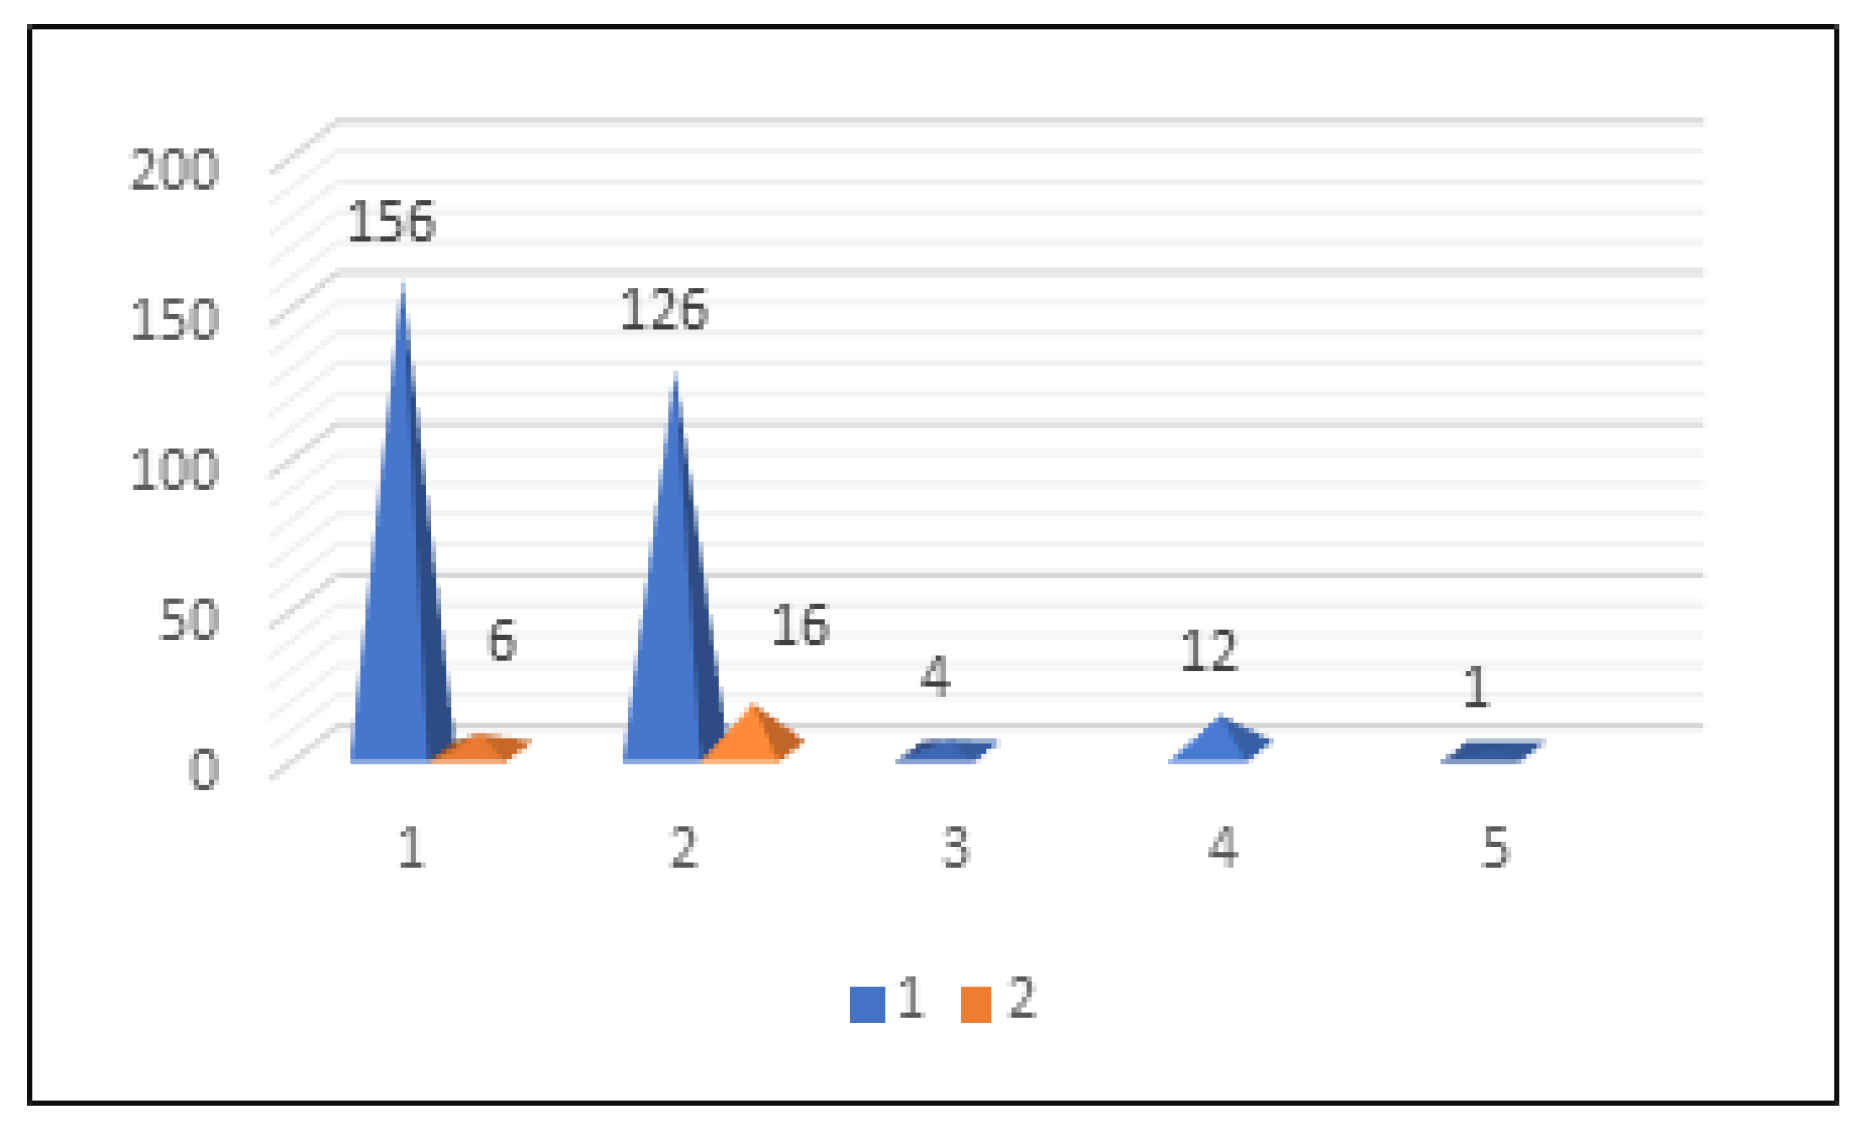
Figure 10.
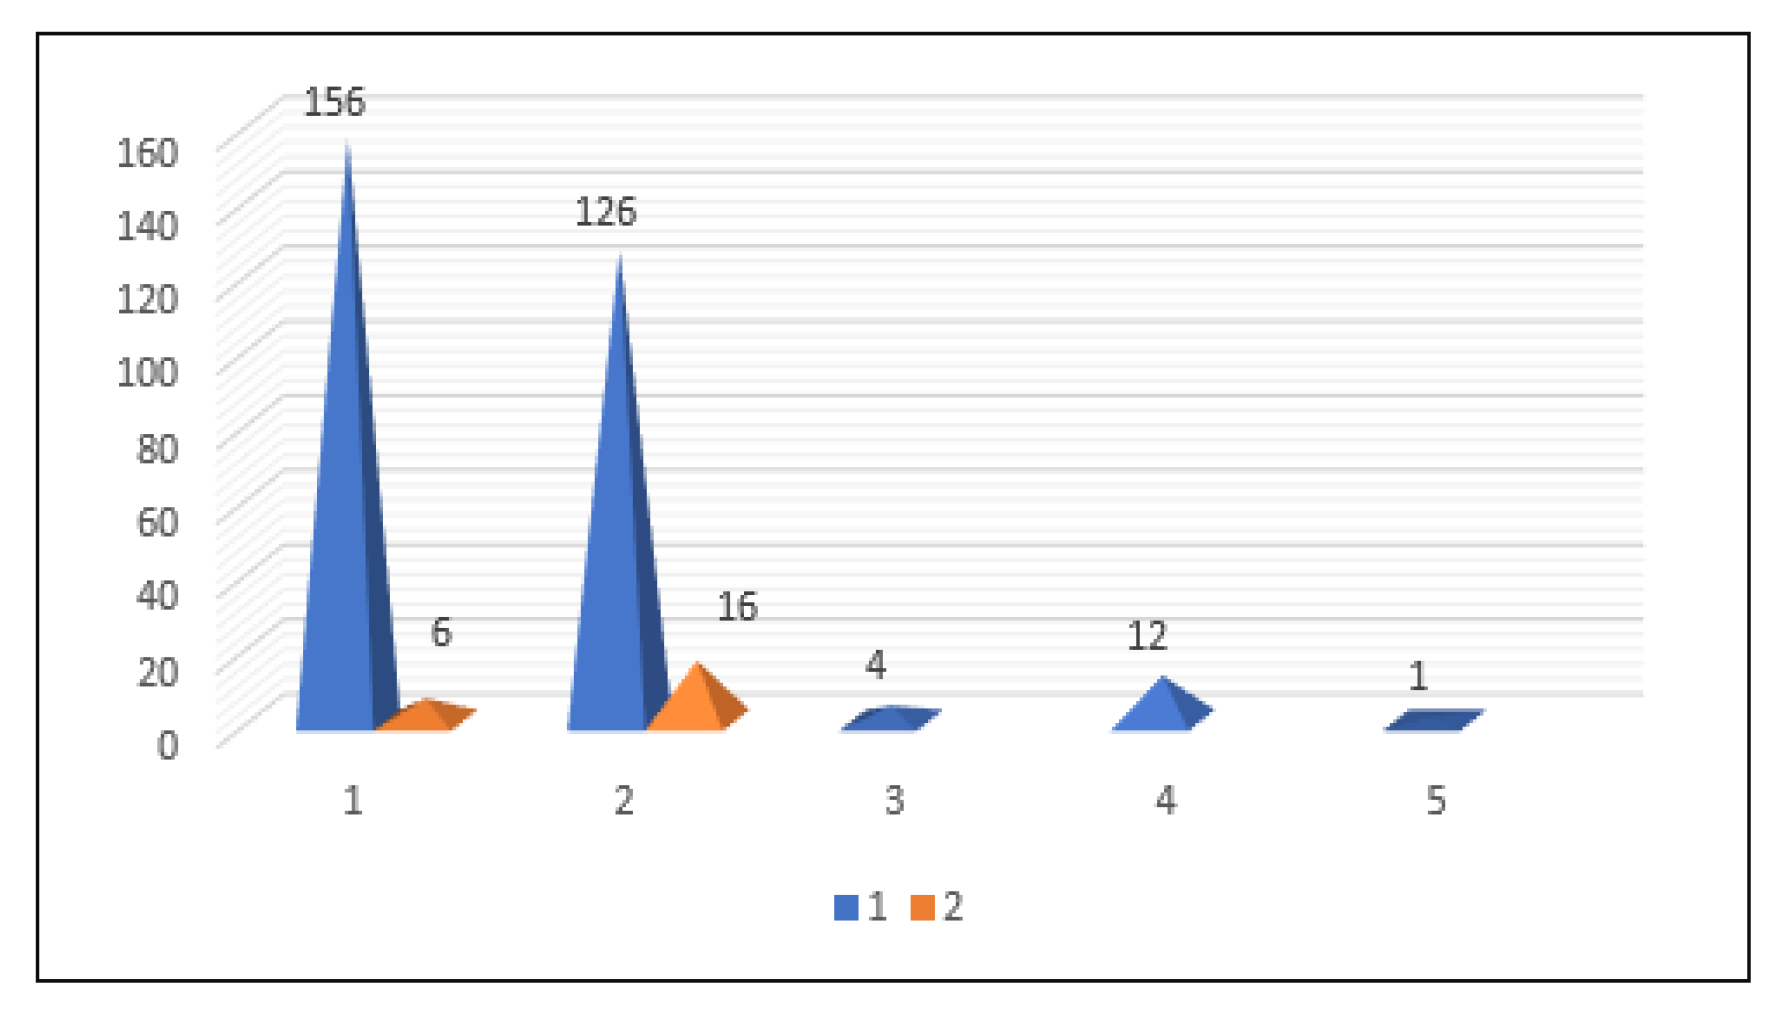
Distribution of polypectomies in relation to the histological type of polyps and their degree of dysplasia. Legend. Type of dysplasia: 1= low, 2= high, Histology: 1= tubulo-adenomatous, 2= tubulo-villous, 3= serous, 4= mucous, 5= leiomyoma.
Figure 10.
Distribution of polypectomies in relation to the histological type of polyps and their degree of dysplasia. Legend. Type of dysplasia: 1= low, 2= high, Histology: 1= tubulo-adenomatous, 2= tubulo-villous, 3= serous, 4= mucous, 5= leiomyoma.
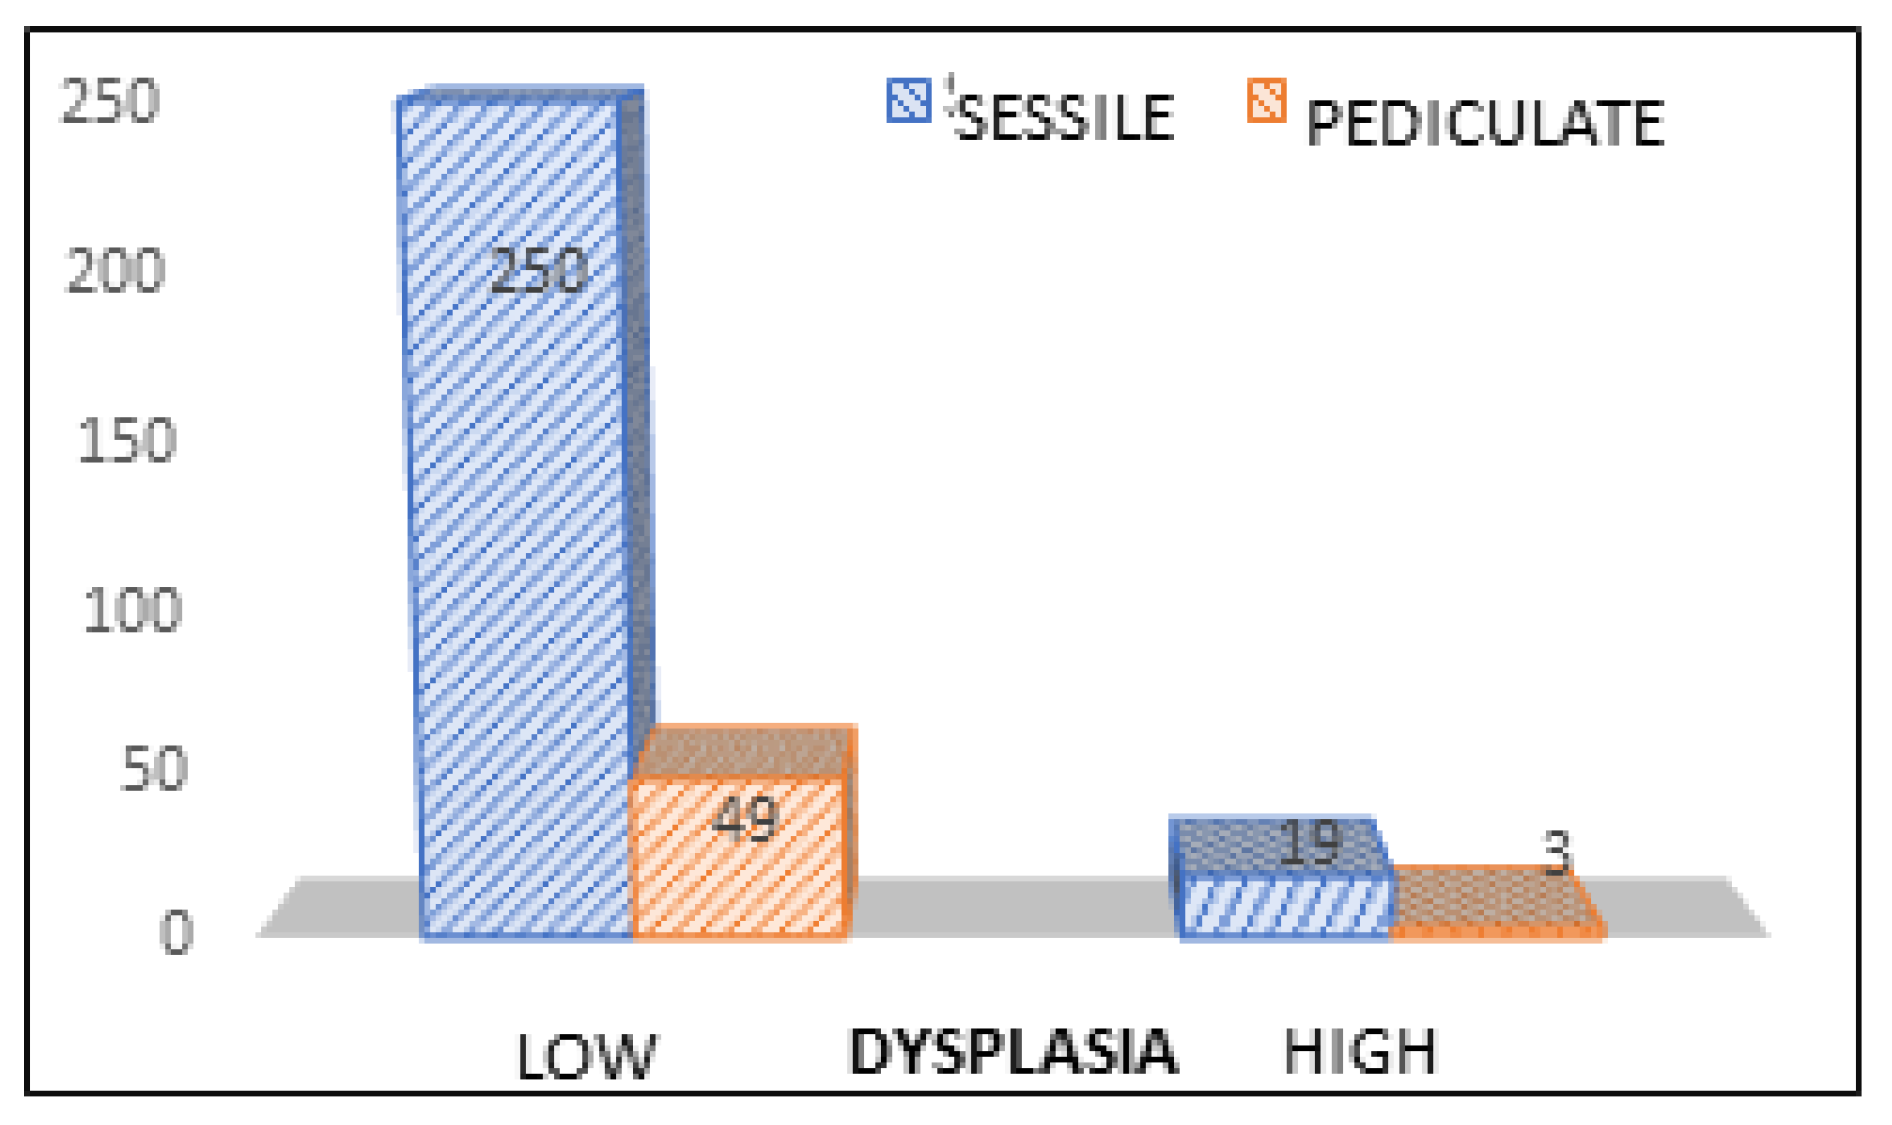
Figure 11.
Distribution of polyps in relation to existing form and degree of dysplasia.
Figure 11.
Distribution of polyps in relation to existing form and degree of dysplasia.
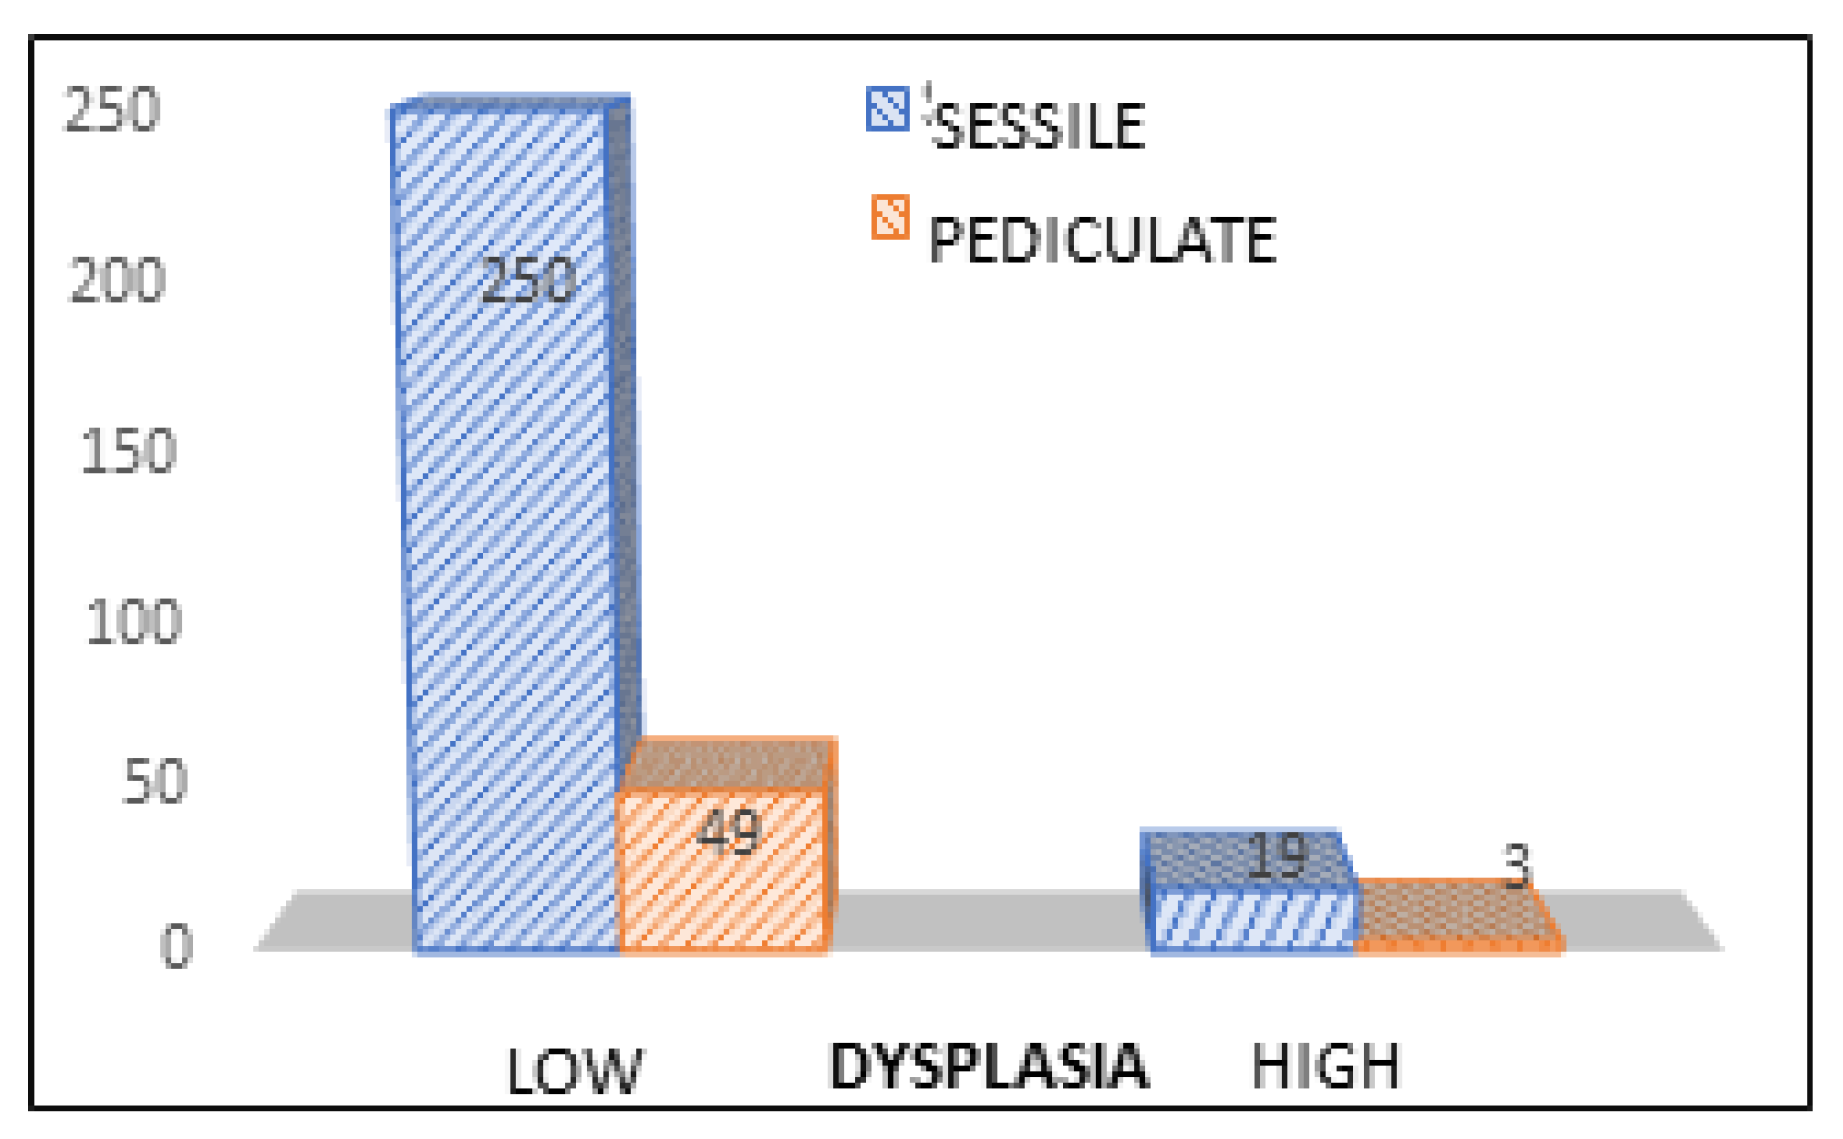
Figure 12.
Types of dysplasia correlated with types of polyps.
Figure 12.
Types of dysplasia correlated with types of polyps.
Figure 13.
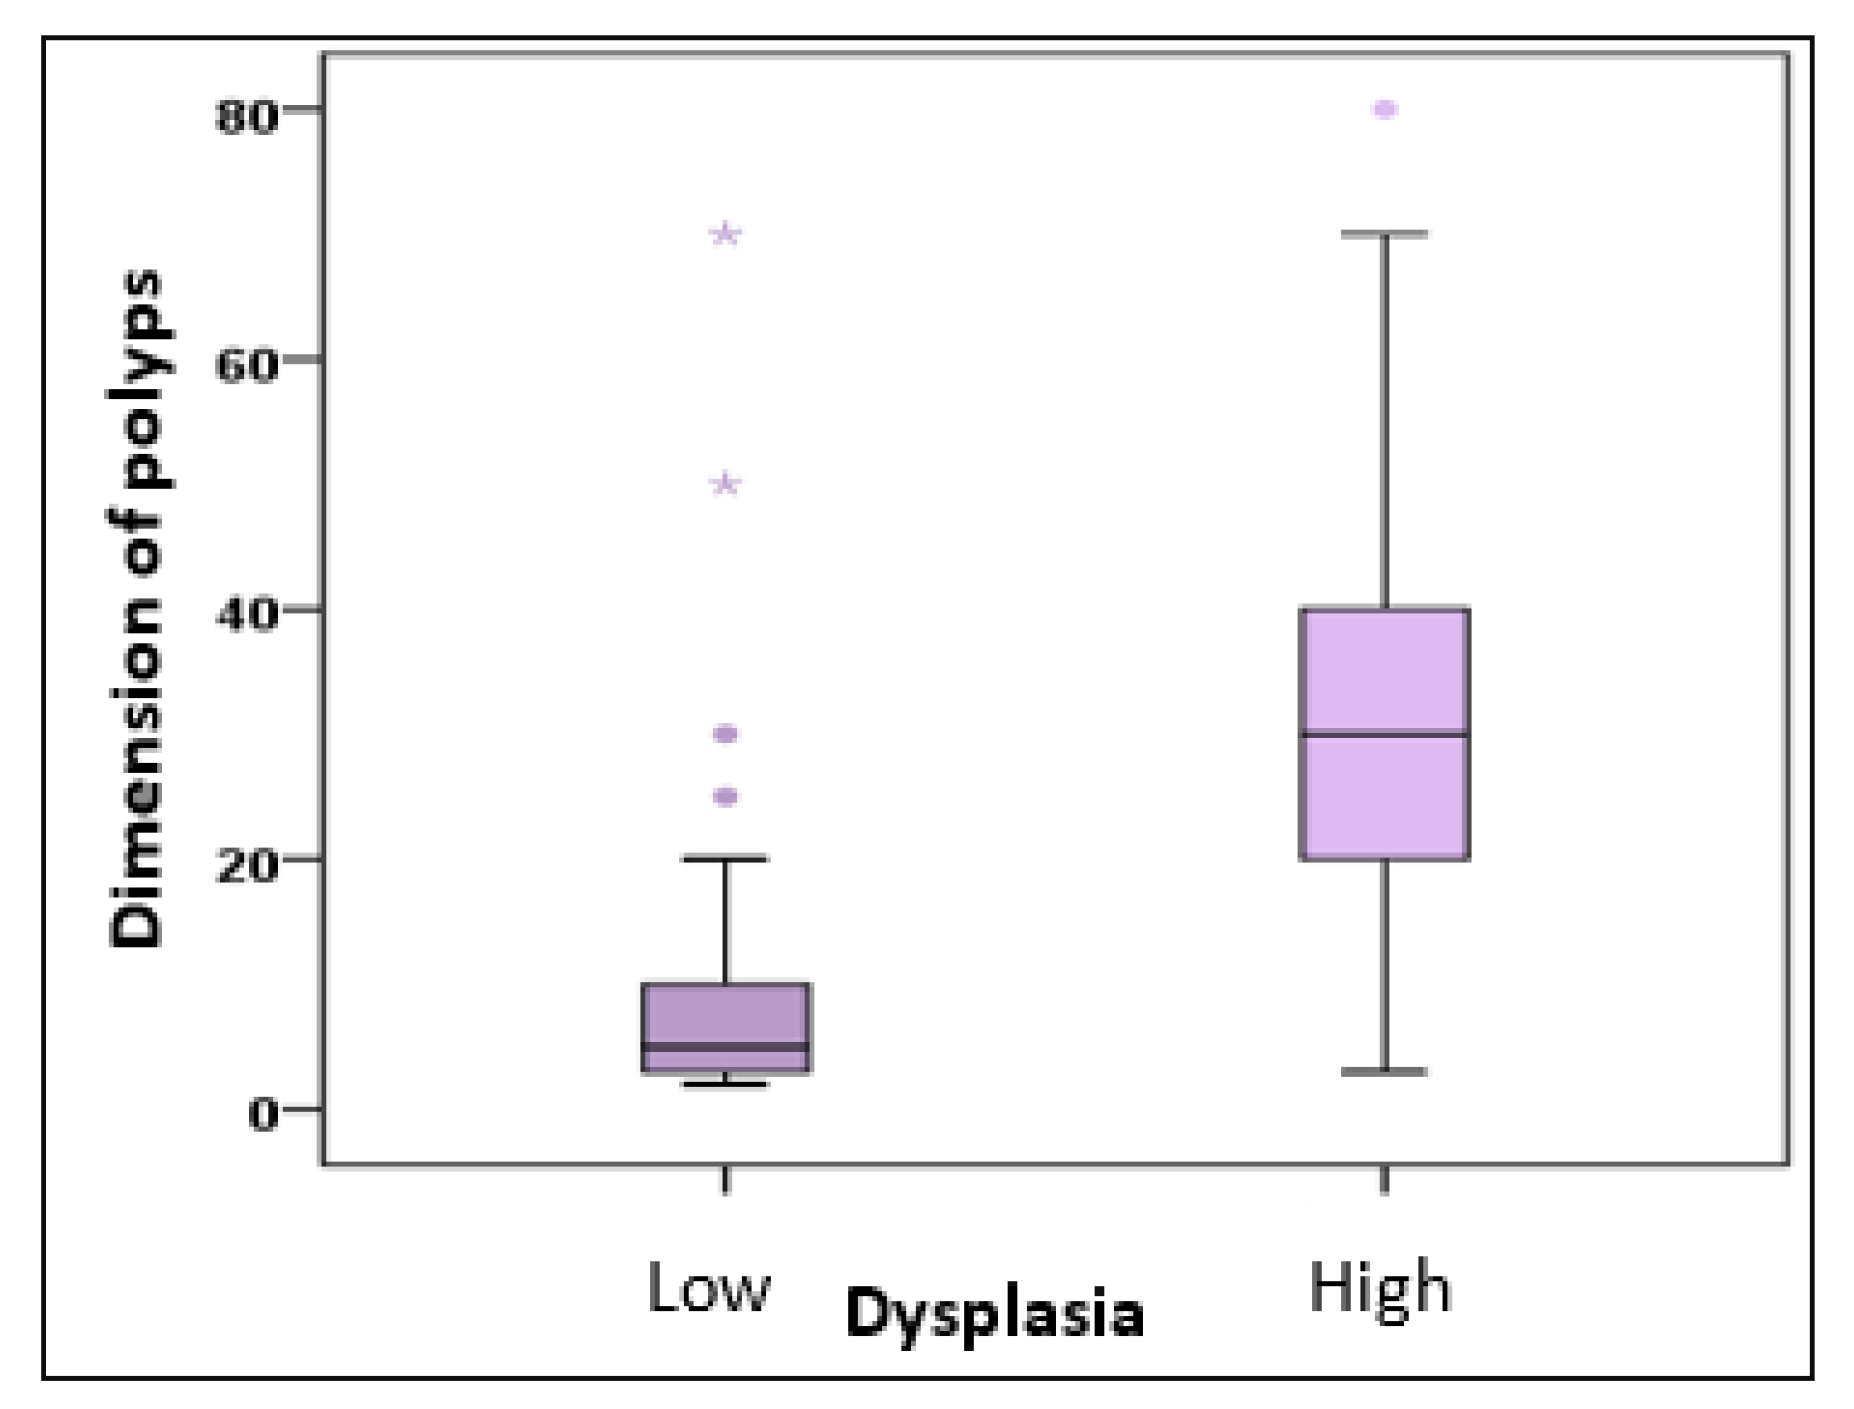
Types of dysplasia correlated dimensions of the polyps.
Figure 13.
Types of dysplasia correlated dimensions of the polyps.
Figure 14.
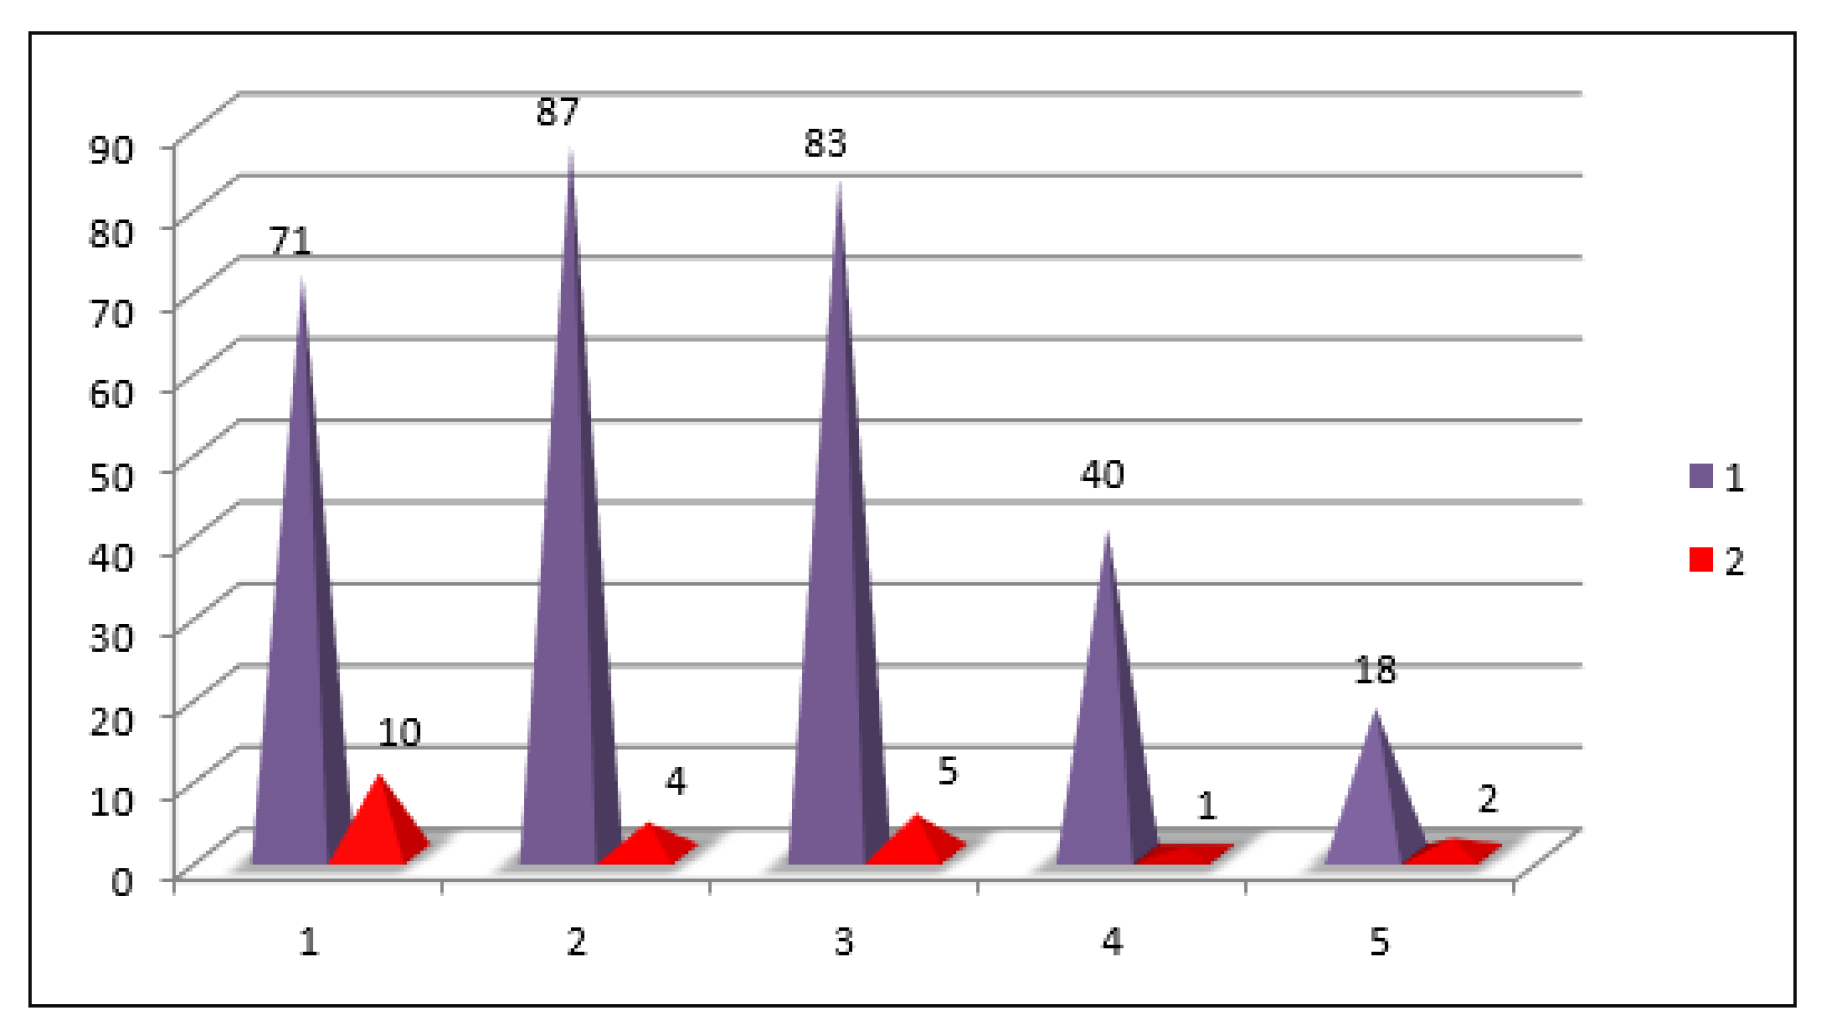
Location of the polyps correlated with grade of dysplasia. Legend. Location: 1= rectum, 2= sigmoid, 3= descendant, 4= transverse, 5= ceco-ascendent. Types of dysplasia: 1= low, 2= high.
Figure 14.
Location of the polyps correlated with grade of dysplasia. Legend. Location: 1= rectum, 2= sigmoid, 3= descendant, 4= transverse, 5= ceco-ascendent. Types of dysplasia: 1= low, 2= high.
Figure 15.
Histology of the polyps correlated with the grade of dysplasia.
Figure 15.
Histology of the polyps correlated with the grade of dysplasia.
Figure 16.
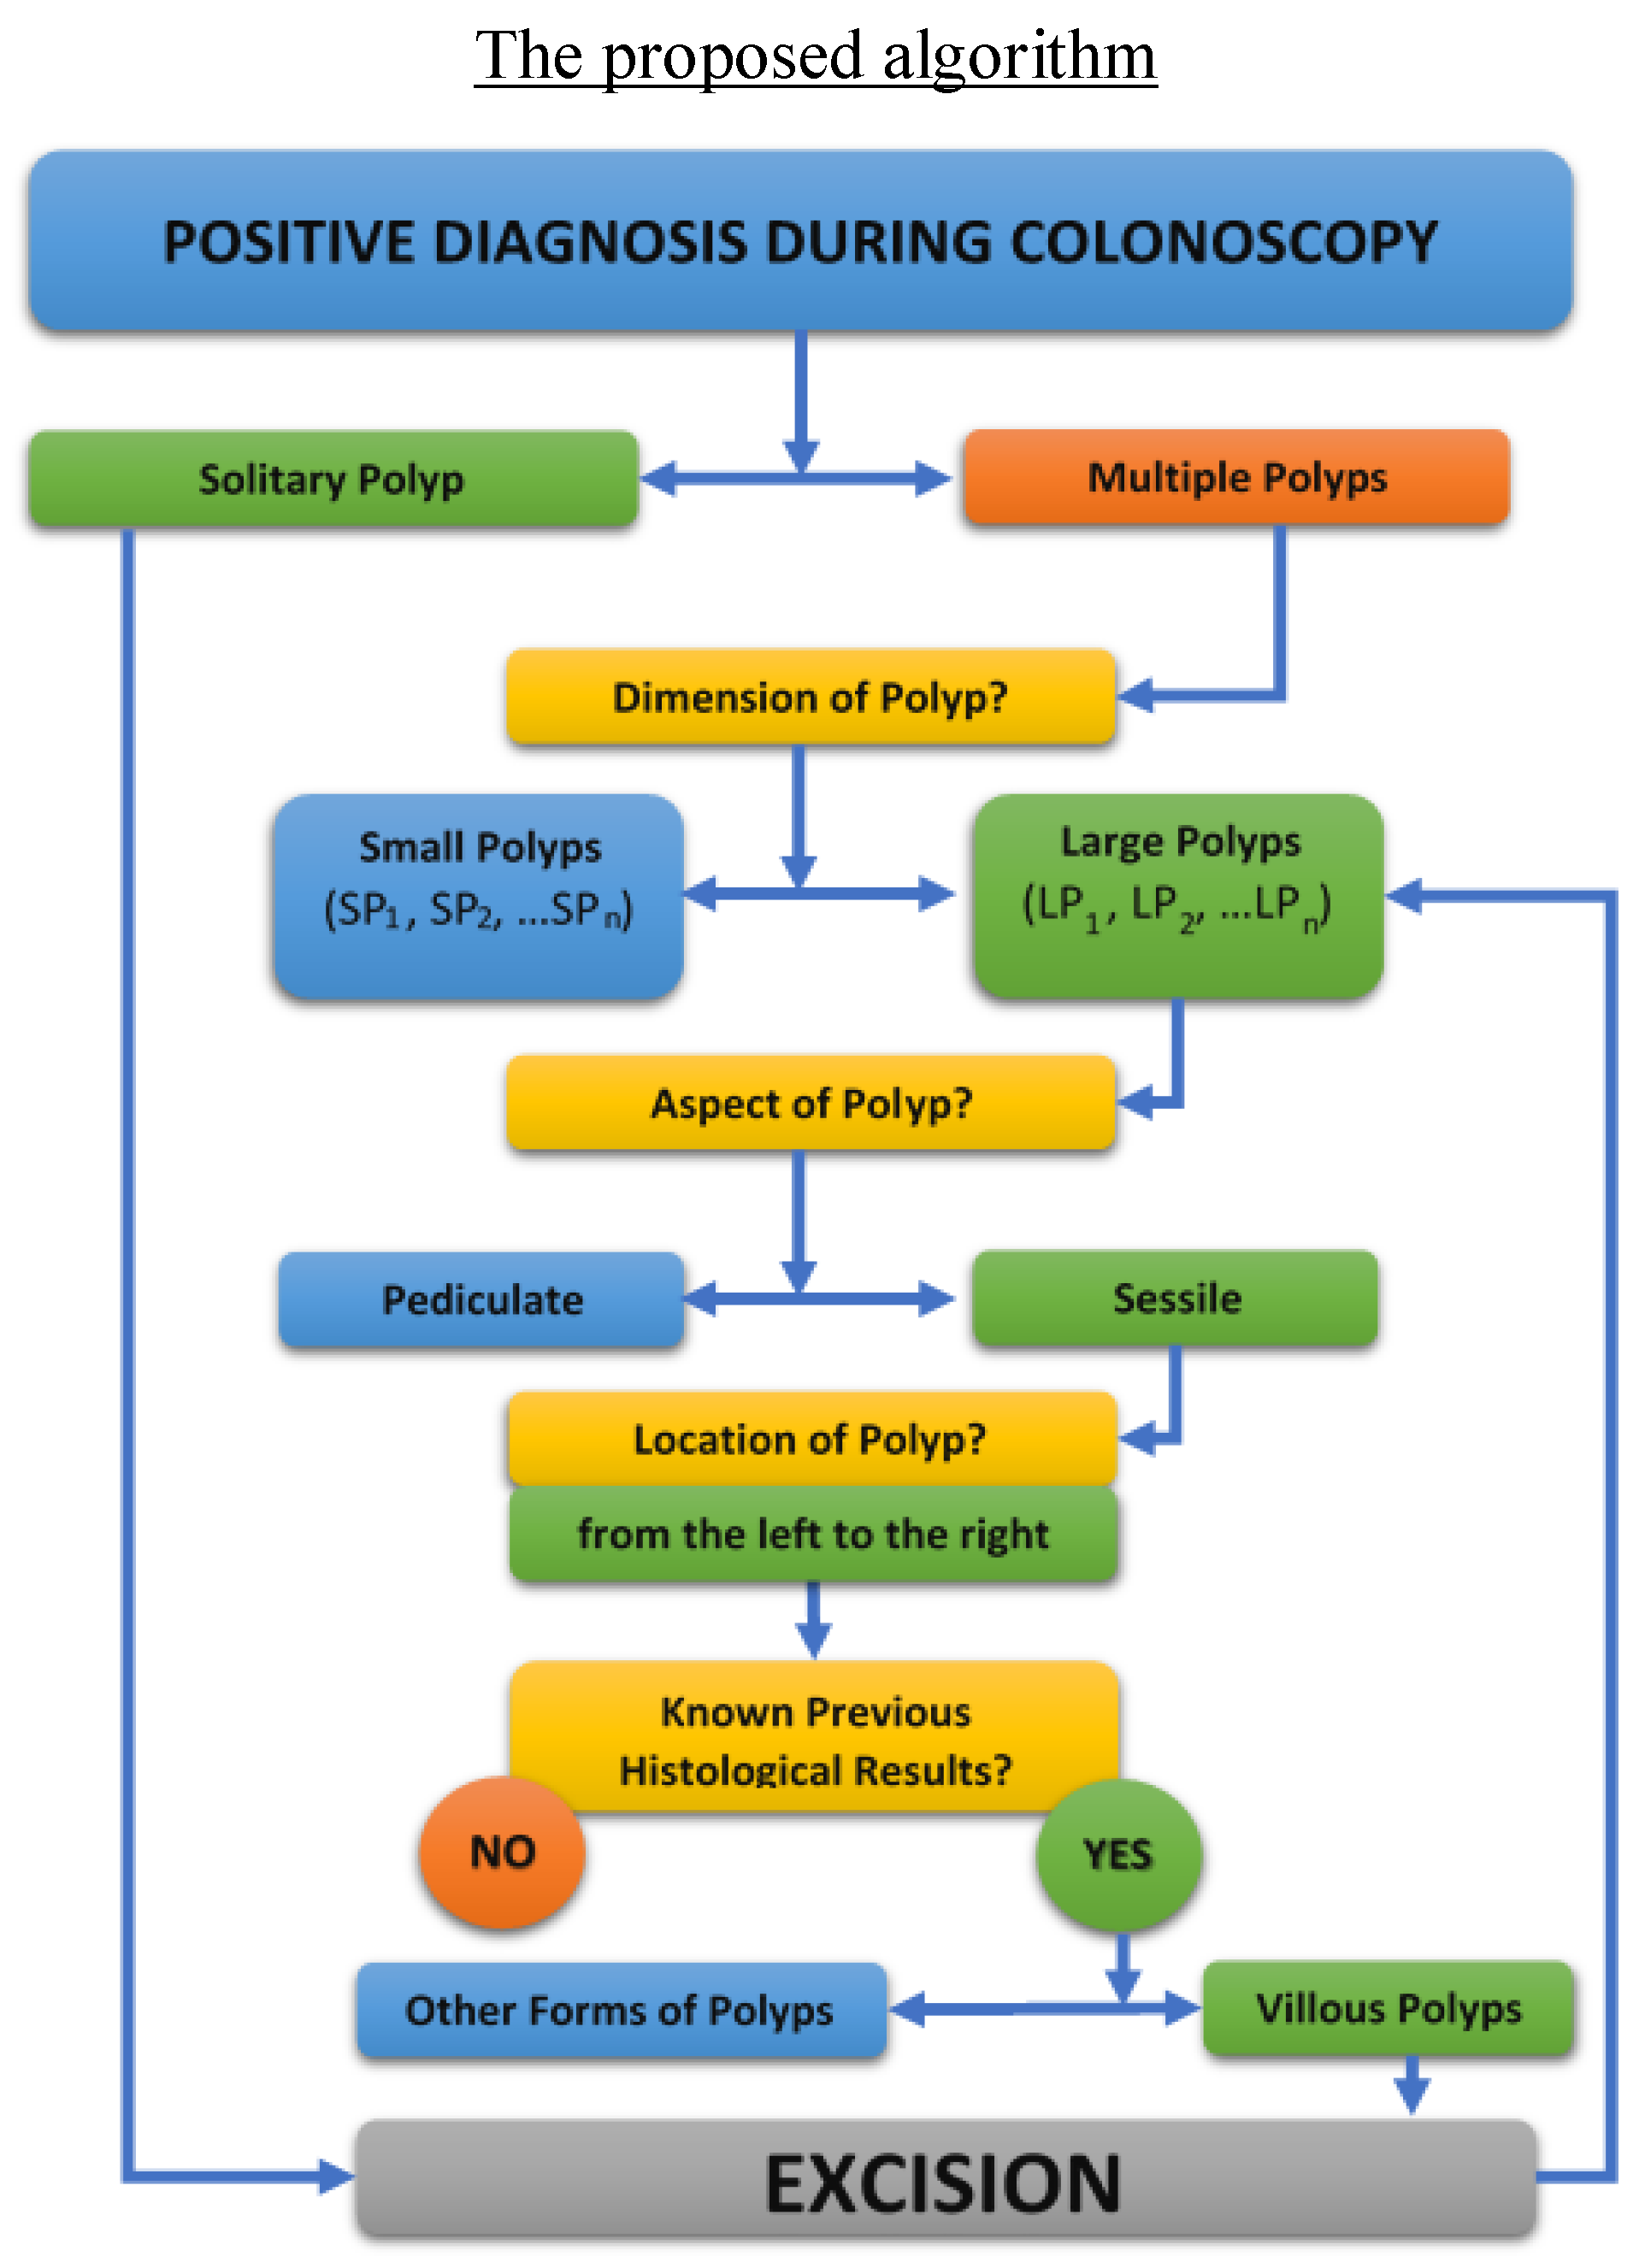
The complete proposed algorithm for the clinical management of patients with multiple polyposis.
Figure 16.
The complete proposed algorithm for the clinical management of patients with multiple polyposis.
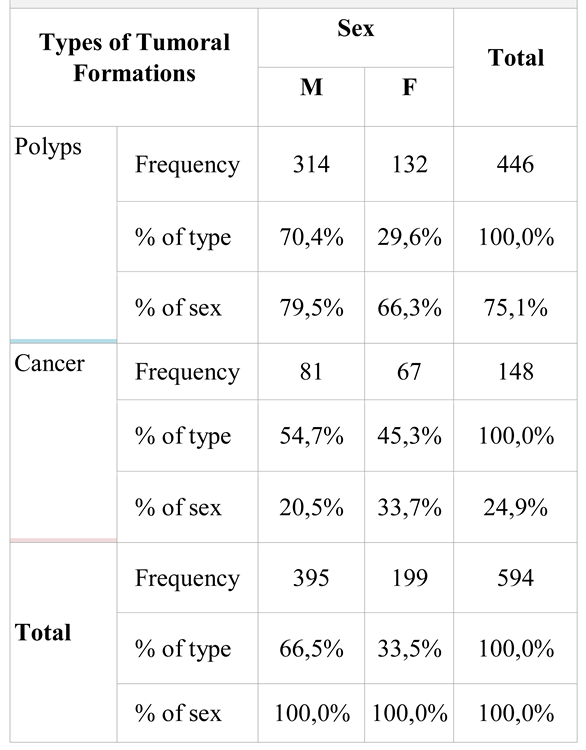
Table 1.
Distribution of colonoscopies in relation with the type of tumor formations detected and sex of investigated patients.
Table 1.
Distribution of colonoscopies in relation with the type of tumor formations detected and sex of investigated patients.
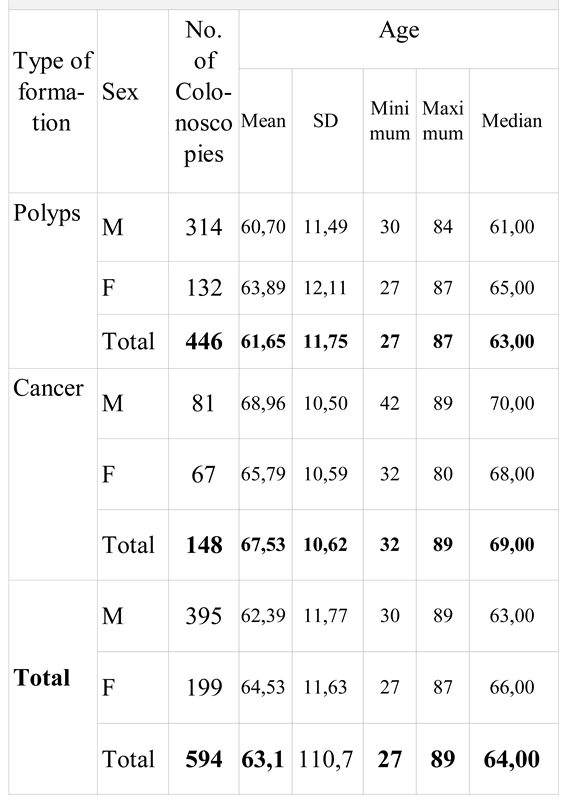
Table 2.
Statistical interpretation of “age” parameter in relation to the tumor type of the identified formations and sex of the investigated patients.
Table 2.
Statistical interpretation of “age” parameter in relation to the tumor type of the identified formations and sex of the investigated patients.
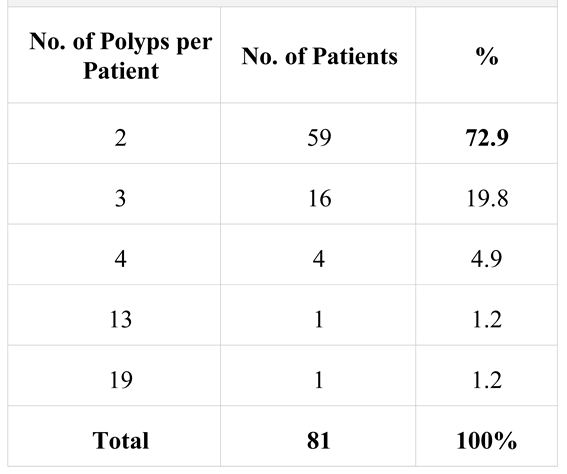
Table 3.
Distribution of patients with multiple polyposis.
Table 3.
Distribution of patients with multiple polyposis.
Table 4.
Distribution of polypectomies in relation to the location of polyps resected on segments. Legend. Location: 1= rectal, 2= sigmoid, 3= descending, 4= transverse, 5= ceco-ascendent colon. nd= no data.
Table 4.
Distribution of polypectomies in relation to the location of polyps resected on segments. Legend. Location: 1= rectal, 2= sigmoid, 3= descending, 4= transverse, 5= ceco-ascendent colon. nd= no data.
Table 5.
distribution of polypectomies relative to the histological type of polyps. Legend. Histology: 1= tubulo-adenomatous, 2= tubulo-villous, 3= serosa, 4= mucosal, 5= leiomyoma | nd = no data available.
Table 5.
distribution of polypectomies relative to the histological type of polyps. Legend. Histology: 1= tubulo-adenomatous, 2= tubulo-villous, 3= serosa, 4= mucosal, 5= leiomyoma | nd = no data available.
Table 6.
Distribution of polypectomies in relation to the degree of dysplasia of polyps.
Table 6.
Distribution of polypectomies in relation to the degree of dysplasia of polyps.
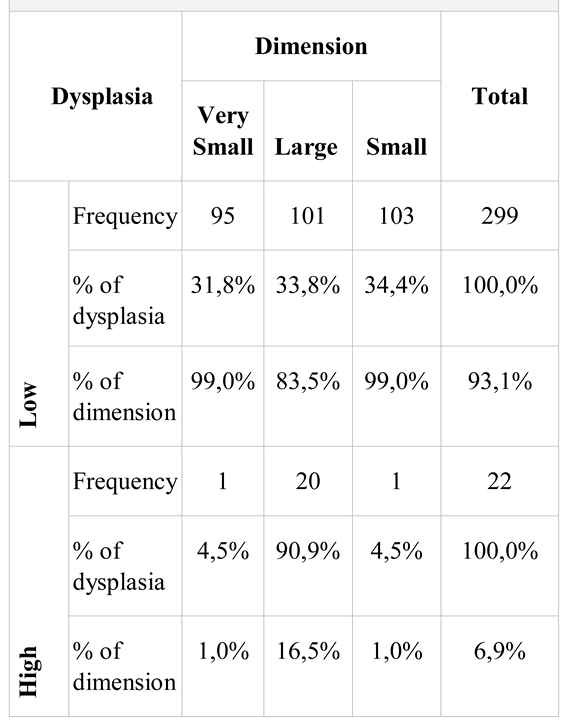
Table 7.
Distribution of polyps in relation to size and degree of dysplasia.
Table 7.
Distribution of polyps in relation to size and degree of dysplasia.
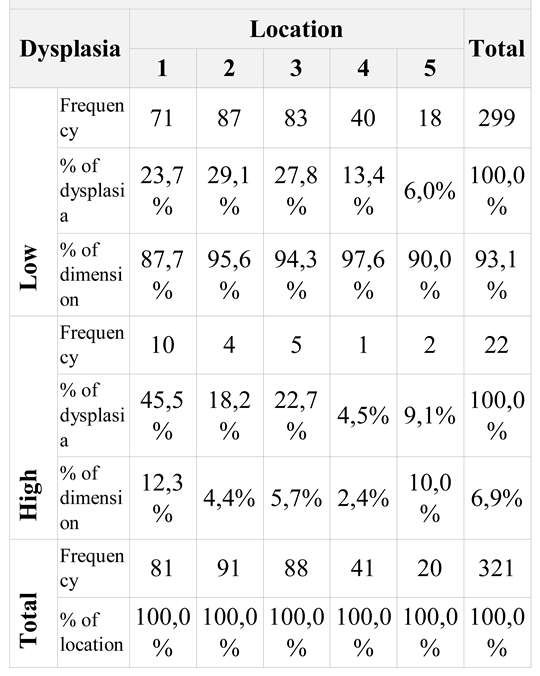
Table 8.
Associative distribution of polypectomies in relation to polyp location and dysplasia. Legend. Location: 1= rectal, 2= sigmoid, 3= descendant, 4= transverse, 5= ceco-ascendent.
Table 8.
Associative distribution of polypectomies in relation to polyp location and dysplasia. Legend. Location: 1= rectal, 2= sigmoid, 3= descendant, 4= transverse, 5= ceco-ascendent.
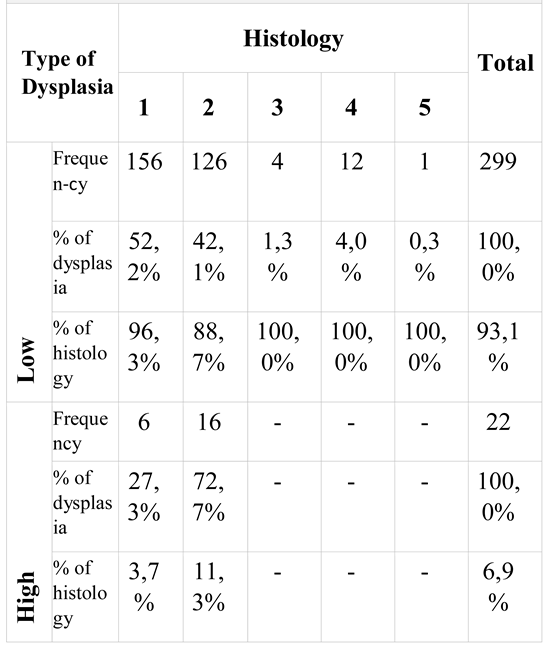
Table 9.
Associative distribution of polypectomies in relation to dysplasia and histology.
Table 9.
Associative distribution of polypectomies in relation to dysplasia and histology.
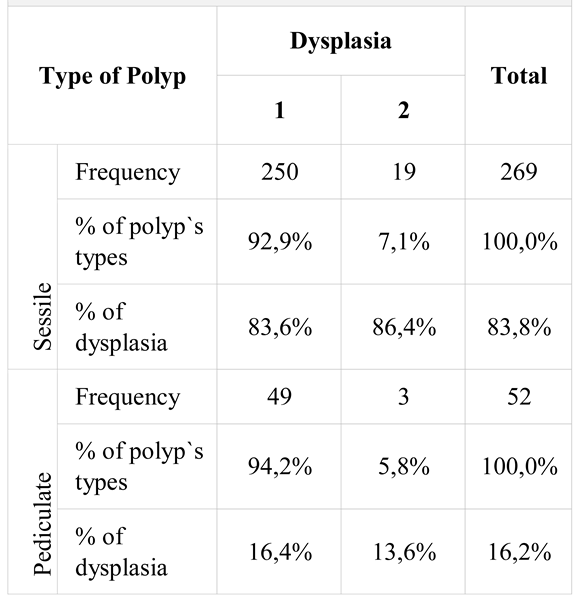
Table 10.
Associative distribution of polypectomies in polyp type ratio and degree of dysplasia. Legend. Type of dysplasia: 1= low, 2= high.
Table 10.
Associative distribution of polypectomies in polyp type ratio and degree of dysplasia. Legend. Type of dysplasia: 1= low, 2= high.
