Materials and Methods
In order to achieve the first proposed objective, the starting points for the extension of the research period (2014-2019) of this study conducted in Romania were (1) the decrease in population exposure to atmospheric air polluted with particulate matter PM
10 for three consecutive years, respectively 2019 - 2021, in Bucharest (according to data collected and reported within the National Air Quality Monitoring System - NAAQS) [
9]; (2) the statistically significant association, which we have previously demonstrated, between the average concentration of PM
10 over a 5-year period (2015-2019) and the cumulative incidence of confirmed cases of COVID-19 per 1000 inhabitants for 43 cities in Romania, including Bucharest [
10]; (3) the exponential increase, after 2020, of SARS-CoV-2 infection cases in Romania (we assessed the incidence of cases collected and reported by the National Center for Surveillance and Control of Communicable Diseases - NCSCCD until January 2022, one year after the start of population vaccination against the new SARS-CoV-2 coronavirus) [
11,
12].
The first objective of the research was achieved by assessing the pre-2020 exposure of the population to atmospheric air polluted with particulate matter PM
10 in Bucharest, determining the mean annual concentration of PM
10 over an extended period of 6 years (2014-2019). To obtain this value, the mean annual concentrations of PM
10, collected from the 6 atmospheric air quality monitoring stations in the 5 sectors of Bucharest, were calculated. These annual values, reported over the six-year period considered, were averaged to obtain the average concentration of PM
10 in Bucharest [
9].
We summarized the research at the level of Bucharest, because according to the data collected and provided by the National Center for Surveillance and Control of Communicable Diseases (NCSCCD) of the National Institute of Public Health (NIPH) [
10,
11], until September 28, 2020, a significant 13.5% of all reported cases of COVID-19 in the whole country were diagnosed in the capital. The cumulative number of confirmed cases of COVID-19 across the country as on September 28, 2020, was 123 944 cases, as reported by the NCSCCD of NIPH [
11,
12].
In this research, the cumulative hourly incidence rate per 1000 inhabitants as of September 28, 2020 was used. In Bucharest (as well as in 15 other counties across the country), a cumulative incidence rate of over 100/1000 population was recorded. In Bucharest, the population reported on January 1, 2020 was taken into account, according to the data collected by the National Institute of Statistics [
13].
The 2nd objective of the research was realized by assessing the past exposure to the atmospheric air polluted with PM10 over a period of 7 years in 43 cities - 41 county capitals and 2 localities in Ilfov County. In order to assess this exposure to the atmospheric air polluted with PM10, we determined for each city the mean value of the annual concentration of PM10 over a 7-year period (2015-2021). To derive this value, the average annual concentrations of PM10 collected from the atmospheric air quality monitoring stations in each city were calculated. These annual values, obtained over a 7-year period, were averaged to obtain the mean concentration of PM10.
Univariate statistical analysis, correlation and regression analysis were used to analyze the data underlying the first two research objectives. A level of p<0.05 was used to indicate statistical significance. Statistical analysis was performed using STATA MP version 13.0.
The third research objective was realized through an online literature search, i.e. an in-depth systematic literature review according to the PRISMA-ScR guidelines [
14] - Preferred Reporting Items for Systematic Reviews and Meta-Analyses. The information, which we subsequently used as references for the development of the last part of the search, was selected on the basis of the answers to several questions (used as inclusion criteria): (Q1) does air polluted with particulate matter correlate with the growth and spread of aeroallergens (common ragweed) and higher rates of viral infection (SARS-CoV-2)? (Q2) does atmospheric air pollution with particulate matter and soil pollution with sedimentable particulate matter correlate with increased viral shedding (SARS-CoV-2) and increased incidence of COVID-19? (Q3) is there a correlation between atmospheric air polluted with particulate matter, airborne pollen concentration (co-risk factor) and higher rates of viral infection (SARS-CoV-2)? (Q4) are there additional environmental factors (co-risk factors) that may influence the concentration and spread of environmental pollen (common ragweed) as well as viral infection (SARS-CoV-2)?
We chose as our inclusion criteria for selection all those available studies that aimed to identify any temporal and spatial association with the proposed aims, following the use of the set of questions. We finally used only the data that we considered relevant and that answered, even partially, the four control questions. All those data that we did not consider to be directly related to the research were excluded.
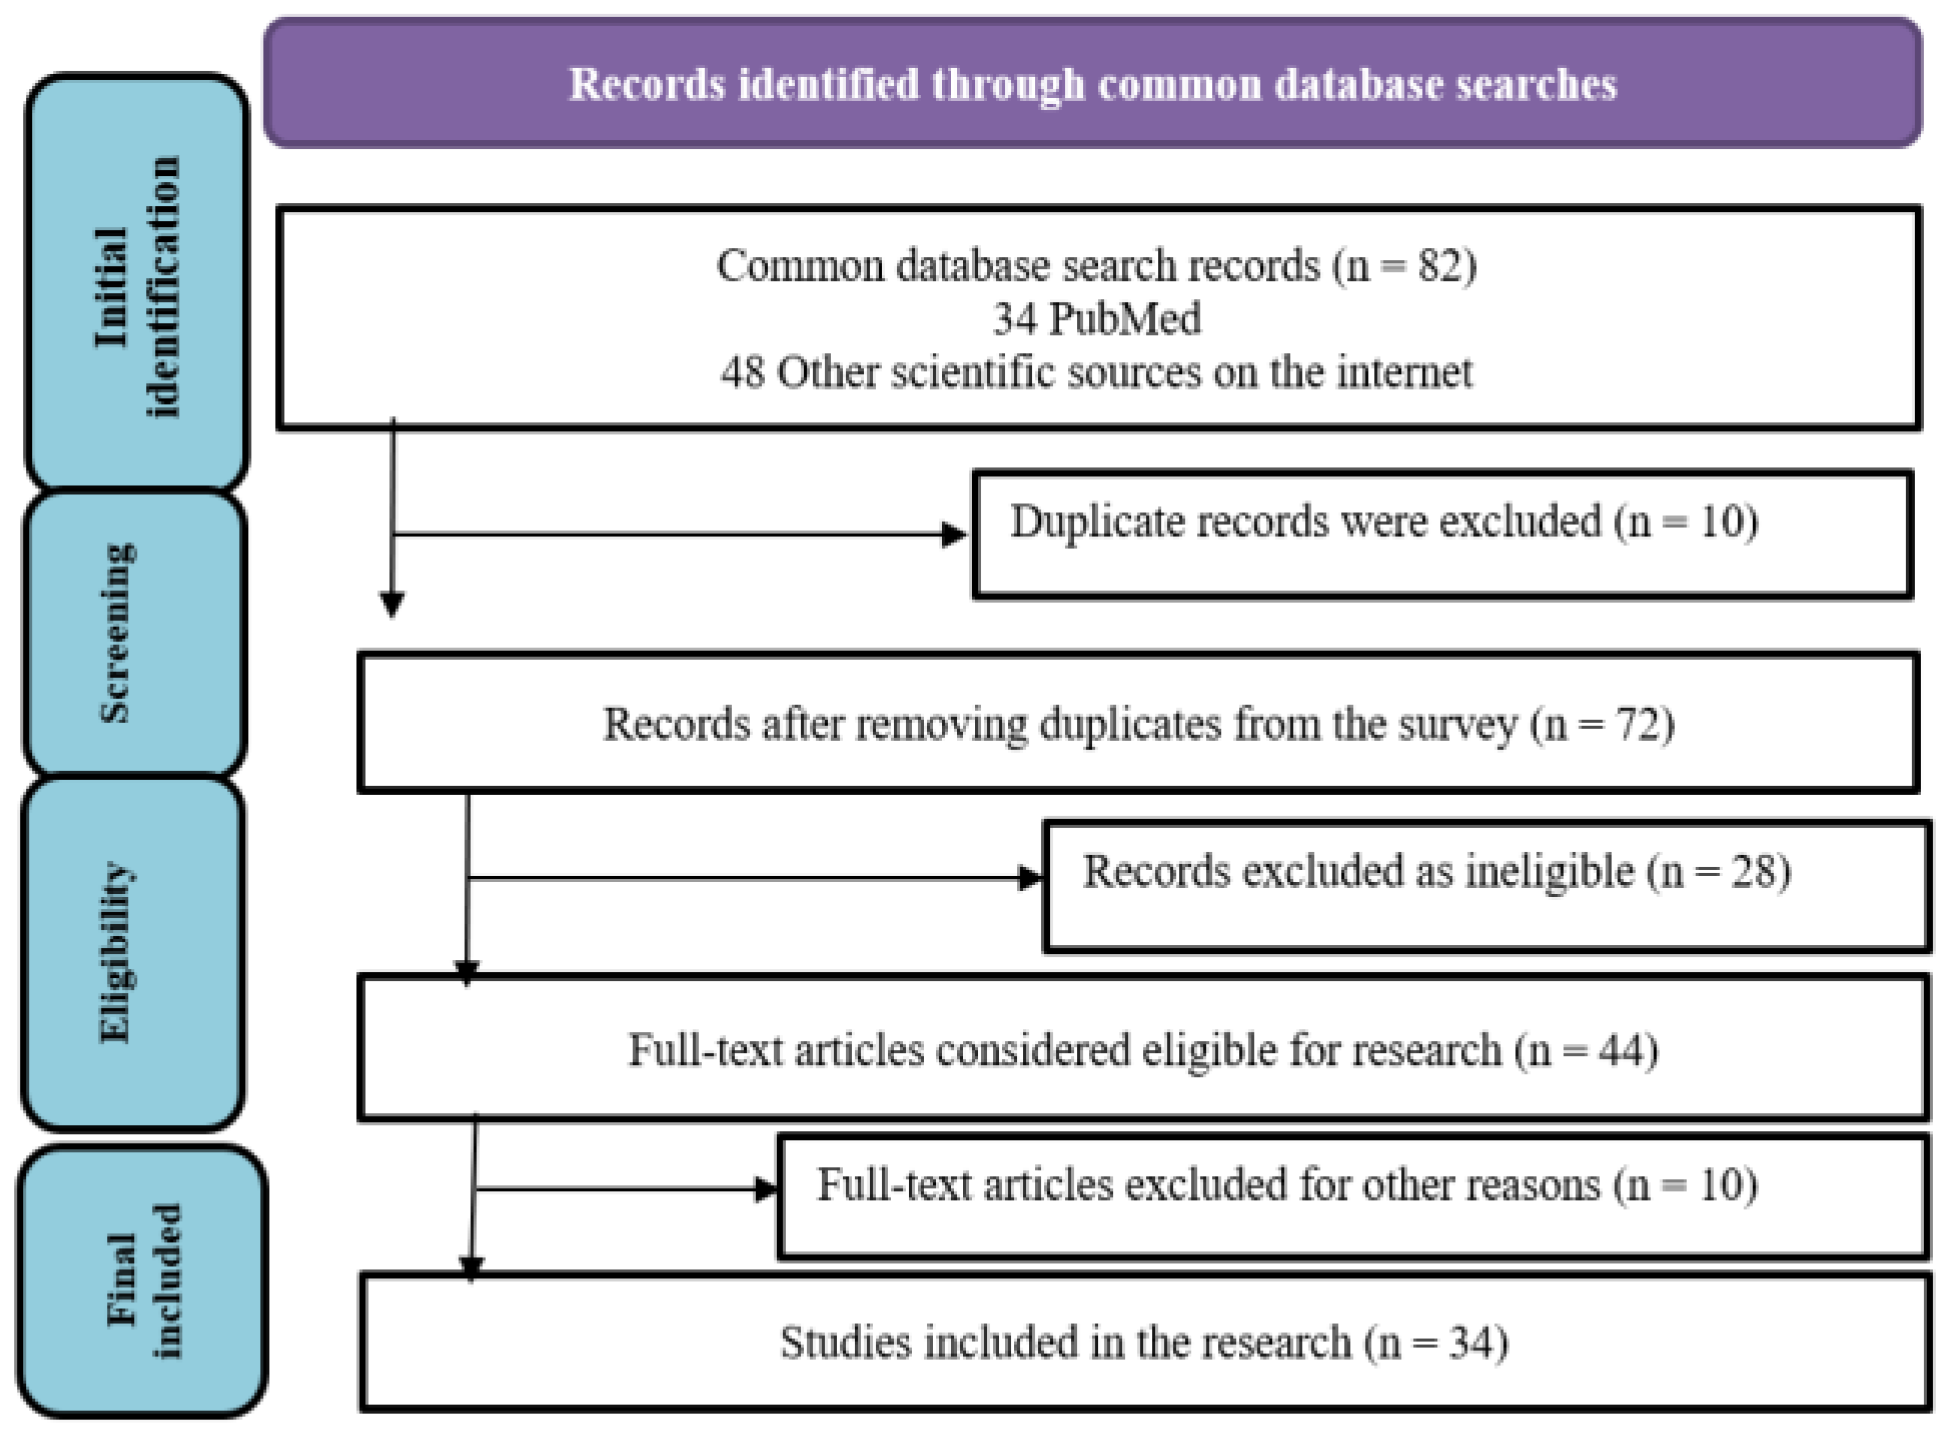
The database search yielded 82 scientific articles and books, mostly published in the last four years, from 2020 (the year of the COVID-19 pandemic) to the present, from which we selected both general information on air pollution by particulate matter, aeroallergens (common ragweed) and viruses (SARS-CoV-2), and specific, quantifiable information that answered the set of questions.
From the data collected, a subset comprising 34 scientific articles and books were used as references based on the inclusion criteria. We note that we eliminated, after the first stage of selection, all duplicate studies. Subsequently, a checklist was useful in assessing the quality of the papers and included questions assessing the quality of the chosen papers as well as simple answers. On the basis of the collected data, a systematic comparative analysis was performed.
Figure 1 summarizes the steps followed to select the information from the databases, according to the PRISMA 2020 flowchart [
14]. The description includes, in turn: the initial stage - selection, the screening stage, the document eligibility stage and the final stage - final selection.
Results
In this research, the first proposed objective was realized in Bucharest, the capital and the most congested urban area in Romania, using the data obtained from the measurement and reporting from the automatic air quality monitoring stations and the data on the incidence of COVID-19 cases [
9,
10,
11,
12].
In Bucharest, 6 stations are used, one automatic air quality monitoring station for sectors 1-4 and 2 automatic air quality monitoring stations for sector 6 (there is no automatic air quality monitoring station for sector 5).
The data on atmospheric air polluted with PM
10, for the years 2014-2019, were obtained in accordance with Law no. 104/2011 on ambient air quality using the National Air Quality Monitoring System – NAAQS [
9].
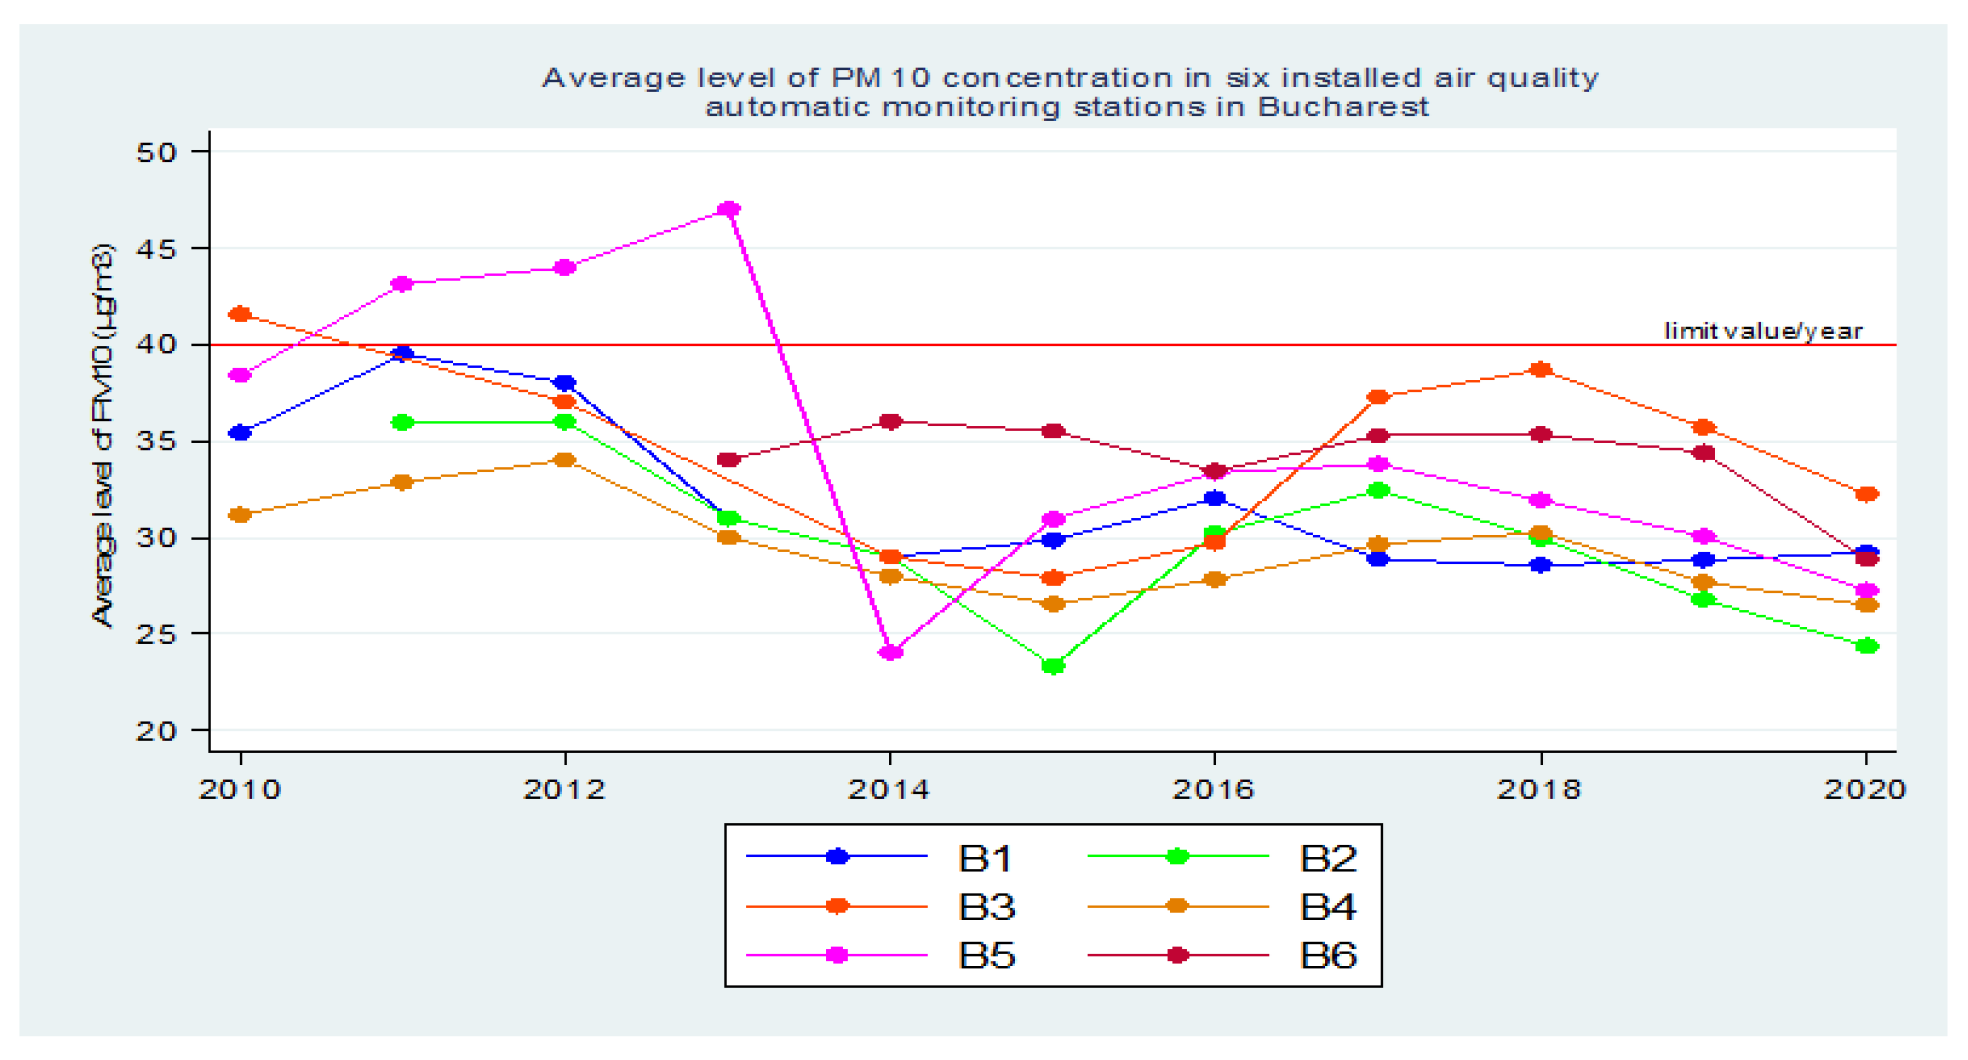
Using the data reported in the SNMCA, initially for a longer period of time 2010 - 2020, it was observed that, starting in 2014, there was an increase in population exposure to atmospheric air polluted with [PM
10] [
9].
Prior to 2014, three of these automatic air quality monitoring stations in Bucharest recorded reports of [PM
10] values that reached or exceeded the maximum allowable concentration (MAC) - in 2010, 2011, 2012 and 2013, with a steady increase in values from 2010 to 2012, followed by a sharp decrease in 2013-2014 [
9].
Subsequently, until 2018, there was a steady increase in population exposure to atmospheric air polluted with PM
10, as reported by all 6 automatic air quality monitoring stations in Bucharest [
9].
In 2019, according to the data reported in the SNMCA, there was a decrease in population exposure to atmospheric air polluted with PM
10 at all 6 automatic atmospheric air quality monitoring stations in Bucharest. Then, in 2020, a larger decrease followed with the lockdown in March - May, during the beginning of the COVID-19 pandemic [
9].
Figure 2.
Average annual concentration of PM10 in the 6 air quality monitoring stations in Bucharest (2010-2020).
Figure 2.
Average annual concentration of PM10 in the 6 air quality monitoring stations in Bucharest (2010-2020).
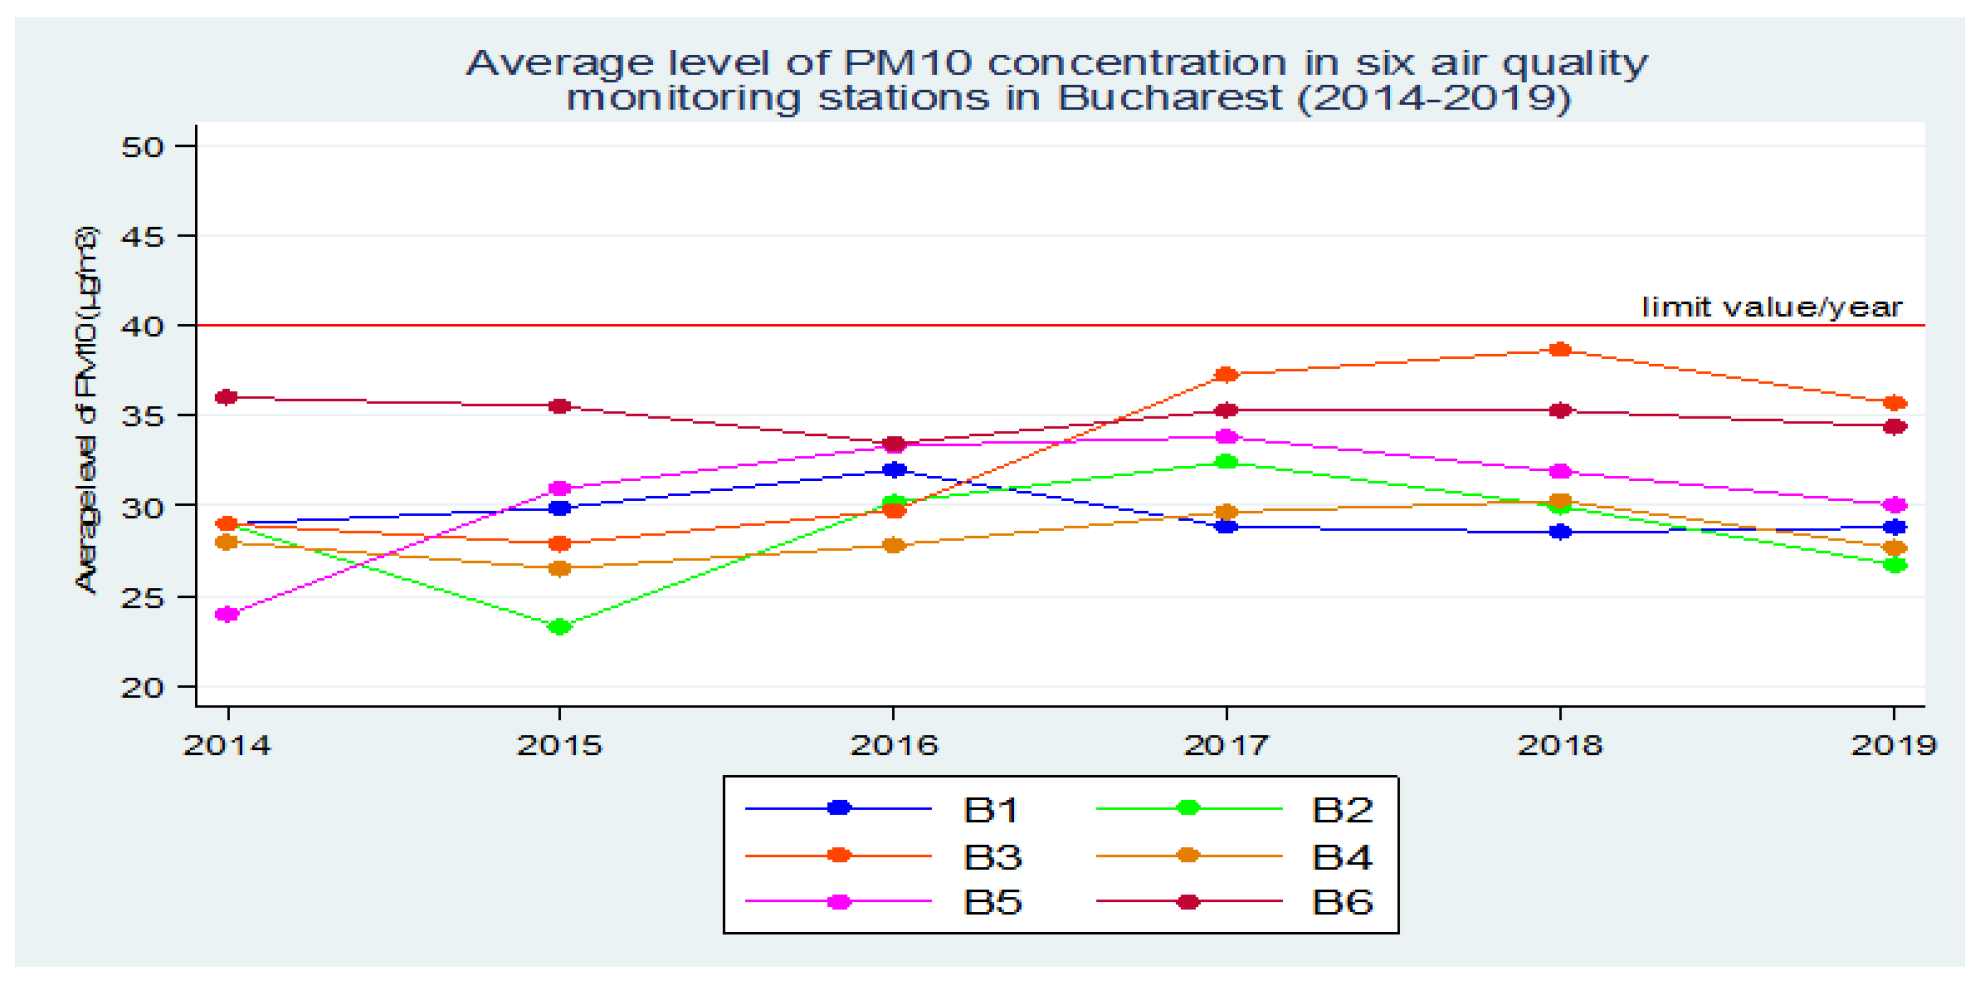
Thus, based on these collected data, for the first stage of the research we agreed the period of assessment of the exposure of the population of Bucharest to the atmospheric air polluted with PM10 as period 2014 - 2019 (six years), proposing to determine the average value of the annual concentration of PM10 over this extended time interval.
Previously, in 2020, we evaluated in another study, the exposure of the population in 43 cities (41 county capitals and 2 localities in Ilfov county) to atmospheric air polluted with PM
10 in the period 2015 - 2019 (five years) [
10].
In order to obtain this mean annual concentration of PM10, the mean annual concentrations of PM10 collected from all the 6 atmospheric air monitoring stations in Bucharest were calculated. These annual values, obtained over a period of 6 years, were averaged to obtain the mean concentration of PM10 in Bucharest.
Figure 3.
Average annual concentration of PM10 in the 6 air quality monitoring stations in Bucharest (2014-2019).
Figure 3.
Average annual concentration of PM10 in the 6 air quality monitoring stations in Bucharest (2014-2019).
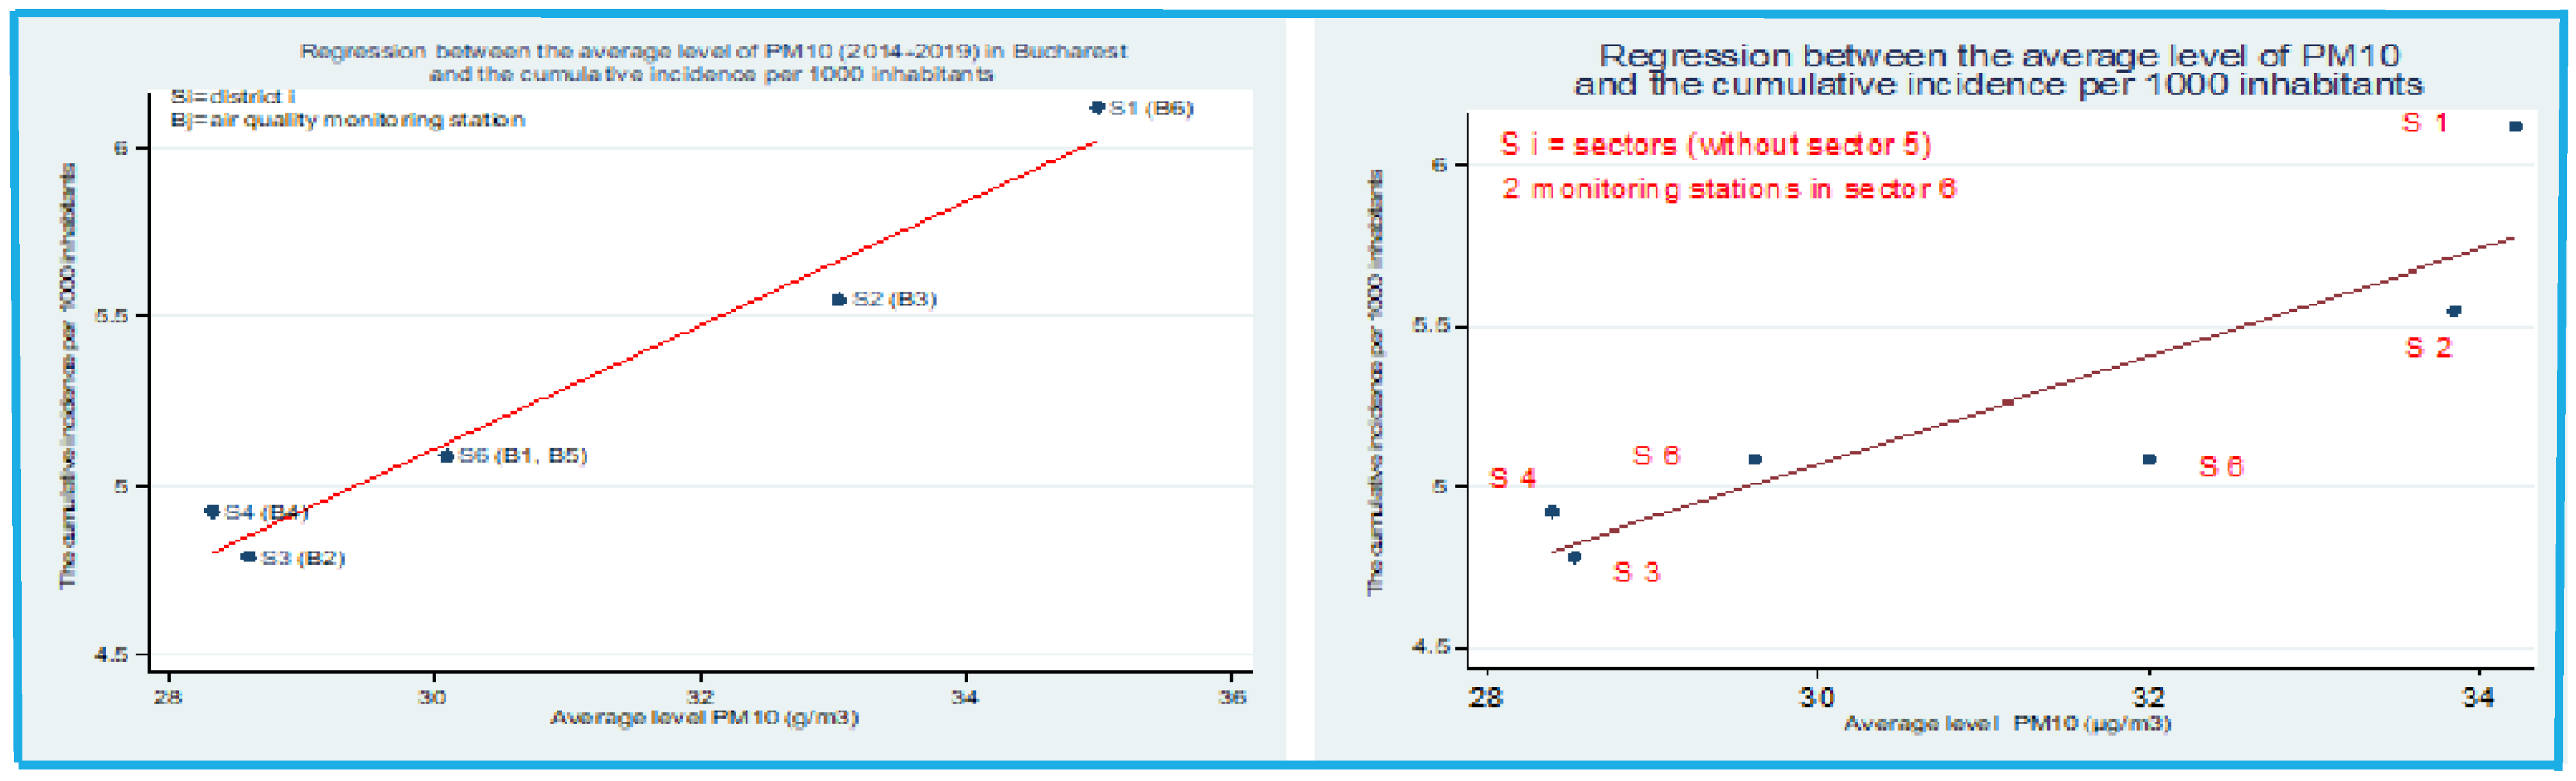
At the end of the determinations, we aimed to compare the results obtained in this study with the results of another study that we conducted in 2020, when the relationship between the average concentration of PM
10 in Bucharest over a period of five years and the cumulative incidence of cases per 1 000 inhabitants was also investigated, in order to demonstrate that exposure of the population to atmospheric air polluted with PM
10, even at low values below the maximum permissible concentrations, but sometimes close to them, over a long period of time (2015-2019), can have negative effects on the health of the population, which is more vulnerable to external agents such as pathogenic microorganisms – viruses [
10].
Figure 4.
Regression equation between the mean concentration of PM
10 and the cumulative incidence of cases per 1000 inhabitants in Bucharest in the period 2014-2019 versus the period 2015-2019 *from "PM
10 and NO
2 Air pollution and evolution of COVID-19 cases in Romania" [
10].
Figure 4.
Regression equation between the mean concentration of PM
10 and the cumulative incidence of cases per 1000 inhabitants in Bucharest in the period 2014-2019 versus the period 2015-2019 *from "PM
10 and NO
2 Air pollution and evolution of COVID-19 cases in Romania" [
10].
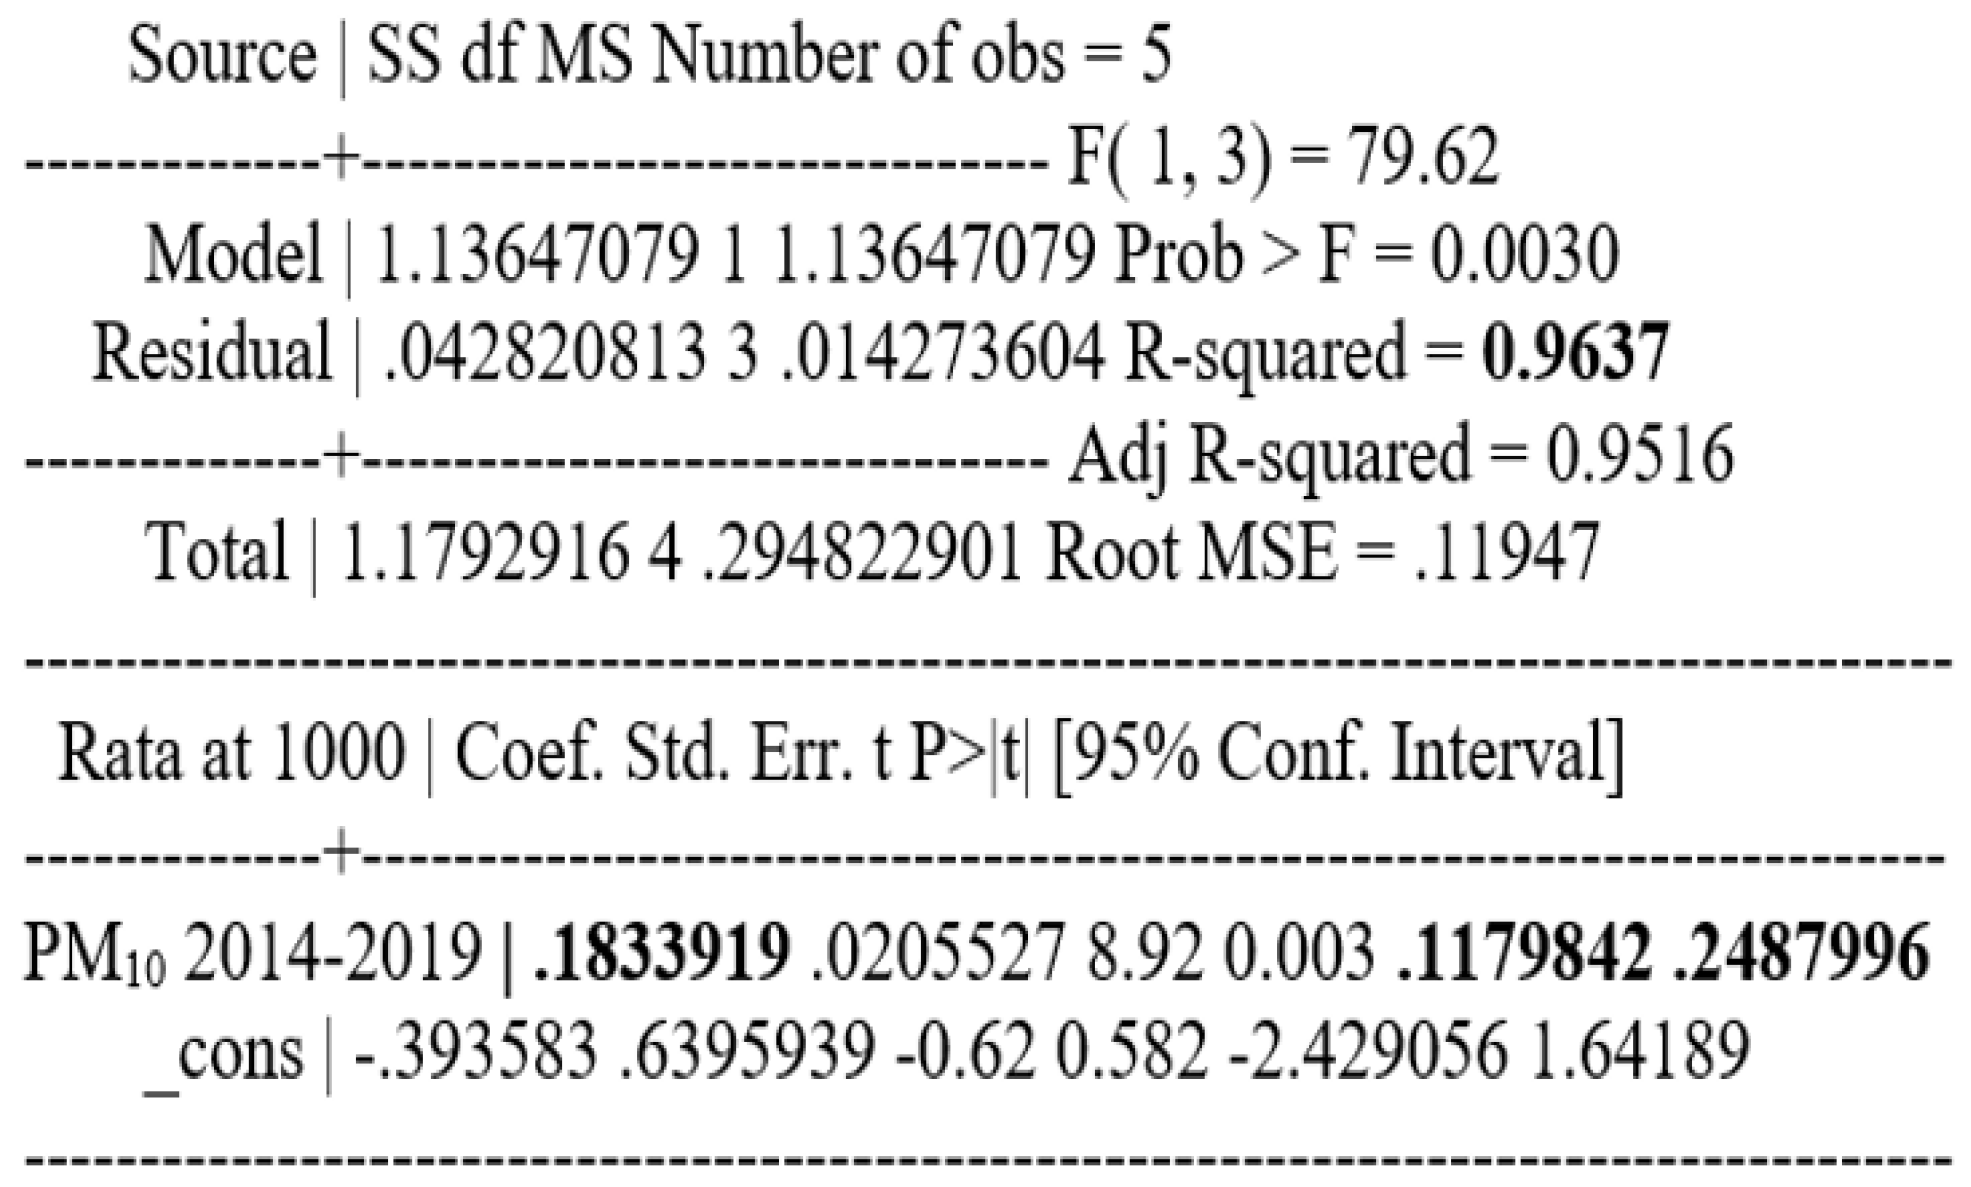
The correlation between COVID-19 incidence and PM10 concentration in atmospheric air is statistically significant; p = 0.003 and Pearson correlation coefficient = 0.98 for the period 2014 - 2019 and p = 0.019 and Pearson correlation coefficient = 0.88 for the period 2015 - 2019.
For the period 2014-2019, the relationship between the average concentration of PM10 over a 6-year period and the cumulative incidence of cases per 1 000 inhabitants was investigated. The resulting Pearson correlation coefficient has a value of 0.98, p=0.003, which therefore means a strong and statistically significant relationship between the two variables.
To find out the relationship between these two variables, a regression analysis was performed, which showed that for a one-unit increase in the mean concentration of PM10, the cumulative incidence of cases per 1000 inhabitants increases by 0.183 (p=0.003; confidence interval, CI (95%): 0.12-0.25).
Taking as an example one of the sectors with a population of 259 084 inhabitants. In order to find the number of new cases that would correspond to a cumulative incidence of 0.183, the regression model showed that in Bucharest, an increase in the mean concentration of PM
10 by one unit is associated with 47 new cases (
Figure 5).
For the period 2015-2019, the relationship between the average concentration of PM
10 over a 5-year period and the cumulative incidence of cases per 1 000 inhabitants was investigated [
10]. The resulting Pearson correlation coefficient has a value of 0.88, p=0.019, which means a strong and statistically significant relationship between the two variables.
To find the relationship between these two variables, a regression analysis was performed, which showed that for a one-unit increase in the mean concentration of PM
10, the cumulative incidence of cases per 1000 inhabitants increases by 0.166 (p=0.02; confidence interval, CI (95%): 0.04-0.29) [
10].
In order to find the number of new cases that would correspond to a cumulative incidence of 0.166, taking as an example one of the sectors with a population of 259 084, the regression model above shows that an increase in the mean concentration of PM
10 by one unit is associated with 43 new cases [
10].
In this research, the 2nd proposed objective was realized through a study carried out in 43 cities in Romania, 41 county capitals and 2 localities in Ilfov County. In each of these cities, included in the study, there are between 1 and 4 automatic atmospheric air quality monitoring stations, except in Bucharest, where 6 such monitoring stations are installed.
The data on the cumulative number of confirmed cases of COVID-19 until 23 January 2022 - 2,029,211 (more precisely, one year after the start of the immunization of the population against SARS-CoV-2) were provided by the National Center for Surveillance and Control of Communicable Diseases (NCSCCD) of the National Institute of Public Health (NIPH) [
11,
12].
The cumulative hourly cumulative incidence per 1000 inhabitants on September 28, 2020 was used in the study. In order to derive this value, the calculation started from the annual average concentrations of PM
10 collected from automatic air quality monitoring stations in each of the cities in the study. These annual values, obtained over a 7-year period (2015-2021), were averaged to derive the average concentration of PM
10 in each city included in the study [
9].
The data on atmospheric air polluted with PM
10, for the period 2014-2021, were obtained in accordance with Law no. 104/2011 on ambient air quality using the National Air Quality Monitoring System – NAAQS [
9].
In January 2021, the population vaccination of against SARS-CoV-2 started, as reported by the NCSCCD (NIPH), one year later, in January 2022, the incidence of COVID-19 in Romania had increased exponentially [
11,
12].
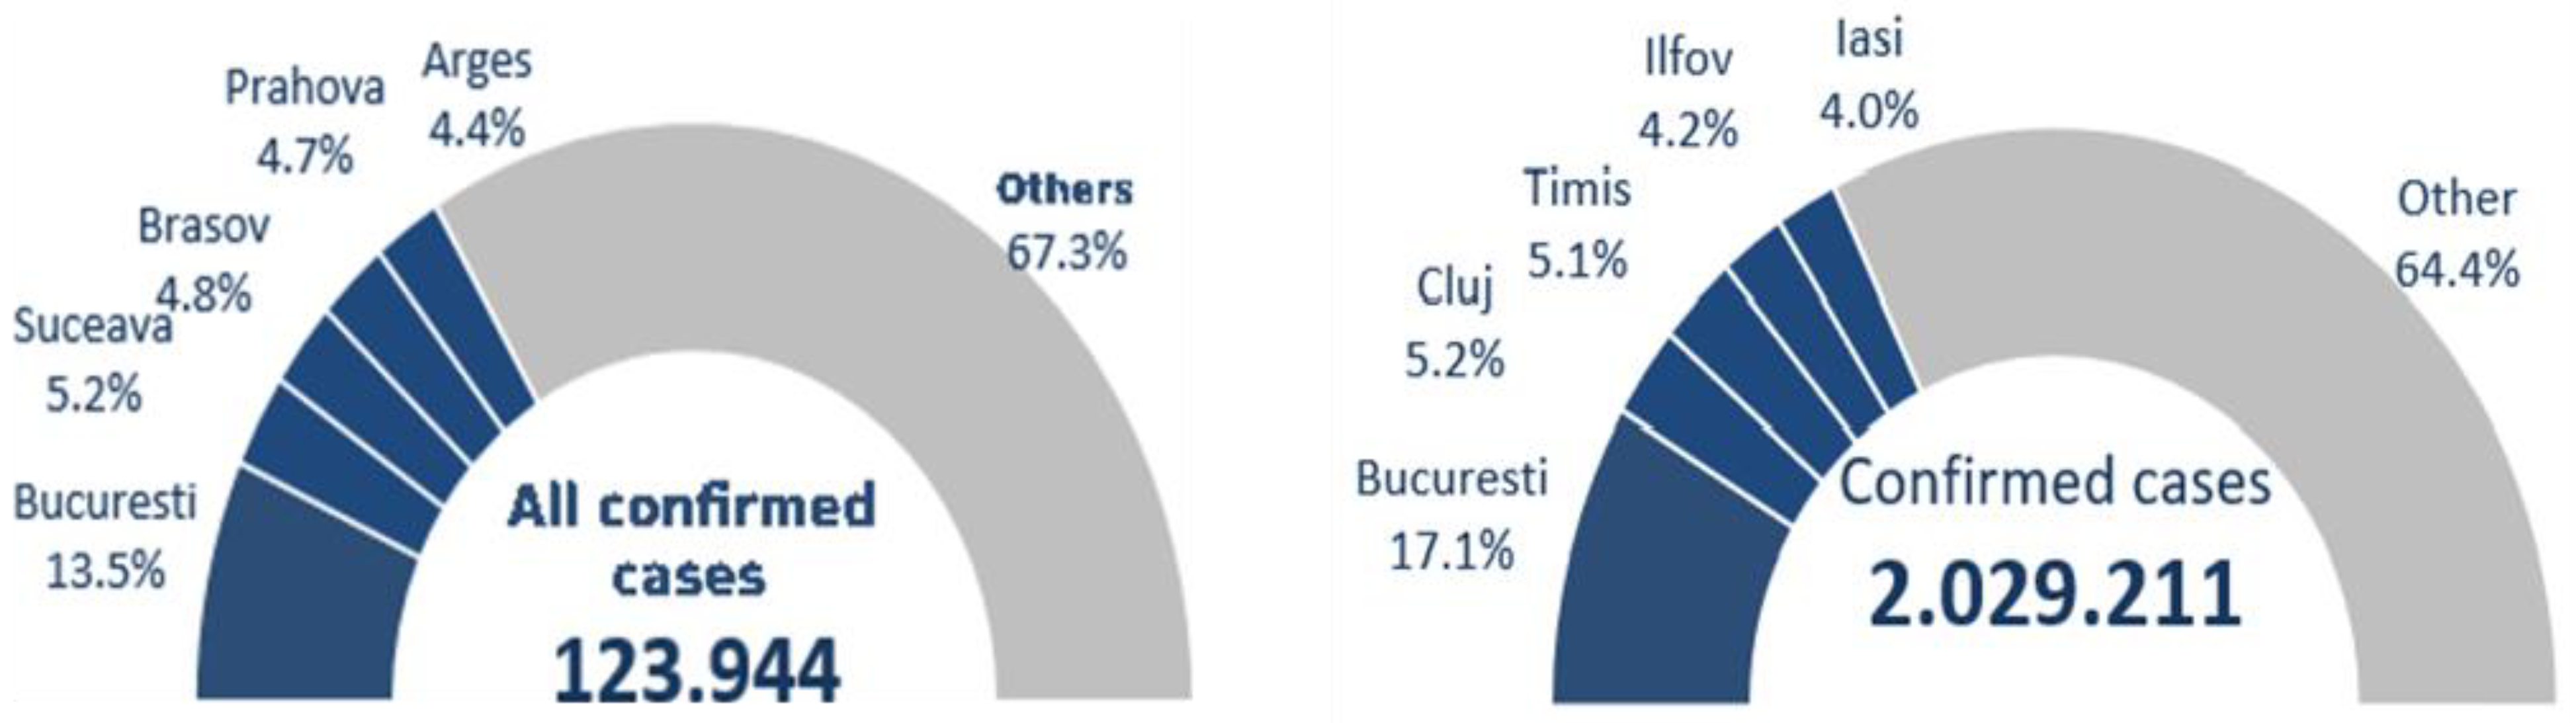
Of all 123,944 cases reported on September 27, 2020, according to the data collected by NIPH, 32.6% were diagnosed in 5 major areas of the country: 13.5% in Bucharest, 5.2% in Suceava, 4.8% in Brasov, 4.7% in Prahova and 4.4% in Argeș versus the 2.029,211 cases reported on January 23, 2022, according to the data collected by NIPH, a percentage of 35.6% were diagnosed in 5 major areas of the country: 17.1% in Bucharest, 5.2% in Cluj, 5.1% in Timis, 4.2% in Ilfov and 4.0% in Iasi [
11,
12].
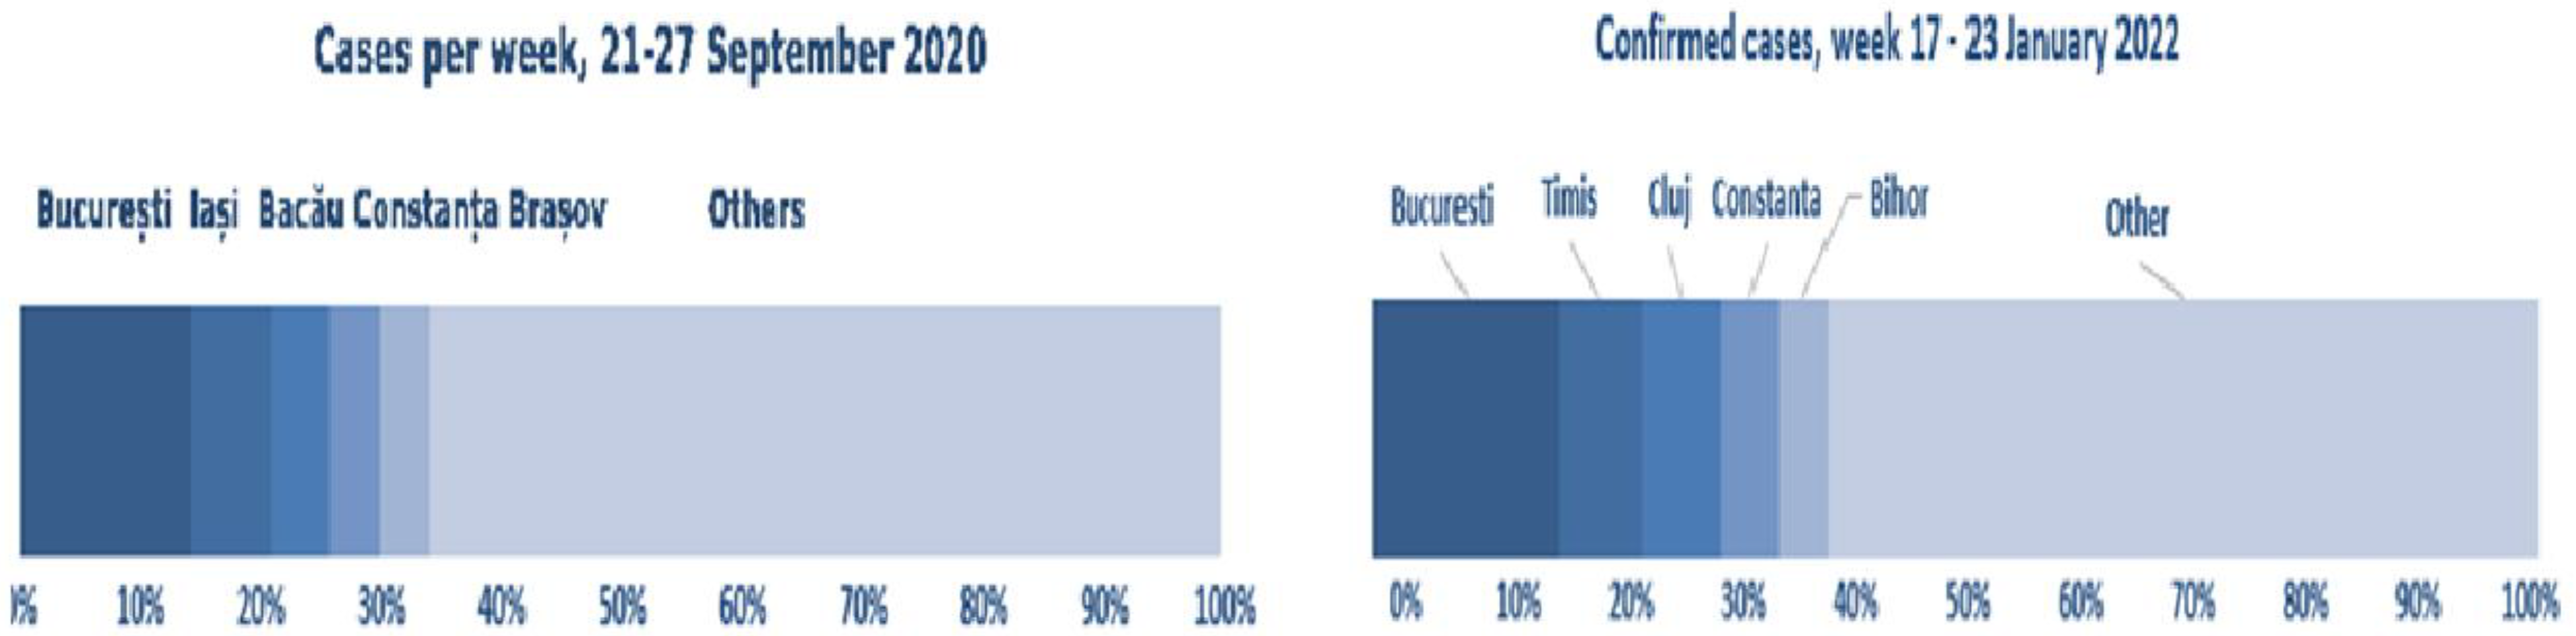
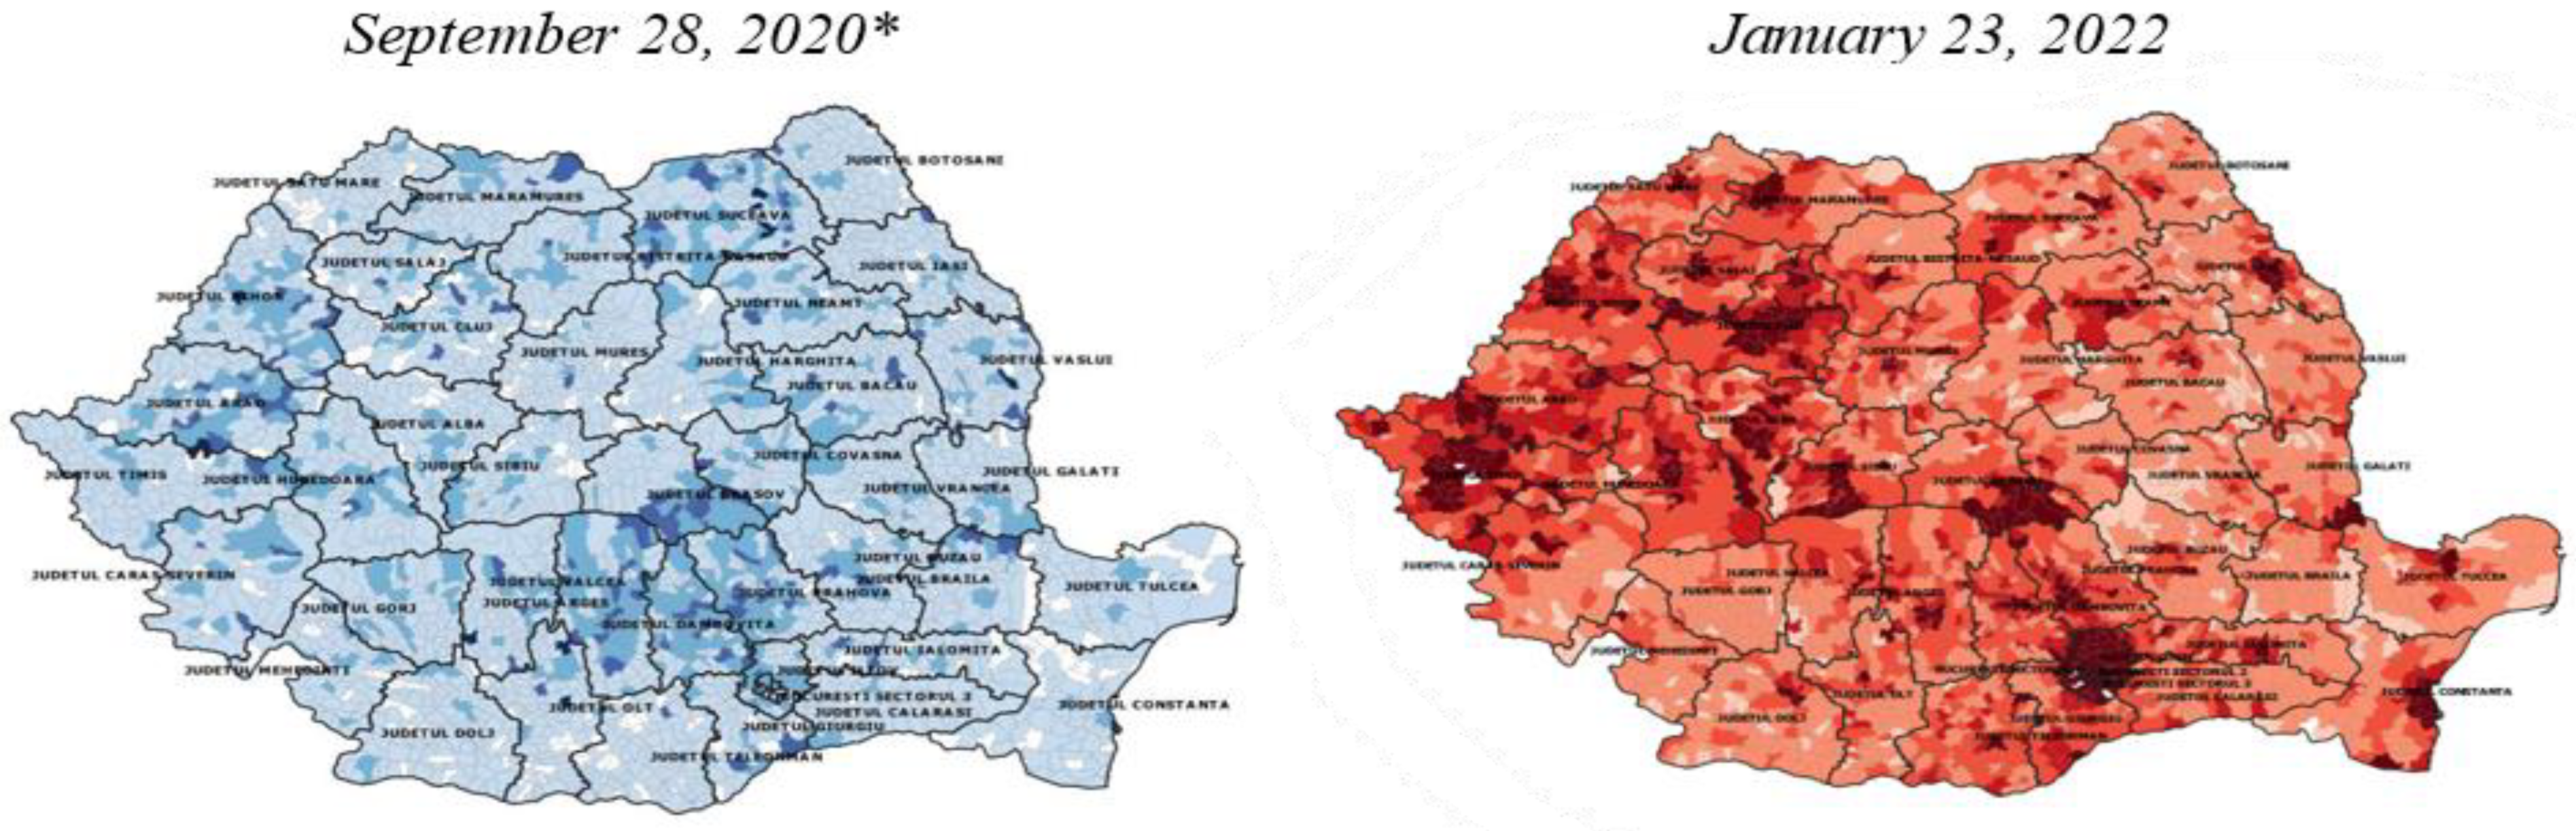
Figure 6 presents the total number of confirmed cases on September 28, 2020 versus September 23, 2022.
Of the cases reported in the week of September 21-27, 2020, 34.3% were reported in Bucharest, Iași, Bacău, Constanța and Brașov versus the cases reported in the week of January 17-23, 2022, according to data collected by NIPH, when 40% were reported in Bucharest, Timiș, Cluj, Constanța and Bihor [
11,
12].
Figure 7 presents the total number of confirmed cases on September 28, 2020 versus total number of confirmed cases on September 23, 2022 (air pollution and evolution of COVID-19 cases confirmed in Romania).
Figure 7.
Total number of confirmed cases on September 28, 2020 versus total number of confirmed cases on September 23, 2022; *from "PM
10 and NO
2 Air pollution and evolution of COVID-19 cases in Romania", [
10].
Figure 7.
Total number of confirmed cases on September 28, 2020 versus total number of confirmed cases on September 23, 2022; *from "PM
10 and NO
2 Air pollution and evolution of COVID-19 cases in Romania", [
10].
Figure 8.
Cumulative incidence of confirmed COVID-19 cases per 1000 inhabitants; *from "PM
10 and NO
2 Air pollution and evolution of COVID-19 cases in Romania", [
10].
Figure 8.
Cumulative incidence of confirmed COVID-19 cases per 1000 inhabitants; *from "PM
10 and NO
2 Air pollution and evolution of COVID-19 cases in Romania", [
10].
We compared the cumulative incidences of diagnosed and confirmed cases of COVID-19 per 1000 population for January 23, 2022 with September 27, 2020.
We compared the cumulative incidence of diagnosed and confirmed cases of COVID-19 per 1000 population on January 23, 2022 with the cumulative incidence of confirmed cases of COVID-19 per 1000 population on September 27, 2020 (the date we considered as a benchmark in achieving the first objective of the current research and the date we used as a benchmark in the first study conducted in 2020), and found the following:
- a)
The cumulative incidence of confirmed cases of COVID-19 per 1000 inhabitants by September 28, 2020 for the 43 cities included in the study was 7.1±2.4. The minimum incidence value was 2.2 in Satu Mare and the maximum incidence value was 13.7 in Suceava [
11,
12].
- b)
The cumulative incidence of confirmed cases of COVID-19 per 1000 inhabitants by January 23, 2022 for the 43 cities included in the study was 117.71.
The minimum incidence value was 59.1 in Vaslui and the maximum incidence value 187.3 was registered in Măgurele, Ilfov [
11,
12].
Figure 9.
Cumulative incidence of confirmed COVID-19 cases per 1000 inhabitants for the 43 cities included in the study; *from "PM
10 and NO
2 Air pollution and evolution of COVID-19 cases in Romania", [
10].
Figure 9.
Cumulative incidence of confirmed COVID-19 cases per 1000 inhabitants for the 43 cities included in the study; *from "PM
10 and NO
2 Air pollution and evolution of COVID-19 cases in Romania", [
10].
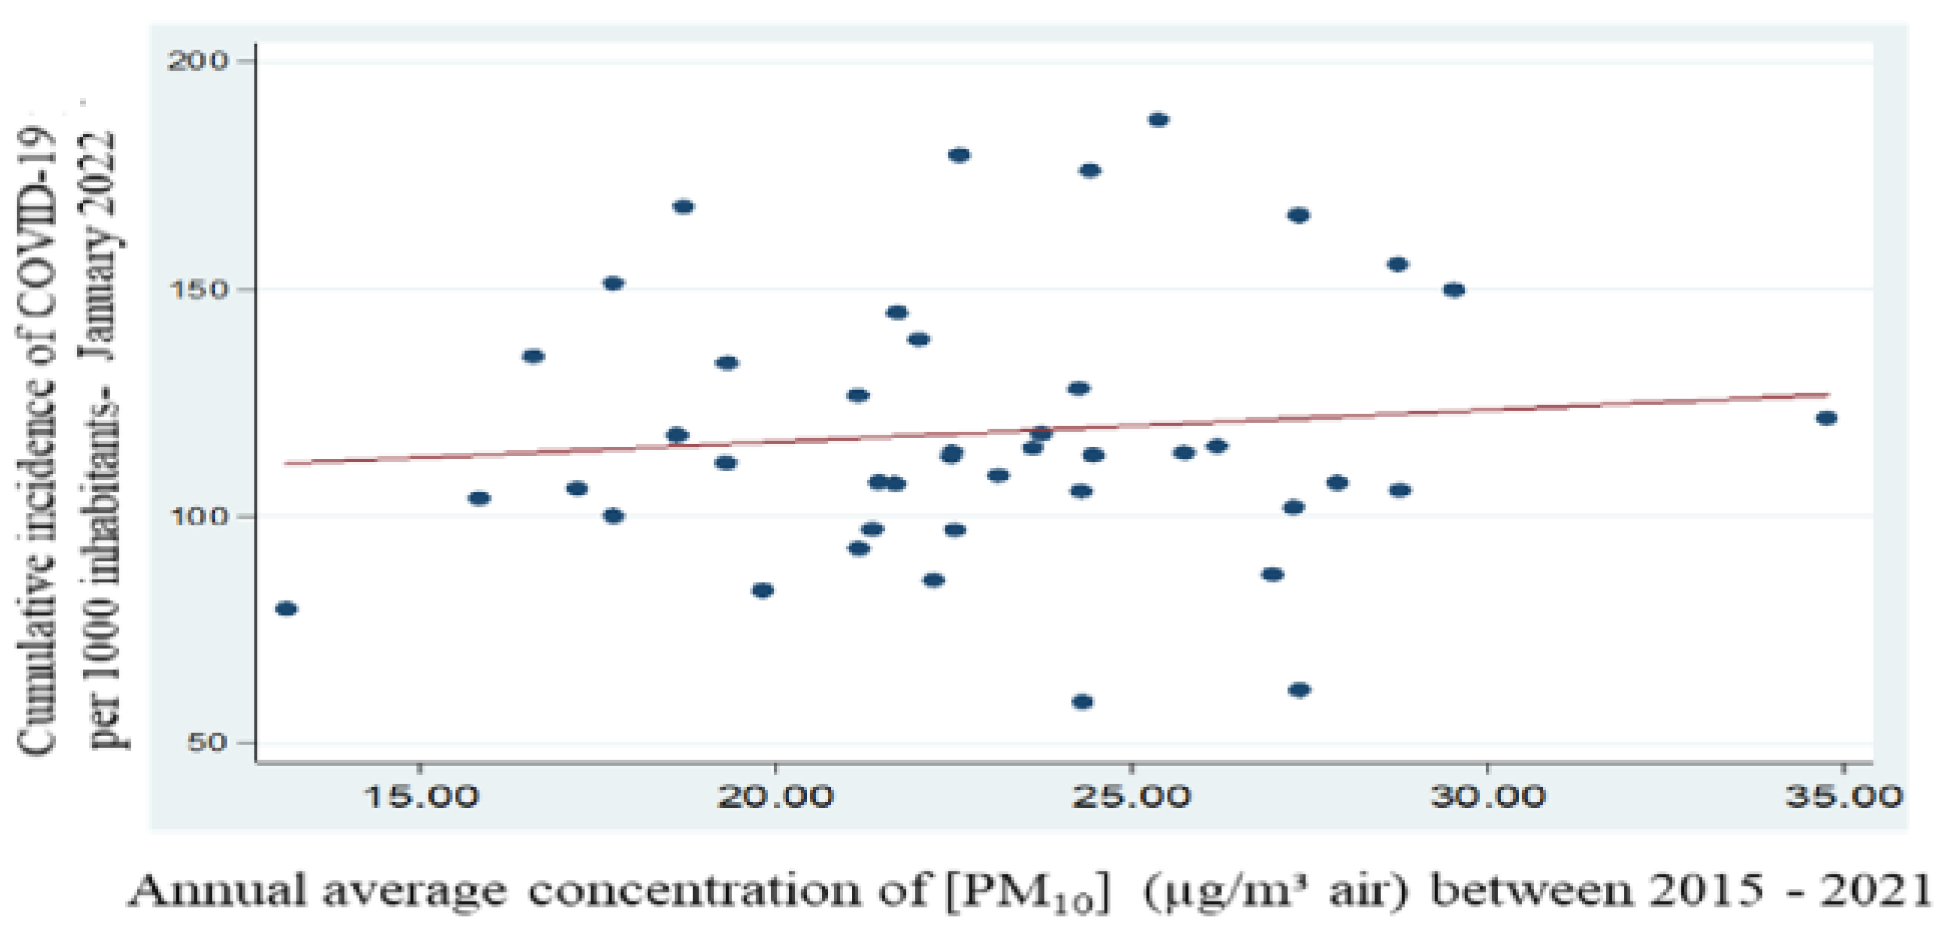
For the period 2015 - 2021, using average values of particulate matter PM
10, collected and reported within the National Air Quality Monitoring System - NAAQS (measurement name: annual values; measurement values: GRA-PM
10), the relationship between the average concentration of PM
10 over a 7-year period and the cumulative incidence of cases per 1 000 inhabitants was investigated [
9,
13]. The Pearson correlation coefficient resulting from the calculations is 0.10 and p=0.52, which indicates a statistically insignificant correlation.
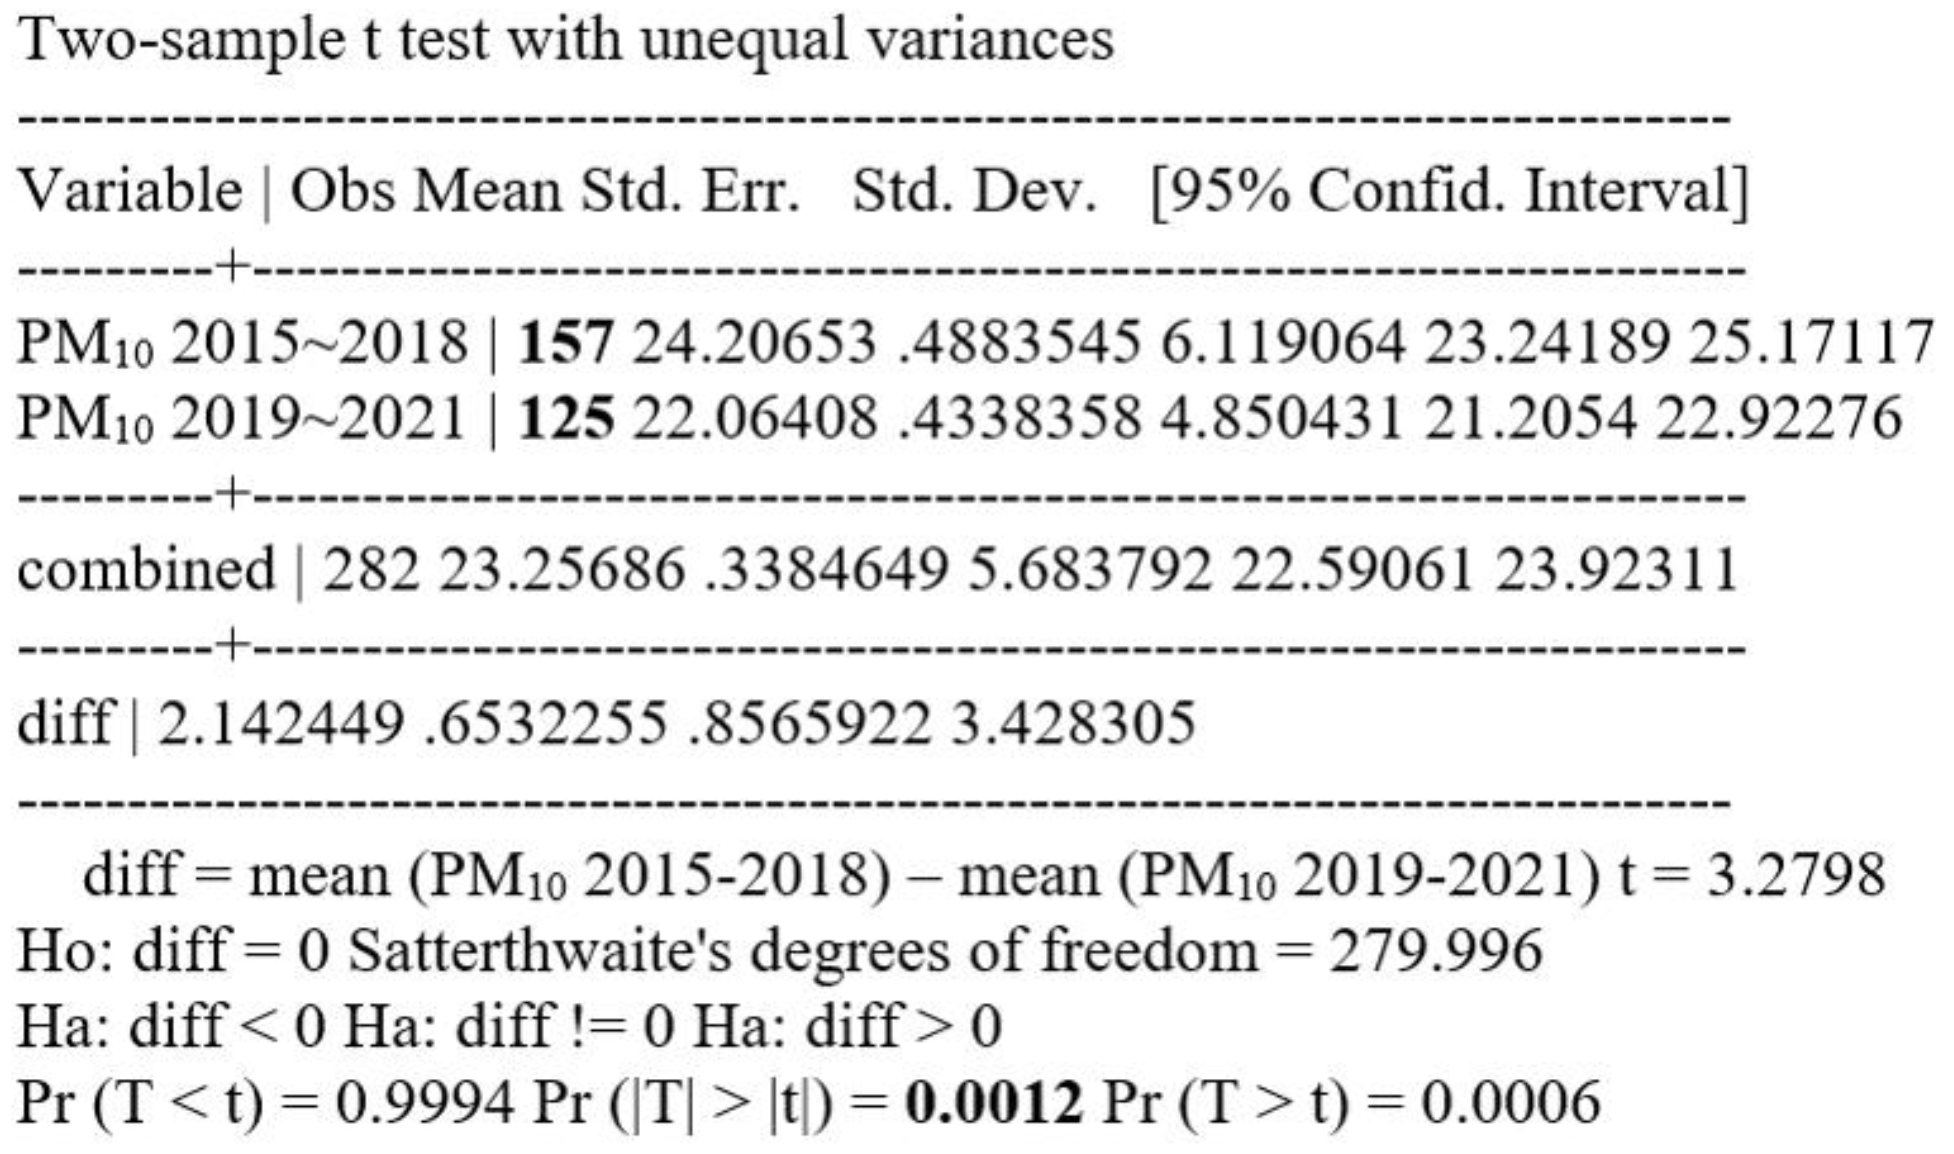
Comparing the mean values of particulate matter PM10 collected and reported from all over the country in the period 2015-2018 (using a string of 157 values) with the mean values of particulate matter PM10 collected and reported from all over the country in the period 2019-2021 (using a string of 125 values), a significant difference in the mean values of PM10 with p=0.001, statistically significant, resulted in a significant difference in the mean values of particulate matters with p=0.001, statistically significant.
Figure 10.
t Test PM10 2015-2018 = PM10 2019-2021, unpaired unequal.
Figure 10.
t Test PM10 2015-2018 = PM10 2019-2021, unpaired unequal.
Using the mean values of PM10 between 2015-2018 (mean concentration value PM10 = 24.17 +/- 0.25) and comparing them with the mean values of PM10 between 2019-2021 (mean concentration value [PM10] = 22.02+/-1.00) they were not found to be statistically significantly different (p=0.06 vs. p=0.05).
Figure 11.
Regression equation between mean concentration of PM10 and cumulative incidence of cases per 1000 inhabitants – period 2015 - 2021.
Figure 11.
Regression equation between mean concentration of PM10 and cumulative incidence of cases per 1000 inhabitants – period 2015 - 2021.
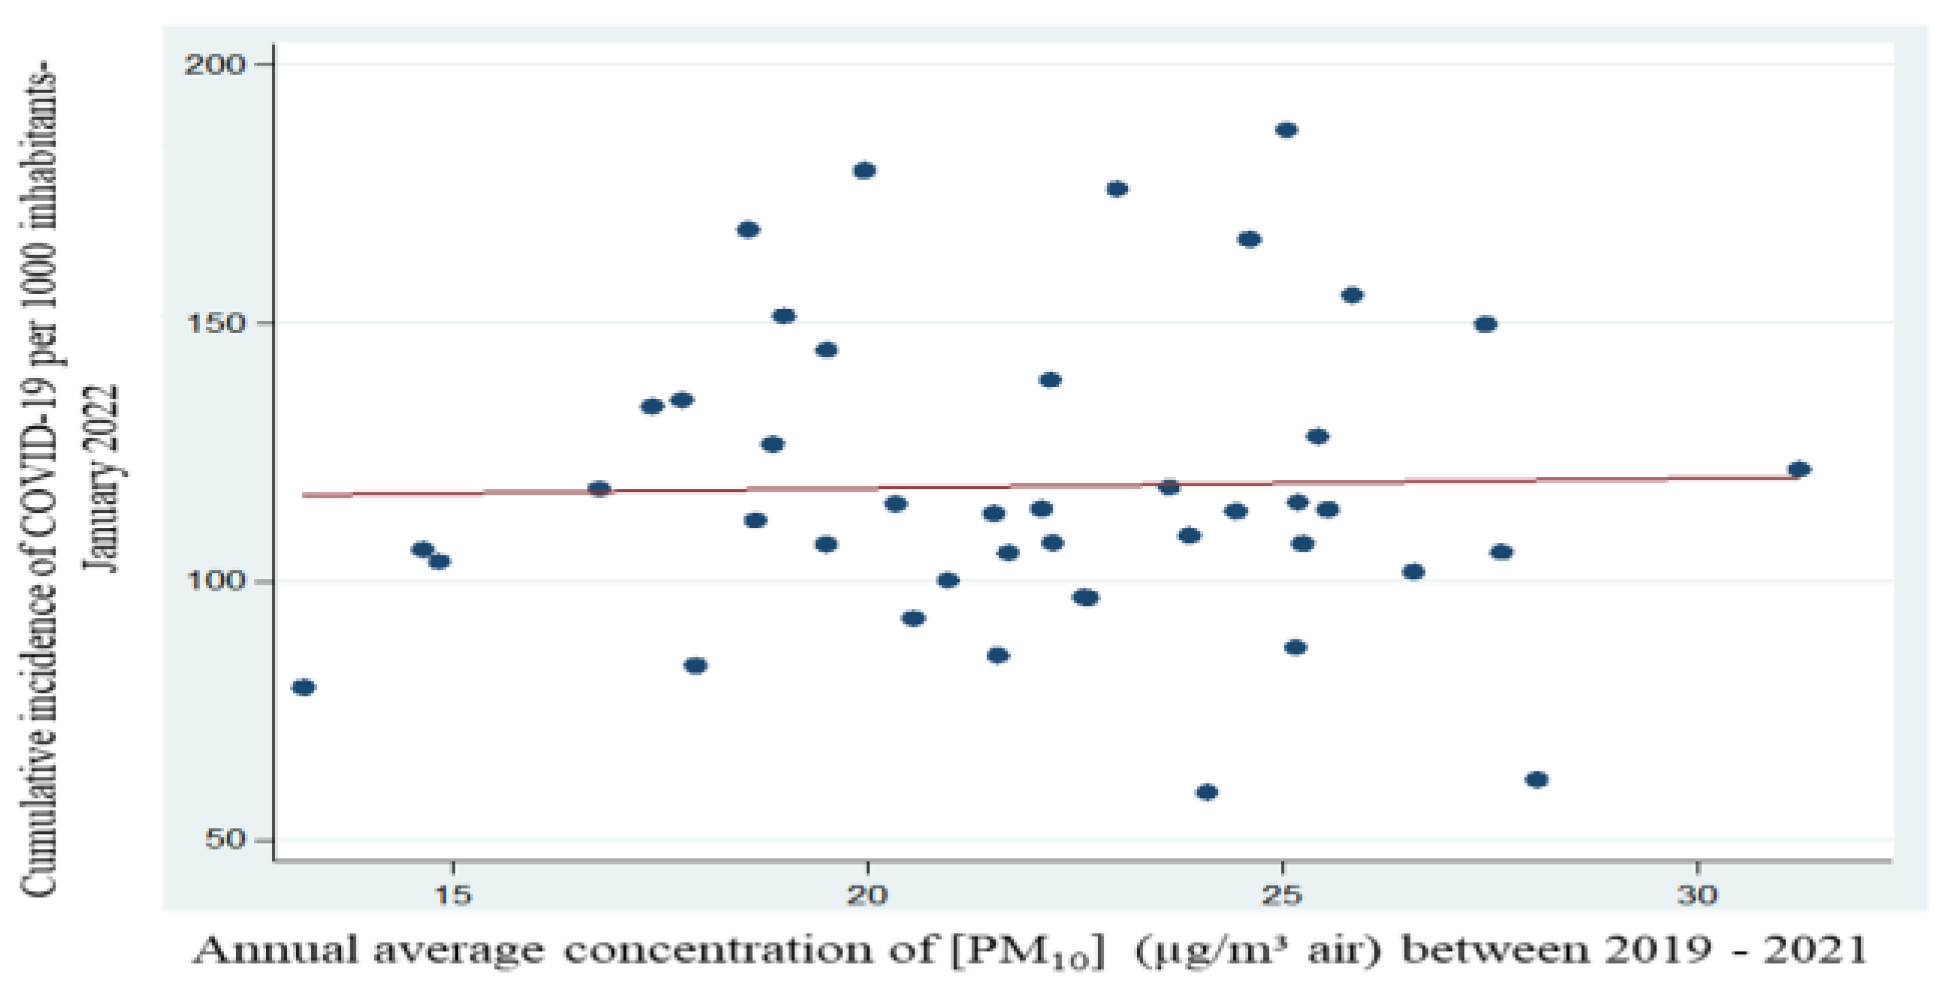
The mean values of PM10 between the years 2019-2021 show us a statistically insignificant correlation (p=0.87), the resulting Pearson Correlation Coefficient has a value of 0.02. Basically, the concentration of particulate matter PM10 between the years 2019-2021 has decreased, but even if not significantly decreased, but it is quite close to being significant. Thus, the COVID-19 incidence, according to the results obtained strictly for this period, we consider that it no longer correlates with the concentration PM10.
Figure 12.
Regression equation between mean concentration of PM10 and cumulative incidence of cases per 1000 inhabitants - period 2019 – 2021.
Figure 12.
Regression equation between mean concentration of PM10 and cumulative incidence of cases per 1000 inhabitants - period 2019 – 2021.
According to data collected and reported at national level, the incidence of COVID-19 increased significantly between September 2020 and January 2022; overlaying the WHO maps of areas of increased air pollution by particulate matter in Europe, areas of increased air pollution by airborne plant pollens and areas of increased incidence of COVID-19 cases, we can see that most of them are overlapping [
1,
2,
3,
4,
5].
The population in these areas, sensitized by long-term exposure to air polluted with particulate matter and aeroallergenic plant pollen, becomes additionally exposed to pollen-virus particles during the pandemic period. In this context, it has been hypothesized that there may be a correlation between population exposure in certain areas to atmospheric air polluted with particulate matter and aeroallergenic plant pollen [
6,
7,
8].
Thus, these were the premises for completing the research with additional data, basically a third objective, when previous exposure of the population to atmospheric air polluted with respirable dust and soil pollution with sedimentable dust could be correlated with an increase in the spread of the viruses (SARS-CoV-2) and a higher number of confirmed cases, there are additional environmental factors - increased atmospheric air temperature and humidity, increased wind speed and change in wind direction, sunlight, increased concentration of CO2 in the atmospheric air (co-risk factors) that may influence the concentration and spread of environmental aeroallergenic plant pollens (common ragweed) as well as viruses (SARS-CoV-2).
In the fall of 2020, when the 2nd wave of the COVID-19 pandemic was in full swing, affecting more and more countries in Europe with record-breaking SARS-CoV-2 infections, this wave overlapped with the common ragweed pollen season in Europe. This was similar for common ragweed pollen in the fall of 2021. In spring - summer 2021, pollen of other aeroallergenic plants was more common in polluted atmospheric air, and rag ragweed pollen was more common from summer.
Role of aeroallergenic plant pollen (common ragweed) in the risk of SARS-CoV-2 viral infection.
Since 2020, a number of results of clinical trials and meta-analyses have been published with completely different results and conclusions on this topic, considering that aeroallergenic plant pollen may increase, decrease or have no effect on the risk of viral infection. There are several hypotheses that have been considered on a possible role of aeroallergenic plant pollen (such as common ragweed) on the risk of viral infections (such as COVID-19, caused by SARS-CoV-2 coronavirus).
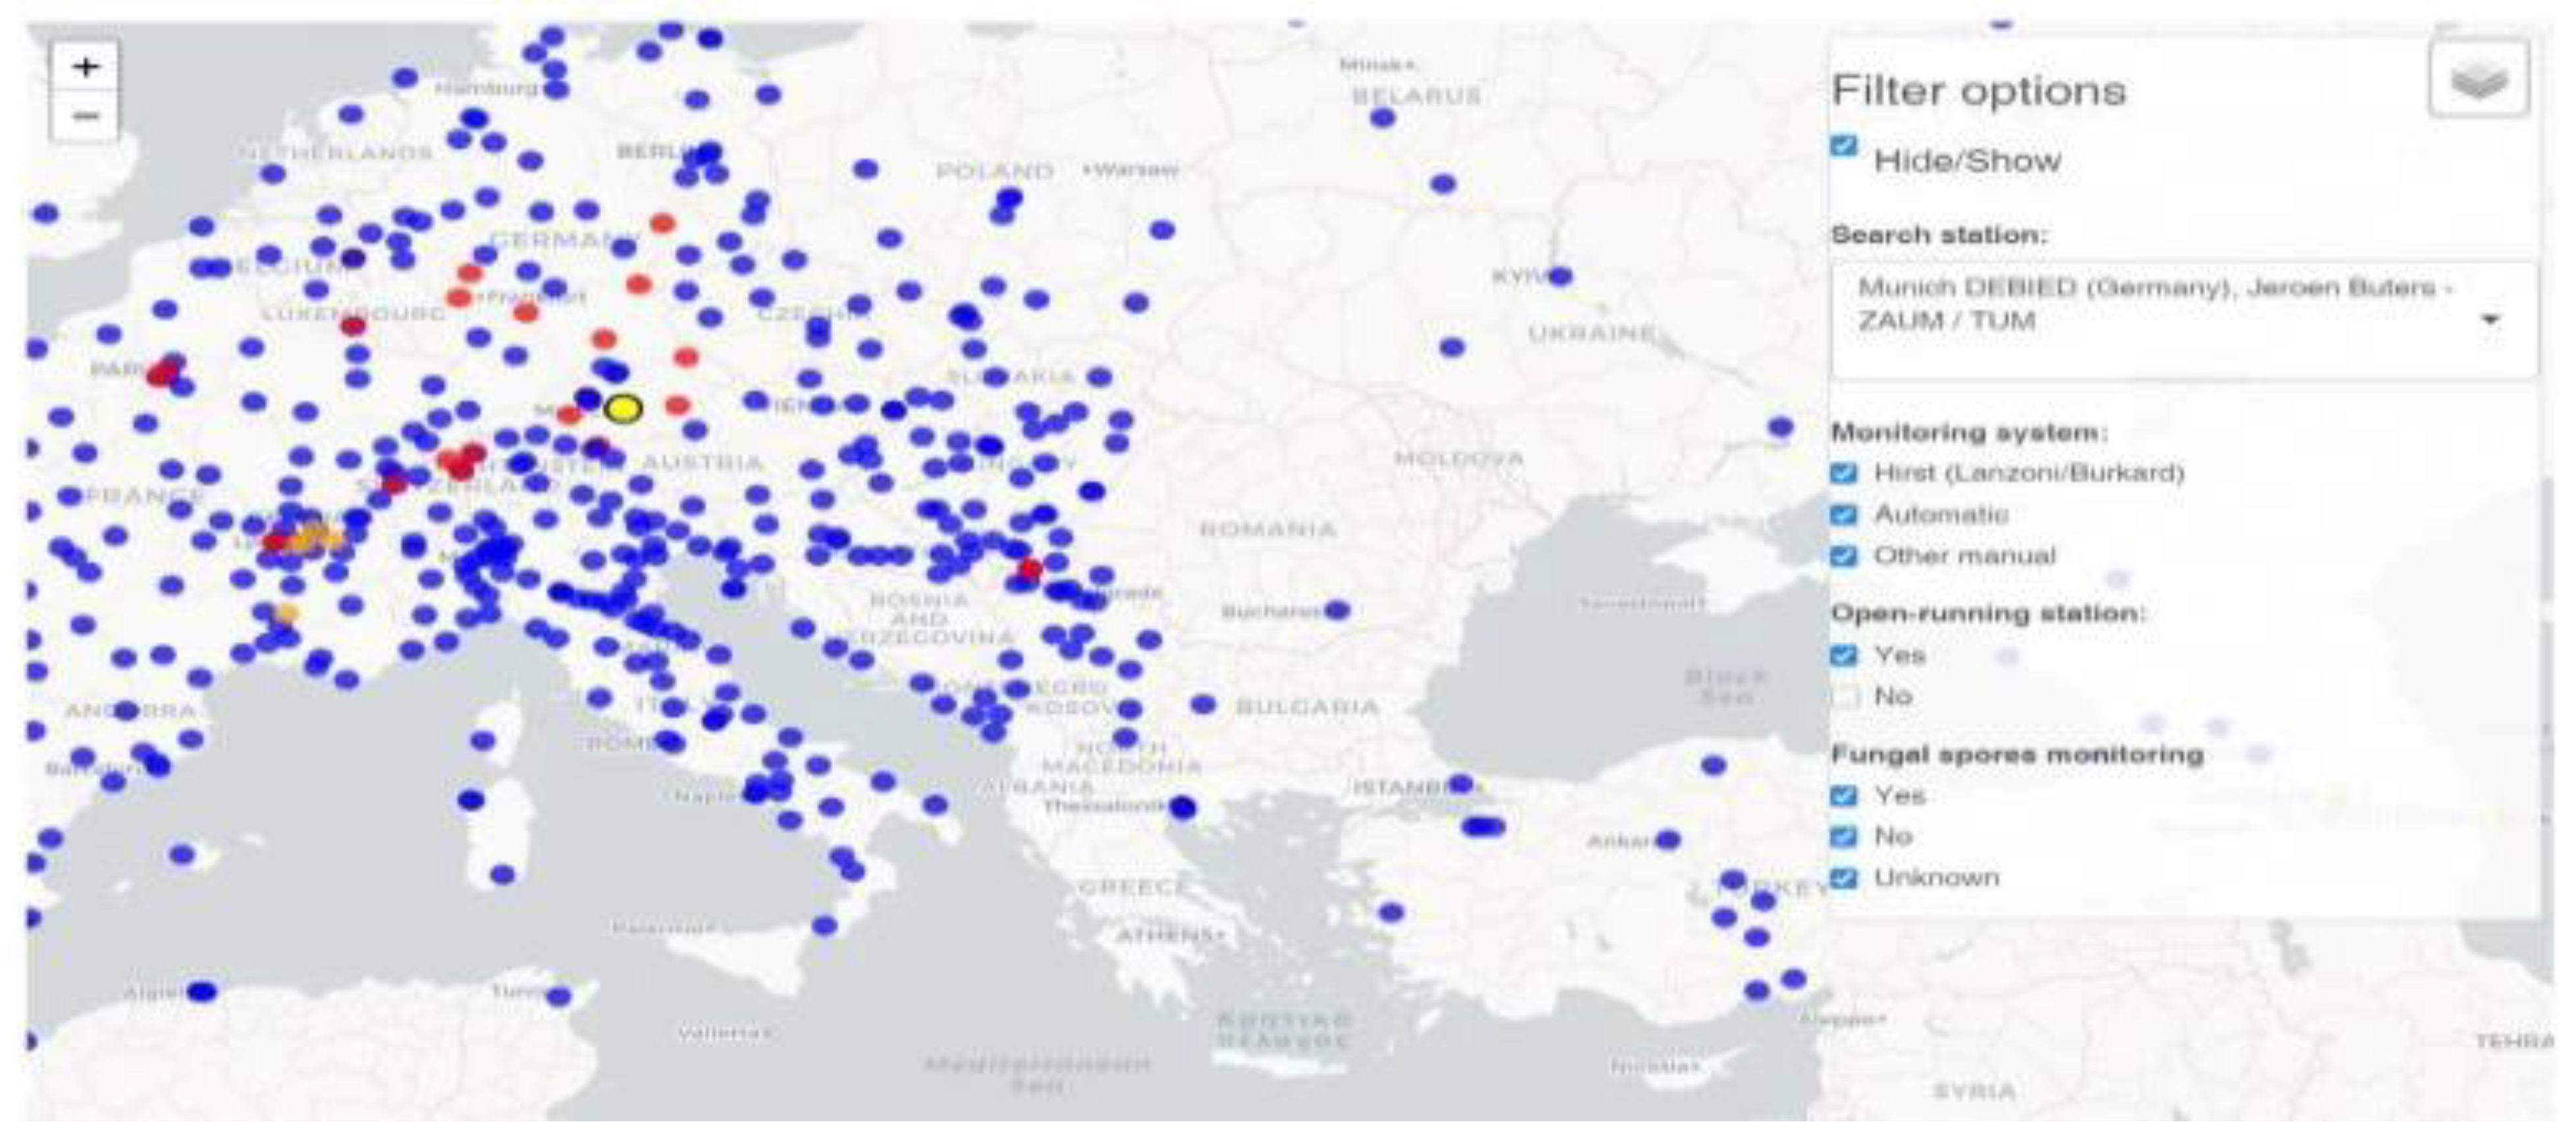
The monitoring of aeroallergenic plant pollens, at European level, is most commonly done using the Air Matters app [
15] (dedicated to allergy sufferers), which in turn uses public data provided by Polleninfo.org, the website of the European Aeroallergen Network (EAN), coordinated by the University of Vienna, a European institution that uses ~400 air monitoring stations globally and only one air monitoring station monitoring air and pollen levels in Bucharest, Romania. "Romania was and still is the only European country that does not have a national system for monitoring and warning the population about air pollen concentrations." The only pollen collector in Bucharest, donated by France. Thus, the information from Air Matters [
15] on monitoring of atmospheric air and pollen levels of aeroallergenic plants in different localities in Romania is extrapolated and not the result of direct measurements (thus, this extrapolation cannot take into account the situation on the ground - for example, in some counties in the country, authorities have reported large fields of common ragweed, which generates high pollen levels in the atmospheric air in those regions and the extrapolated measurements do not indicate the same as on the ground). Unable to use national-level data on aeroallergenic plant pollen concentrations, which could have helped to correlate with the mean concentration of PM
10 over a given time period and the cumulative incidence of COVID-19 cases per 1,000 inhabitants, we studied published European and worldwide data on the possible role of aeroallergenic plant pollen in the risk of SARS-CoV-2 viral infection.
Figure 12.
Air Matters - the application developed by Polleninfo.org, in order to guarantee the accuracy of the data collected and reported, can only be used for monitoring atmospheric air for those European countries where there are sufficient pollen monitoring stations.
Figure 12.
Air Matters - the application developed by Polleninfo.org, in order to guarantee the accuracy of the data collected and reported, can only be used for monitoring atmospheric air for those European countries where there are sufficient pollen monitoring stations.
In most European countries, the main pollen season, which covers the pollen release of different plant species, spans ~6 months from spring to fall, with geographical differences depending on climate and vegetation [
16]. The European Academy of Allergy and Clinical Immunology (EAACI) defines the beginning of the pollen season for different species on the basis of pollen concentrations in the atmospheric air that affect human health.
The risk of an allergic reaction in the human body depends on the concentration of pollen in the atmospheric air. However, the number of allergens released by a pollen grain (reflected as the "allergenic potency of pollen") can vary depending on region, season, pollutants in the atmospheric air, atmospheric air temperature and humidity, and storm periods [
17]. In addition to aeroallergens, pollen sources also release a wide variety of bioactive substances (including sugars and lipids), which when inhaled can stimulate allergic reactions and cause the severity of allergic reaction to the pollen of aeroallergenic plants (so-called "pollen allergy") [
18]. Exposure to the pollen of aeroallergenic plants can also cause inflammation of the mucous membranes of the airways, thus increasing the likelihood of respiratory infections, even in non-allergic individuals [
19].
In addition to the exposure of the population to aeroallergenic plant pollen, it is important to study the type of pollen and the dispersal of pollen grains and the viruses that can attach to them. In addition, the allergenicity of certain species of aeroallergenic plant pollens may be accentuated or enhanced by environmental factors such as air pollutants. The physical transportation of pollen grains over shorter or longer distances under the influence of atmospheric factors (atmospheric air temperature and humidity, wind speed and direction, sunlight, concentration of CO
2 in the atmospheric air, etc.), but also possible changes in the biological effectiveness of pollen-virus particles during the dispersal period are important [
20,
21,
22,
23].
Researchers, after obtaining different results on the role of pollen from aeroallergenic plants (such as common ragweed) on the risk of viral infection, investigated whether the type of pollen of aeroallergenic plants is important and whether it can affect whether or not the virus attaches to pollen grains. The amount of virus that can attach to a single pollen grain was also investigated, with a subsequent effect on the risk of virus infection. The viability and viral load required for the transfer of virus infection are important [
24].
There are researchers who believe that "particles adhering to pollen grains could interact with aeroallergens and absorb proteins from the pollen grains, thus favoring their dispersion into the respirable fraction of airborne particles in the atmospheric air" [
25].
Figure 1.
Mode of action of airborne pollen-virus particles on the human body and determination of SARS-CoV-2 coronavirus (COVID-19) infection.
Figure 1.
Mode of action of airborne pollen-virus particles on the human body and determination of SARS-CoV-2 coronavirus (COVID-19) infection.
Discussions
Studies over the years [
20,
21,
22,
23] have shown that a virus can survive in suspended aerosol-like particles in the atmospheric air for several hours and on their surface for up to several days or weeks, while retaining its infectious potential. In experimental studies over the last 4 years, the association of pollen particles with viruses has been examined, either by considering the possible presence of the virus inside the pollen grain (where it can penetrate) or by considering the possible binding of the virus to the outer surface of the pollen grain, where the viruses can remain lodged and persist for hours, days or weeks in the atmospheric air.
It is believed that viruses can be transported by aerosol-like suspended particles in the atmospheric air, together with pollen grains, over shorter or longer distances, depending on the climatic conditions that favor this [
26,
27]. But pollen grains can undergo physical and biochemical changes during transportation. The researchers concluded that harsh environmental conditions (e.g. very low temperatures and sunlight, including UV radiation) can greatly reduce the viability of pollen-virus particles and reduce the time they persist in the environment, limiting the distances over which they can reach a viable state so that they can transmit respiratory diseases [
28].
Some researchers have looked at the association between pollen-virus particles and their long-range transport/dispersal, which is thought to be the way in which both allergic and viral respiratory diseases spread more rapidly.
In an epidemiologic study, conducted in 2021, the potential impact of atmospheric air pressure, wind speed as well as wind direction (by changing local and regional patterns) on the spread of SARS-CoV-2 coronavirus was examined. The results of the study reported a positive correlation between the rapid spread of SARS-CoV-2 coronavirus, the increase in the number of new cases and transmission rates of COVID-19 in overcrowded urban areas and the change in wind speed/direction [
29]. Therefore, it is possible that the change in wind speed/direction may act as a co-factor in the spread of pollen-virus particles, with pollen behaving as a carrier for viruses (including SARS-CoV-2) [
29]. In another similar study, results were obtained that found no significant correlation between the change in wind speed/direction and the COVID-19 outbreak [
30].
The change in atmospheric air quality by increasing concentrations of CO
2 (higher increases of CO
2 in urban areas during the daytime compared to rural areas are described in the literature), the increase in atmospheric air temperature (predominantly in urban areas compared to rural areas) was accompanied by, over time, aeroallergenic plants have also undergone changes (under the influence of the increase in CO
2 concentration in the atmospheric air, they grow in a shorter period of time, have a different structure - they are more vigorous and much taller, and are therefore also much more difficult to eradicate) [
31,
32].
It also increases the duration of pollen periods and pollen production (by up to 115% in urban areas and up to 60% in rural areas just by doubling the concentration of CO
2 in the atmospheric air), but also increases the allergenic potency of the pollen in question (especially in heavily anthropized areas), leading to a significant increase in the severity and prevalence of allergic respiratory diseases (allergic rhinitis, bronchial asthma), especially in urban areas [
31,
32].
According to studies conducted so far, the increase in global average ambient air temperature at the earth’s surface is considered to be directly related to the increased allergenicity of plants. In a warm and dry climate, under the influence of increased CO
2 concentration in the atmospheric air, the pollen season starts earlier and the peak periods of pollination move earlier in the calendar. It has also been found that aeroallergenic plants in urban areas have an earlier flowering period by a few days (on average 4 days) compared to the flowering period in rural areas [
31,
32].
However, some researchers have not found a consistent correlation between rising atmospheric air temperatures and COVID-19 outbreaks in urban areas [
33,
34]. Studies have shown a direct link between increased atmospheric air humidity and precipitation (heavy rainfall), which contribute to increased proliferation of aeroallergenic plants (such as common ragweed), exacerbation of bronchial asthma attacks and hospitalizations.
The decrease in atmospheric air humidity associated with high temperatures, under the influence of changes in wind speed and direction, may act as a co-factor in the spread of pollen grains. However, no consistent correlation between changes in atmospheric air humidity and COVID-19 outbreaks in urban areas has been found in the studies [
29,
30].
Researchers have reported a positive correlation between increased rainfall (heavy rainfall) and SARS-CoV-2 coronavirus transmission, reporting an increase of 56 new cases of COVID-19 per day for every one-centimeter increase in rainfall per day [
29].
Another study, conducted in Italy, also found a positive correlation between increased precipitation (heavy rainfall) and SARS-CoV-2 coronavirus transmission. However, two other studies, carried out in 2020, did not report a significant correlation between increased COVID-19 incidence per day and increased rainfall in the respective urban areas [
35,
36].
In other studies, researchers have also observed seasonality in the occurrence of influenza epidemics, which was also fully confirmed in COVID-19: the first influenza wave produced by SARS-CoV-2 coronavirus was shorter in duration, followed by multi-seasonal waves. Thus, the circulation patterns of influenza epidemics started and predominated during winters in the northern hemisphere, migrating in spring (April-May) to the southern hemisphere, returning to the northern hemisphere in the fall or the following winter and then following the cycle described above [
37].
In Romania, in the Municipality of Bucharest, in 2023, a large epidemiological study was carried out performing a complex statistical analysis (with data provided by websites for the period February 26, 2020 - March 31, 2022, when the 5 waves of COVID-19 were recorded), suggesting that exposure to high levels of suspended particulate matter, respectively PM
2,5 and PM
10, in atmospheric air, as potential carriers of SARS-CoV-2 coronavirus, could increase the transmission and severity of COVID-19 infection (through aerosol clusters, which can affect the integrity of the upper and lower respiratory tract, forming condensation nuclei to which SARS-CoV-2 coronavirus can attach) [
38].
Basically, SARS-CoV-2 is reported to spread by air and over long distances. The researchers concluded that the inactivation of this viral transmission via airborne particulate matter PM
10 in the atmospheric air can be achieved under the influence of meteorological conditions - atmospheric air temperature and humidity, atmospheric pressure, average wind speed and direction, solar radiation - for Bucharest. The exposure of the population in the area to elevated levels of particulate matter PM
2,5 and PM
10 in the atmospheric air was positively correlated with the incidence and mortality caused by COVID-19 infection [
38].
Researchers consider the variability of the concentrations of suspended particulate matter PM
2,5 and PM
10 as an important indicator of the degree of air pollution in large cities (such as Bucharest). In the study, the value of the derived mean ratio [PM
2,5/PM
10] is used to quantify the ability of respirable particles to affect human health post-exposure on the one hand and atmospheric processes on the other hand; if its value is <0.5, fine suspended particles in atmospheric air are considered to have stronger negative effects on human health than coarse suspended particles, which subsequently settle to the soil [
38].
SARS-CoV-2 infection is thought to spread more easily during the colder months of the year. The researchers, analyzing the investigated climatic variables, showed that a change in the relative humidity of atmospheric air can lead to an increase in the spread of respirable particles in the atmospheric air and that a sudden change in the atmospheric air temperature can activate COVID-19 infection in the temperate climate of Bucharest.
Another conclusion of the study was that severe haze episodes have a significant negative impact on SARS-CoV-2 virus transmission and human health related to fall/winter atmospheric inversions (reflecting synergistic effects caused by interactions between local and regional air masses, atmospheric physico-chemical processes, anthropogenic factors - emissions and viral transport via airborne respirable suspended particulate matter PM
10) [
38].
This study demonstrated the harmful effects of atmospheric particulate matter and sedimentable particulate matter at ground level on the incidence and lethality of COVID-19 in Bucharest, the result being in agreement with previous studies [
39,
40,
41]. Researchers considered that respirable and sedimentable particulate matter can be considered as a vector for SARS-CoV-2 coronavirus in large cities [
38].
- a)
Aeroallergenic plant pollens may increase the risk of SARS-CoV-2 viral infection
In the spring of 2020, when the COVID-19 pandemic was announced worldwide, it was tree pollen season in the northern hemisphere. Based on the number of reported cases in those areas, the variability in infection rates from day to day, and the total number of positive tests, a team from the Chair of Medicine at the Technical University of Munich, Germany, studied whether there could be a demonstrable causal relationship between the increase in airborne pollen during that period and SARS-CoV-2 infestation, considering that "airborne pollen weakens the immune response of the human body and may be a significant environmental factor influencing viral infection rates by acting as a carrier" [
42].
The researchers used data from 5 continents in 31 countries. The researchers concluded that "airborne pollen can explain, on average, 44% of the variation in SARS-CoV-2 infection rates". According to the results of the study, the variation in infection rates was also influenced by co-factors such as meteorological conditions (changes in atmospheric air humidity associated with higher-than-average annual temperatures in the areas concerned) [
42].
The types of containment chosen in the study countries (early containment, late containment, no containment) were also followed during the study. The research team found that "during intervals with no containment regulations, infection rates were on average 4% higher per 100 pollen grains/m³/day increase". They also looked at the daily variability in the number of new cases diagnosed in some German cities, correlated with increasing pollen grains/m³air/day and found that "infection rates were 20% higher when an increase of up to 500 pollen grains/m³air/day occurred" [
42].
The researchers believe that if the concentration of pollen grains in the air increases and they are inhaled together with virus particles (in the form of pollen-virus particles), fewer antiviral interferons will be generated and the inflammatory response will be impaired, especially in people with allergies, allergic rhinitis or bronchial asthma, compared to people in apparent good health. The authors cautiously conclude that "environmental factors, which also include pollen particles in atmospheric air, may be responsible for part of the upward shift in the number of SARS-CoV-2 viral infections in the spring of 2020." However, the results of the epidemiologic study do not fully clarify the exact correlation between cause and effect, and the question of the causal relationship between airborne pollen particles and the increase in the number of SARS-CoV-2 viral infections remains [
42].
Researchers in the Netherlands in 2022 conducted similar research and investigated whether environmental conditions (including increased daily pollen concentrations, incidence of allergic rhinitis, increased temperature, changes in humidity, exposure to solar radiation, etc.) and mobility trends correlated with seasonality of influenza illness could also explain the seasonality of COVID-19 in the Netherlands. In this study a mean number of 69.2 pollen grains/m
3 air/day was considered, but daily pollen concentrations were not included in the combined model [
43].
The researchers used an inverse linear regression model and showed that the combined pattern of increased incidence of allergic rhinitis (moderately to highly correlated pollen and allergic rhinitis), increased atmospheric air temperature, exposure to solar radiation and exposure of people to indoor recreation could be directly related to 87.5% of the variation in COVID-19 reproduction number (Rt) [
43].
If data on increased pollen concentrations had also been used in this study, the authors would have obtained similar results to the German study, 2020. Even with this result, the findings from both studies suggest that "environmental factors (increased pollen concentrations, increased air temperature and changes in air humidity), could act together and explain susceptibility to SARS-CoV-2 coronavirus infection" [
42,
43].
In addition to the risk of infection, atmospheric air temperature and humidity influence pollen maturation, bioaerosol formation and flowering, so it is imperative to consider these factors when assessing the association between pollen and the risk of COVID-19 [
42,
43].
The Lombardy area (which includes the city of Milan) in northern Italy is most affected by atmospheric air pollution, influenced by long-distance transportation of air pollutants as well as seasonal pollution with pollen from aeroallergenic plants (common ragweed) - according to locally reported data. Basically, this increase in atmospheric air pollution in Italy, especially in the northern Lombardy area, has led to further investigations on the possible mechanisms of SARS-CoV-2 virus diffusion in atmospheric air, using as vector particulate matter, of the type PM
2,5 and PM
10 [
44,
45].
In 2020, in the Lombardy area, the incidence of COVID-19 was the highest in the whole country. At the end of a study, carried out in 2020 in this area, researchers reported the presence of SARS-CoV-2 on the surface of suspended particulate matter in atmospheric air, under conditions of strong atmospheric stability, as well as at concentrations of PM
2,5 and PM
10 in the atmospheric air exceeding the maximum concentrations allowed under current legislation. Thus, the researchers suggest that "concentrations of PM
10 particulate matter can be used as an indicator of a high potential for SARS-CoV-2 infection" [
44,
45].
Also, was confirmed the presence of SARS-CoV-2 RNA on the surface of PM
2,5 and PM
10 in the atmospheric air in northern Italian cities, with experimental evidence, at the peak of the COVID-19 pandemic. Thus, suggesting at the end of the study that SARS-CoV-2 RNA could coagulate with particulate matters in atmospheric air and increase the longevity of SARS-CoV-2 in the atmosphere [
44,
45].
The researchers concluded that SARS-CoV-2 can find suitable transport vectors among PM
2,5 and PM
10 in the atmospheric air and increases susceptibility to viral infections. According to the study, the highest average number of people infected with SARS-CoV-2 was found in cities in northern Italy where the highest concentrations of particulate matter PM
10 in the atmospheric air had previously been reported, exceeding - for more than 100 days - the maximum allowable concentration set by European Union legislation. At the same time, the lowest average number of people infected with SARS-CoV-2 was found in cities with less than 100 days concentrations of particulate matter PM
10 in the atmospheric air. Thus, the researchers believe that "SARS-CoV-2 may use a type of ‘highway’ composed of airborne particulate matter in the atmospheric air, which enhances its indirect transport" [
44,
45].
It is thus considered that the presence of SARS-CoV-2 virus on the surface of airborne particulate matter could be a potential early indicator of COVID-19 infection and could enhance the transmission of SARS-CoV-2 virus through atmospheric air; of the airborne particulate matter in the atmosphere, the researchers consider that PM
2,5 is strongly associated with the risk of COVID-19 infection [
46].
Also in Italy, in another study carried out in 2020, researchers reported areas in northern Italy as having the highest concentrations of PM
10 and PM
2,5, as well as an increase in the number of cases in these areas (mostly people affected by COVID-19) due to the much faster diffusion of SARS-CoV-2 in the atmospheric air in this area [
47].
Researchers, in another study in Italy, have determined the key role of air pollution by airborne particulate matter, such as PM
2,5 and PM
10, in the transmission dynamics of COVID-19. At the end of the study, the researchers reported that "the rapid and global spread of COVID-19 infection may be associated with days when the maximum allowable concentration of PM
10 particulate matter in the atmospheric air is higher than the daily threshold value of 50 μg/m
3 air, set by European Union legislation" [
48].
- b)
Aeroallergenic plant pollen may lower the risk of SARS-CoV-2 viral infection
Results from other studies suggest that pollen from aeroallergenic plants may act as an inhibitory factor for viral infections [
31] and decrease the number of SARS-CoV-2 viral infections (by decreasing ACE2 in the epithelial cells of the upper and lower airways), regardless of the severity of the condition (allergic rhinitis or bronchial asthma) [
32].Thus, these researchers believe that airborne pollen particles end up protecting people with allergic respiratory diseases (allergic rhinitis and bronchial asthma) against COVID-19.
In another epidemiologic study of the adults diagnosed with a mild form of bronchial asthma who were not receiving control treatment, after exposure to common ragweed pollen particles in the atmospheric air, there was a decrease in ACE2 in the cells of the epithelium of the lower airways. However, other factors (such as the Toll-like-4 receptor, which may bind to the SARs-CoV-2 spike protein with a higher affinity than ACE2) that may have influenced the decreased risk of SARS-CoV-2 viral infection need to be investigated [
40].
In another study, conducted in the Netherlands from 2016-2020, it was concluded that "exposure to pollen from aeroallergenic plants was inversely correlated with the risk of influenza infection" [
31]. This study tested the seasonality of the timing of the occurrence of viral respiratory illness (influenza and other influenza-like illnesses) in direct correlation with periods of increasing pollen concentrations, atmospheric air temperature and solar radiation threshold (as environmental factors that might influence the occurrence of viral respiratory illness).
The study period also overlapped with the first year of the COVID-19 pandemic (2020), and the Dutch researchers suggested that "exposure to aeroallergenic plant pollen might be protective against SARS-CoV-2 viral infection" [
30]. At the end of another epidemiologic study conducted, the researchers concluded that "aeroallergenic plant pollen was able to increase protection against viruses, irrespective of the allergy status of the individuals concerned" [
38].
These researchers considered that "pollen particles are independent, discrete factors that may be involved in decreasing or inhibiting the incidence of viral respiratory diseases, including COVID-19". They also set a threshold value for aeroallergenic plant pollen grains (≥100 pollen grains/m³ air/week, while first symptoms may occur in the range of 1-50 pollen grains/m³ air/week), this threshold representing both early and late periods in the life cycles of moderate influenza epidemics (including COVID-19).
Researchers also found that an increase in atmospheric air temperature only influenced early pollen flowering, but had no predictive value for the incidence and seasonality of influenza or influenza-like epidemics. Solar radiation (exposure to UV light) acted as a co-inhibitor, by immuno-activation, protecting together with aeroallergenic plant pollen against respiratory viral diseases. A composite variable (total pollen, allergenic pollen, solar radiation) was found to be a useful predictor of the incidence and seasonality of influenza seasons.
At the end of another epidemiologic study, researchers concluded that "aeroallergenic plant pollen was able to increase protection against viruses, irrespective of the allergic status of the individuals concerned".
In Italy, in the Lombardy area (e.g. Brescia and Bergamo) and Piedmont (on the border with Switzerland and France), a first study was carried out analyzing the link between exposure to air polluted with particulate matter PM
10 (which exceeded, for several days, the maximum permissible concentration of 50µg/m³ air) based on the idea that "respirable airborne particles act as a virus carrier" (mechanism of airborne transmission of the virus) and the initial increase in the number of cases in these areas due to the much more rapid spread of COVID-19 [
49,
50].
During the study period, the cities in the Piedmont area (the cities of Torino and Alessandria) reported (according to the Environmental Protection Agency of Lombardy - "ARPA Lombardia", which collected the data from both areas) the most severe PM10 pollution events compared to the pollution events recorded, during the same period, in the cities in the Lombardy area.
According to the results of the study, they showed a lower number of cases of SARS-CoV-2 coronavirus viral infections detected (compared to the Lombardy area - the cities of Brescia and Bergamo) in the 20 days preceding the medical crisis in this area. By contrast, in the Lombardia area (city of Bergamo), where the maximum allowable concentration for particulate matter PM
10, 50µg/m³ air was exceeded only a few times, a much higher number of SARS-CoV-2 coronavirus viral infections was detected [
49].
In practice, the results of this study did not allow a correlation to be established between the mechanisms of SARS-CoV-2 virus diffusion in the atmospheric air and the increased concentrations of particulate matter PM
10 used as a vector, leading to an invalid assessment of the risk to human health. From the data collected and reported at the end of the study, it was considered that the contagious area was considered to have spread in the (preferentially) proximal areas of the cities in northern Italy (Lombardia and Piemonte areas) [
49].