Next Article in Journal
Survival Prognostic Factors and Molecular Aspects in Extremity Soft Tissue Sarcoma
Previous Article in Journal
Artificial Intelligence and Liver Transplantation; Literature Review
 
 
Journal of Mind and Medical Sciences is published by MDPI from Volume 12 Issue 1 (2025). Previous articles were published by another publisher in Open Access under a CC-BY (or CC-BY-NC-ND) licence, and they are hosted by MDPI on mdpi.com as a courtesy and upon agreement with Valparaiso University (ValpoScholar).
Article

Telomeres Are Shorter in Portuguese Obese Adults

by
Catarina Duarte
1,†,
Maria Teresa Braz
2,†,
Ana Marques-Ramos
3,
José Silva-Nunes
3,4,
Luisa Veiga
3 and
Miguel Brito
3,*
1
IPOLFG—Instituto Português de Oncologia de Lisboa Francisco Gentil, Lisboa, Portugal
2
Instituto Superior Técnico, Universidade de Lisboa, Lisboa, Portugal
3
H&TRC-Health & Technology Research Center, ESTeSL—Escola Superior de Tecnologia da Saúde, Instituto Politécnico de Lisboa, Lisboa, Portugal
4
NOVA Medical School, Universidade Nova de Lisboa, Lisboa, Portugal
*
Author to whom correspondence should be addressed.
These authors contributed equally to this work.
J. Mind Med. Sci. 2024, 11(2), 381-387; https://doi.org/10.22543/2392-7674.1483
Submission received: 5 February 2024 / Revised: 5 March 2024 / Accepted: 17 August 2024 / Published: 31 October 2024

Abstract

:
Obesity is a clinical condition characterized by an abnormal accumulation of adipose tissue with an increased risk of developing illnesses such as type 2 diabetes, cardiovascular disease, and cancer. In obesity, the secretion of proinflammatory adipokines contributes to oxidative stress that can lead to a decline in the length of telomeres. Telomeres are structures of repetitive sequences delimiting the chromosomes, that plays a crucial role in maintaining their integrity and stability and, thus, its shortening is associated with cellular senescence and possible apoptosis. Although some studies indicate that obesity is associated with shorter telomeres, others contradict this data. Accordingly, the aim of our study was to determine whether obesity is associated with telomere shortening in Portuguese obese adults. For that, we collected buccal epithelial cells from 72 obese (Body Mass Index (BMI) greater than 30 kg/m2) and 74 norm weight individuals (BMI between 18.5 kg/m2 and 24.99 kg/m2) and determine telomere length through Real Time PCR. Results revealed that the relative telomere length of obese individuals is statistically significantly shorter than that of control non-obese group. By comparing obese subgroups, it was possible to observe that in the female subgroup the relative length of telomeres was shorter, in opposition to the male obese group, which indicates that the association between high BMI and shorter telomeres is genre- dependent. Furthermore, by studying the telomere length by age it was observed that there was no difference in the relative telomere length in obese under versus over 45 years old, demonstrating an age-independent association between obesity and telomere length. Accordingly, our results suggest that obesity is associated with telomeres shortening, and that this could be used as biomarker in obesity.

Introduction

Since 1975, obesity has nearly tripled globally, and 38% of the world population are already overweight or obese [1]. Obesity is defined as abnormal or excessive fat accumulation that presents a risk to health and is the main risk factor for several chronic diseases, including diabetes, cardiovascular diseases and various types of cancer [2]. This excessive fat results from successive positive energy balance when the amount of energy consumed is greater than the amount of energy spent [3]. In order to classify obesity, the World Health Organization uses Body Mass Index (BMI), an index that classifies the adult body according to the individual’s weight divided by the square of the height [3]. Thus, individuals can be classified into different groups according to their BMI: low weight - ≤ 18.5 kg/m2; normal weight - 18.5 kg/m2 to 24.9 kg/m2; overweight – 25 kg/m2 to 29.9 kg/m2; obesity class I - 30 kg/m2 to 34.9 kg/m2; obesity class II – 35 kg/m2 to 39.9 kg/m2 and obesity class III - ≥ 40 kg/m2. The intentional weight loss, when maintained on long-term, manifests itself in an improved quality of life, reduced incidence of chronic diseases and mortality [3].
In addition to all the consequences of this chronic disease, several studies have indicated that there is a bidirectional association between telomere length and obesity [4,5]. Telomeres are structures comprised by repetitive sequences of double stranded DNA rich in guanine (TTAGGG) delimiting the chromosomes of eukaryotic cells, that plays a crucial role in maintaining their integrity and stability [6,7]. Telomere length, of around 9 to 15 kb, is maintained by telomerase, a ribonucleoprotein polymerase with multiple subunits, with a catalytic unit called reverse transcriptase which is normally not expressed in somatic cells, in opposition to germ cells and neoplastic tissues [5,8]. In each cell division, there is a loss of some of these repeating units due to incomplete replication at the 3’ end of chromosomes, which leads to its shortening. If reaching a critical threshold, the chromosomes become unstable which may induce cellular senescence that, in turn, may lead to apoptosis. In cells in which telomerase is present, this loss is balanced by adding a few repetitions after DNA replication [6,9]. Thus, telomere length is defined as a marker of biological aging, that results both from a natural process after each cell division and factors such as longevity, frequency of physical activity, cardiovascular disease, and others [4,5,10]. The association between telomere length and obesity is not well understood, but it is known that inflammation and oxidative stress caused by obesity can induce telomere shortening [5,11]. The meta- analysis of Mundstock et al. (2015), which comprised 119.439 subjects, showed that the higher the BMI the lower the length of telomeres [12]. Of the 63 studies selected by the authors, there were no statistically significant association between obesity and telomere length in 38%, but the remaining 62% of studies demonstrated a significant statistically association [12]. A subsequent study demonstrated that there is a decrease in telomere length as a consequence of increased BMI, waist circumference and body fat percentage [5]. This study also demonstrated different impacts of weight loss [5]. Among those who were overweight at age 25, telomere length decreased among those who became non-overweight at age 30-40, and increased among those who were non- overweight at age 50-60, compared to those who were non- overweight both at age 25 and at current age [5]. Given the heterogeneity of these data, it remains to be clarified the impact of obesity in telomere length. Accordingly, the goal of our study was to evaluate the association between obesity and relative telomere length, using Portuguese individuals.

Materials and Methods

Sample

The present case-control study was based on a sample of 72 Portuguese obese adults (BMI greater than 30 kg/m2) - case group - and 74 non-obese adults/normal weight (BMI of 18.5 kg/m2 to 24.9 kg/m2) - control group.
Individuals with obesity history were selected from the Hospital Curry Cabral during endocrinology consultations. The following information was collected for each individual: sex, age, height, and weight. Individuals in the control group were selected from random volunteers of the Instituto Politécnico de Lisboa. This group was subjected to a brief questionnaire to collect the following data: age, sex, weight, height, smoking habits and exclusion factors such as pathologies, smoking habits, BMI between 18.5 kg/m2 and 24.9 kg/m2. All procedures performed during the research involving human participants adhere to the ethical norms of the ethical standards of Hospital Curry Cabral.

DNA extraction

Oral epithelium cells were used to extract DNA for quantification of the relative telomere length. For that, we first determine the best substrate to collect cells among saliva, swab, or brush, that were obtained from five normal individuals and cells were counted in Papanicolau-stained slides. Cells present in 10 fields at a 400x magnification of each slide were quantified by optical microscope, in triplicates. After defining that brush (endobrush - sterile cytology brush, reference No. 9912) is the more appropriate method to collect cells, buccal brushing was performed at all obese and normal subjects, and the brush tip was cut and placed in an Eppendorf tube for storage at -20° C, which allows the results to correlate with the original values for 6 months [13,14,15]. After incubating the tip of the brush with 500 µl of lysis buffer and 10 µl proteinase K for 16 hours at 56° C, DNA extraction was performed with 500 µl of phenol (Merck), 500 µl of phenol/chloroform (Sigma) and 500 µl of chloroform (Merck). After precipitation, the extracted DNA was resuspended in 50 µl of ultrapure water and stored at -20° C until use [16]. DNA was quantified using Qubit 3.0, and their respective kit QubitTM dsDNA Hs Assay (Invitrogen) with 1 µl of sample [17].

Measurement of relative telomere length

After determining DNA concentration, quantification of telomere length was performed using the CFXConect ™ Real-Time PCR Detection System from Bio-Rad. The procedure used for preparation of Monochromatic Real- Time Multiplex Quantitative Polymerase Chain Reaction (MMqPCR) was an adaptation of the method described by Cawthon (2009) [18], using albumin as the standard gene. The primers used were the following: albumin forward: CGGCGGCGGGCGGCGCGGGCTGGGCGGAAATGCTGCACAGAATCCTTG-5′-3′; albumin reverse: AACAGGCGACCATGCTTTTCCGGCGGGACGGGCGCGGCGGGCCGGGC-5′-3′ and telomere forward: ACACTAAGGTTTGGGTTTGGGTTTGGGTTTGGGTTAGTGT-5′-3′; and telomere reverse: TGTTAGGGATAGGGATAGGGATAGGGATAGGGA TACCTAACA -5′-3.
In each reaction, 10ng of DNA was used, by means of the iQTM SYBR Green supermix from Bio-Rad, with the following protocol divided into three phases: 1st phase - 15 min at 95° C; 2nd phase - 2 cycles 94° C for 15s and 15s at 49° C; Stage 3 - 32 cycles for 15s at 94º C, 10s at 62° C, 15s at 74° C, 10s at 84° C and 15s at 88º C [18]. After the MMqPCR run on CFXConect ™ Real-Time PCR Detection System, the CFX Maestro™ was used to collect and display the resulting data. For the relative quantification the 2 -ΔΔ CT method, also known as Livak method, was used [19]. This method is quite advantageous, since it allows to calculate the relative expression levels between different samples using directly the values of threshold cycle (Ct) generated by the software [20], if both the telomeres and albumin are amplified with an efficiency between 90% and 105% [20]. Therefore, for the purpose of calculating the efficiency, the development of a standard line was necessary, generated by amplification of five serial dilutions of known concentrations of a standard DNA sample [21,22,23].
After the line equation was generated, the conditions to calculate the following equations were gathered: [24] E = 10- (1/m), where E is the efficiency of PCR reaction and m the slope of the line % E = (E-1) x 100. As with all MMqPCR that were performed were found within the accepted interval of efficiency, the Livak method was applied.
As previously indicated, we had triplicates of each sample, thus we had to calculate the average of the triplicates. We needed to transform the data to ensure it could be statistically interpreted and that we could calculate the Ct average, controlling biased results. Data were normalized through the use of a reference, in this case DNA isolated from the human cell line HEP2. First, the ΔCt value of each sample must be calculated, subtracting the Ct values of the standard gene (albumin), and the Ct values of the target gene (telomere) [18,20,22]. Only after determining the ΔCt of the samples, it was possible to normalize these values, using the ΔCt value of HEP2 cell line, or be calculated ΔΔCt (ΔCt of each sample - ΔCt of HEP2 cell line) [18,20,22]. Once determined all ΔΔCt, the conditions were applied to 2 -ΔΔ CT expression described by Livak (2001) [20,23,24]. Thus, with the expression were obtained values of relative quantification, which indicates if the telomeres are longer (> 1) or smaller (<1) compared to the standard, the calibrator sample (cell line HEP2) [18,20].

Statistical analysis

The data obtained by CFX Maestro™ was exported to an Excel file to calculate the mean values and standard deviations of CT's. Following the standardization of the results and the implementation of the algorithm to acquire data on telomere length, a database was created, incorporating the case group and the control group with their respective data (sex, age, BMI and relative length of telomeres). The following statistical tests were performed: F-test to test for equal variances; the Shapiro-Wilk test for testing the normal sample sizes less than 30; the Student’s t-test to compare mean relative length of telomeres among different groups; the nonparametric Mann-Whitney U; and Pearson’s correlation coefficient, using the Microsoft Excel 2017 software MSO (16.0.11328.20314) 32-bit and IBM SPSS Statistics Base 22.0.

Results

Buccal brush is the best substrate to collect oral epithelium cells

The most commonly used sample for DNA extraction is blood, nevertheless due to its invasion and cost, attempts have been made to address the feasibility to use other samples [13,25]. Indeed, several studies have demonstrated that samples from the oral cavity are adequate to collect biological material [13,25]. As samples can be obtained using various substrates including saliva, swab, or brush, in the first phase of the study we aimed to determine the best substrate for DNA extraction. For that, we collected the three substrates in five volunteers and counted the cells present in Papanicolau-stained slides. Results demonstrated that buccal brush samples add an average of 186 cells in 10 fields, whereas saliva presented 150 cells and swabs only 50 cells (Figure 1). Accordingly, brush was chosen to perform the remaining study.

Sample characterization

After collecting the information of our sample (total of 146 individuals, 72 obese and 74 non-obese), we stratified it in terms of age, BMI and obesity class (Table 1). The mean age was 44.36 ± 11.09 and 25.46 ± 6.43 years, whereas the mean BMI was 44.5 ± 7.99 and 21.7 ± 1.73, respectively (Table 1). The obese group included individuals from all three classes of obesity. Class I corresponded to 11% of the obese group, class II had 20% of the individuals and the class III accounted for more than half of the obese individuals, as it represented 69% of the group (Table 1).
The relative length of telomeres is shorter in obese individuals
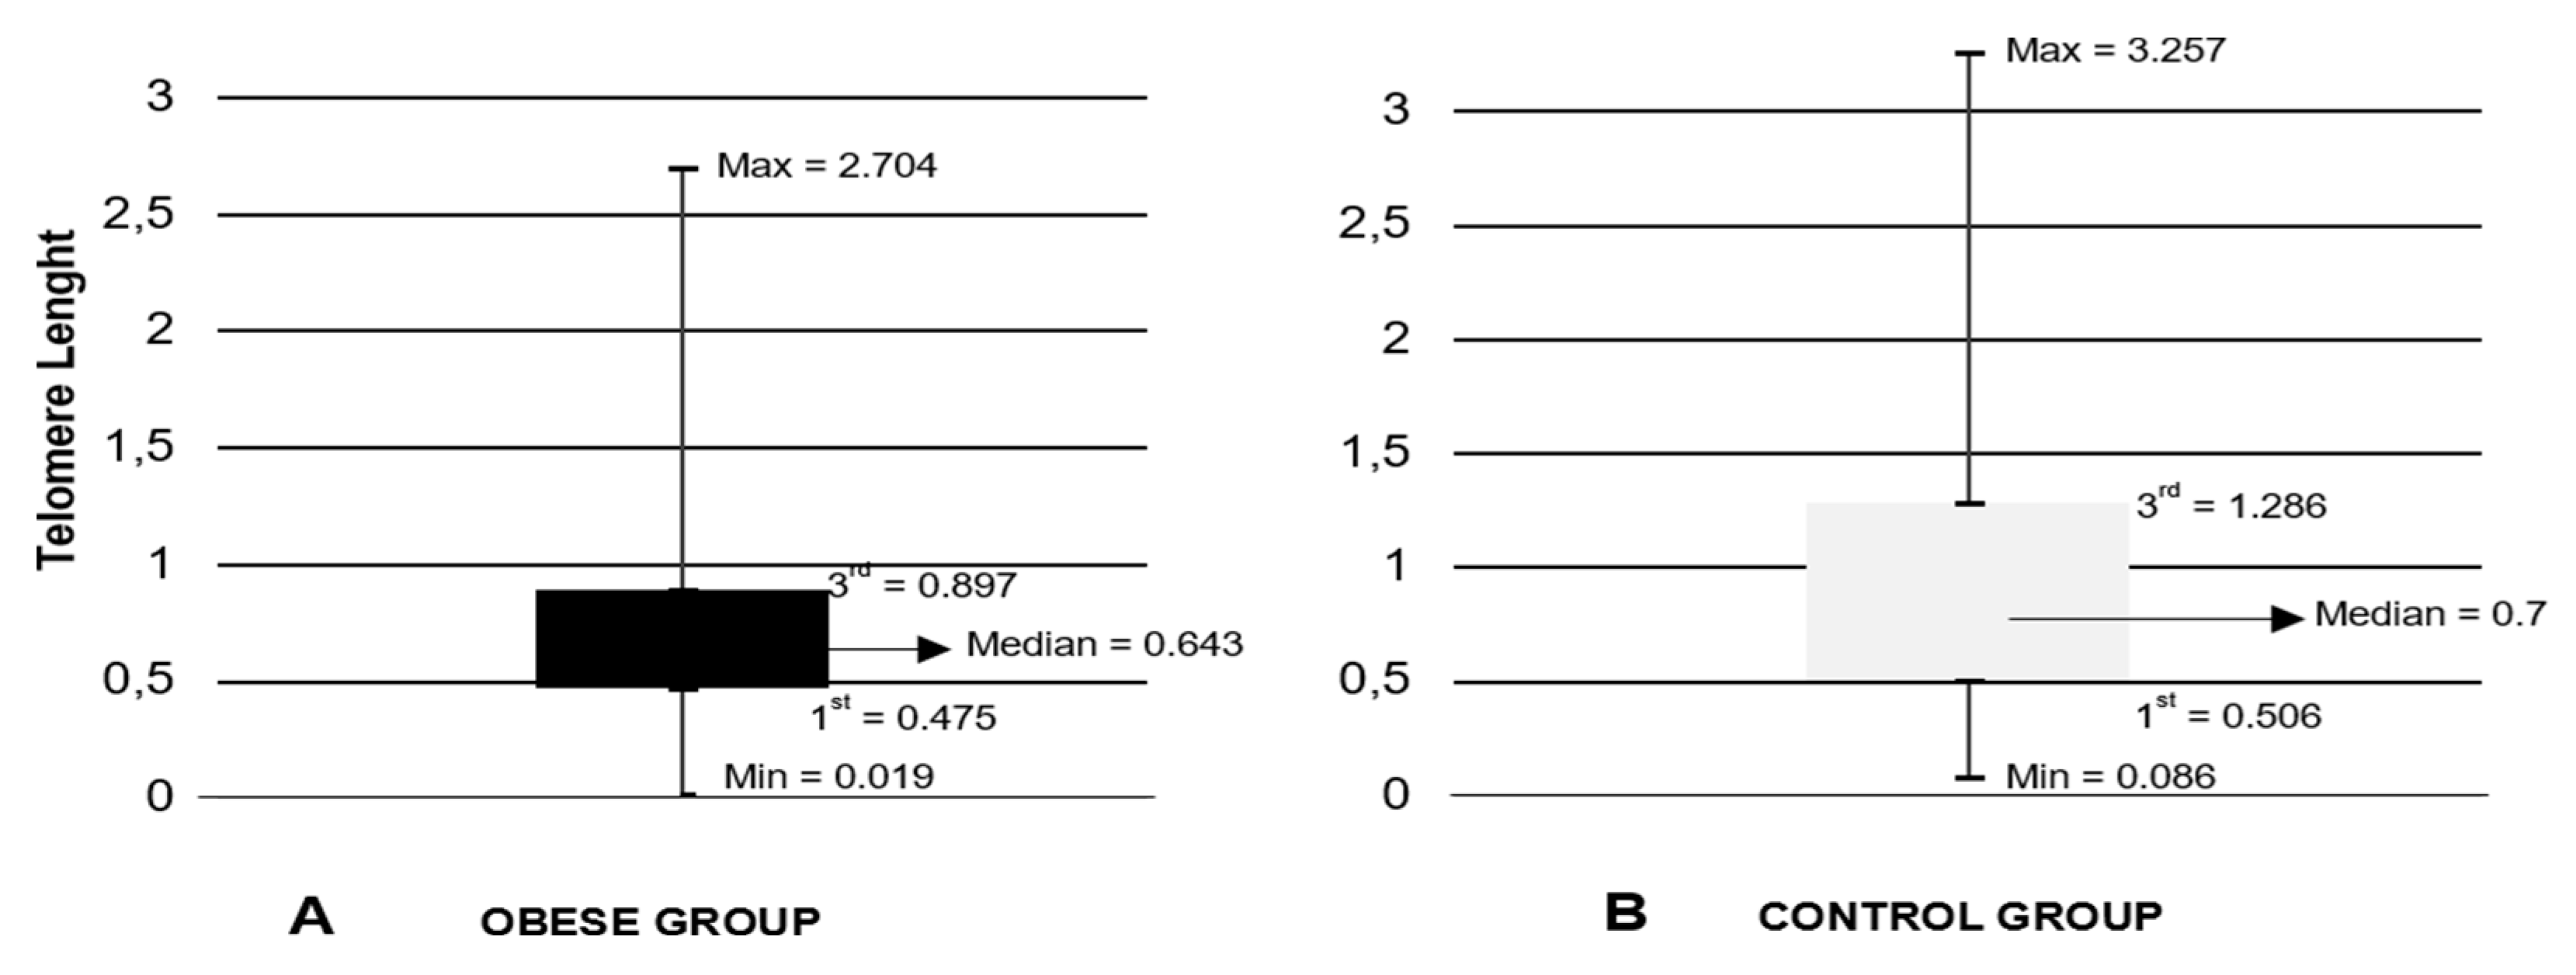
The distribution by quartiles of the obese and control groups in relation to the relative length of telomeres demonstrates that the median values are 0.643 and 0.7, respectively. In the obese groups the values are comprised between 2.704 and 0.019, whereas in the control group the maximum value is 3.257 and the minimum is 0.086 (as presented in Figure 2), indicating that obese individuals have shorter telomeres.

The relative telomere length is shorter in obese females and equal regardless the age

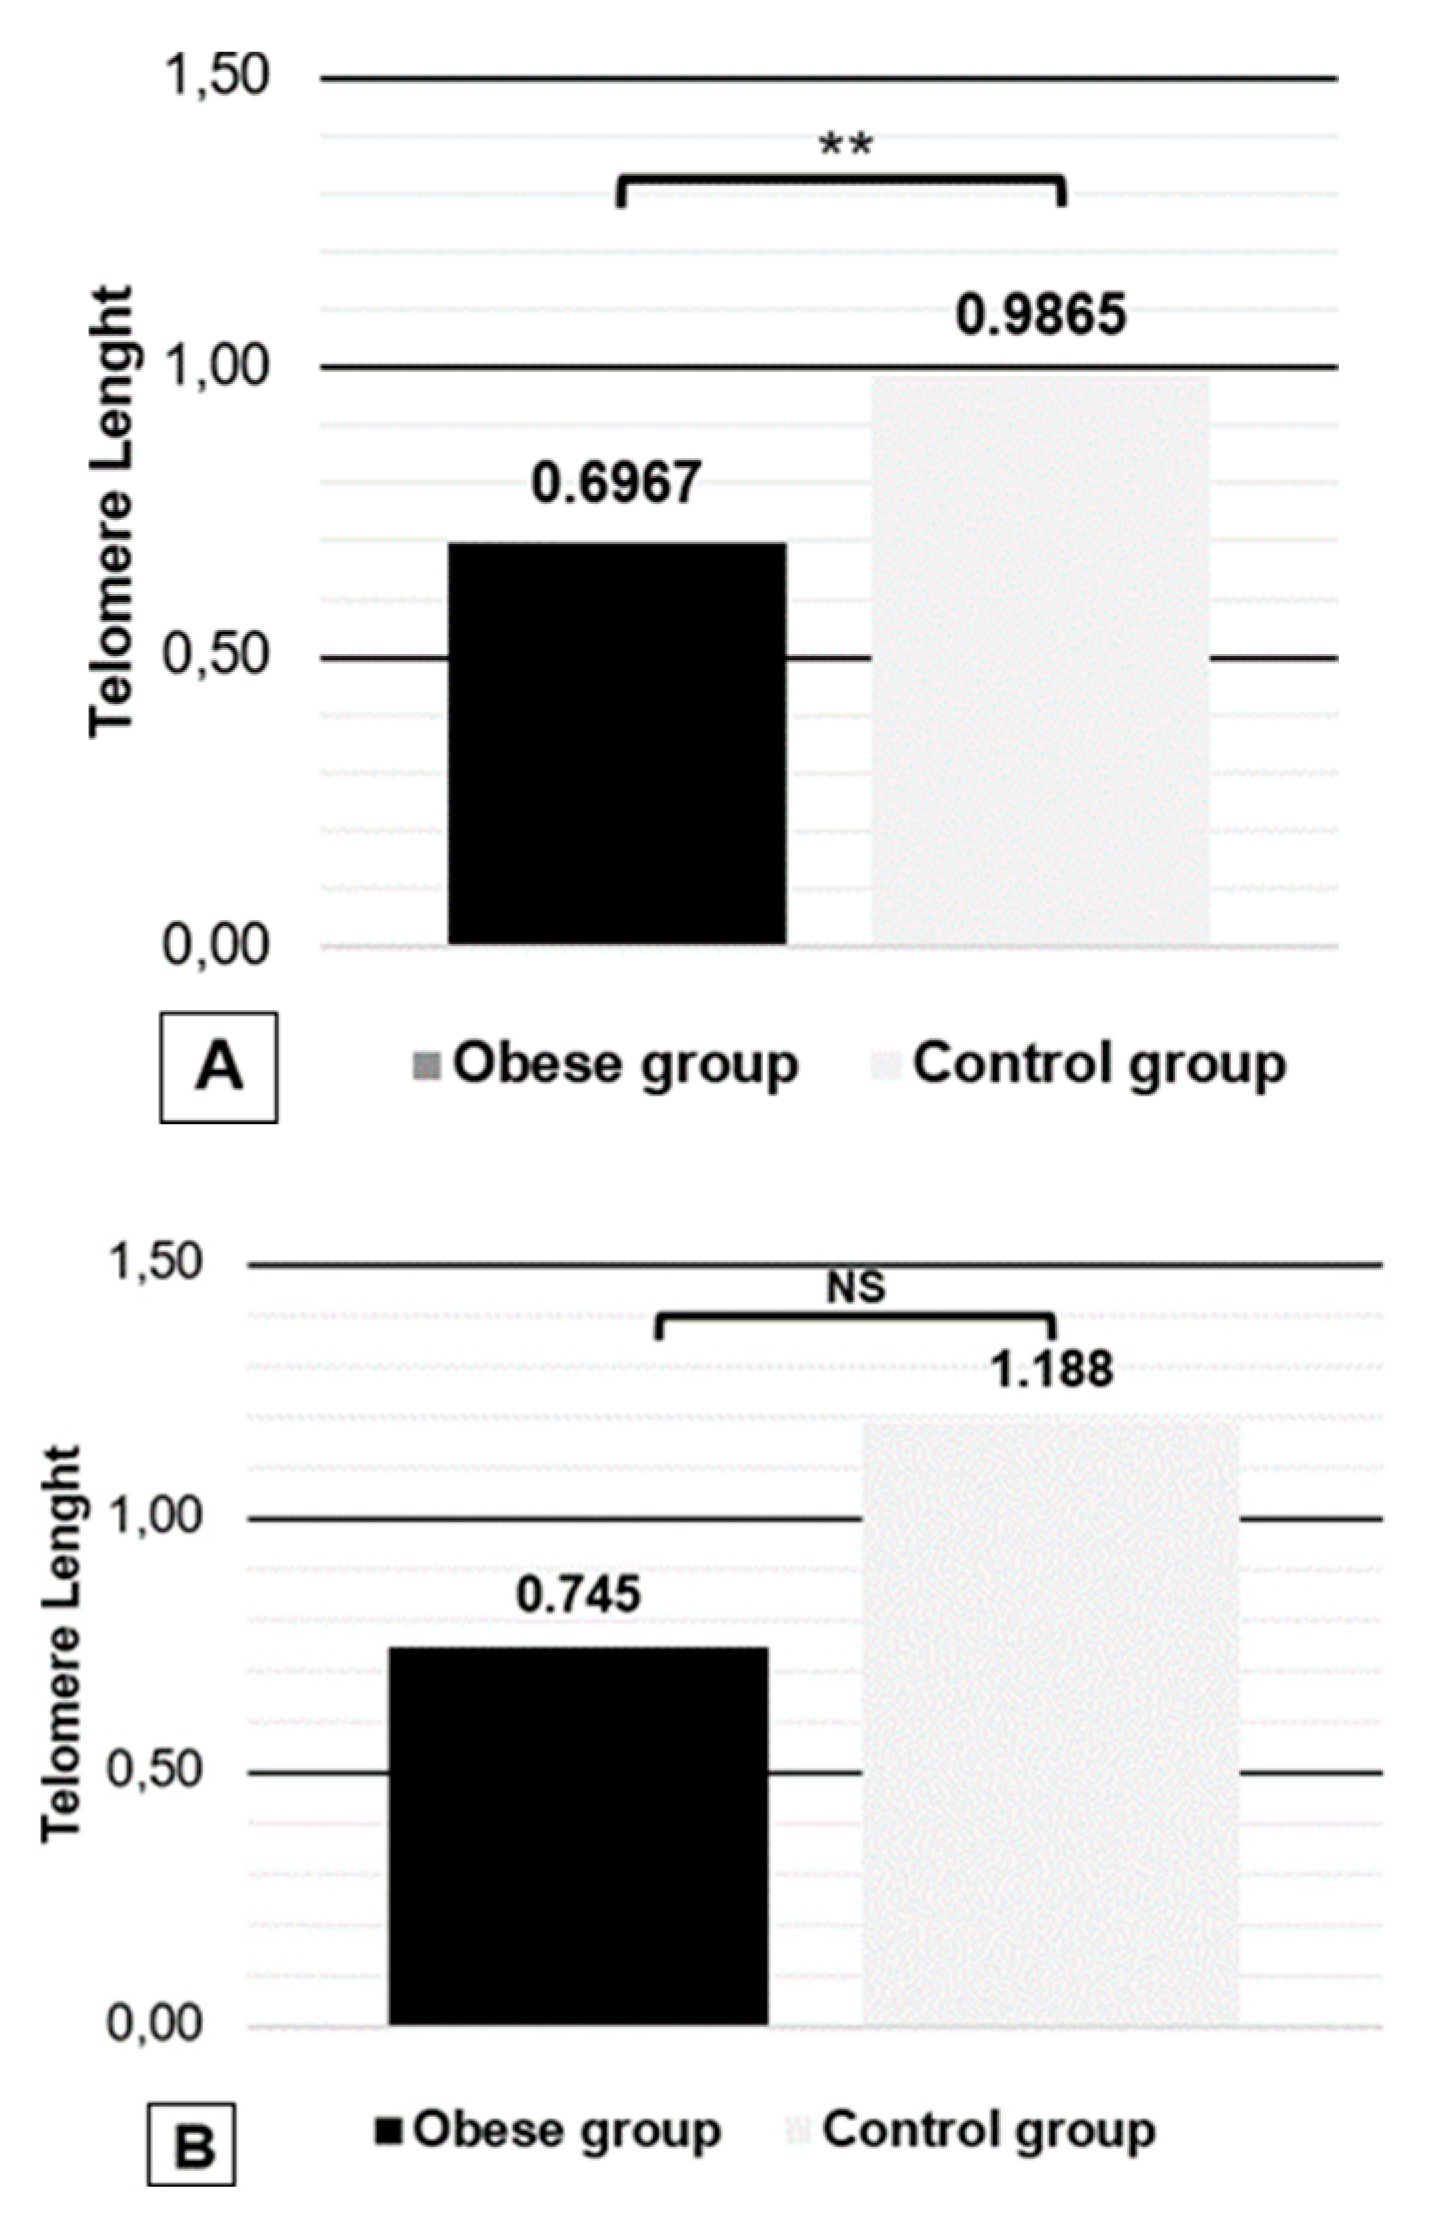
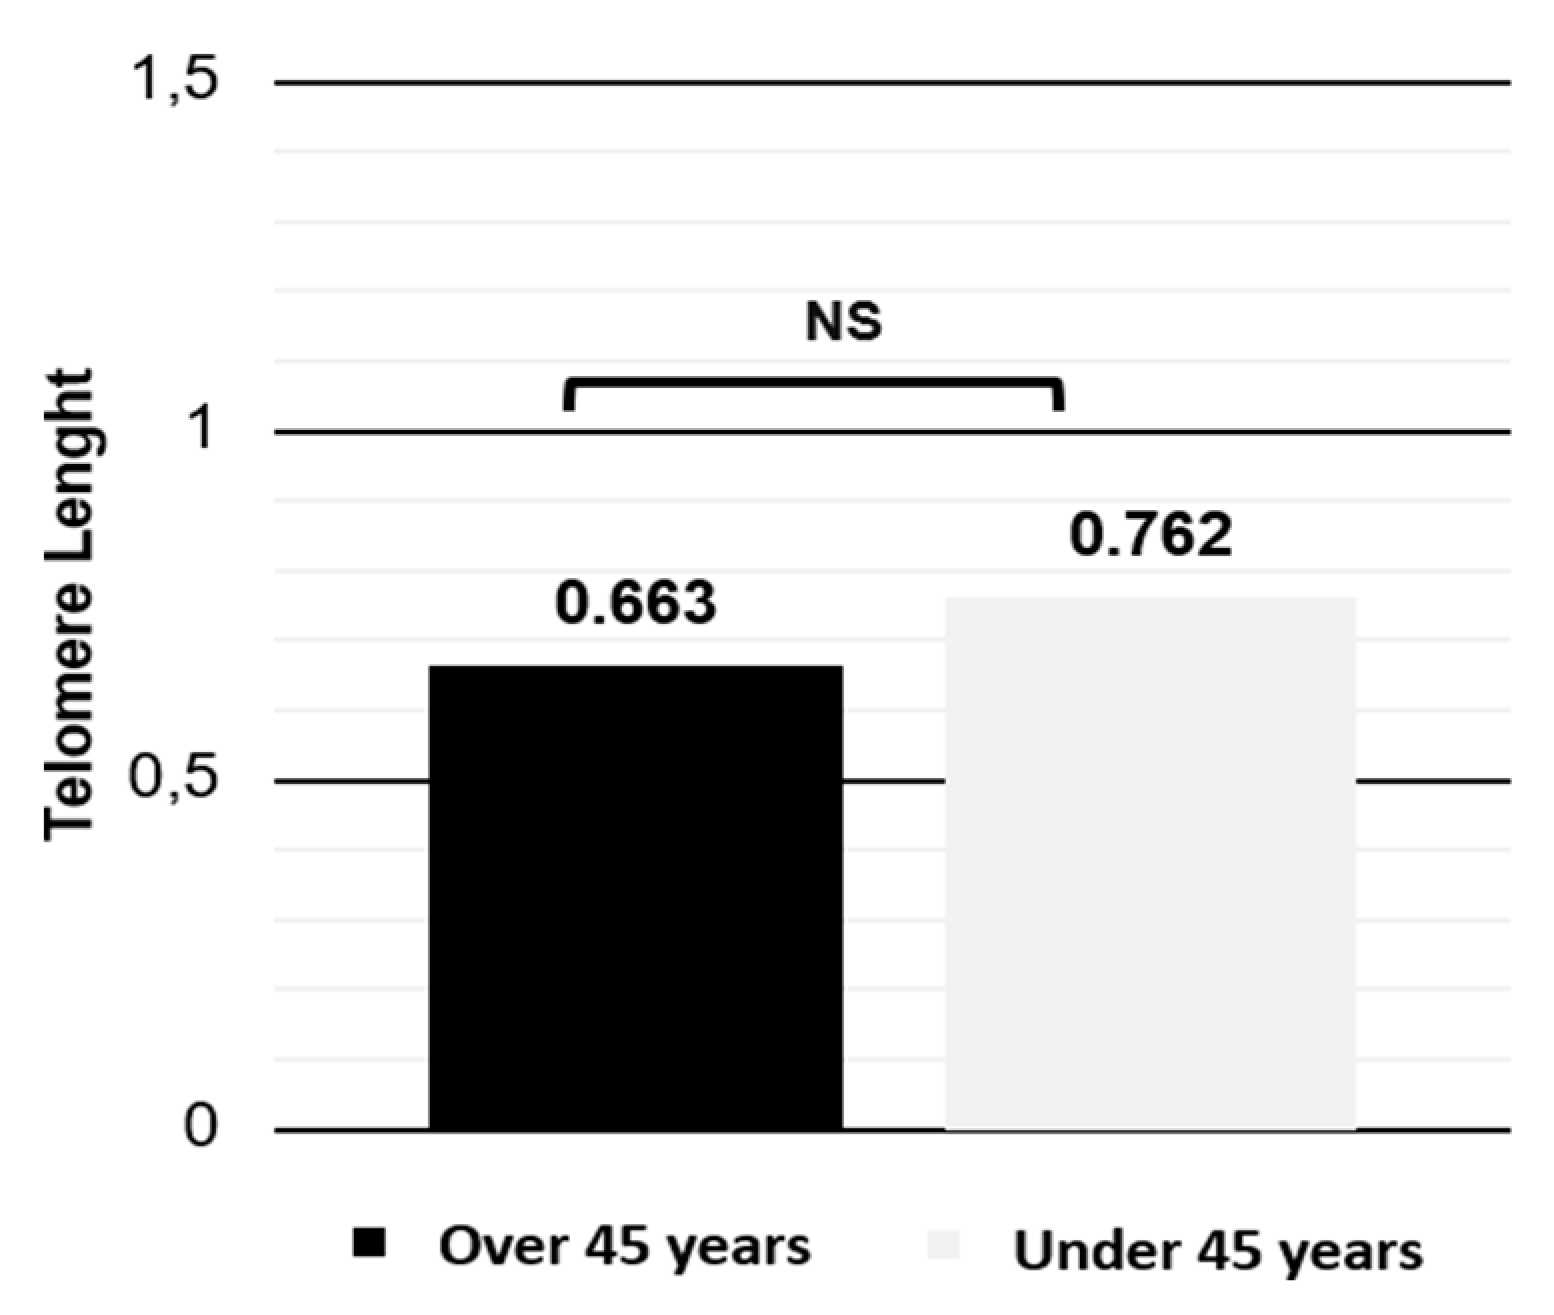
It has been reported that both the genre and age may affect the impact of obesity in the relative telomere length [5,26]. Accordingly, we addressed whether females/males and individuals under/over 45 years have differences in the telomere length relative to the corresponding control group. This analysis revealed that whereas in females there is a decrease in the length of telomeres in the obese group comparing to normal individuals (0.6967 vs. 0.9865 p = 0.0089), in males there is no significant differences between the groups (0.745 vs. 1.188 p = 0.134) (Figure 4). Similarly, by comparing the obese under and over 45 years old, no differences in the relative telomere length were found (Figure 5).
To expand our analysis, we combined obesity and telomere shortening to calculate the coefficient of Pearson and verified that there is a negative correlation between the two variables i.e., increase of BMI and decrease of relative telomere length (-0.217).

Discussions

Obesity, a condition that constitutes a major risk factor for the development of diseases such as cancer, is associated with oxidative stress and although it is well stablished that the generation of reactive oxygen specimens is strongly related with telomere shortening, the relationship between short telomeres and high BMI is not consensual [2,4,5,27]. In this study, by analyzing 72 obese adults (BMI greater than 30 kg/m2) and 74 non-obese adults (BMI of 18.5 kg/m2 to 24.9 kg/m2) we found that the former group has smaller telomeres than the control group, suggesting that obesity is associated with shortening of telomeres. For that we evaluated epithelial cells from the oral cavity, that were collected through buccal brush, as it was the substrate that provided higher quantity of cells (Figure 1). This result was in accordance with the literature that demonstrates that although buccal swab and saliva have similar epithelial cell subtypes, the former has higher proportion of epithelial cells than saliva, in adults [25].
Several studies have addressed the association between the relative telomere length and obesity and the conclusions are consistent with our results. According to Nordfjäll et al. (2018), obese individuals have significantly shorter telomeres regardless of the comorbidities associated with this condition [26]. This observation was corroborated by Rode et al. (2014) that found that elevated BMI is associated with telomere shortening, possibly through elevated C-reactive protein [28]. Similarly, by study more than 2900 American adults, Wang et al., 2023 demonstrated that BMI is inversely correlated with telomere length and that large weight fluctuations might potentiate telomere shortening [29].
In our study, it is demonstrated that more than 50% of the obese group of individuals has telomeres with relative length between 0.643 and 2.704, whereas in the control group more than 50% had a relative telomere length between 0.7 and 3.257, which was reflected in a negative association between BMI and relative telomere length. By evaluating this association according to subgroup analysis, we verified that genre determines the negative impact of obesity in telomere length, as female obese have shorter telomeres than the non-obese counterparts, in opposition to male obese (Figure 4). This conclusion is consistent with previous literature, that also reported a difference in females versus males [26]. However, it would be interesting to further explore the difference between male obese and non-obese individuals, as we observed that, despite an absence of statistical significance, the mean relative telomere length of the obese group is tendentially lower than that of the control group (Figure 4). Indeed, a meta-analysis from Gielen et al. (2018), conducted with data from 146,114 individuals, concluded that high BMI is associated with shorter telomere, and that there was no significant difference between males and females [30].
Regarding the influence of age in telomere length, we observed that obese individuals aged over 45 years have no significantly shorter telomeres as compared to younger than 45 (Figure 5), indicating that age did not intensify or relieve the impact of obesity in telomere length. This hypothesis is in accordance with Mangge et al. (2019) that concluded that age is an independent factor in the association between obesity and relative telomere length [31]. Indeed, a study from Toupance et al., 2022 involving 73 children aged 2-10, demonstrated that shorter telomere length from leukocytes correlated with higher BMI in childhood [32]. This is in accordance with a systematic review from Raftopoulou et al., 2022 that evaluated 16 studies, most of which identified a negative association between pediatric obesity and telomere length [33]. In addition, a study addressing the association between oxidative stress, telomere length and metabolic health, demonstrated that unhealthy obesity phenotype linked to metabolic syndrome is related with telomere shortening in adult young men [34]. These observations, in conjunction with our data, suggests that short telomeres not only precede the development of obesity in childhood but also accompanies the disease throughout adulthood. Nevertheless, it seems that lifestyle interventions related to weight loss can reverse this phenomenon as it has been associated with an increase in telomere length [33].
In this study, individuals from the three classes of obesity were included and it was not possible to verify any differences between the classes. This was attributed to the lack of representation of each class, as class I represented 11%, class II 20% and class III 69%. It would be interesting to determine if the relative telomere length is different between the classes and to explore if each class might be affecting the impact of other variables such as genre (particularly in the male obese group).

Conclusions

Our study demonstrates that obesity is associated with telomere of a shorter length in Portuguese adults, and that this association is influenced by the obese genre but not by their age. This indicates that relative telomere length can be used as a biomarker in obesity. It remains to be determined whether the class of obesity affects this association and the underlying molecular mechanisms responsible for this association.

Funding and Acknowledgments

The H&TRC authors gratefully acknowledge the FCT/MCTES national support through the UIDB/05608/2020 and UIDP/05608/2020.

Compliance with Ethical Standards

Any aspect of the work covered in this manuscript has been conducted with the ethical approval of all relevant bodies and that such approvals are acknowledged within the manuscript. Informed consent was obtained from all subjects involved in the study.

Conflicts of Interest

There are no known conflicts of interest in the publication of this article. The manuscript was read and approved by all authors.

References

  1. Obesity and overweight. World Health Organization (2018). https://www.who.int/news-room/fact-sheets/detail/obesity-and-overweight.
  2. Obesity. World Health Organization. https://www.who.int/health-topics/obesity#tab=tab_1.
  3. Association of nutrition. APN: Obesity. http://www.apn.org.pt/v0E0J/nutrition-fact-sheets.
  4. Vidacek, N.Š.; Nanic, L.; Ravlic, S.; et al. Telomeres, Nutrition, and Longevity: Can We Really Navigate Our Aging? J Gerontol A Biol Sci Med Sci. 2017, 73, 39–47. [Google Scholar] [CrossRef] [PubMed]
  5. Wulaningsih, W.; Watkins, J.; Matsuguchi, T.; Hardy, R. Investigating the associations between adiposity, life course overweight trajectories, and telomere length. Aging 2016, 8, 2689–2701. [Google Scholar] [CrossRef] [PubMed]
  6. Barrett, J.H.; Iles, M.M.; Dunning, A.M.; Pooley, K.A. Telomere length and common disease: study design and analytical challenges. Hum Genet. 2015, 134, 679–689. [Google Scholar] [CrossRef]
  7. Blackburn, E.H. Telomeres and telomerase: the means to the end (Nobel lecture). Angew Chem Int Ed Engl. 2010, 49, 7405–7421. [Google Scholar] [CrossRef]
  8. Pfeiffer, V.; Lingner, J. Replication of telomeres and the regulation of telomerase. Cold Spring Harb Perspect Biol. 2013, 5, a010405. [Google Scholar] [CrossRef] [PubMed]
  9. Mathon, N.F.; Lloyd, A.C. Cell senescence and cancer. Nat Rev Cancer. 2001, 1, 203–213. [Google Scholar] [CrossRef]
  10. Yeh, J.K.; Wang, C.Y. Telomeres and Telomerase in Cardiovascular Diseases. Genes 2016, 7, 58. [Google Scholar] [CrossRef]
  11. Iglesias Molli, A.E.; Panero, J.; Dos Santos, P.C.; et al. Metabolically healthy obese women have longer telomere length than obese women with metabolic syndrome. PLoS ONE 2017, 12, e0174945. [Google Scholar] [CrossRef]
  12. Mundstock, E.; Sarria, E.E.; Zatti, H.; et al. Effect of obesity on telomere length: Systematic review and meta-analysis. Obesity (Silver Spring) 2015, 23, 2165–2174. [Google Scholar] [CrossRef]
  13. Lin, J.; Smith, D.L.; Esteves, K.; Drury, S. Telomere length measurement by qPCR - Summary of critical factors and recommendations for assay design. Psychoneuroendocrinology. [CrossRef]
  14. Dagnall, C.L.; Hicks, B.; Teshome, K.; et al. Effect of pre-analytic variables on the reproducibility of qPCR relative telomere length measurement. PLoS ONE 2017, 12, e0184098. [Google Scholar] [CrossRef]
  15. Finnicum, C.T.; Dolan, C.V.; Willemsen, G.; et al. Relative Telomere Repeat Mass in Buccal and Leukocyte-Derived DNA. PLoS ONE 2017, 12, e0170765. [Google Scholar] [CrossRef] [PubMed]
  16. Camacho, P.; Ribeiro, E.; et al. DNA methyltransferase expression (DNMT1, DNMT3a and DNMT3b) as a potential biomarker for anti-VEGF diabetic macular edema response. Eur J Ophthalmol. 2023, 33, 2267–2274. [Google Scholar] [CrossRef] [PubMed]
  17. Thermo Fisher Scientific, editor. Qubit Fluorometric Quantification. https://www.thermofisher.com/pt/en/home/industrial/spectroscopy-elemental-isotope-analysis/molecular-spectroscopy/fluorometers/qubit.html?ef_id=a4a13beb609f178a16f6 5fe8c4fe9885:G:s&s_kwcid=AL!3652!10!77034693349276!77034707720811&cid=bid_pca_aqb_r01_co_cp1359_pjt0000_bid00000_0s e_bng_bt_pur_con&msclkid=a4a13beb609f178a16f65fe8c4fe9885.
  18. Cawthon, R.M. Telomere length measurement by a novel monochrome multiplex quantitative PCR method. Nucleic Acids Res. 2009, 37, e21. [Google Scholar] [CrossRef]
  19. Livak, K.J.; Schmittgen, T.D. Analysis of relative gene expression data using real-time quantitative PCR and the 2(-Delta Delta C(T)) Method. Methods 2001, 25, 402–408. [Google Scholar] [CrossRef]
  20. Rao, X.; Huang, X.; Zhou, Z.; Lin, X. An improvement of the 2ˆ(-delta delta CT) method for quantitative real-time polymerase chain reaction data analysis. Biostat Bioinforma Biomath. 2013, 3, 71–85. [Google Scholar] [PubMed]
  21. El Maï, M.; Bird, M.; Allouche, A.; et al. Gut-specific telomerase expression counteracts systemic aging in telomerase-deficient zebrafish. Nat Aging. 2023, 3, 567–584. [Google Scholar] [CrossRef]
  22. Bio-Rad Laboratories. Real-Time PCR Applications Guide 2006. https://www.bio-rad.com/webroot/web/pdf/lsr/literature/Bulletin_5279.pdf.
  23. Michael, W. Pfaffl. Relative quantification. 2004. https://www.gene- quantification.de/pfaffl-rel-quan-book-ch3.pdf. Published by International University Line (Editor: T. Dorak), pp. 63–82.
  24. Grun, L.K.; Teixeira, N.D.R., Jr.; Mengden, L.V.; et al. TRF1 as a major contributor for telomeres’ shortening in the context of obesity. Free Radic Biol Med. 2018, 129, 286–295. [Google Scholar] [CrossRef]
  25. Theda, C.; Hwang, S.H.; Czajko, A.; Loke, Y.J.; Leong, P.; Craig, J.M. Quantitation of the cellular content of saliva and buccal swab samples. Sci Rep. 2018, 8, 6944. [Google Scholar] [CrossRef]
  26. Nordfjäll, K.; Eliasson, M.; Stegmayr, B.; Melander, O.; Nilsson, P.; Roos, G. Telomere length is associated with obesity parameters but with a gender difference. Obesity (Silver Spring) 2008, 16, 2682–2689. [Google Scholar] [CrossRef]
  27. Barnes, R.P.; Fouquerel, E.; Opresko, P.L. The impact of oxidative DNA damage and stress on telomere homeostasis. Mech Ageing Dev. 2019, 177, 37–45. [Google Scholar] [CrossRef]
  28. Rode, L.; Nordestgaard, B.G.; Weischer, M.; Bojesen, S.E. Increased body mass index, elevated C-reactive protein, and short telomere length. J Clin Endocrinol Metab. 2014, 99, E1671–E1675. [Google Scholar] [CrossRef] [PubMed]
  29. Wang, X.; Wen, J.; Qu, Q.; et al. Association of weight range with telomere length: A retrospective cohort study. Front Endocrinol 2023, 14, 1106283. [Google Scholar] [CrossRef] [PubMed]
  30. Gielen, M.; Hageman, G.J.; Antoniou, E.E.; et al. Body mass index is negatively associated with telomere length: a collaborative cross-sectional meta-analysis of 87 observational studies. Am J Clin Nutr. 2018, 108, 453–475. [Google Scholar] [CrossRef] [PubMed]
  31. Mangge, H.; Renner, W.; Almer, G.; et al. Subcutaneous adipose tissue distribution and telomere length. Clin Chem Lab Med. 2019, 57, 1358–1363. [Google Scholar] [CrossRef]
  32. Toupance, S.; Karampatsou, S.I.; Labat, C.; et al. Longitudinal Association of Telomere Dynamics with Obesity and Metabolic Disorders in Young Children. Nutrients. 2022, 14, 5191. [Google Scholar] [CrossRef]
  33. Raftopoulou, C.; Paltoglou, G.; Charmandari, E. Association between Telomere Length and Pediatric Obesity: A Systematic Review. Nutrients. 2022, 14, 1244. [Google Scholar] [CrossRef]
  34. Lejawa, M.; Osadnik, K.; Osadnik, T.; Pawlas, N. Association of Metabolically Healthy and Unhealthy Obesity Phenotypes with Oxidative Stress Parameters and Telomere Length in Healthy Young Adult Men. Analysis of the MAGNETIC Study. Antioxidants 2021, 10, 93. [Google Scholar] [CrossRef]
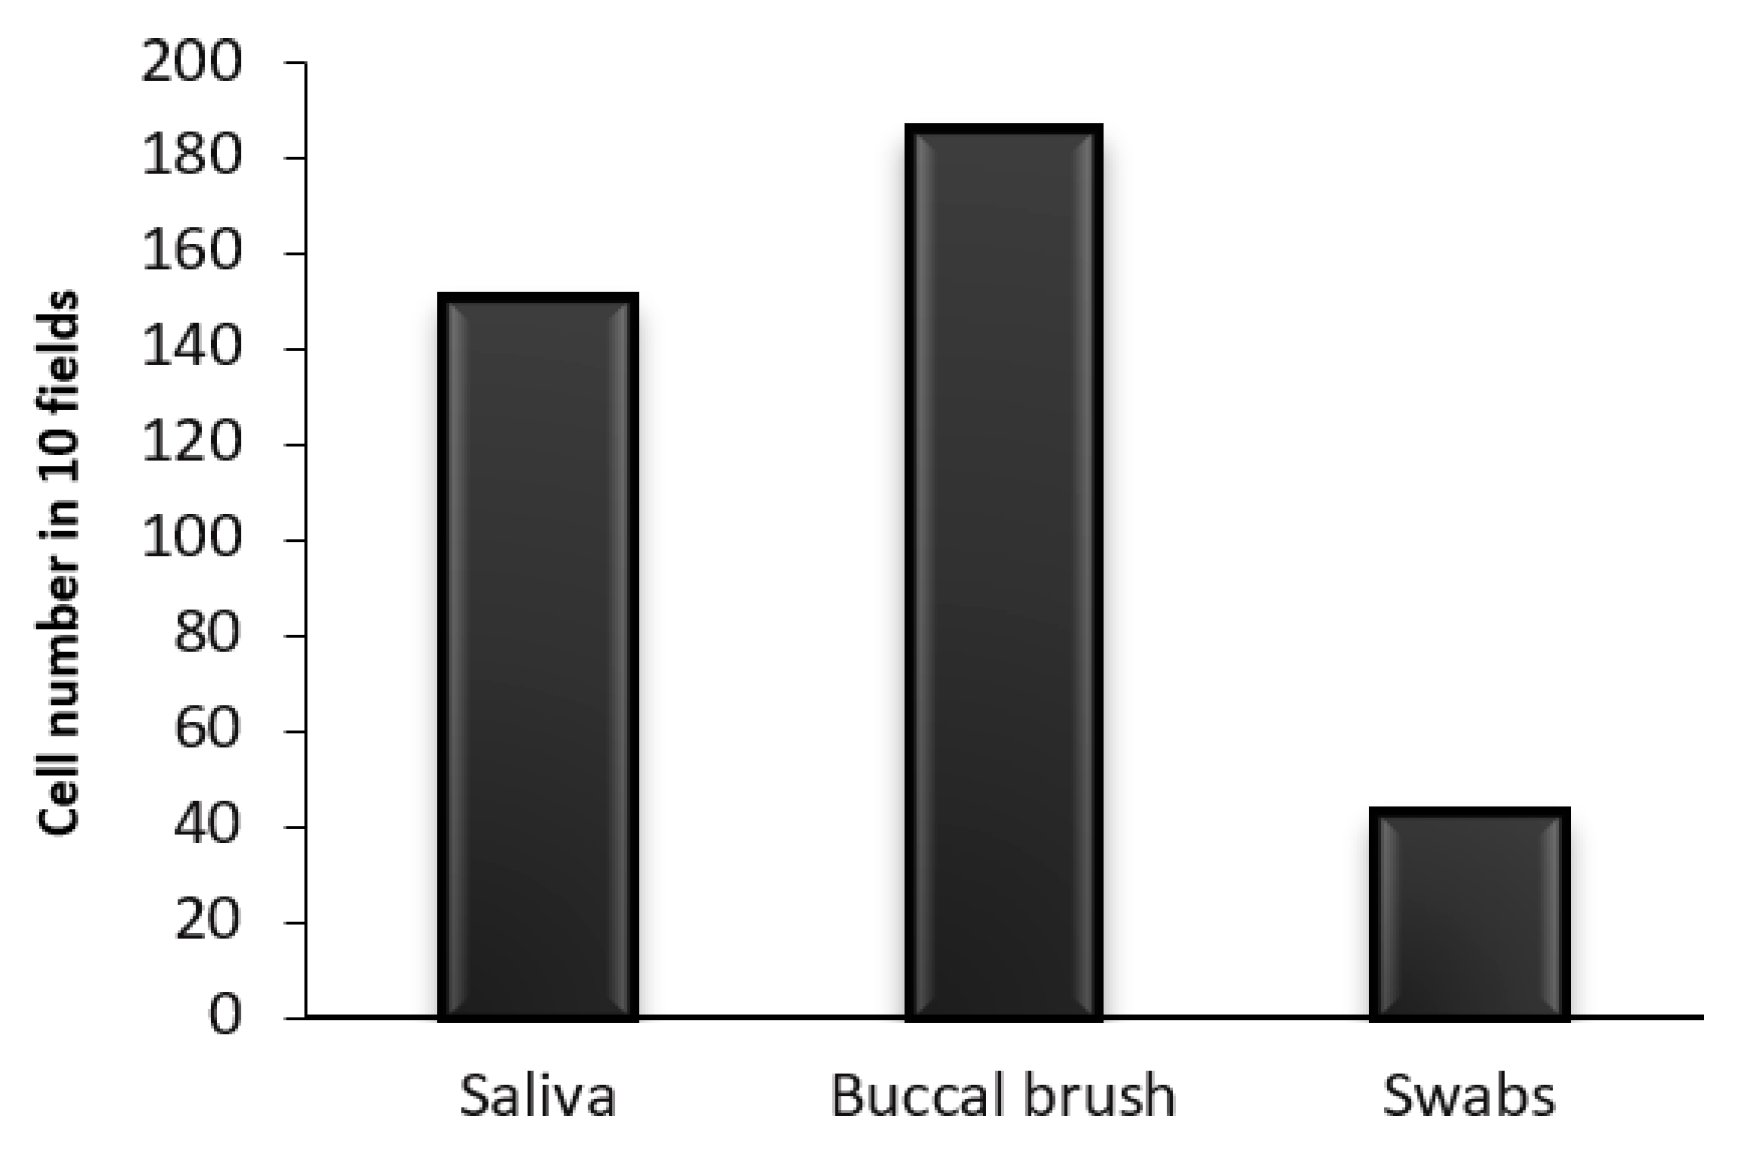
Figure 1. Quantity of cells present in saliva, buccal brush and swabs. The three substrates were obtained from five volunteers and cells were counted in Pap-stained slides. Cells present in 10 fields at a 400x magnification of each slide were quantified by optical microscope, in triplicate. Values are presented as the mean of counted cells.
Jmms 11 00048 g001
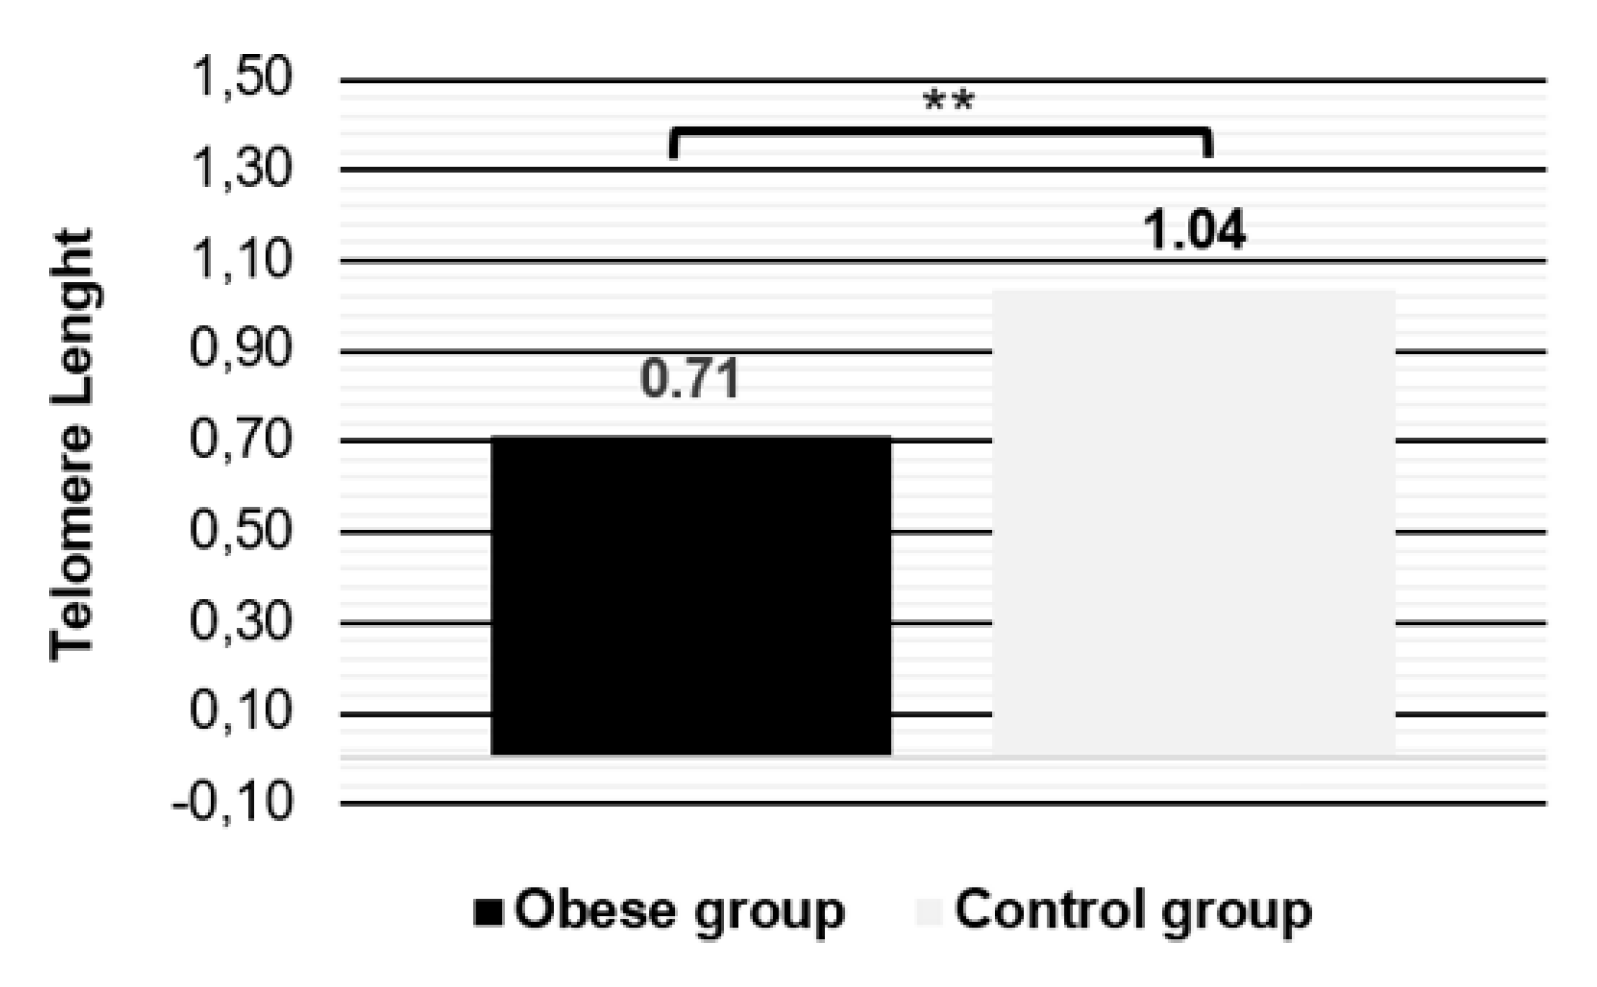
Figure 2. Quartile distribution of the relative telomere length in the obese and control groups. (A) The relative telomere length of the obese group has a maximum of 2.704, a minimum of 0.019 and a median of 0.643. The first and third quartiles are comprised between 0.475 and 0.897, respectively. (B) The relative telomere length of the control group has a maximum of 3.257, a minimum of 0.086 and a median of 0.7. The first and third quartiles are comprised between 0.506 and 1.286, respectively. Indeed, it was found that the mean telomere length is 0.71 in the obese group whereas it is 1.04 in the control group (Figure 3) and that this difference is statistically significant (p = 0.0019).
Jmms 11 00048 g002
Figure 3. Mean values of the relative telomere length in the obese and control groups. Telomere length in the obese (n = 72, x - = 0.71) and control (n = 74, x - = 1.04) groups. **p <0.01 (p = 0.0019), T-student test.
Jmms 11 00048 g003
Figure 4. Relative telomere length divided by genre. (A) Mean relative telomere length in female obese (n = 55, x - = 0.697) and non-obese (n = 55, x - = 0.987) individuals. ** p <0.01 (p = 0.0089), T-student test. (B) Mean relative telomere length in male obese (n = 18, x x - = 0.745) and non- obese (n = 19 x - = 1.188) individuals. NS - not significant (p = 0.134), Mann-Whitney U test.
Jmms 11 00048 g004
Figure 5. Relative telomere length of obese individuals over and under 45 years old. Mean relative telomere length in obese patients aged over (n = 36, x - = 0.663) and under (n = 36, x - = 0.762) 45 years old. NS - not significant (p = 0.3). T-student test.
Jmms 11 00048 g005
Table 1. Sample characterization in terms of age, Body Mass Index (BMI), and classes I, II and III of obesity.
Obese groupControl group
Age (mean ± s.d.)44.36 ± 11.0925.46 ± 6.43
BMI (mean ± s.d.)44.5 ± 7.9921.7 ± 1.73
Class I11%N.A.
Class II20%N.A.
Class III69%N.A.
Total7274