
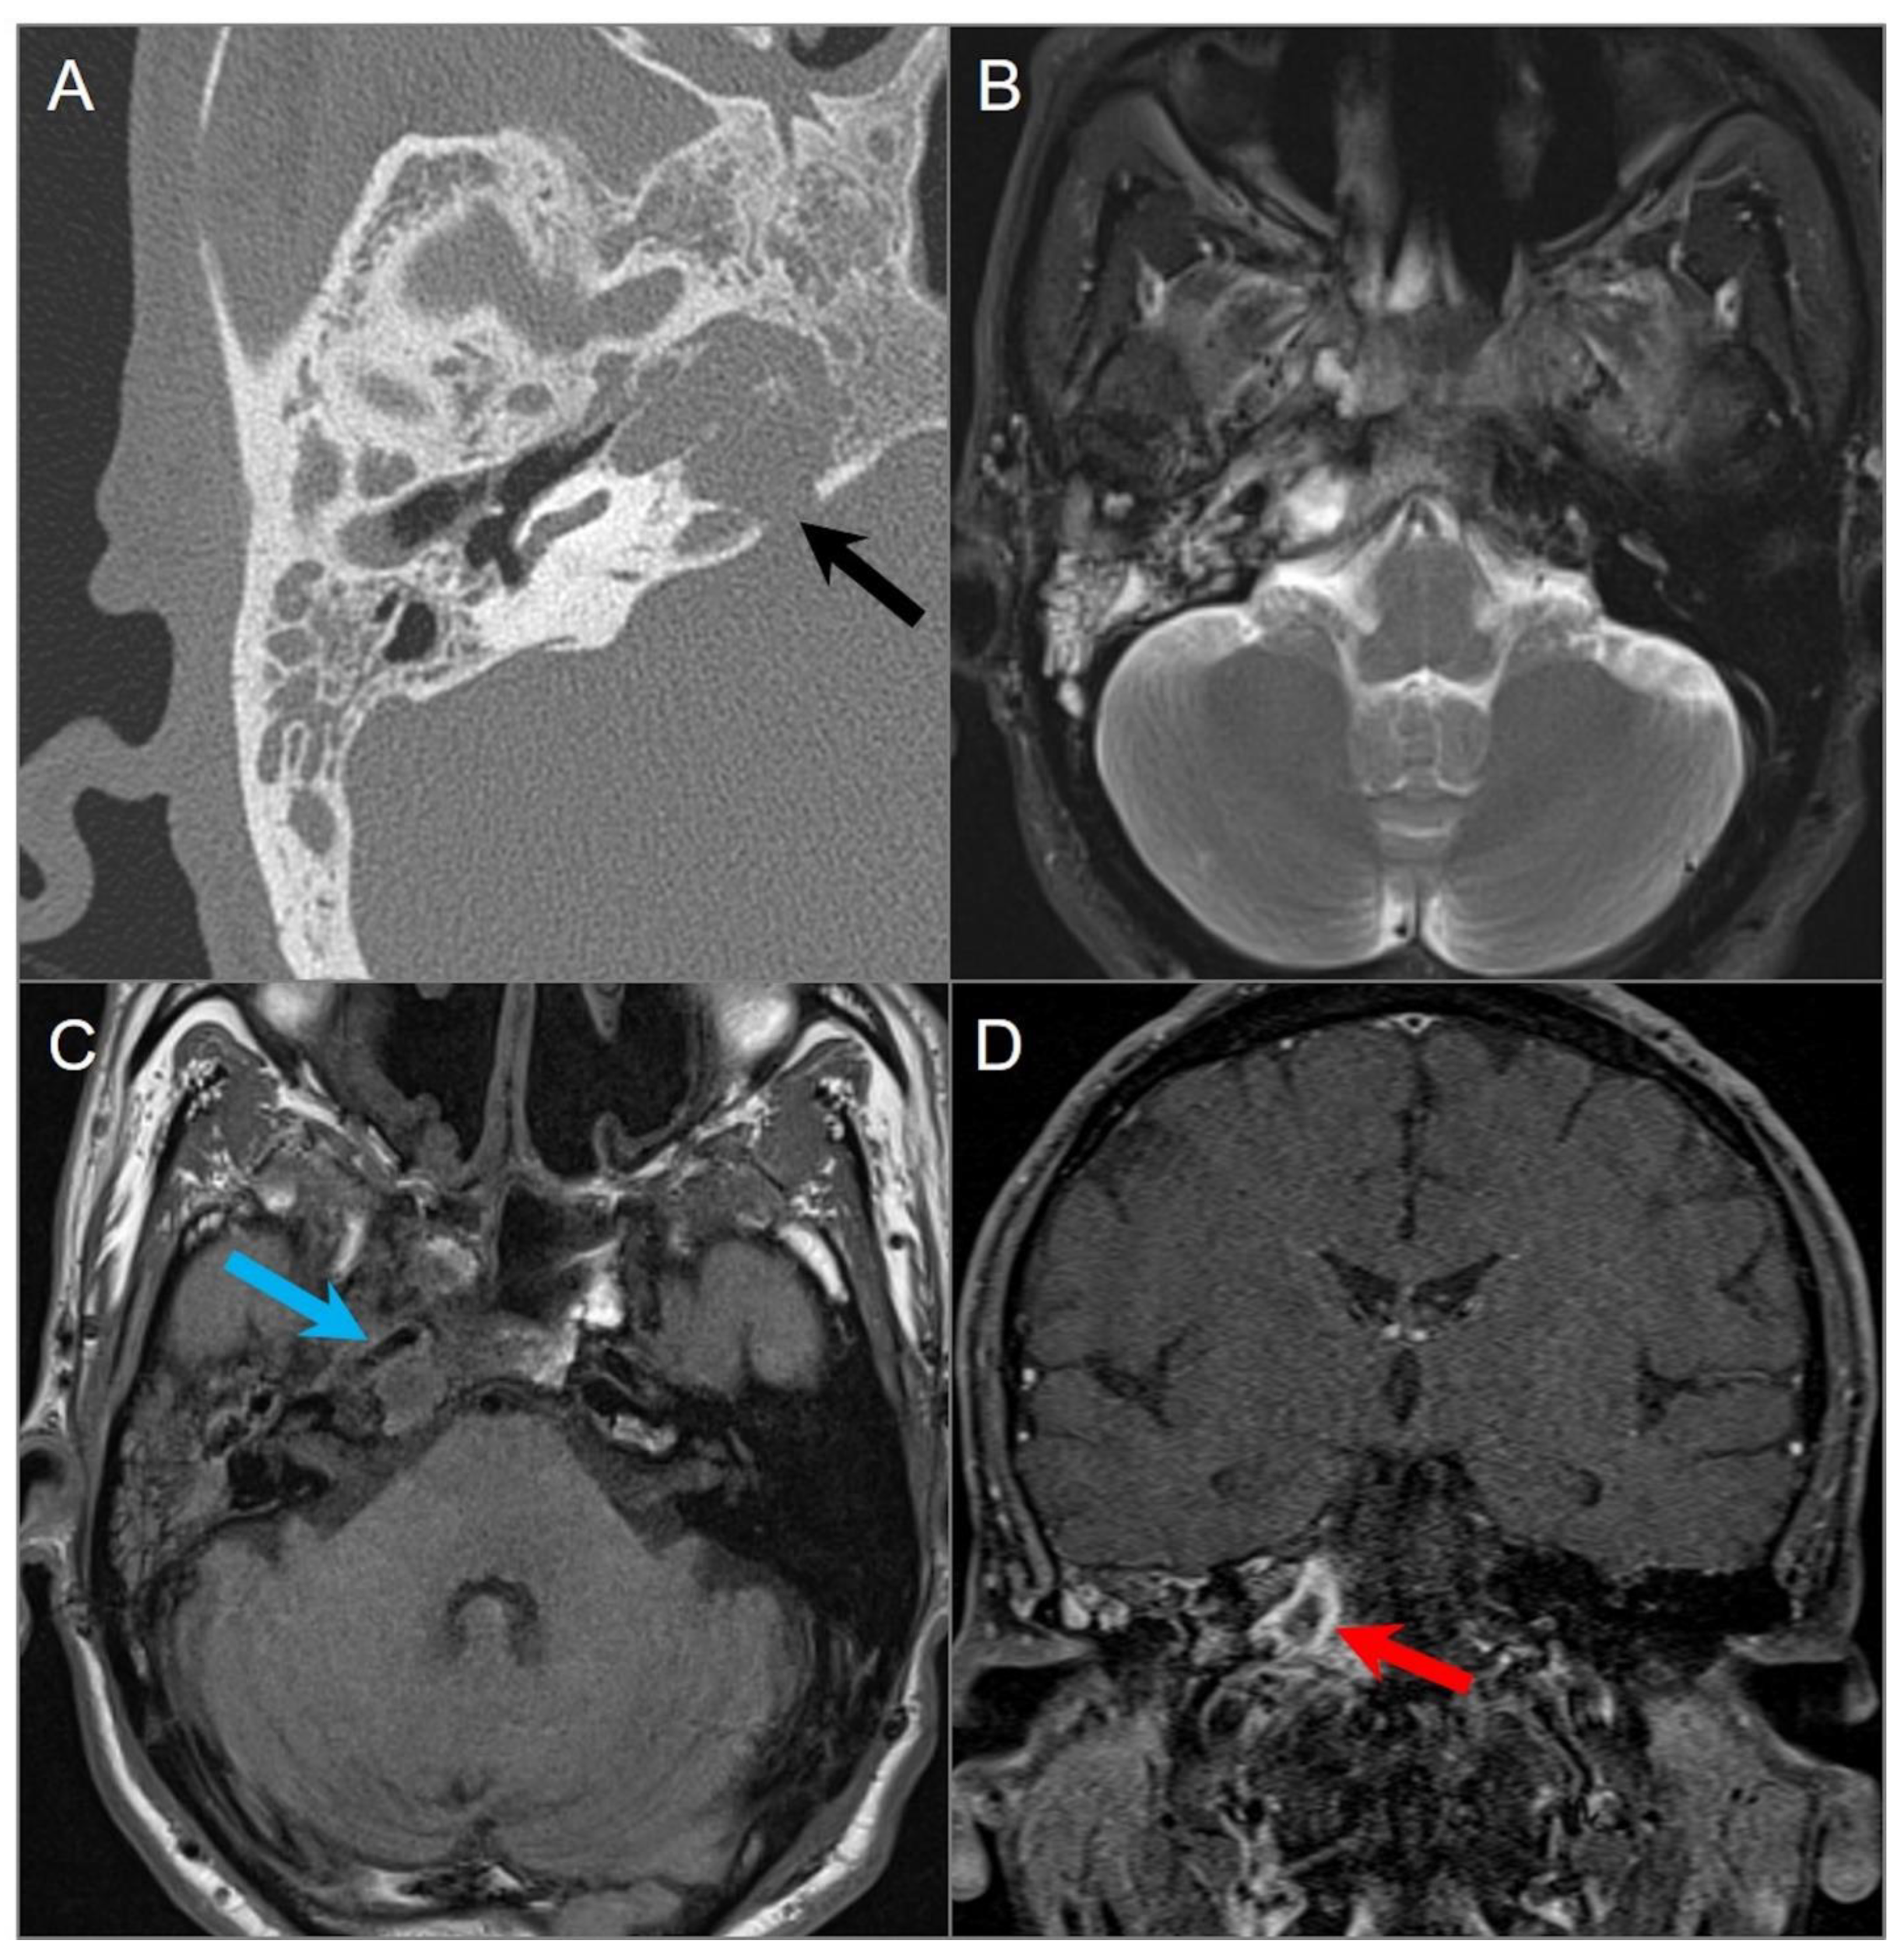
Imaging of Skull Base Tumors

Abstract
1. Introduction
2. Anatomic Considerations
3. Imaging Techniques
4. Skull Base Tumors
4.1. Tumors Occurring in All Regions of the Skull Base
4.1.1. Meningioma
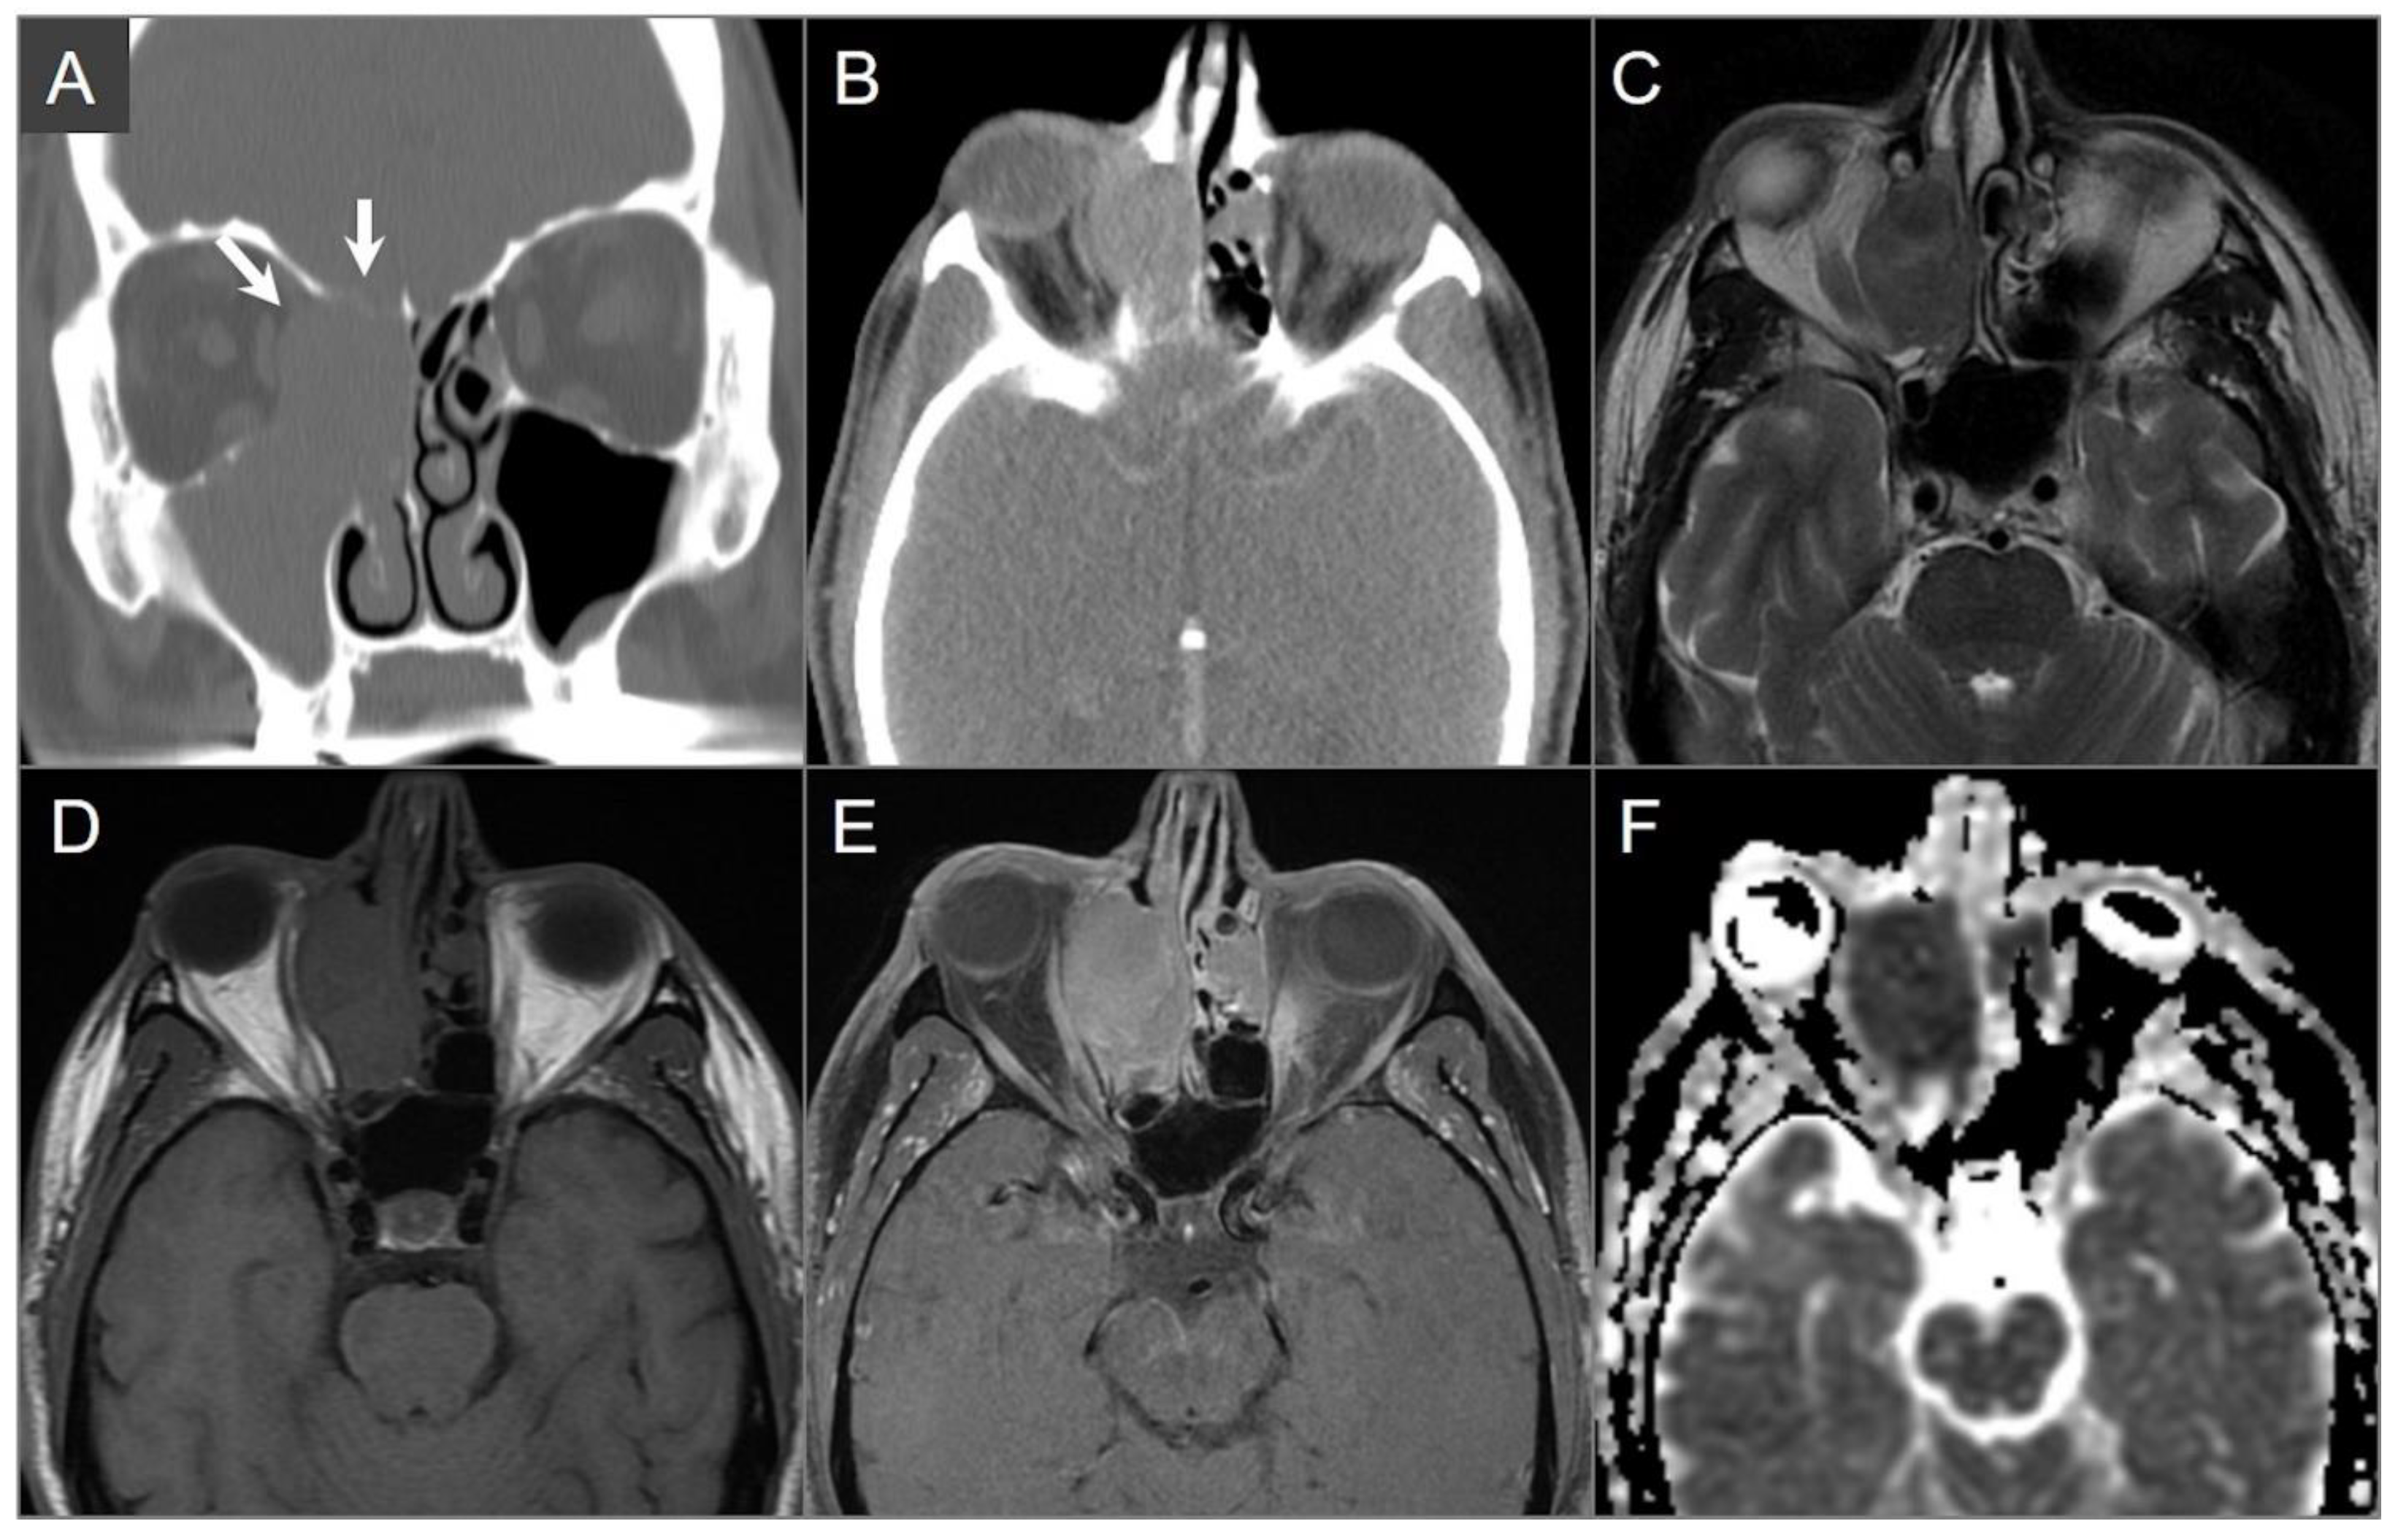
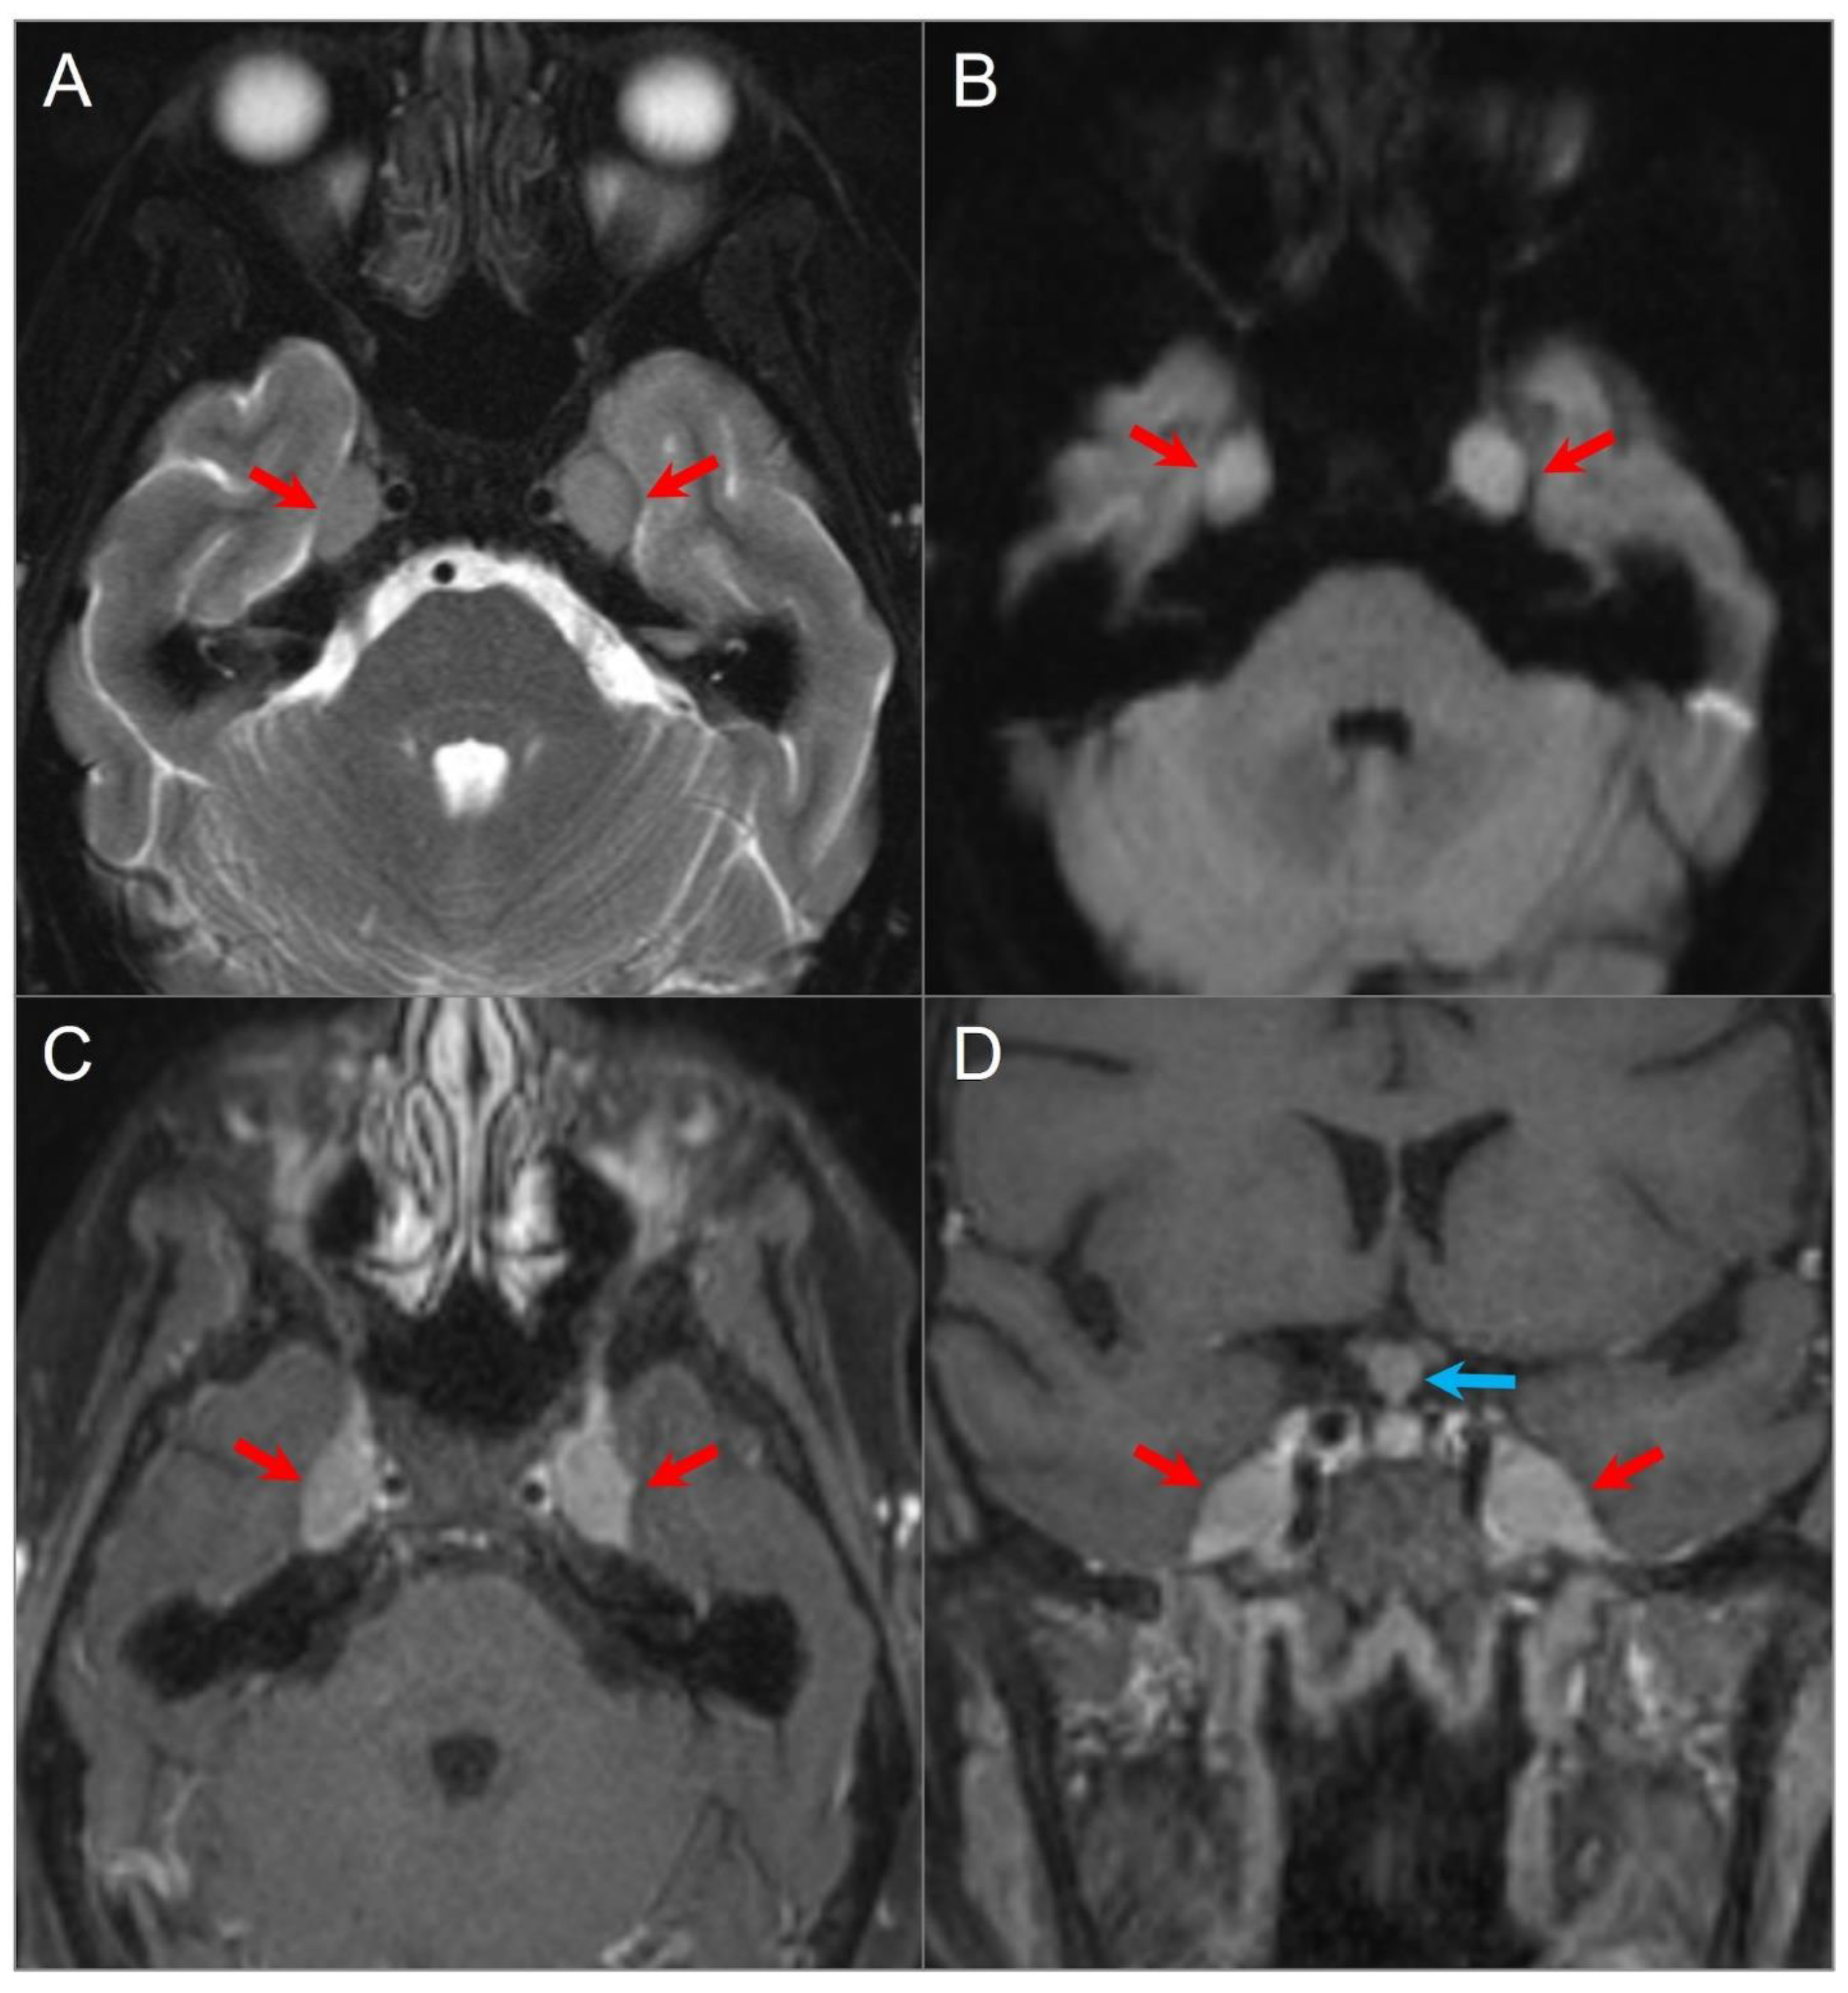
4.1.2. Schwannoma
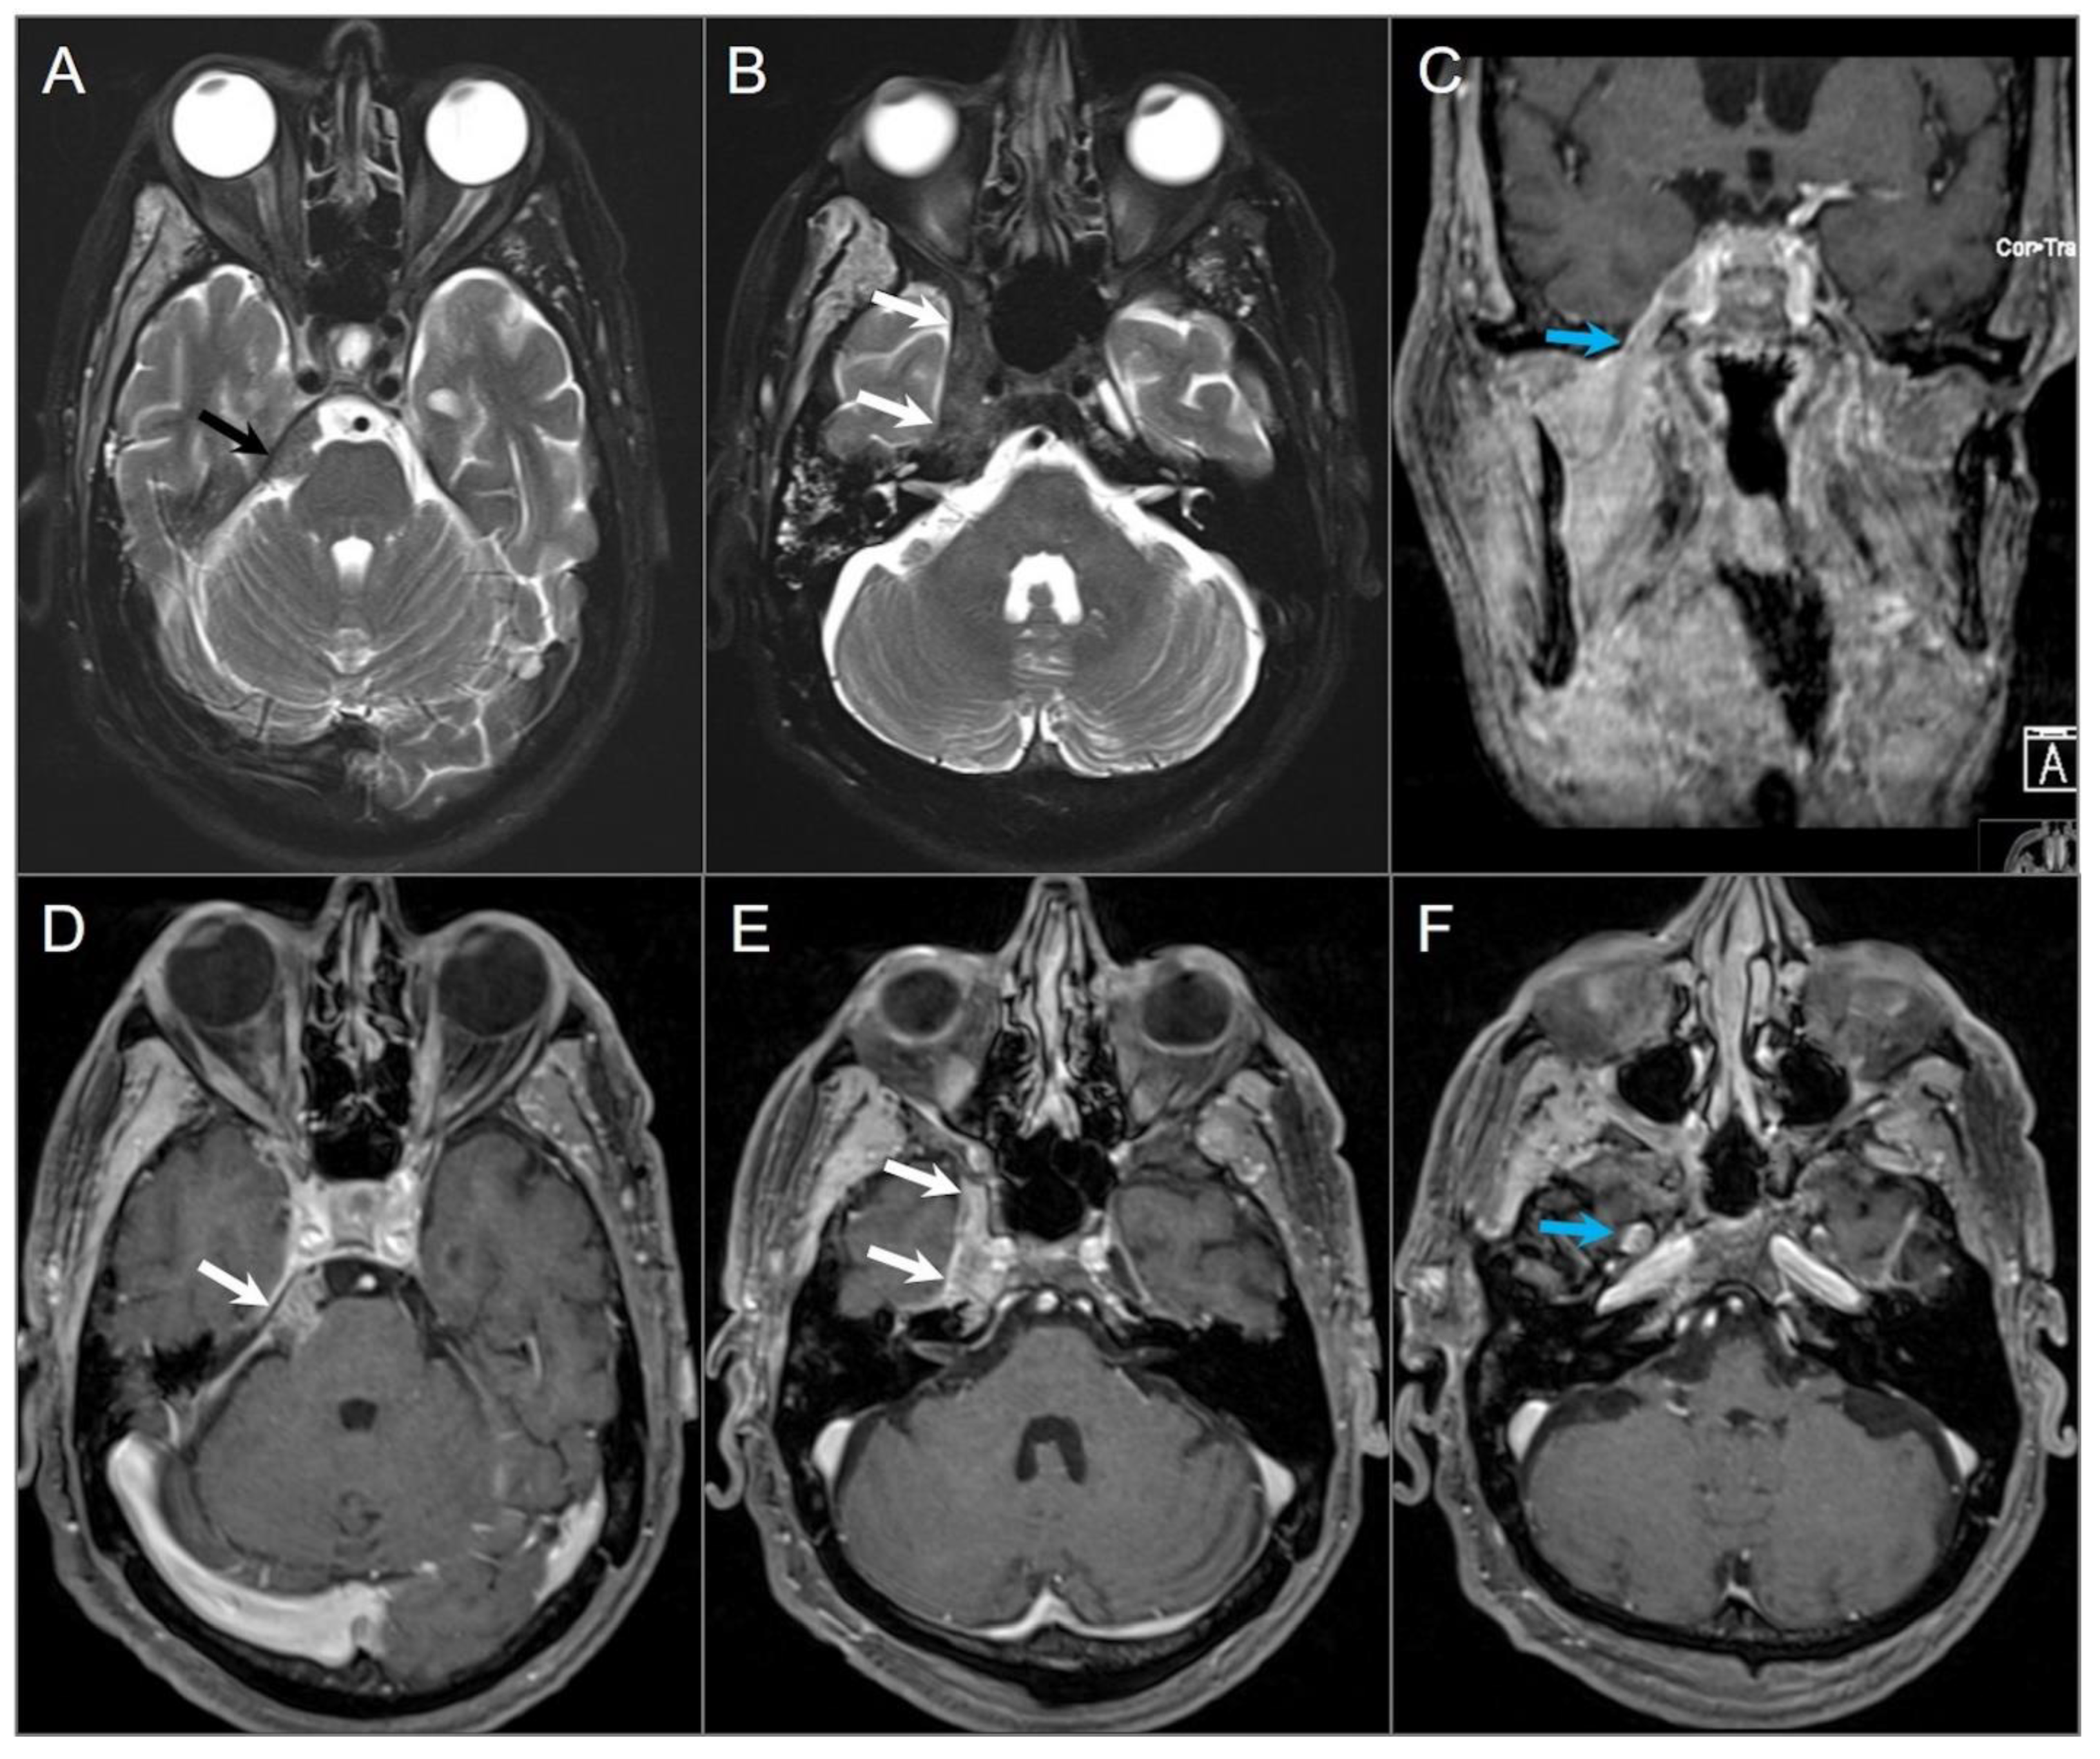
4.1.3. Metastasis
4.1.4. Lymphoma
4.1.5. Extension of Head and Neck Malignancy
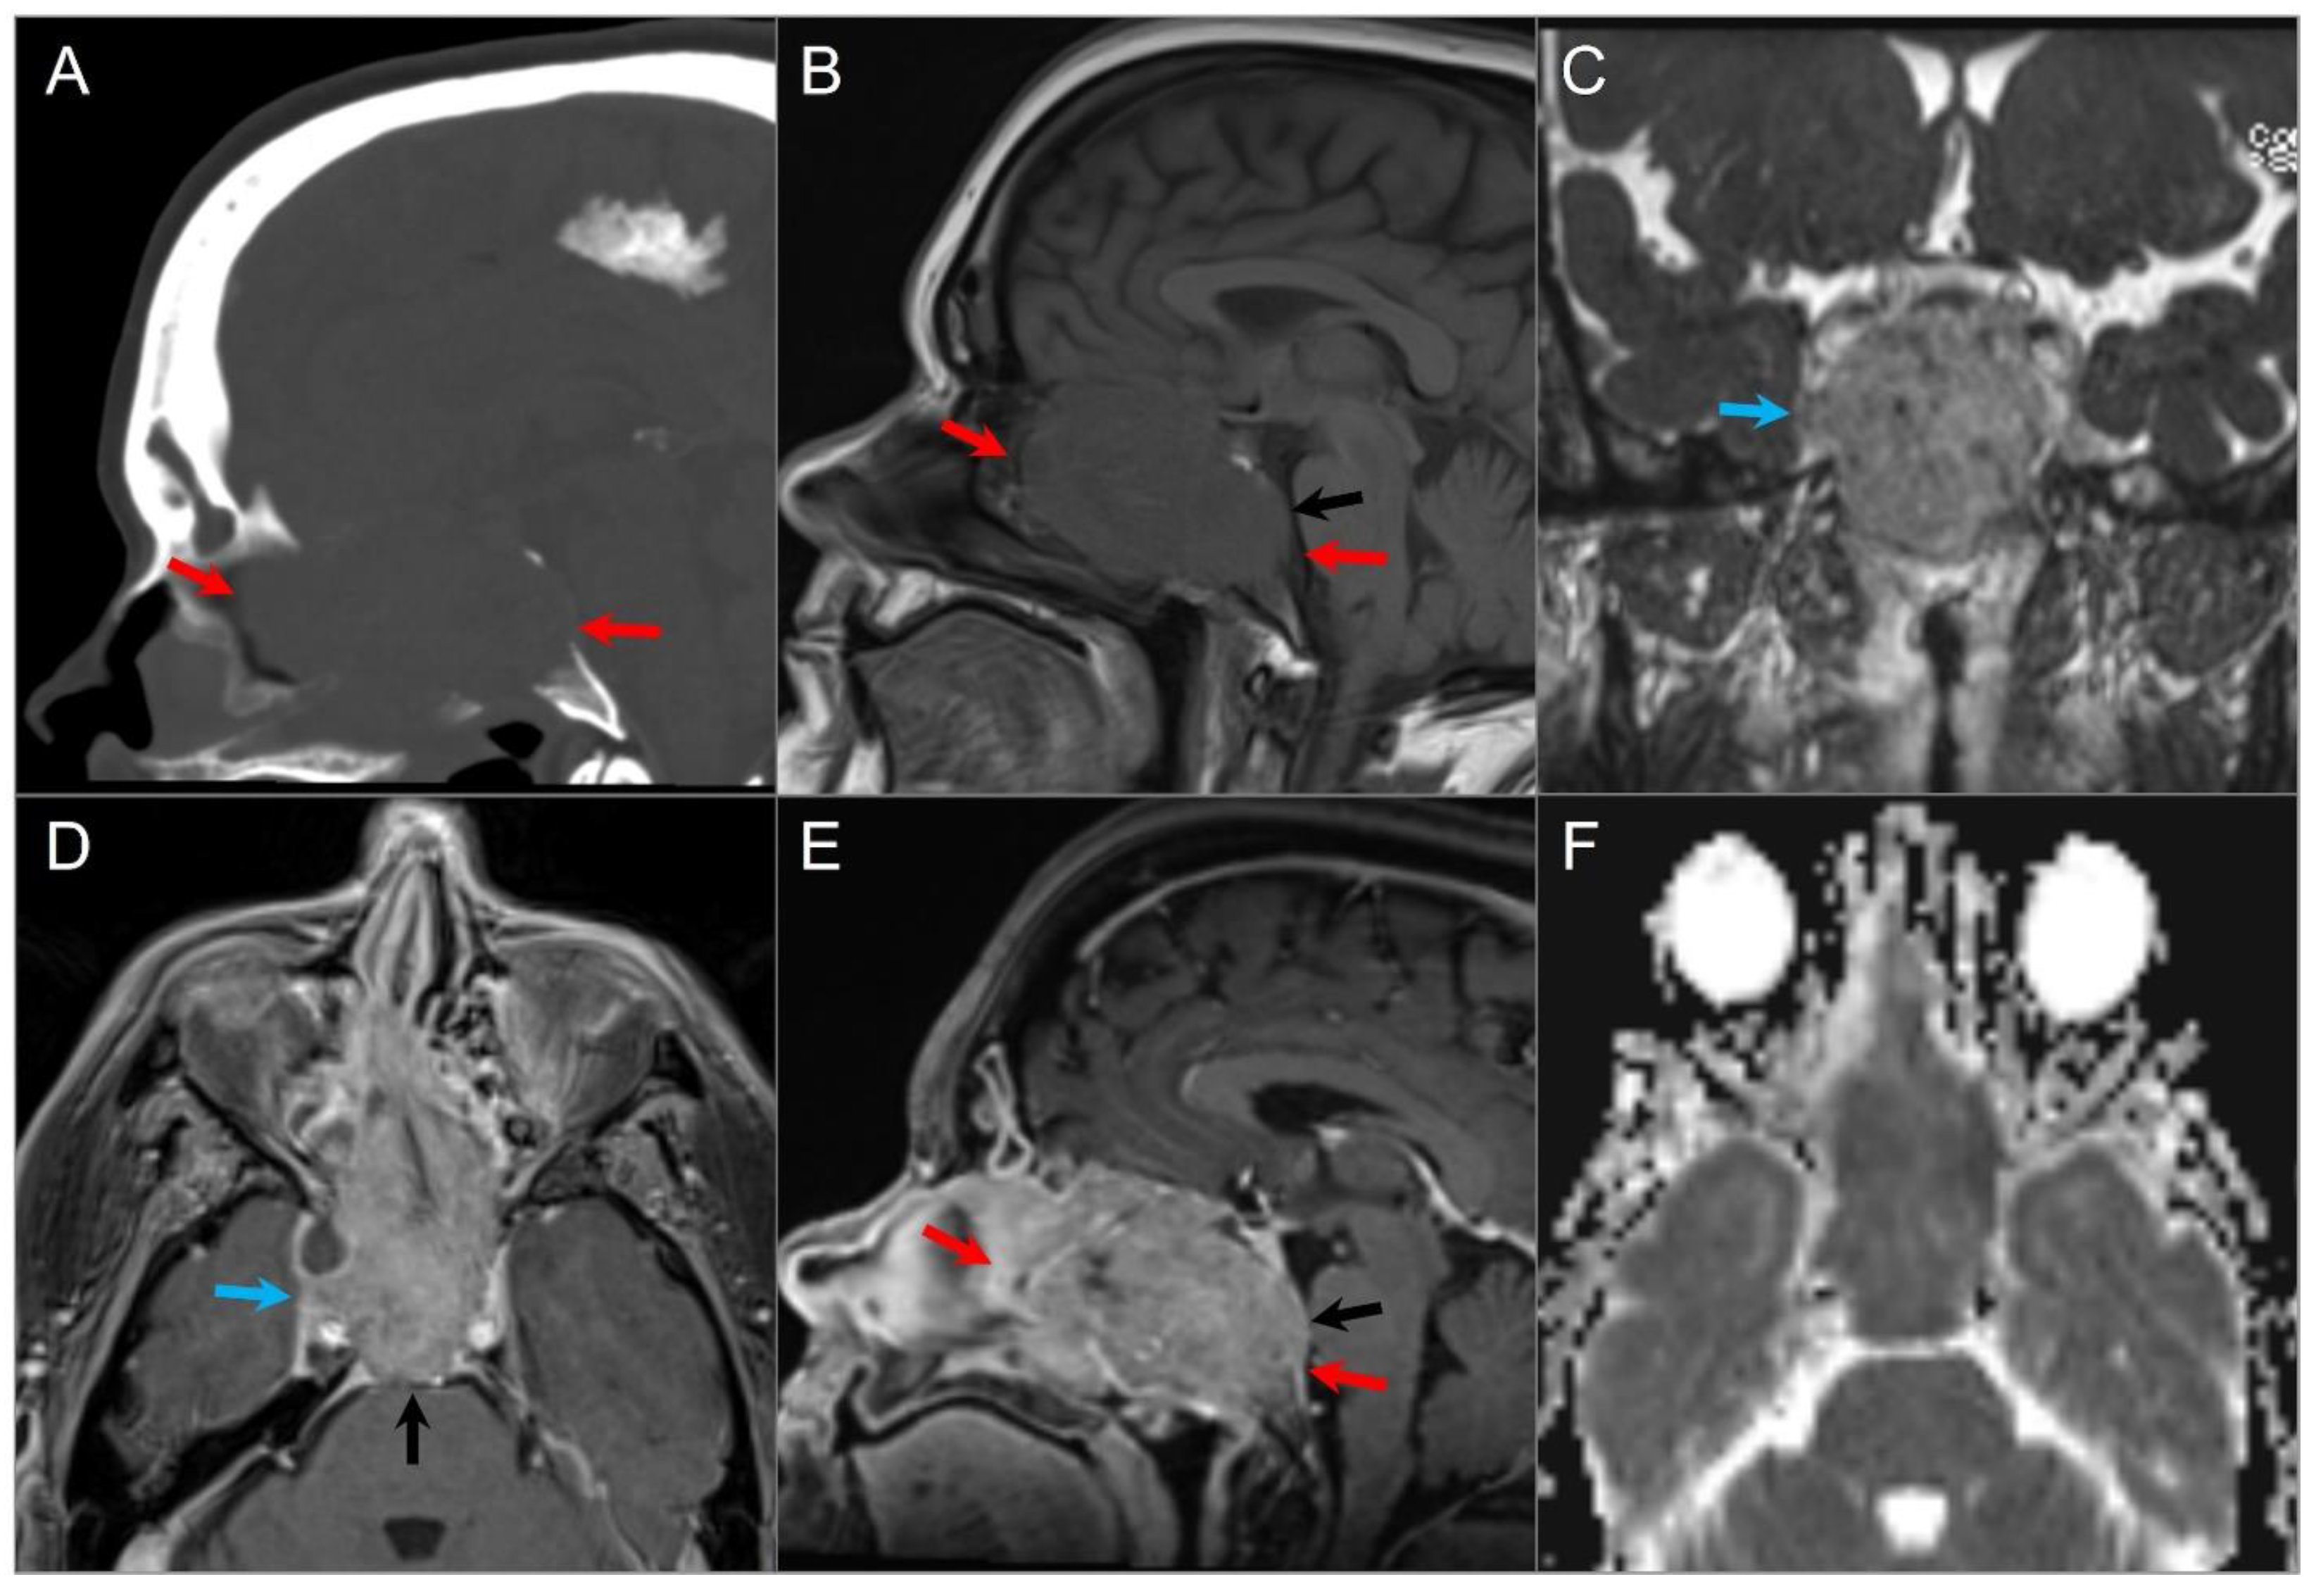
4.1.6. Fibrous Dysplasia
4.1.7. Aneurysmal Bone Cyst
4.1.8. Osteosarcoma
4.2. Anterior Skull Base Tumors
4.2.1. Ossifying Fibroma
4.2.2. Osteoma
4.2.3. Olfactory Neuroblastoma
4.3. Central Skull Base Tumors
4.3.1. Intraosseous/Ectopic Pituitary Adenoma
4.3.2. Craniopharyngioma
4.3.3. Langerhans Cell Histiocytosis
4.3.4. Cholesterol Granuloma
4.4. Posterior Skull Base Tumors
4.4.1. Chordoma
4.4.2. Chondrosarcoma
4.4.3. Plasmacytoma
4.4.4. Endolymphatic Sac Tumor
4.4.5. Paraganglioma
5. Skull Base Tumor Mimics: Developmental Lesions, Anatomic Variations and Pseudotumors
5.1. Arrested Pneumatization
5.2. Asymmetric Petrous Apex Pneumatization
5.3. Arachnoid Granulations
5.4. Cephaloceles
5.5. Sinonasal Mucocele
5.6. Invasive Fungal Sinusitis
5.7. Petrous Apex Trapped Fluid
5.8. Petrous Apicitis
5.9. Paget Disease
5.10. Ecchordosis Physaliphora
5.11. Giant Aneurysm
6. Conclusions
Author Contributions
Funding
Institutional Review Board Statement
Informed Consent Statement
Data Availability Statement
Conflicts of Interest
References
- Thust, S.C.; Yousry, T. Imaging of Skull Base Tumours. Rep. Pract. Oncol. Radiother. 2016, 21, 304–318. [Google Scholar] [CrossRef] [PubMed]
- Casselman, J.W.; Vanden Bossche, S.; Pretorius, E.; De Foer, B. Skull-Base Tumors and Related Disorders. In Clinical Neuroradiology; Barkhof, F., Jager, R., Thurnher, M., Rovira Cañellas, A., Eds.; Springer: Cham, Switzerland, 2019. [Google Scholar] [CrossRef]
- Quirk, B.; Connor, S. Skull Base Imaging, Anatomy, Pathology and Protocols. Pract. Neurol. 2019, 20, 39–49. [Google Scholar] [CrossRef] [PubMed]
- Low, C.M.; Van Gompel, J.J.; Choby, G. Imaging of Anterior and Central Skull Base Tumors: A Review. Curr. Otorhinolaryngol. Rep. 2020, 8, 120–128. [Google Scholar] [CrossRef]
- Kunimatsu, A.; Kunimatsu, N. Skull Base Tumors and Tumor-like Lesions: A Pictorial Review. Pol. J. Radiol. 2017, 82, 398–409. [Google Scholar] [CrossRef] [PubMed]
- Zamora, C.; Castillo, M. Sellar and Parasellar Imaging. Neurosurgery 2017, 80, 17–38. [Google Scholar] [CrossRef]
- Chavhan, G.B.; Babyn, P.S.; Jankharia, B.G.; Cheng, H.-L.M.; Shroff, M.M. Steady-State MR Imaging Sequences: Physics, Classification, and Clinical Applications. Radiographics 2008, 28, 1147–1160. [Google Scholar] [CrossRef]
- Cho, A.A.; Annen, M. Endovascular Embolization of Complex Hypervascular Skull Base Tumors. Oper. Tech. Otolaryngol. Head Neck Surg. 2014, 25, 133–142. [Google Scholar] [CrossRef]
- Majoie, C.B.L.M.; Hulsmans, F.-J.H.; Verbeeten, B.; Castelyns, J.A.; Oldenburger, F.; Schouwenburg, P.F.; Bosch, D. Andries. Perineural Tumor Extension along the Trigeminal Nerve: Magnetic Resonance Imaging Findings. Eur. J. Radiol. 1997, 24, 191–205. [Google Scholar] [CrossRef]
- Ginat, D.T.; Mangla, R.; Yeaney, G.; Ekholm, S. Diffusion-weighted imaging of skull lesions. J. Neurol. Surg. Part B Skull Base 2014, 75, 204–213. [Google Scholar]
- Blitz, A.M.; Macedo, L.L.; Chonka, Z.D.; Ilica, A.T.; Choudhri, A.F.; Gallia, G.L.; Aygun, N. High-Resolution CISS MR Imaging with and without Contrast for Evaluation of the Upper Cranial Nerves. Neuroimaging Clin. N. Am. 2014, 24, 17–34. [Google Scholar] [CrossRef]
- Hayashi, M.; Chernov, M.F.; Tamura, N.; Yomo, S.; Tamura, M.; Horiba, A.; Izawa, M.; Muragaki, Y.; Iseki, H.; Okada, Y.; et al. Usefulness of the Advanced Neuroimaging Protocol Based on Plain and Gadolinium-Enhanced Constructive Interference in Steady State Images for Gamma Knife Radiosurgery and Planning Microsurgical Procedures for Skull Base Tumors. Acta Neurochir. Suppl. 2012, 116, 167–178. [Google Scholar]
- Benson, J.C.; Carlson, M.L.; Lane, J.I. Non-EPI versus Multishot EPI DWI in Cholesteatoma Detection: Correlation with Operative Findings. AJNR Am. J. Neuroradiol. 2021, 42, 573–577. [Google Scholar] [CrossRef]
- Borges, A.R.; Lufkin, R.B.; Huang, A.Y.; Farahani, K.; Arnold, A.C. Frequency-Selective Fat Suppression MR Imaging. J. Neuro-Ophthalmol. 1997, 17, 12–17. [Google Scholar] [CrossRef]
- Greenberg, H.; Chandler, W.F.; Sandler, H.M. Brain Tumors; Oxford University Press: New York, NY, USA, 1999. [Google Scholar]
- Wallace, E.W. The Dural Tail Sign. Radiology 2004, 233, 56–57. [Google Scholar] [CrossRef] [PubMed]
- Matias, T.B.; Cordeiro, R.A.; Duarte, J.A.; de Jarry, V.M.; Appenzeller, S.; Villarinho, L.; Reis, F. Immune-Mediated Hypertrophic Pachymeningitis and its Mimickers: Magnetic Resonance Imaging Findings. Acad. Radiol. 2023, S1076-6332(23)00034-X. [Google Scholar] [CrossRef] [PubMed]
- Skolnik, A.D.; Loevner, L.A.; Sampathu, D.M.; Newman, J.G.; Lee, J.Y.; Bagley, L.J.; Learned, K.O. Cranial Nerve Schwannomas: Diagnostic Imaging Approach. Radiographics 2016, 36, 1463–1477. [Google Scholar] [CrossRef] [PubMed]
- Chowdhury, F.H.; Haque, M.R.; Kawsar, K.A.; Sarker, M.H.; Hasan, M.; Goel, A.H. Intracranial Nonvestibular Neurinomas: Young Neurosurgeons′ Experience. J. Neurosci. Rural Pract. 2014, 5, 231–243. [Google Scholar] [CrossRef] [PubMed]
- Moffat, D.A.; Ballagh, R.H. Rare Tumours of the Cerebellopontine Angle. Clin. Oncol. 1995, 7, 28–41. [Google Scholar] [CrossRef]
- Farid, N. Imaging of Vestibular Schwannoma and Other Cerebellopontine Angle Tumors. Oper. Tech. Otolaryngol. Head Neck Surg. 2014, 25, 87–95. [Google Scholar] [CrossRef]
- Nikolopoulos, T.P.; Fortnum, H.; O’Donoghue, G.; Baguley, D. Acoustic Neuroma Growth: A Systematic Review of the Evidence. Otol. Neurotol. 2010, 31, 478–485. [Google Scholar] [CrossRef]
- MacNally, S.P.; Rutherford, S.A.; Ramsden, R.T.; Evans, D.G.; King, A.T. Trigeminal Schwannomas. Br. J. Neurosurg. 2008, 22, 729–738. [Google Scholar] [CrossRef] [PubMed]
- Zhang, L.; Yang, Y.; Xu, S.; Wang, J.; Liu, Y.; Zhu, S. Trigeminal Schwannomas: A Report of 42 Cases and Review of the Relevant Surgical Approaches. Clin. Neurol. Neurosurg. 2009, 111, 261–269. [Google Scholar] [CrossRef] [PubMed]
- Liu, X.-D.; Xu, Q.-W.; Che, X.-M.; Yang, D.-L. Trigeminal Neurinomas: Clinical Features and Surgical Experience in 84 Patients. Neurosurg. Rev. 2009, 32, 435–444. [Google Scholar] [CrossRef]
- Buhl, R.; Barth, H.; Hugo, H.H.; Mautner, V.F.; Mehdorn, H.M. Intracranial and Spinal Melanotic Schwannoma in the Same Patient. J. Neuro-Oncol. 2004, 68, 249–254. [Google Scholar] [CrossRef]
- Dahlen, R.T.; Johnson, C.E.; Harnsberger, H.R.; Biediger, C.P.; Syms, C.A.; Fischbein, N.J.; Schwartz, J.M. CT and MR imaging characteristics of intravestibular lipoma. Am. J. Neuroradiol. 2002, 23, 1413–1417. [Google Scholar]
- Laigle-Donadey, F.; Taillibert, S.; Martin-Duverneuil, N.; Hildebrand, J.; Delattre, J.-Y. Skull-Base Metastases. J. Neuro-Oncol. 2005, 75, 63–69. [Google Scholar] [CrossRef]
- Slone, H.W.; Blake, J.J.; Shah, R.; Guttikonda, S.; Bourekas, E.C. CT and MRI findings of intracranial lymphoma. AJR. Am. J. Roentgenol. 2005, 184, 1679–1685. [Google Scholar] [CrossRef]
- Schwingel, R.; Reis, F.; Zanardi, V.A.; Queiroz, L.S.; França, M.C., Jr. Central nervous system lymphoma: Magnetic resonance imaging features at presentation. Arq. Neuro-Psiquiatr. 2012, 70, 97–101. [Google Scholar] [CrossRef]
- DePeña, C.A.; Van Tassel, P.; Lee, Y.Y. Lymphoma of the head and neck. Radiol. Clin. N. Am. 1990, 28, 723–743. [Google Scholar] [CrossRef] [PubMed]
- Madani, G.; Beale, T.J.; Lund, V.J. Imaging of Sinonasal Tumors. Semin. Ultrasound CT MRI 2009, 30, 25–38. [Google Scholar] [CrossRef] [PubMed]
- Acqui, M.; Cimatti, M.; Caruso, R.; Wierzbicki, V.; Raco, A.; Pesce, A. Primary Lymphomas of the Skull Base from a Neurosurgical Perspective: Review of the Literature and Personal Experience. J. Neurol. Surg. Part A Cent. Eur. Neurosurg. 2016, 78, 60–66. [Google Scholar] [CrossRef]
- Chang, P.C.; Fischbein, N.J.; McCalmont, T.H.; Kashani-Sabet, M.; Zettersten, E.M.; Liu, A.Y.; Weissman, J.L. Perineural Spread of Malignant Melanoma of the Head and Neck: Clinical and Imaging Features. Am. J. Neuroradiol. 2004, 25, 5–11. [Google Scholar] [CrossRef]
- Parker, G.D.; Harnsberger, H.R. Clinical-Radiologic Issues in Perineural Tumor Spread of Malignant Diseases of the Extracranial Head and Neck. Radiographics 1991, 11, 383–399. [Google Scholar] [CrossRef]
- WHO Classification of Tumours Editorial Board. Soft Tissue and Bone Tumours, 5th ed.; WHO Classification of Tumours Series; International Agency for Research on Cancer: Lyon, France, 2020; Volume 3.
- Kushchayeva, Y.S.; Kushchayev, S.V.; Glushko, T.Y.; Tella, S.H.; Teytelboym, O.M.; Collins, M.T.; Boyce, A.M. Fibrous Dysplasia for Radiologists: Beyond Ground Glass Bone Matrix. Insights Into Imaging 2018, 9, 1035–1056. [Google Scholar] [CrossRef]
- Casselman, J.W.; De Jonge, I.; Neyt, L.; De Clercq, C.; D’Hont, G. MRI in Craniofacial Fibrous Dysplasia. Neuroradiology 1993, 35, 234–237. [Google Scholar] [CrossRef]
- Iida, E.; Anzai, Y. Imaging of Paranasal Sinuses and Anterior Skull Base and Relevant Anatomic Variations. Radiol. Clin. N. Am. 2017, 55, 31–52. [Google Scholar] [CrossRef]
- Lichtenstein, L. Aneurysmal bone cyst: A pathological entity commonly mistaken for giant cell tumor and occasionally for hemangioma and osteogenic sarcoma. Cancer 1950, 3, 279–289. [Google Scholar] [CrossRef]
- Biesecker, J.L.; Marcove, R.C.; Huvos, A.G.; Miké, V. Aneurysmal bone cysts. A clinicopathologic study of 66 cases. Cancer 1970, 26, 615–625. [Google Scholar] [CrossRef] [PubMed]
- Panoutsakopoulos, G.; Pandis, N.; Kyriazoglou, I.; Gustafson, P.; Mertens, F.; Mandahl, N. Recurrent t(16;17)(q22;p13) in aneurysmal bone cysts. Genes Chromosom. Cancer 1999, 26, 265–266. [Google Scholar] [CrossRef]
- Restrepo, R.; Zahrah, D.; Pelaez, L.; Temple, H.T.; Murakami, J.W. Update on aneurysmal bone cyst: Pathophysiology, histology, imaging and treatment. Pediatr. Radiol. 2022, 52, 1601–1614. [Google Scholar] [CrossRef]
- Hudson, T. Fluid Levels in Aneurysmal Bone Cysts: A CT Feature. Am. J. Roentgenol. 1984, 142, 1001–1004. [Google Scholar] [CrossRef] [PubMed]
- Caro, P.A.; Mandell, G.A.; Stanton, R.P. Aneurysmal Bone Cyst of the Spine in Children. MRI Imaging at 0.5 Tesla. Pediatr. Radiol. 1991, 21, 114–116. [Google Scholar] [CrossRef] [PubMed]
- Hermann, A.-L.; Polivka, M.; Loit, M.-P.; Guichard, J.-P.; Bousson, V. Aneurysmal Bone Cyst of the Frontal Bone—A Radiologic-Pathologic Correlation. J. Radiol. Case Rep. 2018, 12, 16–24. [Google Scholar] [CrossRef] [PubMed]
- Aghaghazvini, L.; Sedighi, N.; Karami, P.; Yeganeh, O. Skull Base Aneurysmal Bone Cyst Presented with Foramen Jugular Syndrome and Multi-Osseous Involvement. Iran. J. Radiol. 2012, 9, 157–160. [Google Scholar] [CrossRef] [PubMed]
- Kim, S.; Jung, D.W.; Pak, M.G.; Song, Y.J.; Bae, W.Y. An Aneurysmal Bone Cyst in the Skull Base. J. Craniofacial Surg. 2017, 28, e704–e706. [Google Scholar] [CrossRef] [PubMed]
- Gangadhar, K.; Santhosh, D. Radiopathological Evaluation of Primary Malignant Skull Tumors: A Review. Clin. Neurol. Neurosurg. 2012, 114, 833–839. [Google Scholar] [CrossRef] [PubMed]
- O’Neill, J.P.; Bilsky, M.H.; Kraus, D. Head and Neck Sarcomas. Neurosurg. Clin. N. Am. 2013, 24, 67–78. [Google Scholar] [CrossRef] [PubMed]
- Salina, A.C.I.; de Souza, P.M.M.; da Gadelha, C.C.M.; Aguiar, L.B.; de Castro, J.D.V.; Barreto, A.R.F. Ossifying Fibroma: An Uncommon Differential Diagnosis for T2-Hypointense Sinonasal Masses. Radiol. Case Rep. 2017, 12, 313–317. [Google Scholar] [CrossRef]
- Connor, S.E.J. The Skull Base in the Evaluation of Sinonasal Disease. Neuroimaging Clin. N. Am. 2015, 25, 619–651. [Google Scholar] [CrossRef]
- Dulguerov, P.; Allal, A.S.; Calcaterra, T.C. Esthesioneuroblastoma: A Meta-Analysis and Review. Lancet Oncol. 2001, 2, 683–690. [Google Scholar] [CrossRef]
- Kadish, S.; Goodman, M.; Wang, C.C. Olfactory neuroblastoma. A clinical analysis of 17 cases. Cancer 1976, 37, 1571–1576. [Google Scholar] [CrossRef]
- Pickuth, D.; Heywang-Köbrunner, S.H.; Spielmann, R.P. Computed tomography and magnetic resonance imaging features of olfactory neuroblastoma: An analysis of 22 cases. Clin. Otolaryngol. Allied Sci. 1999, 24, 457–461. [Google Scholar] [CrossRef]
- Morita, A.; Ebersold, M.J.; Olsen, K.D.; Foote, R.L.; Lewis, J.E.; Quast, L.M. Esthesioneuroblastoma: Prognosis and management. Neurosurgery 1993, 32, 706–715. [Google Scholar] [CrossRef]
- Biller, H.F.; Lawson, W.; Sachdev, V.P.; Som, P. Esthesioneuroblastoma: Surgical treatment without radiation. Laryngoscope 1990, 100, 1199–1201. [Google Scholar] [CrossRef]
- Dulguerov, P.; Calcaterra, T. Esthesioneuroblastoma: The UCLA experience 1970–1990. Laryngoscope 1992, 102, 843–849. [Google Scholar] [CrossRef] [PubMed]
- Yu, T.; Xu, Y.-K.; Li, L.; Jia, F.-G.; Duan, G.; Wu, Y.-K.; Li, H.-Y.; Yang, R.-M.; Feng, J.; Ye, X.-H.; et al. Esthesioneuroblastoma Methods of Intracranial Extension: CT and MR Imaging Findings. Neuroradiology 2009, 51, 841–850. [Google Scholar] [CrossRef]
- Fischbein, N.J.; Barkovich, A.J.; Dillon, W.P.; Stone, J.A. Teaching Atlas of Brain Imaging; Thieme: New York, NY, USA, 2000. [Google Scholar]
- Borges, A. Skull Base Tumors: Part II. Central Skull Base Tumors and Intrinsic Tumors of the Bony Skull Base. Clin. Imaging 2008, 32, 493. [Google Scholar] [CrossRef]
- Inagawa, H.; Ishizawa, K.; Mitsuhashi, T.; Shimizu, M.; Adachi, J.; Nishikawa, R.; Matsutani, M.; Hirose, T. Giant Invasive Pituitary Adenoma Extending into the Sphenoid Sinus and Nasopharynx. Acta Cytol. 2005, 49, 452–456. [Google Scholar] [CrossRef] [PubMed]
- Fernandez-Miranda, J.C.; Gardner, P.A.; Snyderman, C.H.; Devaney, K.O.; Strojan, P.; Suárez, C.; Genden, E.M.; Rinaldo, A.; Ferlito, A. Craniopharyngioma: A Pathologic, Clinical, and Surgical Review. Head Neck 2012, 34, 1036–1044. [Google Scholar] [CrossRef]
- Bunin, G.R.; Surawicz, T.S.; Witman, P.A.; Preston-Martin, S.; Davis, F.; Bruner, J.M. The Descriptive Epidemiology of Craniopharyngioma. J. Neurosurg. 1998, 89, 547–551. [Google Scholar] [CrossRef]
- Ostrom, Q.T.; de Blank, P.M.; Kruchko, C.; Petersen, C.M.; Liao, P.; Finlay, J.L.; Stearns, D.S.; Wolff, J.E.; Wolinsky, Y.; Letterio, J.J.; et al. Alex’s Lemonade Stand Foundation Infant and Childhood Primary Brain and Central Nervous System Tumors Diagnosed in the United States in 2007–2011. Neuro-Oncol. 2014, 16 (Suppl. S10), x1–x36. [Google Scholar] [CrossRef] [PubMed]
- Müller, H.L. Craniopharyngioma. Endocr. Rev. 2014, 35, 513–543. [Google Scholar] [CrossRef] [PubMed]
- Arceci, R.J.; Hann, I.M.; Smith, O.P. Pediatric Hematology; John Wiley & Sons: Hoboken, NJ, USA, 2008. [Google Scholar]
- Schmidt, S.; Eich, G.; Geoffray, A.; Hanquinet, S.; Waibel, P.; Wolf, R.; Letovanec, I.; Alamo-Maestre, L.; Gudinchet, F. Extraosseous Langerhans Cell Histiocytosis in Children. Radiographics 2008, 28, 707–726. [Google Scholar] [CrossRef]
- D’Ambrosio, N.; Soohoo, S.; Warshall, C.; Johnson, A.; Karimi, S. Craniofacial and Intracranial Manifestations of Langerhans Cell Histiocytosis: Report of Findings in 100 Patients. Am. J. Roentgenol. 2008, 191, 589–597. [Google Scholar] [CrossRef]
- Razek, A.A.; Huang, B.Y. Lesions of the Petrous Apex: Classification and Findings at CT and MR Imaging. Radiographics 2012, 32, 151–173. [Google Scholar] [CrossRef]
- Chapman, P.R.; Shah, R.; Curé, J.K.; Bag, A.K. Petrous Apex Lesions:Pictorial Review. Am. J. Roentgenol. 2011, 196 (Suppl. S3), WS26–WS37. [Google Scholar] [CrossRef]
- Murphey, M.D.; Andrews, C.L.; Flemming, D.J.; Temple, H.T.; Smith, W.S.; Smirniotopoulos, J.G. From the Archives of the AFIP. Primary Tumors of the Spine: Radiologic Pathologic Correlation. Radiographics 1996, 16, 1131–1158. [Google Scholar] [CrossRef]
- Erdem, E.; Angtuaco, E.C.; Van Hemert, R.; Park, J.S.; Al-Mefty, O. Comprehensive Review of Intracranial Chordoma. Radiographics 2003, 23, 995–1009. [Google Scholar] [CrossRef]
- Conley, L.M.; Phillips, C.D. Imaging of the Central Skull Base. Radiol. Clin. N. Am. 2017, 55, 53–67. [Google Scholar] [CrossRef] [PubMed]
- Ulici, V.; Hart, J. Chordoma. Arch. Pathol. Lab. Med. 2022, 146, 386–395. [Google Scholar] [CrossRef] [PubMed]
- Raut, A.A.; Naphade, P.S.; Chawla, A. Imaging of Skull Base: Pictorial Essay. Indian J. Radiol. Imaging 2012, 22, 305–316. [Google Scholar] [CrossRef]
- Lustig, L.R.; Sciubba, J.; Holliday, M.J. Chondrosarcomas of the Skull Base and Temporal Bone. J. Laryngol. Otol. 2007, 121, 725–735. [Google Scholar] [CrossRef]
- Lee, Y.Y.; Van Tassel, P. Craniofacial chondrosarcomas: Imaging findings in 15 untreated cases. AJNR Am. J. Neuroradiol. 1989, 10, 165–170. [Google Scholar]
- Yeom, K.W.; Lober, R.M.; Mobley, B.C.; Harsh, G.; Vogel, H.; Allagio, R.; Pearson, M.; Edwards, M.S.B.; Fischbein, N.J. Diffusion-Weighted MRI: Distinction of Skull Base Chordoma from Chondrosarcoma. Am. J. Neuroradiol. 2013, 34, 1056–1061. [Google Scholar] [CrossRef]
- Cerase, A.; Tarantino, A.; Gozzetti, A.; Muccio, C.F.; Gennari, P.; Monti, L.; Di Blasi, A.; Venturi, C. Intracranial Involvement in Plasmacytomas and Multiple Myeloma: A Pictorial Essay. Neuroradiology 2008, 50, 665–674. [Google Scholar] [CrossRef]
- Na’ara, S.; Amit, M.; Gil, Z.; Billan, S. Plasmacytoma of the Skull Base: A Meta-Analysis. J. Neurol. Surg. Part B Skull Base 2016, 77, 61–65. [Google Scholar] [CrossRef] [PubMed]
- Wein, R.; Popat, S.; Doerr, T.; Dutcher, P. Plasma Cell Tumors of the Skull Base: Four Case Reports and Literature Review. Skull Base 2004, 12, 77–86. [Google Scholar] [CrossRef]
- Agarwal, A. Neuroimaging of Plasmacytoma. A pictorial review. Neuroradiol. J. 2014, 27, 431–437. [Google Scholar] [CrossRef] [PubMed]
- Ganeshan, D.; Menias, C.O.; Pickhardt, P.J.; Sandrasegaran, K.; Lubner, M.G.; Ramalingam, P.; Bhalla, S. Tumors in von Hippel-Lindau Syndrome: From Head to Toe-Comprehensive State-of-the-Art Review. Radiogr. A Rev. Publ. Radiol. Soc. N. Am. Inc. 2018, 38, 849–866. [Google Scholar]
- Dornbos, D., 3rd; Kim, H.J.; Butman, J.A.; Lonser, R.R. Review of the Neurological Implications of von Hippel-Lindau Disease. JAMA Neurol. 2018, 75, 620–627. [Google Scholar] [CrossRef]
- Lonser, R.R.; Kim, H.J.; Butman, J.A.; Vortmeyer, A.O.; Choo, D.I.; Oldfield, E.H. Tumors of the endolymphatic sac in von Hippel-Lindau disease. N. Engl. J. Med. 2004, 350, 2481–2486. [Google Scholar] [CrossRef]
- Patel, N.P.; Wiggins, R.H.; Shelton, C. The Radiologic Diagnosis of Endolymphatic Sac Tumors. Laryngoscope 2006, 116, 40–46. [Google Scholar] [CrossRef] [PubMed]
- Rao, A.B.; Koeller, K.K.; Adair, C.F. From the Archives of the AFIP. Paragangliomas of the Head and Neck: Radiologic-Pathologic Correlation. Armed Forces Institute of Pathology. Radiographics 1999, 19, 1605–1632. [Google Scholar] [CrossRef] [PubMed]
- Vogl, T.; Bisdas, S. Differential Diagnosis of Jugular Foramen Lesions. Skull Base 2009, 19, 3–16. [Google Scholar] [CrossRef] [PubMed]
- Tuan, A.S.; Chen, J.Y.; Mafee, M.F. Glomus Tympanica and Other Intratympanic Masses: Role of Imaging. Oper. Tech. Otolaryngol. Head Neck Surg. 2014, 25, 49–57. [Google Scholar] [CrossRef]
- Rigby, P.L.; Jackler, R.K. Clinicopathologic Presentation and Diagnostic Imaging of Jugular Foramen Tumors. Oper. Tech. Otolaryngol. Head Neck Surg. 1996, 7, 99–105. [Google Scholar] [CrossRef]
- Welker, K.M.; DeLone, D.R.; Lane, J.I.; Gilbertson, J.R. Arrested Pneumatization of the Skull Base: Imaging Characteristics. Am. J. Roentgenol. 2008, 190, 1691–1696. [Google Scholar] [CrossRef]
- Yonetsu, K.; Watanabe, M.; Nakamura, T. Age-related expansion and reduction in aeration of the sphenoid sinus: Volume assessment by helical CT scanning. AJNR Am. J. Neuroradiol. 2000, 21, 179–182. [Google Scholar]
- Moore, K.R.; Harnsberger, H.R.; Shelton, C.; Davidson, H.C. ‘Leave me alone’ lesions of the petrous apex. AJNR Am. J. Neuroradiol. 1998, 19, 733–738. [Google Scholar]
- Battal, B.; Castillo, M. Brain Herniations into the Dural Venous Sinuses or Calvarium: MRI of a Recently Recognized Entity. Neuroradiol. J. 2014, 27, 55–62. [Google Scholar] [CrossRef]
- Battal, B.; Hamcan, S.; Akgun, V.; Sari, S.; Oz, O.; Tasar, M.; Castillo, M. Brain Herniations into the Dural Venous Sinus or Calvarium: MRI Findings, Possible Causes and Clinical Significance. Eur. Radiol. 2015, 26, 1723–1731. [Google Scholar] [CrossRef]
- Stefanelli, S.; Barnaure, I.; Momjian, S.; Seeck, M.; Constantinescu, I.; Lovblad, K.O.; Vargas, M.I. Incidental Intrasphenoidal Encephalocele(Ise). J. Neuroradiol. 2014, 41, 358–360. [Google Scholar] [CrossRef]
- Hatipoglu, H.G.; Cetin, M.A.; Gurses, M.A.; Daglioglu, E.; Sakman, B.; Yuksel, E. Petrous Apex Cephalocele and Empty Sella-Arachnoid Cyst Coexistence: A Clue for Cerebrospinal Fluid Pressure Inbalance? Diagn. Interv. Radiol. 2009, 16, 7. [Google Scholar] [CrossRef]
- Moore, K.R.; Fischbein, N.J.; Harnsberger, H.R.; Shelton, C.; Glastonbury, C.M.; White, D.K.; Dillon, W.P. Petrous apex cephaloceles. AJNR Am. J. Neuroradiol. 2001, 22, 1867–1871. [Google Scholar]
- Stark, T.A.; McKinney, A.M.; Palmer, C.S.; Maisel, R.H.; Truwit, C.L. Dilation of the Subarachnoid Spaces Surrounding the Cranial Nerves with Petrous Apex Cephaloceles in Usher Syndrome. Am. J. Neuroradiol. 2008, 30, 434–436. [Google Scholar] [CrossRef]
- Mafee, M.F.; Valvassori, G.E.; Becker, M. Imaging of the Head and Neck; Thieme: New York, NY, USA, 2005. [Google Scholar]
- Van Tassel, P.; Lee, Y.; Jing, B.; De Pena, C. Mucoceles of the Paranasal Sinuses: MR Imaging with CT Correlation. Am. J. Roentgenol. 1989, 153, 407–412. [Google Scholar] [CrossRef]
- Momeni, A.K.; Roberts, C.C.; Chew, F.S. Imaging of Chronic and Exotic Sinonasal Disease: Review. Am. J. Roentgenol. 2007, 189 (Suppl. S6), S35–S45. [Google Scholar] [CrossRef] [PubMed]
- Aribandi, M.; McCoy, V.A.; Bazan, C. Imaging Features of Invasive and Noninvasive Fungal Sinusitis: A Review. Radiogr. A Rev. Publ. Radiol. Soc. N. Am. Inc. 2007, 27, 1283–1296. [Google Scholar] [CrossRef] [PubMed]
- De Moura Feitoza, L.; Altemani, A.; Adolfo da Silva, N., Jr.; Reis, F. Teaching NeuroImages: Mucormycosis-associated vasculitis: A new sequence to show an old invasive infection. Neurology 2019, 92, e1796–e1797. [Google Scholar] [CrossRef] [PubMed]
- Ralston, S.H.; Corral-Gudino, L.; Cooper, C.; Francis, R.M.; Fraser, W.D.; Gennari, L.; Guañabens, N.; Javaid, M.K.; Layfield, R.; O’Neill, T.W.; et al. Diagnosis and Management of Paget’s Disease of Bone in Adults: A Clinical Guideline. J. Bone Miner. Res. 2019, 34, e3657. [Google Scholar] [CrossRef] [PubMed]
- Mirra, J.M.; Brien, E.W.; Tehranzadeh, J. Paget’s Disease of Bone: Review with Emphasis on Radiologic Features, Part II. Skelet. Radiol. 1995, 24, 163–171. [Google Scholar] [CrossRef] [PubMed]
- Misra, S.; Vineet, D.; Baskaran, P.; Shankar, Y.U. Paget Disease of Bone: A Classic Case Report. Contemp. Clin. Dent. 2013, 4, 227–230. [Google Scholar] [CrossRef] [PubMed]
- Lakhani, D.A.; Martin, D. Ecchordosis Physaliphora: Case Report and Brief Review of the Literature. Radiol. Case Rep. 2021, 16, 3937–3939. [Google Scholar] [CrossRef] [PubMed]
- Mehta, R.I.; Salamon, N.; Zipser, B.D.; Mehta, R.I. Best cases from the AFIP: Giant intracranial aneurysm. Radiogr. A Rev. Publ. Radiol. Soc. N. Am. Inc. 2010, 30, 1133–1138. [Google Scholar]
- Borges, A. Imaging of the Central Skull Base. Neuroimaging Clin. N. Am. 2009, 19, 441–468. [Google Scholar] [CrossRef]


Disclaimer/Publisher’s Note: The statements, opinions and data contained in all publications are solely those of the individual author(s) and contributor(s) and not of MDPI and/or the editor(s). MDPI and/or the editor(s) disclaim responsibility for any injury to people or property resulting from any ideas, methods, instructions or products referred to in the content. |
© 2023 by the authors. Licensee MDPI, Basel, Switzerland. This article is an open access article distributed under the terms and conditions of the Creative Commons Attribution (CC BY) license (https://creativecommons.org/licenses/by/4.0/).
Share and Cite
Battal, B.; Zamora, C. Imaging of Skull Base Tumors. Tomography 2023, 9, 1196-1235. https://doi.org/10.3390/tomography9040097
Battal B, Zamora C. Imaging of Skull Base Tumors. Tomography. 2023; 9(4):1196-1235. https://doi.org/10.3390/tomography9040097
Chicago/Turabian StyleBattal, Bilal, and Carlos Zamora. 2023. "Imaging of Skull Base Tumors" Tomography 9, no. 4: 1196-1235. https://doi.org/10.3390/tomography9040097
APA StyleBattal, B., & Zamora, C. (2023). Imaging of Skull Base Tumors. Tomography, 9(4), 1196-1235. https://doi.org/10.3390/tomography9040097