Article

Mapping Alveolar Oxygen Partial Pressure in COPD Using Hyperpolarized Helium-3: The Multi-Ethnic Study of Atherosclerosis (MESA) COPD Study

1
Department of Chemical Engineering, Columbia University, New York, NY 10027, USA
2
Division of General Medicine, Columbia University Irving Medial Center, New York, NY 10032, USA
3
Department of Biomedical Engineering, Columbia University, New York, NY 10027, USA
4
Neurological Institute, Radiology, Columbia University, New York, NY 10032, USA
5
Department of Internal Medicine, University of Iowa, Iowa City, IA 52242, USA
6
Mailman School of Public Health, Columbia University, New York, NY 10032, USA
7
Department of Radiology, Weill Cornell Medicine, New York, NY 10065, USA
8
Department of Medicine, McGill University, Montreal, QC H3G 2M1, Canada
9
Department of Infection, Immunity and Cardiovascular Disease, University of Sheffield, Sheffield S10 2TN, UK
10
Division of Pediatric Gastroenterology, Hepatology and Nutrition, Department of Pediatrics, Columbia University Irving Medical Center, New York, NY 10032, USA
11
Institute of Human Nutrition, College of Physicians & Surgeons, Columbia University Irving Medical Center, New York, NY 10032, USA
12
Columbia Magnetic Resonance Research Center (CMRRC), Columbia University, New York, NY 10027, USA
13
Department of Physics, Columbia University, New York, NY 10027, USA
*
Authors to whom correspondence should be addressed.
Tomography 2022, 8(5), 2268-2284; https://doi.org/10.3390/tomography8050190
Submission received: 3 August 2022 / Revised: 5 September 2022 / Accepted: 5 September 2022 / Published: 13 September 2022

Abstract

:
Chronic obstructive pulmonary disease (COPD) and emphysema are characterized by functional and structural damage which increases the spaces for gaseous diffusion and impairs oxygen exchange. Here we explore the potential for hyperpolarized (HP) 3He MRI to characterize lung structure and function in a large-scale population-based study. Participants (n = 54) from the Multi-Ethnic Study of Atherosclerosis (MESA) COPD Study, a nested case-control study of COPD among participants with 10+ packyears underwent HP 3He MRI measuring pAO2, apparent diffusion coefficient (ADC), and ventilation. HP MRI measures were compared to full-lung CT and pulmonary function testing. High ADC values (>0.4 cm2/s) correlated with emphysema and heterogeneity in pAO2 measurements. Strong correlations were found between the heterogeneity of global pAO2 as summarized by its standard deviation (SD) (p < 0.0002) and non-physiologic pAO2 values (p < 0.0001) with percent emphysema on CT. A regional study revealed a strong association between pAO2 SD and visual emphysema severity (p < 0.003) and an association with the paraseptal emphysema subtype (p < 0.04) after adjustment for demographics and smoking status. HP noble gas pAO2 heterogeneity and the fraction of non-physiological pAO2 results increase in mild to moderate COPD. Measurements of pAO2 are sensitive to regional emphysematous damage detected by CT and may be used to probe pulmonary emphysema subtypes. HP noble gas lung MRI provides non-invasive information about COPD severity and lung function without ionizing radiation.

1. Introduction

Chronic obstructive pulmonary disease (COPD) was the third-leading cause of death globally in 2019 [1]. COPD is typically identified by lung function tests such as spirometry where low values of the ratio of forced expiratory volume at one second to forced vital capacity (FEV1/FVC) provide a primary signature. Despite decades of COPD research, there has been surprisingly little progress towards reducing COPD mortality, indicating a need for better comprehension of disease progression and pathophysiology. Textbook symptomatic characterizations of the disease, such as “Blue Bloater” and “Pink Puffers”, were established six decades ago [2,3]. COPD characterizations beyond symptomatic measures, using more advanced technologies such as computed tomography (CT) and modern-day machine learning algorithms are rising in importance for the identification of emphysema subtypes [4,5]. However, CT requires radiation exposure and measures only anatomy, not pulmonary function.
Since the first magnetic resonance imaging (MRI) measurements using hyperpolarized (HP) noble gas a quarter of a century ago [6], MRI of human lung parenchyma has provided a new, safe, non-invasive way of exploring acinar structure and functional changes occurring in COPD [7,8,9,10]. HP MRI probes, among other parameters, ventilation defects, acinar structure characterizations via apparent diffusion coefficient (ADC) measurements, and direct determination of the regional alveolar partial pressure of oxygen (pAO2). Many pulmonary diseases and COPD, in particular, are characterized by ventilation-perfusion mismatch, where pAO2 and regional ventilation represent a vital input [11]. Over the past 20 years, improvements in HP 3He MRI have occurred from pilot studies on relatively small numbers of participants, beginning primarily with healthy smokers [12,13] and eventually including subjects with COPD [14,15,16]. Early studies established the first pAO2 maps of lung parenchyma for COPD participants [17]. However, since pAO2 measurements require observation of the decay of the HP 3He signal over a long breath-hold (10–20 s), technical challenges arise especially as the extent of damage increases. In particular, 3He gas flowing to neighboring voxels during the pAO2 acquisition results in partial pressure measurements that are negative [18]. Subsequent studies using HP 3He and more sophisticated multi-breath imaging techniques [19] partially alleviate this difficulty, but with some loss in the signal-to-noise ratio (SNR). In parallel to studies of pAO2 from HP 3He MRI, ADC measurements on COPD participants have reached a quite advanced stage of development and suffer less from systematic uncertainties and provide a metric complementary to CT data for characterizing emphysema subtypes. Gas travels with Brownian motion inside the lung due to thermal energy. While gas velocity remains constant between subjects, ADC reflects how far gas molecules travel during the data acquisition which is indicative of acinar microstructure. Modeling and parameter determination at the 10 mm to 100 mm scales reveal significant sensitivity to changes from COPD and other lung diseases where alveolar damage occurs [20,21,22,23,24,25,26]. Multiparametric clinical studies using ADC measurements to characterize COPD have recently become available [5,27,28,29].
There is a significant gap in knowledge pertaining to the study of COPD using hyperpolarized noble gas and particularly to pAO2. The MESA COPD studied an overall larger number of participants, particularly more with mild disease as compared to the more extreme cases in the current literature [4]. In this study, negative pAO2 measures were not discarded as non-physiologic but rather included in calculations and used as a metric to quantify the extent of disease. Finally, the emphysema subtypes classification is a novel approach aiming to deepen the understanding of different types of disease progression [4].
In this paper we explore the potential for HP 3He MRI in COPD in a large-scale population-based study comparing to CT, spirometry, diffusion capacity of carbon monoxide (DLCO) and other measures of pulmonary function. We use ADC measurements as a baseline metric for COPD characterization, where high ADC values reflect emphysematous damage increasing alveolar spaces to allow more room for gas motion. We investigate pAO2 measurements to quantify the impact of COPD on ventilation and gas exchange. In addition, we compare pAO2 results with emphysema subtypes assessed in six zones on CT [4].

2. Materials and Methods

2.1. Participants

The Multi-Ethnic Study of Atherosclerosis (MESA) COPD Study was a multicenter case-control study of COPD [30,31] nested in MESA, a population-based prospective cohort study of subclinical atherosclerosis, and the Emphysema and Cancer Action Project (EMCAP), a non-overlapping lung cancer screening study and community-based controls. Inclusion criteria were age 50 to 79 years and 10 or more pack-years of smoking; participants with contraindications to MRI and gadolinium were excluded. Known cardiovascular disease was excluded based on both the MESA and the MESA COPD protocols. All participants at one site were invited to undergo HP 3He MRI. Table 1 summarizes the characteristics of the study population. Institutional Review Board approval was obtained for all activities and all participants provided written informed consent.

2.2. HP 3He Production and MRI Hardware

Hyperpolarized 3He was produced via spin-exchange collisions with optically pumped polarized rubidium vapor in a glass tube at ~160 °C using a circularly polarized 100-watt diode laser emitting at 795 nm [32]. The 3He polarizer (GE Healthcare, Princeton, NJ, USA) produced ~1.3 L of polarized 3He gas, per batch, with polarization fractions ranging from 25% to 40% after 12 to 16 h (typically overnight) of optical pumping. The HP 3He gas was dispersed mixed together with ultrapure nitrogen, see Table 2, in 1 L batches using 1-L Tedlar bags.
3He imaging was performed on a Phillips Achieva 3 T multi-nuclear scanner tuned to the 3He central frequency at 97.32 MHz. Images were acquired using a flexible quadrature transmit-receive chest coil with passive proton decoupling for proton MRI. The chest coil dimensions were 35 cm length and 120 cm circumference matched to an adult torso. A thermal calibration source consisting of a half-liter bottle of ~3 bar of unpolarized 3He was used to set the central frequency.

2.3. MRI Acquisition

Each participant inhaled a 1 L mixture of HP 3He and ultrapure nitrogen for a 20-s breath-hold pAO2 scan starting at residual volume (RC) so imaging occurred at approximately functional residual volume (FRC). Some participants did not inhale exactly 1 L above RC and ended up breath holding for the scan at or slightly above FRC. The pulse sequence timing followed the work of Marshall et al. [18] with an initial time delay between the first two acquisitions, t1 = 1.3 s, and subsequent data collections following a time spacing of t2 = 4.5 s for a total of six acquisitions.
The second acquisition performed after τ1 was used to correct for RF depolarization [33,34]. The pAO2 imaging parameters were echo time TE = 0.48 ms, repetition time TR = 4 ms, field of view FOV = 350 mm, in-plane matrix 256 × 256, bandwidth = 127.5 kHz, slice thickness = 16 mm and flip angle = 1°. Twelve coronal slices were collected per subject.
Coronal proton MRI as well as HP 3He MRI ventilation scans were collected in the same 20 s breath-hold. Proton scans were used to define the lung boundaries and create ventilation masks as well as identify different regions within.
3He signal depolarizes over time primarily due to the presence of oxygen, such that magnetization, Mn, follows an exponential decay given by [35]
Mn = M0cosn·N(α)·exp [−tn(k)/T1]
where M0 and Mn are 3He magnetizations initially and after n slices, respectively. The flip angle is α, tn(k) is the time of acquisition n of the kth slice, and N is the number of phase-encoded steps. An exponential fit to the data provides a determination for T1 decay for each voxel. The decay time T1 is directly related to pAO2 via
pAO2 = ξ/T1
The constant ξ is experimentally determined in a controlled calibration measurement [17,36], which yields at body temperature (37 °C), ξ = 2.61 bar·s.
For the ADC measurements, 350 mL of 3He was combined with 650 mL of ultrapure nitrogen and inhaled to total lung capacity (TLC). Coronal scans were taken at two different b values: b0 = 0 and b1 = 1.6 s/cm2. The relationship between ADC value and the signals, S0 and S1 from the two scans, is given by
ADC = 1 b 1 log S 0 S 1
The scan parameters for the ADC measurements in this study were TE = 0.49 ms, TR = 120 ms, matrix size 128 × 128, FOV = 450 mm, slice thickness 40 mm, number of slices = 5, bandwidth = 63.7 kHz, and the flip angle = 3°. ADC measurements were performed at total lung capacity (TLC).

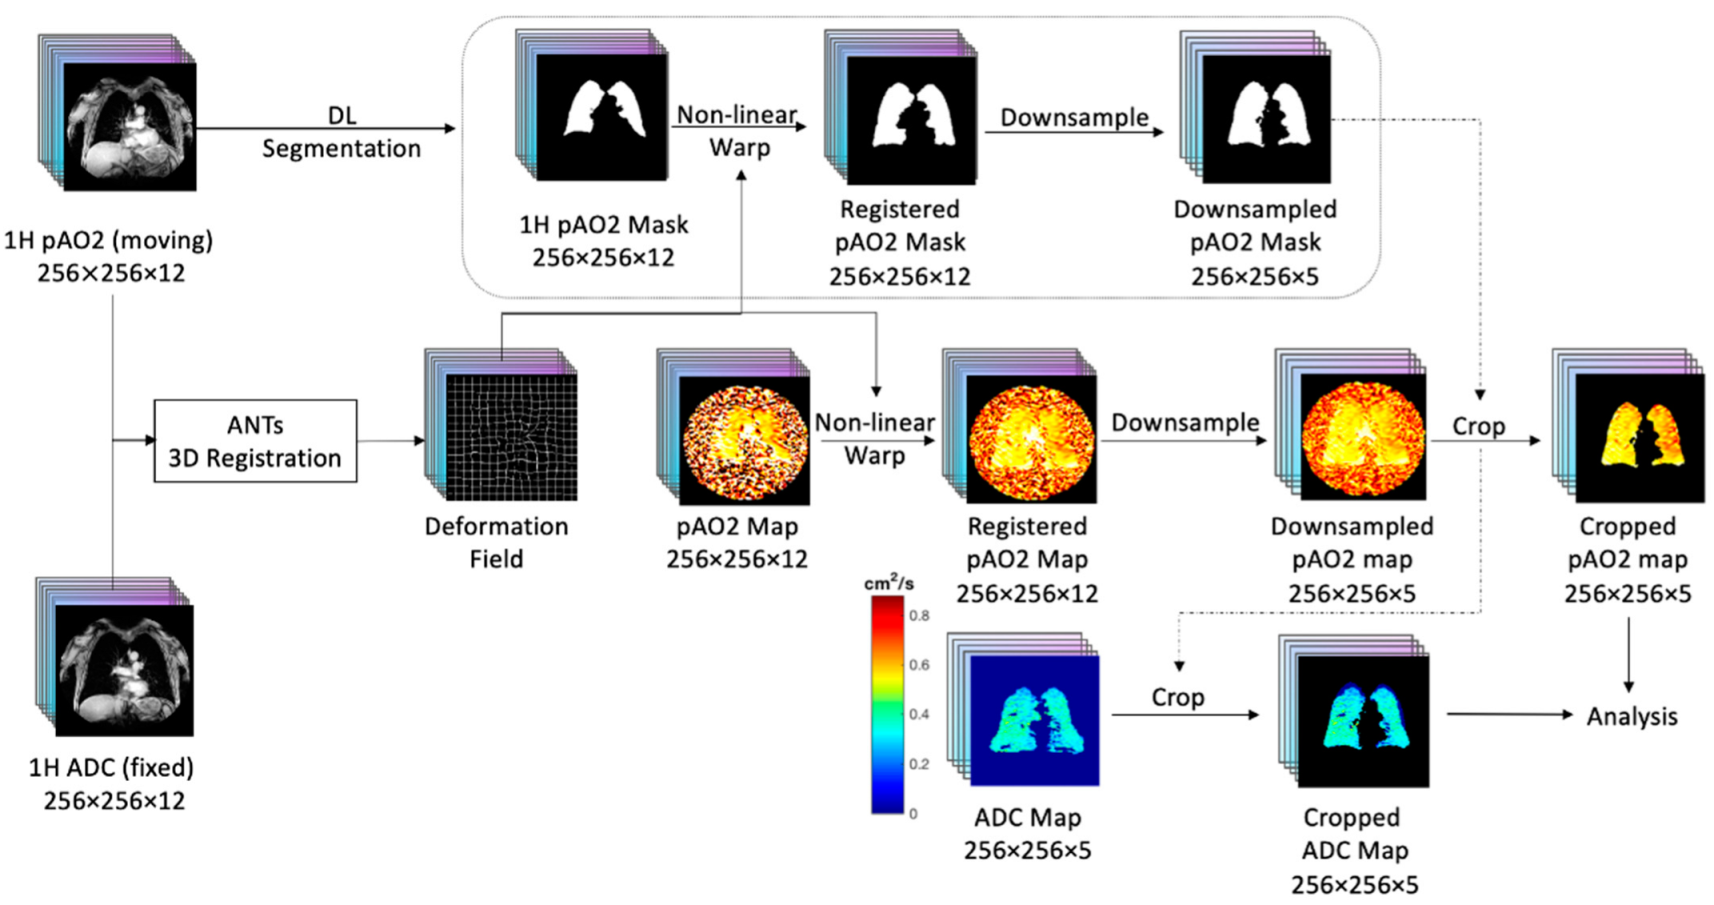
2.4. Co-Registration of HP 3He ADC with pAO2

Proton MRI scans acquired within the same breath hold for ADC and pAO2 were used as the basis of the co-registration. Figure 1 shows the workflow for the co-registration steps. For matching pAO2 and ADC results, the Advanced Normalization Tool (ANTs) 3D registration software [37] was used. The final pAO2 slice scans were down-sampled from a 16.5 mm slice thickness to a 40 mm slice thickness and cropped following the procedure of Hughes et al. [38]. The resulting images were converted to 5 coronal slices matching the anatomy covered in the ADC scans

2.5. Regional Divisions Using Proton MRI and 3He Ventilation Data

Ventilation masks divided the lung into three separate ventilation regions, namely normal ventilation, hypo (or low) ventilation, and no ventilation regions. Non-ventilated regions were defined as being within 2.6 SD of the mean heart signal (Sheart), covering 99.5% of the Z score data. Similarly, ventilated regions were set to be within 2.6 SD of the heart signal plus one-quarter of the difference between the trachea and heart signal, namely Sventilated = Sheart + 0.25 (Strachea − Sheart). Any remaining lung regions were labeled hypo-ventilated. Figure 2 presents an example of a lung slice with three ventilation regions differentiated by three different mask colors. These same masks were first produced and used in a study of low ventilation defect percentages associated with cardiac function [39].
A separate analysis in which the coronal slices were divided into six zones defined by cranial-caudal thirds (left versus right as well as upper, middle and lower) allowed for a comparison of the regional pAO2 results for different pulmonary emphysema subtypes evaluated from a visual CT analysis [4]. Coronal proton MRI images were used to find the divisions between the upper, middle and lower zones. The upper zone was chosen as extending from the apex to the mid-aortic arch. The lower zone extended from the mid-entry level of the most inferior pulmonary vein to the diaphragm. The middle zone incorporated the remaining region between the upper and lower zones.

2.6. Non-Physiologic Results for pAO2

A significant challenge for studying pAO2 in moderate/severe COPD participants is the 3He gas mixing and voxel to voxel transport between acquisitions, resulting in negative pAO2 values. Non-physiologic values are defined as values resulting from gas mixing during the measurement time and not an actual partial pressure measurement, namely pAO2 values smaller than 0.

2.7. CT Measures

All participants underwent CT imaging following the MESA Lung protocol at a fixed mAs [40]. Percent emphysema is defined as the percentage of voxels in the lung field with Hounsfield units below −950 [40].
Prior work in the MESA COPD Study qualitatively assessed the presence and severity of traditional emphysema subtypes [4], namely centrilobular (CLE), panlobular (PLE) and paraseptal emphysema (PSE), as identified by radiologists using CT scans. The lung was divided into six regions, and a severity score (0–100) was assigned for each region. A global pulmonary emphysema subtypes severity score was calculated for each participant by summing the severity scores of each of the six regions.

2.8. Pulmonary Function Testing

Spirometry was performed following the MESA Lung protocol and contemporary American Thoracic Society/European Respiratory Society standards [40]. In addition, DLCO measures collected at the baseline MESA COPD visit in November 2009 [4].

2.9. Statistical Analysis

Dichotomous variables are presented as proportions and continuous variables are presented as means with standard deviations (SD) unless otherwise indicated. Mean, SD, and percent negative pAO2 values were calculated across six lung regions for each coronal slice and then combined into volume-weighted global pAO2 measures per subject. Non-physiologic pAO2 measures were included in mean and SD calculations and also used as a separate metric, %negative, to show the percentage of measurements that were below zero to further describe impairment in blood oxygenation.
Spearman’s correlation coefficients, with Fisher’s Z transformation, were used to assess correlations between pAO2 measures and percent emphysema and ADC mean. The Mann-Whitney U test was used to assess differences in percentage negative pAO2 for different ventilation states across COPD status. Inverse probability weights were used to make results comparable to the general population, based on the known likelihood of selection into the study sample.
Generalized linear models adjusting for age, sex, race/ethnicity, and smoking status were used to assess associations between global pAO2 values and percent emphysema, visual emphysema severity, and pulmonary emphysema subtypes. We refer to models that adjust for these covariates as “Model 1”. Models were additionally adjusted for percent predicted FEV1 (“Model 2”). Regional associations were assessed using linear mixed models with random intercepts by lung region. In order to obtain estimates of emphysema subtype prevalence in the source population, analyses were weighted by the ratio of COPD prevalence in the source study to that in the MESA COPD Study, as previously described [41,42]. A two-tailed p value < 0.05 was considered statistically significant. All analyses were performed using SAS 9.4 (SAS Institute, Cary, NC, USA) and R (version 4.0.4).

3. Results

Of 200 participants who participated in the MESA COPD study and were eligible for hyperpolarized gas imaging, 56 consented and underwent hyperpolarized gas imaging. Of these, pAO2 was able to be measured for 54 participants and ADC for 50 (Supplementary Figure S1).

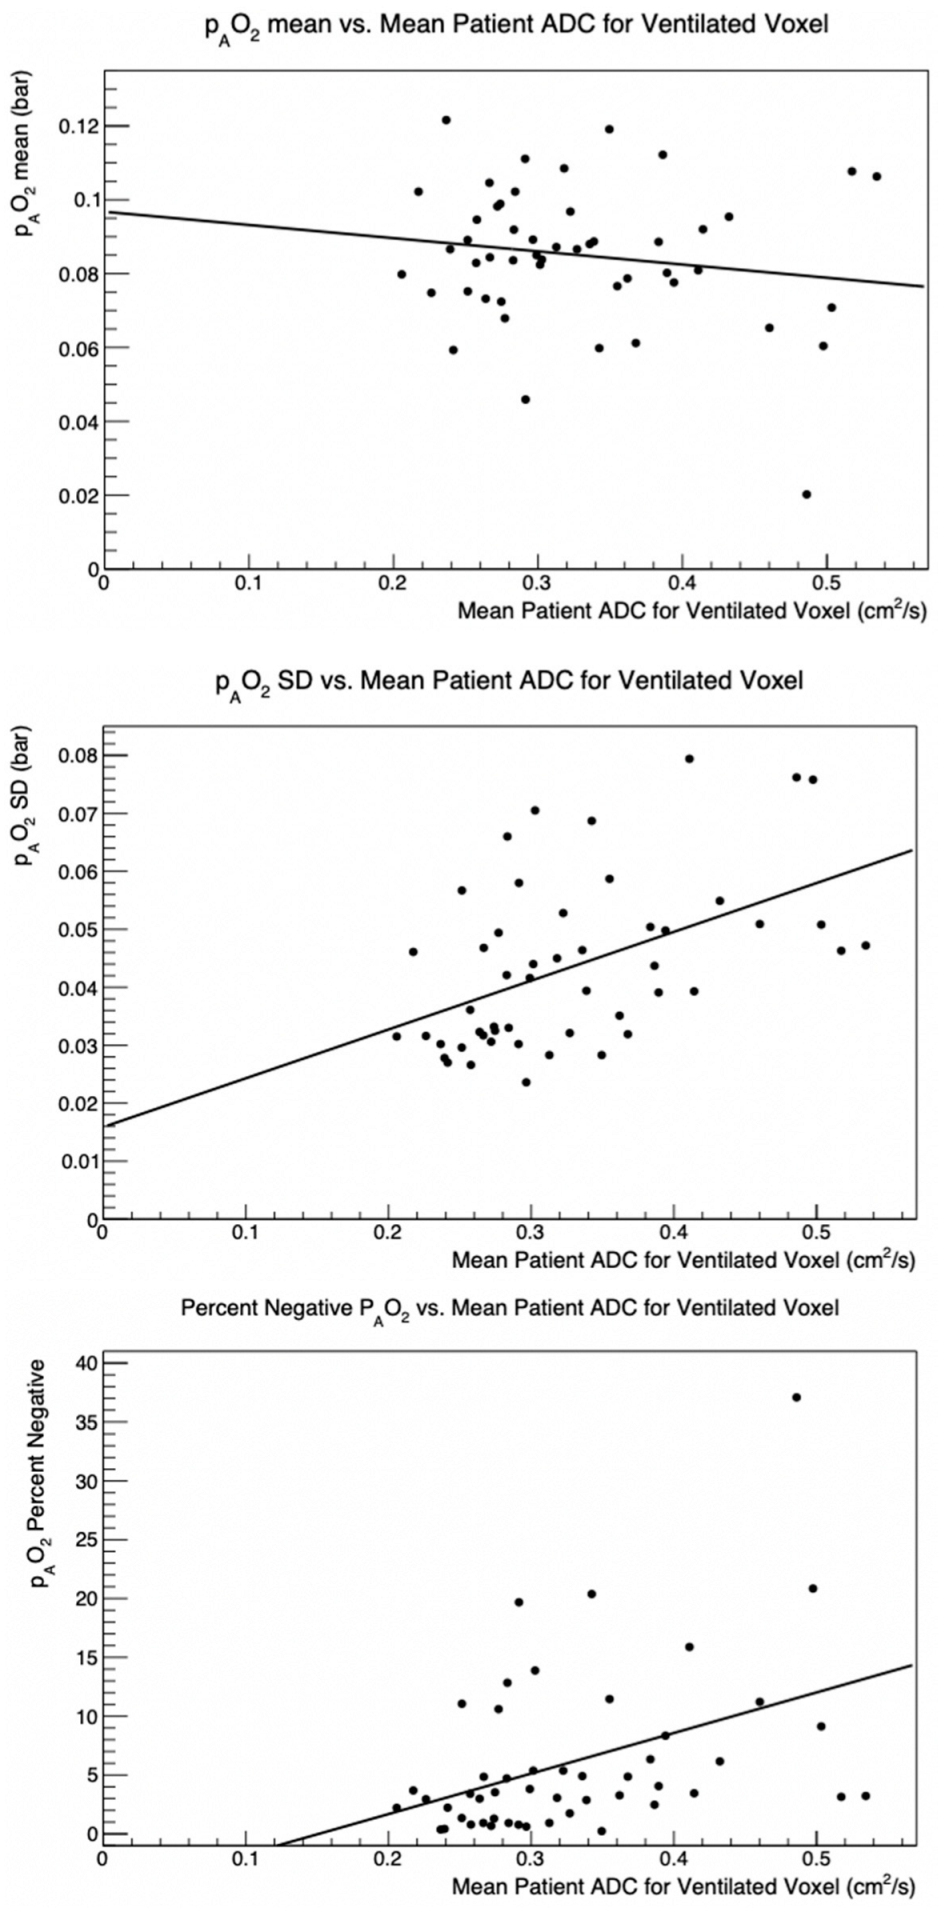
3.1. Global pAO2 versus ADC

Figure 2 shows pAO2 and ADC color maps of a central coronal section for three participants: one without COPD, one with mild COPD, and one with moderate COPD. The map for the subject without COPD presents a homogeneous distribution (ADC ~0.3 cm2/s), whereas the frequency of high ADC regions generally is higher for participants with increasing severity of COPD. Regions of high ADC have been shown to correlate with regions of emphysema, which occurs together with COPD [5]. The mean pAO2 results for the three participants over the full lung are comparable; however, the pAO2 heterogeneity in the more severe COPD subject is visibly higher. Although there is a substantial scatter in the results across all participants, these general trends persist throughout the patient population and have been observed in previous studies [35]. When compared to the level of ventilation, regions of negative pAO2 tend to overlap with regions of no ventilation. Further, as COPD severity increases, regions of normal ventilation become smaller as those with hypo- and non-ventilation increase.
Figure 3 shows a compilation of the mean and SD pAO2 as a function of the mean ADC value for 50 participants imaged with HP 3He. The data in Figure 3 were matched to the pAO2 results. Although there is a significant spread in results, there is a distinct trend of increasing pAO2 SD for participants with higher ADC values, whereas the mean pAO2 values appears to be largely uncorrelated to the mean ADC value. A doubling in the ADC values results in approximately a doubling of the pAO2 SD (Figure 3, center).
The overall mean ADC value was 0.302 ± 0.061 cm2/s. The mean pAO2 value was 0.091 ± 0.034 bar. Global pAO2 SD was strongly correlated with ADC mean (Table 3). When negative values were excluded from pAO2 mean and SD calculations, though numerical results changed slightly, our conclusions remained the same.

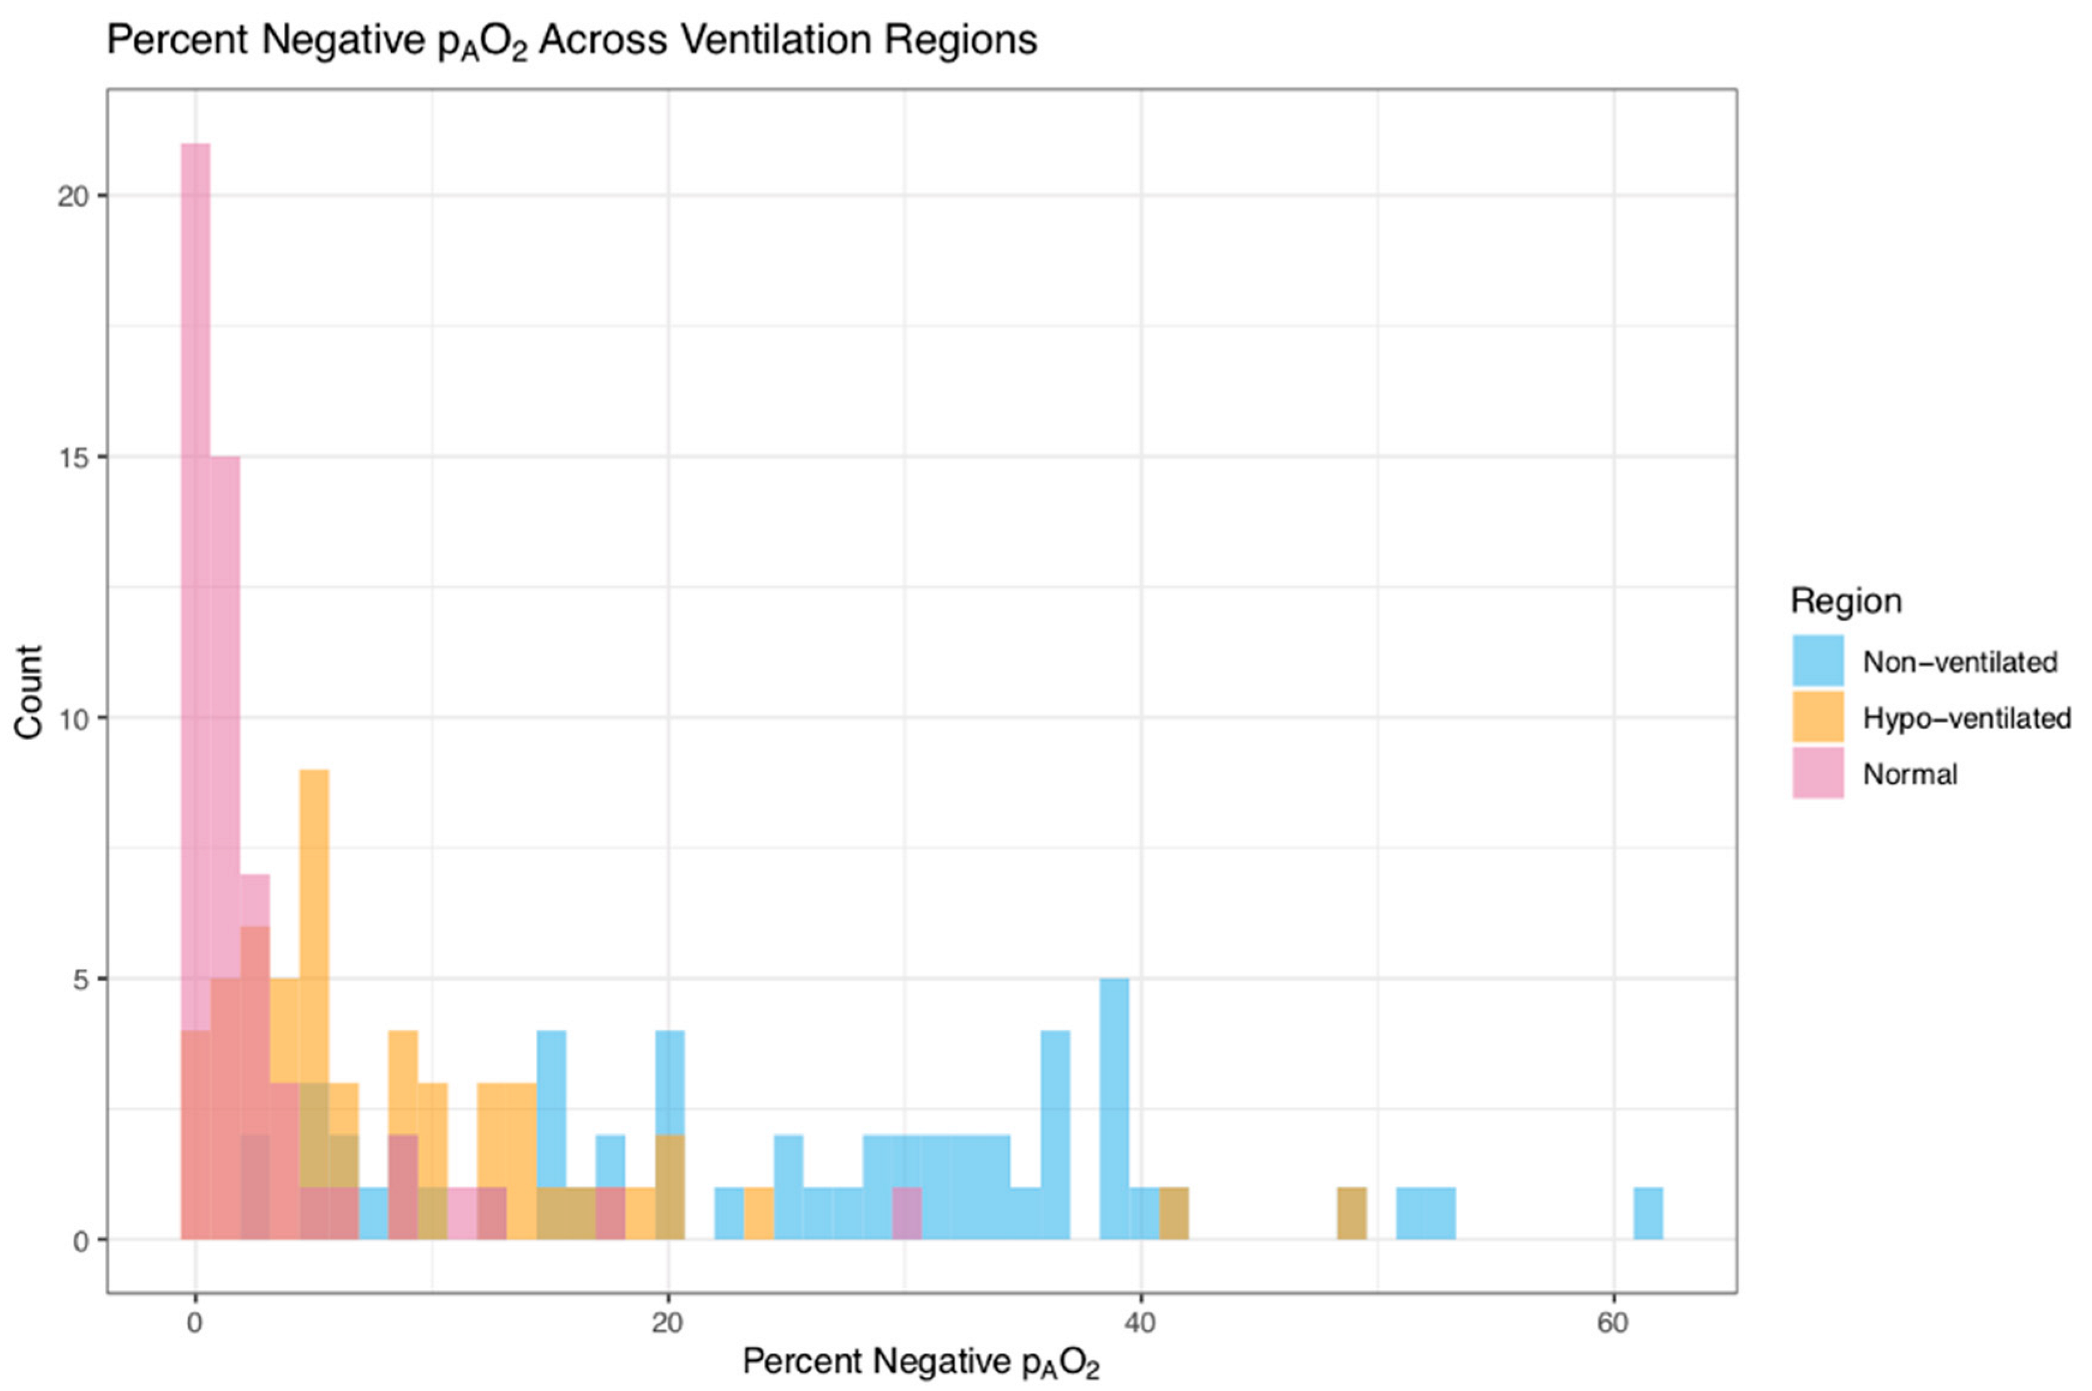
3.2. Negative pAO2 Results

Figure 3 presents the negative pAO2 percentage as a function of mean ADC per subject for the study. The large increase in negative pAO2 with increased ADC is evident. Similar to the pAO2 SD, there is a strong association between the negative pAO2 percentage and the mean ADC, summarized in Table 3. Figure 2 shows the overlap of the negative regions with the non-ventilated regions: regions with negative pAO2 tend to overlap with regions where no ADC was measured i.e., there was no ventilation.

3.3. Global pAO2 and Percent Emphysema

Table 3 shows strong correlations between percent emphysema and pAO2 SD and percent negative pAO2. Metrics showing an increase in heterogeneity of pAO2 values, shown by the SD and the percent negative, is strongly correlated with both %emphysema and ADC.

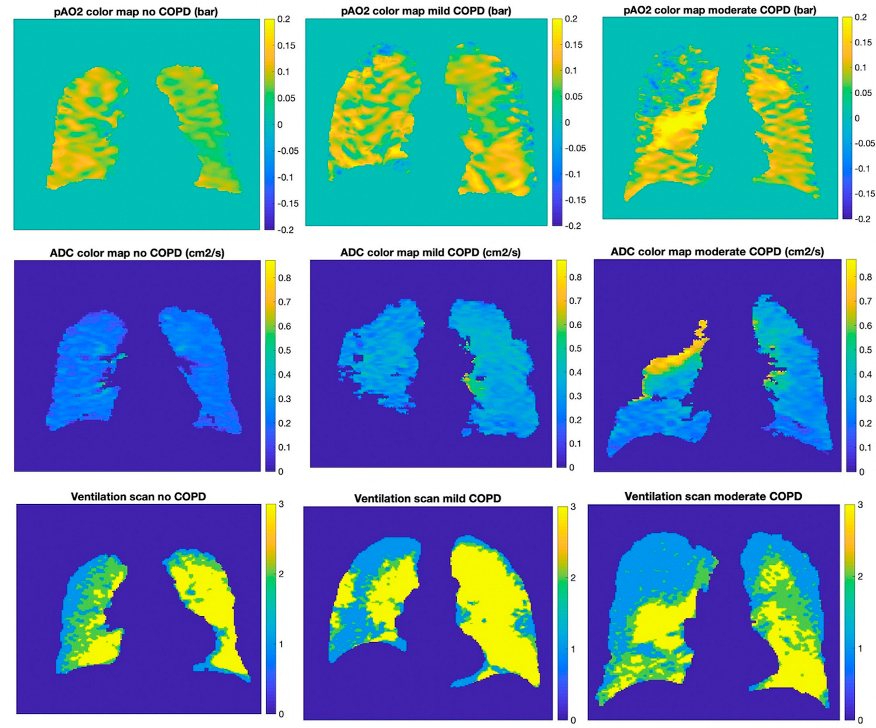
3.4. Measurements of pAO2 in Different Ventilation Regions

Mean values for the pAO2 measurements per subject for the three different ventilation regions have been compiled. The overall mean pAO2 per subject is 0.105 ± 0.026 (SD) within the normal ventilation regions, 0.096 ± 0.025 (SD) within the hypo-ventilation regions, and 0.094 ± 0.019 (SD) within the non-ventilated regions. The observed difference in pAO2 with ventilation state is statistically significant.
Figure 4 provides the percentage of negative pAO2 values for the three different ventilation types. There is a marked difference between the different ventilation regions with the range of values extending to high percentages for the non-ventilated region. The median [interquartile range, IQR] for percent negative pAO2 is 1.3% [0.3, 2.5] for the normal ventilated region, 5.1% [3.0, 12.2] for the hypo-ventilated region and 27.0% [15.2, 36.4] for the non-ventilated region.

3.5. Global pAO2 Measurements Compared to Carbon Monoxide Diffusion Capacity

The pAO2 SD was significantly associated with DLCO in both unadjusted and adjusted models (p = 0.007 and p = 0.04 respectively), supporting the utility of pAO2 SD as a potential marker of diffusion impairment [35] (Table 4). DLCO measurements were collected at the baseline MESA COPD exam among 34 of the 54 participants. Negative pAO2 was only found to be significantly associated with DLCO in an unadjusted model (p = 0.01).

3.6. Regional pAO2 Measurements Compared to Traditional Emphysema Subtypes

The median [interquartile range, IQR] of the regional mean pAO2 measures across the six regions of the lung are as follows: upper left, 0.076 [0.064, 0.089]; upper right, 0.086 [0.069, 0.101]; middle left, 0.083 [0.073, 0.095]; middle right, 0.100 [0.091, 0.111]; lower left, 0.087 [0.077, 0.105]; and lower right, 0.107 [0.097, 0.122]. Detailed results including information on the emphysema severity per region is presented in the Supplementary Table S1. One observes a clear increase in pAO2 mean from apical to basal and a consistently higher pAO2 mean in the right lung compared to the left lung for the studied population.
Table 5 provides the associations between the regional pAO2 measures compared to percent emphysema and pulmonary emphysema subtypes presence or severity score. All models reveal an association between pAO2 SD and the pulmonary emphysema subtypes severity score, while the percent negative pAO2 shows an association with the pulmonary emphysema subtypes severity score for the unadjusted model and Model 1, but not Model 2. The pAO2 SD appears to be mildly sensitive to the presence of PSE both for the unadjusted model as well as Model 1. The association is not significant when additionally adjusted for percent predicted FEV1 in Model 2.

4. Discussion

HP 3He MRI measurements of lung pAO2 reveal a marked increase in heterogeneity of oxygenation, as assessed by pAO2 SD, with increasing % emphysema (measured on CT [41]). The strong correlation between ADC and percent emphysema confirms that ADC is an appropriate metric for determining the severity of damage caused by the disease. Similarly, the presence of non-physiologic, negative pAO2 measurements is strongly associated with increased emphysema, as well as in comparison to HP 3He ADC measurements. The overlap of non-ventilated regions and regions with high percentages of negative values is significant.
pAO2 SD and negative pAO2 are also strongly associated with pulmonary emphysema subtype severity scores [4]. An investigatory look at pAO2 SD and negative pAO2 also reveal mild sensitivity to the severity of PSE Since PSE is present in only in 9% of the MESA COPD population [4], this presents pAO2 SD as a potentially beneficial and safe biomarker for PSE detection and possibly other emphysema subtypes. Larger sample sizes would be worthwhile for future studies.
The pAO2 SD results are consistent with an earlier study [35] in 7 COPD patients. The current results also reveal no sensitivity to the pAO2 mean in either a global or regional lung study. Other studies have also found large negative pAO2 regions for patients with severe COPD [18], but did not quantify the effect in mild to moderate COPD, nor compare to emphysema measurements from CT on the same subjects.
Since pAO2 depends upon the balance between oxygen replenishment from inhalation and oxygen diffusion into blood, it is expected that degradation in oxygen diffusion from emphysema would change pAO2. Therefore, DLCO which reflects the absorption of carbon monoxide could correlate with pAO2 [35]. We do observe correlations between pAO2 and DLCO measurements as shown in Table 4. In the MESA COPD study, DLCO measurements were not collected at the same time as the HP 3He measurements. However, DLCO measurements were performed approximately five years earlier on 34 overlapping subjects in MESA COPD I [31]. In spite of the different time measurements and reduced number of subjects, a noteworthy association exists between global pAO2 SD and decreased DLCO and the mean pAO2 was decreased in subjects with impaired DLCO as expected.
The primary motivation for HP 3He MRI studies of pAO2 in COPD is to determine the actual pAO2 mapping. HP 3He MRI measurements of regional pAO2 in lung parenchyma face several technical hurdles: gas mixing between neighboring voxels produces non-physiological results; RF depolarization effects; body motion during the 20 s breath-hold disturbs voxel registration from one measurement to the next so reproducibility is a continual challenge. For high field MRI, in this case 3T, imaging artifacts appear, and corrections may need to be implemented for the lost data. The correction for the RF depolarization from the scanner has been an issue since the first pAO2 measurements [17]. The significant fluctuations in the voxel to voxel only allow for bounding the absolute pAO2 determination from RF depolarization to be a ~ ±10% systematic uncertainty.
Non-physiological values are a challenge to the interpretation of pAO2 measurements from HP noble gas MRI. These appear in three forms. As has been discussed previously [18,19], mixing from different regions can result in negative pAO2 values. In addition, mixing can also create the opposite effect, namely that pAO2 results with values greater than the oxygen partial pressure of air can be recorded. A negligible number of voxels with a value greater than 0.2 bar were recorded and as such were not considered further during the analyses. Negative values reflect gas moving into that voxel during scanning, which could be indicative of delayed ventilation [18]. The effect of negative pAO2 values on neighboring positive regions needs to be considered as well since pAO2 signal is leaving the voxel of interest, making the signal decay greater than it would be without the gas movement, leading to falsely elevated pAO2 values. Finally, very low values of pAO2, namely regions of hypo-ventilation, were found and might be influenced by the same issues that cause negative pAO2. Care needs to be taken with the interpretation of hypo-ventilation regions, especially in the vicinity of negative pAO2 regions. As a systematic check, the analysis was also carried out in which only non-negative values were used in the pAO2 calculations, and the substantive conclusions remained the same. Unlike the presence of delayed ventilation in patients with severe COPD, these negative pAO2 regions had not been observed in patients with mild COPD in previous studies of pAO2, an indication that HP MRI provides insight into earlier stages of the disease.
Future modeling and simulations of intervoxel gas mixing in patients with moderate or severe COPD could be enormously valuable additions to gain back the measurement loss of true pAO2. A potential beneficial future research direction is to compare regionally negative pAO2 regions to the existence of blebs, identified by CT.

5. Conclusions

First measurements of pAO2 using polarized 3He on 54 participants from the MESA COPD study has been performed and compared to pulmonary functional tests and CT studies. To our knowledge, this represents the largest study of COPD subjects to determine pAO2 values using HP 3He MRI. Unlike previous studies which were conducted on small sample sizes with extreme cases, this study was a population-based nested case-control study looking at a wide range of disease severity—from none to mild to severe—as is reflected in the real world. We find a significant and quantifiable increase in the pAO2 heterogeneity as a function of lung damage, compared to 3He MRI ADC measurements as well as compared to percent lung emphysematous damage determined in CT studies [41]. A first look is taken comparing pAO2 measures to pulmonary emphysema subtypes. The large percentage of non-physiological pAO2 results in some subjects, which primarily originate from non-ventilated regions, represents both a challenge to determining the true pAO2 as well as a potential biomarker for the disease progression.
Present and future research using polarized noble gas MRI are aimed primarily at ramping up with polarized 129Xe. HP 129Xe MRI has a number of important advantages compared to 3He, including being significantly cheaper and more readily available. Initial studies on pAO2 measurements using 129Xe with COPD participants have been performed [43]. Nevertheless, the intrinsically lower SNR for 129Xe will remain a challenge to the method.
Future efforts to model the systematic effects in pAO2 measurements for HP 3He as a function of regional lung damage could be enormously valuable and a viable future research direction. Determining regional ventilation/perfusion in COPD patients using polarized noble gas MRI [11] is still an achievable goal, despite the increased challenge arising from damage caused by disease.

Supplementary Materials

The following supporting information can be downloaded at: https://www.mdpi.com/article/10.3390/tomography8050190/s1, Figure S1: MESA 3He MRI Participant Flow Chart. Table S1: Distributions of regional measures (n = 54).

Author Contributions

Conceptualization, N.P.T.; M.R.P. and E.W.H.; Data curation, N.P.T.; D.M.; W.S. and E.W.H.; Formal analysis, G.T.H.; X.Z.; D.M.; Y.S. (Yanping Sun), Y.S. (Yifei Sun) and W.S.; Funding acquisition, R.G.B. and E.W.H.; Investigation, N.P.T.; R.G.B.; S.M.D.; B.M.S. and E.W.H.; Methodology, N.P.T.; G.T.H.; X.Z.; M.R.P.; B.M.S.; J.M.W. and W.S.; Project administration, R.G.B. and S.M.D.; Resources, S.M.D.; Software, X.Z. and W.S.; Supervision, R.G.B. and E.W.H.; Validation, G.T.H.; R.G.B.; M.R.P. and E.W.H.; Visualization, N.P.T.; G.T.H. and D.M.; Writing—original draft, N.P.T. and E.W.H.; Writing—review & editing, R.G.B.; E.A.H.; E.C.O. and W.S. All authors have read and agreed to the published version of the manuscript.

Funding

The main funding of this research is National Institutes of Health/National Heart, Lung, and Blood Institute, grants R01-HL093081, R01-HL077612, R01-HL121270. This research was also supported by contracts 75N92020D00001, HHSN268201500003I, N01-HC-95159, 75N92020D00005, N01-HC-95160, 75N92020D00002, N01-HC-95161, 75N92020D00003, N01-HC-95162, 75N92020D00006, N01-HC-95163, 75N92020D00004, N01-HC-95164, 75N92020D00007, N01-HC-95165, N01-HC-95166, N01-HC-95167, N01-HC-95168 and N01-HC-95169 from the National Heart, Lung, and Blood Institute, and by grants UL1-TR-000040, UL1-TR-001079, and UL1-TR-001420 from the National Center for Advancing Translational Sciences (NCATS). The authors thank the other investigators, the staff, and the participants of the MESA study for their valuable contributions. A full list of participating MESA investigators and institutions can be found at http://www.mesa-nhlbi.org (accessed on 1 September 2022).

Institutional Review Board Statement

This study was approved by the institutional review board (AAAO1456) and complied with HIPAA rules.

Informed Consent Statement

Informed consent was obtained from all subjects involved in the study.

Data Availability Statement

Not applicable.

Conflicts of Interest

The authors declare no conflict of interest.

References

  1. World Health Organization. The Top 10 Causes of Death; World Health Organization: Geneva, Switzerland, 2020. [Google Scholar]
  2. Scadding, J. Meaning of diagnostic terms in broncho-pulmonary disease. Br. Med. J. 1963, 2, 1425–1430. [Google Scholar] [CrossRef]
  3. James, J.; Dyson, J. Cave Science Topics: CO2 in Caves. Caving Int. 1981, 13, 54–59. [Google Scholar]
  4. Smith, B.M.; Austin, J.H.; Newell, J.D.; D’Souza, B.M.; Rozenshtein, A.; Hoffman, E.; Ahmed, F.; Barr, R.G. Pulmonary emphysema subtypes on computed tomography: The MESA COPD study. Am. J. Med. 2014, 127, 94.e7–94.e23. [Google Scholar] [CrossRef]
  5. MacNeil, J.L.; Capaldi, D.P.I.; Westcott, A.R.; Eddy, R.L.; Barker, A.L.; McCormack, D.G.; Kirby, M.; Parraga, G. Pulmonary Imaging Phenotypes of Chronic Obstructive Pulmonary Disease Using Multiparametric Response Maps. Radiology 2020, 295, 227–236. [Google Scholar] [CrossRef]
  6. Albert, M.S.; Cates, G.; Driehuys, B.; Happer, W.; Saam, B.; Springer, C.S., Jr.; Wishnia, A. Biological magnetic resonance imaging using laser-polarized 129Xe. Nature 1994, 370, 199–201. [Google Scholar] [CrossRef]
  7. Kirby, M.; Mathew, L.; Wheatley, A.; Santyr, G.E.; McCormack, D.G.; Parraga, G. Chronic obstructive pulmonary disease: Longitudinal hyperpolarized 3He MR imaging. Radiology 2010, 256, 280–289. [Google Scholar] [CrossRef]
  8. Wild, J.M.; Fichele, S.; Woodhouse, N.; Paley, M.N.; Kasuboski, L.; van Beek, E.J. 3D volume-localized pO2 measurement in the human lung with 3He MRI. Magn. Reson. Med. 2005, 53, 1055–1064. [Google Scholar] [CrossRef]
  9. Miller, G.W.; Mugler, J.P., 3rd; Altes, T.A.; Cai, J.; Mata, J.F.; de Lange, E.E.; Tobias, W.A.; Cates, G.D.; Brookeman, J.R. A short-breath-hold technique for lung pO2 mapping with 3He MRI. Magn. Reson. Med. 2010, 63, 127–136. [Google Scholar] [CrossRef]
  10. Hamedani, H.; Kadlecek, S.J.; Emami, K.; Kuzma, N.N.; Xu, Y.; Xin, Y.; Mongkolwisetwara, P.; Rajaei, J.; Barulic, A.; Wilson Miller, G.; et al. A multislice single breath-hold scheme for imaging alveolar oxygen tension in humans. Magn. Reson. Med. 2012, 67, 1332–1345. [Google Scholar] [CrossRef]
  11. Rizi, R.R.; Baumgardner, J.E.; Ishii, M.; Spector, Z.Z.; Edvinsson, J.M.; Jalali, A.; Yu, J.; Itkin, M.; Lipson, D.A.; Gefter, W. Determination of regional VA/Q by hyperpolarized 3He MRI. Magn. Reson. Med. 2004, 52, 65–72. [Google Scholar] [CrossRef]
  12. De Lange, E.E.; Mugler, J.P., 3rd; Brookeman, J.R.; Knight-Scott, J.; Truwit, J.D.; Teates, C.D.; Daniel, T.M.; Bogorad, P.L.; Cates, G.D. Lung air spaces: MR imaging evaluation with hyperpolarized 3He gas. Radiology 1999, 210, 851–857. [Google Scholar] [CrossRef]
  13. Guenther, D.; Eberle, B.; Hast, J.; Lill, J.; Markstaller, K.; Puderbach, M.; Schreiber, W.G.; Hanisch, G.; Heussel, C.P.; Surkau, R.; et al. 3He MRI in healthy volunteers: Preliminary correlation with smoking history and lung volumes. NMR Biomed. 2000, 13, 182–189. [Google Scholar] [CrossRef]
  14. Parraga, G.; Ouriadov, A.; Evans, A.; McKay, S.; Lam, W.W.; Fenster, A.; Etemad-Rezai, R.; McCormack, D.; Santyr, G. Hyperpolarized 3He ventilation defects and apparent diffusion coefficients in chronic obstructive pulmonary disease: Preliminary results at 3.0 Tesla. Investig. Radiol. 2007, 42, 384–391. [Google Scholar] [CrossRef]
  15. Mathew, L.; Evans, A.; Ouriadov, A.; Etemad-Rezai, R.; Fogel, R.; Santyr, G.; McCormack, D.G.; Parraga, G. Hyperpolarized 3He magnetic resonance imaging of chronic obstructive pulmonary disease: Reproducibility at 3.0 tesla. Acad. Radiol. 2008, 15, 1298–1311. [Google Scholar] [CrossRef]
  16. Van Beek, E.J.; Dahmen, A.M.; Stavngaard, T.; Gast, K.K.; Heussel, C.P.; Krummenauer, F.; Schmiedeskamp, J.; Wild, J.M.; Søgaard, L.V.; Morbach, A.E.; et al. Hyperpolarised 3He MRI versus HRCT in COPD and normal volunteers: PHIL trial. Eur. Respir. J. 2009, 34, 1311–1321. [Google Scholar] [CrossRef]
  17. Deninger, A.J.; Eberle, B.; Ebert, M.; Grossmann, T.; Heil, W.; Kauczor, H.; Lauer, L.; Markstaller, K.; Otten, E.; Schmiedeskamp, J.; et al. Quantification of regional intrapulmonary oxygen partial pressure evolution during apnea by 3He MRI. J. Magn. Reson. 1999, 141, 207–216. [Google Scholar] [CrossRef]
  18. Marshall, H.; Parra-Robles, J.; Deppe, M.H.; Lipson, D.A.; Lawson, R.; Wild, J.M. 3He pO2 mapping is limited by delayed-ventilation and diffusion in chronic obstructive pulmonary disease. Magn. Reson. Med. 2014, 71, 1172–1178. [Google Scholar] [CrossRef]
  19. Achekzai, T.; Hamedani, H.; Kadlecek, S.J.; Ruppert, K.; Xin, Y.; Baron, R.J.; Duncan, I.F.; Sertic, F.; Siddiqui, S.; Amzajerdian, F.; et al. Multibreath Hyperpolarized 3He Imaging Scheme to Measure Alveolar Oxygen Tension and Apparent Diffusion Coefficient. Acad. Radiol. 2019, 26, 367–382. [Google Scholar] [CrossRef]
  20. Quirk, J.D.; Lutey, B.A.; Gierada, D.S.; Woods, J.C.; Senior, R.M.; Lefrak, S.S.; Sukstanskii, A.L.; Conradi, M.S.; Yablonskiy, D.A. In vivo detection of acinar microstructural changes in early emphysema with 3He lung morphometry. Radiology 2011, 260, 866–874. [Google Scholar] [CrossRef]
  21. Yablonskiy, D.A.; Sukstanskii, A.L.; Leawoods, J.C.; Gierada, D.S.; Bretthorst, G.L.; Lefrak, S.S.; Cooper, J.D.; Conradi, M.S. Quantitative in vivo assessment of lung microstructure at the alveolar level with hyperpolarized 3He diffusion MRI. Proc. Natl. Acad. Sci. USA 2002, 99, 3111–3116. [Google Scholar] [CrossRef]
  22. Sukstanskii, A.L.; Yablonskiy, D.A. In vivo lung morphometry with hyperpolarized 3He diffusion MRI: Theoretical background. J. Magn. Reson. 2008, 190, 200–210. [Google Scholar] [CrossRef] [PubMed] [Green Version]
  23. Paulin, G.A.; Ouriadov, A.; Lessard, E.; Sheikh, K.; McCormack, D.G.; Parraga, G. Noninvasive quantification of alveolar morphometry in elderly never- and ex-smokers. Physiol. Rep. 2015, 3, e12583. [Google Scholar] [CrossRef] [PubMed]
  24. Fichele, S.; Paley, M.N.; Woodhouse, N.; Griffiths, P.D.; Van Beek, E.J.; Wild, J.M. Finite-difference simulations of 3He diffusion in 3D alveolar ducts: Comparison with the “cylinder model”. Magn. Reson. Med. 2004, 52, 917–920. [Google Scholar] [CrossRef]
  25. Chan, H.F.; Stewart, N.J.; Norquay, G.; Collier, G.J.; Wild, J.M. 3D diffusion-weighted 129Xe MRI for whole lung morphometry. Magn. Reson. Med. 2018, 79, 2986–2995. [Google Scholar] [CrossRef] [PubMed]
  26. Evans, A.; McCormack, D.G.; Santyr, G.; Parraga, G. Mapping and quantifying hyperpolarized 3He magnetic resonance imaging apparent diffusion coefficient gradients. J. Appl. Physiol. 2008, 105, 693–699. [Google Scholar] [CrossRef] [PubMed]
  27. Capaldi, D.P.; Zha, N.; Guo, F.; Pike, D.; McCormack, D.G.; Kirby, M.; Parraga, G. Pulmonary Imaging Biomarkers of Gas Trapping and Emphysema in COPD: 3He MR Imaging and CT Parametric Response Maps. Radiology 2016, 279, 597–608. [Google Scholar] [CrossRef] [PubMed]
  28. Shen, W.; Yang, J.; Sun, Y.; Hiura, G.; Balte, P.; Dashnaw, S.; Prince, M.; Hoffman, E.; Venkatesh, B.; Lima, J.; et al. Late Breaking Abstract—Apparent Diffusion Coefficient by 3He MRI and quantitative emphysema subtypes by CT. Eur. Respir. J. 2019, 54, OA1929. [Google Scholar]
  29. Barker, A.L.; Eddy, R.L.; MacNeil, J.L.; McCormack, D.G.; Kirby, M.; Parraga, G. CT pulmonary vessels and MRI ventilation in chronic obstructive pulmonary disease: Relationship with worsening FEV1 in the TINCan cohort study. Acad. Radiol. 2021, 28, 495–506. [Google Scholar] [CrossRef]
  30. Bild, D.E.; Bluemke, D.A.; Burke, G.L.; Detrano, R.; Diez Roux, A.V.; Folsom, A.R.; Greenland, P.; Jacob, D.R., Jr.; Kronmal, R.; Liu, K.; et al. Multi-Ethnic Study of Atherosclerosis: Objectives and design. Am. J. Epidemiol. 2002, 156, 871–881. [Google Scholar] [CrossRef]
  31. Smith, B.M.; Hoffman, E.A.; Rabinowitz, D.; Bleecker, E.; Christenson, S.; Couper, D.; Donohue, K.M.; Han, M.K.; Hansel, N.N.; Kanner, R.E.; et al. Comparison of spatially matched airways reveals thinner airway walls in COPD. The Multi-Ethnic Study of Atherosclerosis (MESA) COPD Study and the Subpopulations and Intermediate Outcomes in COPD Study (SPIROMICS). Thorax 2014, 69, 987–996. [Google Scholar] [CrossRef]
  32. Chupp, T.E.; Wagshul, M.E.; Coulter, K.P.; McDonald, A.B.; Happer, W. Polarized, high-density, gaseous 3He targets. Phys. Rev. C Nucl. Phys. 1987, 36, 2244–2251. [Google Scholar] [CrossRef] [PubMed]
  33. Deninger, A.J.; Eberle, B.; Bermuth, J.; Escat, B.; Markstaller, K.; Schmiedeskamp, J.; Schreiber, W.G.; Surkau, R.; Otten, E.; Kauczor, H.U. Assessment of a single-acquisition imaging sequence for oxygen-sensitive 3He-MRI. Magn. Reson. Med. 2002, 47, 105–114. [Google Scholar] [CrossRef] [PubMed] [Green Version]
  34. Deninger, A.J.; Eberle, B.; Ebert, M.; Grossmann, T.; Hanisch, G.; Heil, W.; Kauczor, H.U.; Markstaller, K.; Otten, E.; Schreiber, W.; et al. 3He-MRI-based measurements of intrapulmonary pO2 and its time course during apnea in healthy volunteers: First results, reproducibility, and technical limitations. NMR Biomed. 2000, 13, 194–201. [Google Scholar] [CrossRef]
  35. Hamedani, H.; Clapp, J.; Kadlecek, S.; Rizi, R.R. PAO2 Mapping using HP Gas MRI. In Hyperpolarized Inert Gas MRI; Elsevier: Amsterdam, The Netherlands, 2017. [Google Scholar]
  36. Saam, B.; Happer, W.; Middleton, H. Nuclear relaxation of 3He in the presence of O2. Phys. Rev. A 1995, 52, 862–865. [Google Scholar] [CrossRef] [PubMed]
  37. Avants, B.B.; Tustison, N.; Song, G. Advanced Normalization Tools (ANTS); University of Pennsylvania: Philadelphia, PA, USA, 2011. [Google Scholar]
  38. Hughes, P.J.C.; Smith, L.; Chan, H.F.; Tahir, B.A.; Norquay, G.; Collier, G.J.; Biancardi, A.; Marshall, H.; Wild, J.M. Assessment of the influence of lung inflation state on the quantitative parameters derived from hyperpolarized gas lung ventilation MRI in healthy volunteers. J. Appl. Physiol. 2019, 126, 183–192. [Google Scholar] [CrossRef]
  39. Zhang, X.; Angelini, E.D.; Haghpanah, F.S.; Laine, A.F.; Sun, Y.; Hiura, G.T.; Dashnaw, S.M.; Prince, M.R.; Hoffman, E.A.; Ambale-Venkatesh, B.; et al. Quantification of lung ventilation defects on hyperpolarized MRI: The Multi-Ethnic Study of Atherosclerosis (MESA) COPD study. Magn. Reson. Imaging 2022, 92, 140–149. [Google Scholar] [CrossRef]
  40. Sieren, J.P.; Newell, J.D., Jr.; Barr, R.G.; Bleecker, E.R.; Burnette, N.; Carretta, E.E.; Couper, D.; Goldin, J.; Guo, J.; Han, M.K. SPIROMICS protocol for Multicenter Quantitative Computed Tomography to phenotype the lungs. Am. J. Respir. Crit. Care Med. 2016, 194, 794–806. [Google Scholar] [CrossRef]
  41. Grau, M.; Barr, R.G.; Lima, J.A.; Hoffman, E.A.; Bluemke, D.A.; Carr, J.J.; Chahal, H.; Enright, P.L.; Jain, A.; Prince, M.R.; et al. Percent emphysema and right ventricular structure and function: The Multi-Ethnic Study of Atherosclerosis-Lung and Multi-Ethnic Study of Atherosclerosis-Right Ventricle Studies. Chest 2013, 144, 136–144. [Google Scholar] [CrossRef]
  42. Smith, B.M.; Kawut, S.M.; Bluemke, D.A.; Basner, R.C.; Gomes, A.S.; Hoffman, E.; Kalhan, R.; Lima, J.A.; Liu, C.Y.; Michos, E.D.; et al. Pulmonary hyperinflation and left ventricular mass: The Multi-Ethnic Study of Atherosclerosis COPD Study. Circulation 2013, 127, 1503–1511, 1511.e1–1511.e6. [Google Scholar] [CrossRef]
  43. Ouriadov, A.; Farag, A.; Kirby, M.; McCormack, D.G.; Parraga, G.; Santyr, G.E. Pulmonary hyperpolarized 129Xe morphometry for mapping xenon gas concentrations and alveolar oxygen partial pressure: Proof-of-concept demonstration in healthy and COPD subjects. Magn. Reson. Med. 2015, 74, 1726–1732. [Google Scholar] [CrossRef]
Figure 1. Workflow for the lung MRI co-registration between different breath stages.
Tomography 08 00190 g001
Figure 2. Color maps of three subjects with different levels of disease severity. Left column: subject with no COPD, center column: mild COPD, right column: severe COPD; from top to bottom: pAO2 color map, ADC color map, ventilation scan. On the ventilation scans blue corresponds to non-ventilated regions, green hypo-ventilated and yellow normal.
Tomography 08 00190 g002
Figure 3. pAO2 mean vs. ADC mean (top), pAO2 SD vs. ADC mean (center) Percent negative pAO2 vs. ADC mean (bottom). Each measurement corresponds to an individual participant imaged with polarized 3He from the MESA COPD Study.
Tomography 08 00190 g003
Figure 4. Average percent negative pAO2 per subject in normal, hypo-, and non-ventilated for a single subject.
Tomography 08 00190 g004
Table 1. Characteristics of the study population.
CharacteristicAll Participants
(n = 54)
Age, years—mean ± SD73.3 ± 7.4
Female—N (%)22 (40.7%)
Race/Ethnicity—N (%)
White28 (51.9%)
Black17 (31.5%)
Hispanic9 (16.6%)
Height, cm—mean ± SD175.8 ± 4.8
Weight, lb—mean ± SD75.8 ± 14.2
Smoking status—N (%)
Former smoker38 (70.4%)
Current smoker16 (29.6%)
Pack-years—mean ± SD41.3 ± 23.0
Educational attainment—N (%)
<High school degree15 (27.8%)
College degree24 (44.4%)
Some college/2-year degree15 (27.8%)
Spirometry (post-bronchodilator)
FEV1 (mL)—mean ± SD, n = 532157 ± 577
FVC (mL)—mean ± SD, n = 533326 ± 965
FEV1/FVC—mean ± SD, n = 530.67 ± 0.13
COPD—No. (%)29 (53.7%)
COPD severity—N (%)
None25 (46.3%)
Mild13 (24.1%)
Moderate16 (29.6%)
CT measures
Total lung volume (mL)—mean ± SD5460 ± 1353
Total tissue volume (mL)—mean ± SD835 ± 176
Total air volume (mL)—mean ± SD4625 ± 1220
% emphysema −950 HU—median [IQR]2.1 [0.9, 7.1]
Visual emphysema severity (%) 1—median [IQR]0.24 [0, 2.31]
DLCO measures, n = 34
DLCO (%)—mean ± SD18.1 ± 4.9
3He MRI measures
pAO2 mean (bar)—median [IQR]0.093 [0.084, 0.103]
pAO2 SD (bar)—median [IQR]0.052 [0.037, 0.064]
pAO2 %negative—median [IQR]4.9 [2.1, 7.5]
ADC mean (cm2/s)—median [IQR]0.302 [0.267, 0.383]
1 Calculated as the sum of the severity scores for centrilobular, panlobular, and paraseptal emphysema; DLCO, diffusing capacity of carbon monoxide. COPD status was defined as: post-bronchodilator FEV1/FVC < 0.7. COPD severity was defined as: Mild: %-predicted FEV1 ≥ 80; Moderate: 50 ≤ %-predicted FEV1 < 80.
Table 2. Gas composition for imaging sequences.
Scan3HeN2Breath-Hold
Calibration150 cc--
Ventilation300 cc700 ccTLC
ADC500 cc500 ccTLC
pAO2350 cc650 ccFRC + 1 L
Table 3. Spearman’s correlation coefficients between emphysema measures and pAO2 measures.
Global pAO2 Mean 1Global pAO2 SD 1Global pAO2 %Negative 1ADC Mean 1
MeasureNρ (95% CI)pρ (95% CI)pρ (95% CI)pρ (95% CI)p
%emphysema −950 HU54−0.08 (−0.34, 0.20)0.590.48 (0.24, 0.66)0.0002 *0.50 (0.27, 0.68)<0.0001 *0.81 (0.68, 0.89)<0.0001 *
Visual emphysema severity (%) 2500.24 (−0.05, 0.48)0.100.38 (0.11, 0.59)0.006 *0.32 (0.04, 0.55)0.02 *0.66 (0.44, 0.79)<0.0001 *
ADC mean (cm2/s)50−0.07 (−0.34, 0.21)0.610.53 (0.29, 0.70)<0.0001 *0.45 (0.20, 0.65)0.0008 *--
1 Per 0.01 change. 2 Calculated as the sum of the severity scores for centrilobular, panlobular, and paraseptal emphysema. * p-value < 0.05. ADC, apparent diffusion coefficient; HU, Hounsfield units; pAO2, partial pressure of oxygen; ρ, Spearman’s correlation coefficient; SD, standard deviation, Fisher’s z-transformation was used to calculate 95% confidence intervals.
Table 4. Global associations with pAO2 measures.
pAO2 MeanpAO2 SDpAO2 %Negative
ExposureNβ (95% CI)pβ (95% CI)pβ (95% CI)p
%emphysema −950 HU
Unadjusted54−0.0007 (−0.002, 0.0005)0.260.002 (0.0009, 0.003)0.0002 *0.57 (0.29, 0.86)0.0002 *
Model 154−0.0003 (−0.002, 0.0009)0.620.001 (0.0003, 0.002)0.005 *0.37 (0.11, 0.63)0.007 *
Model 253−0.0001 (−0.001, 0.001)0.850.001 (0.0003, 0.002)0.006 *0.32 (0.05, 0.60)0.02 *
Visual emphysema severity (%) 1
Unadjusted50−0.0002 (−0.001, 0.0006)0.640.0008 (0.0002, 0.001)0.01 *0.29 (0.10, 0.48)0.004 *
Model 150−0.00005 (−0.0008, 0.0007)0.900.0005 (0.0001, 0.001)0.02 *0.22 (0.05, 0.38)0.01 *
Model 2490.00006 (−0.0008, 0.0009)0.890.0005 (0.00003, 0.001)0.04 *0.19 (0.01, 0.36)0.04 *
ADC 2
Unadjusted50−0.0005 (−0.001, 0.0002)0.170.0008 (0.0003, 0.001)0.003 *0.36 (0.12, 0.61)0.004 *
Model 150−0.0004 (−0.001, 0.0004)0.330.0007 (0.0002, 0.001)0.005 *0.30 (0.08, 0.53)0.01 *
Model 249−0.0002 (−0.001, 0.0006)0.630.0006 (0.0002, 0.001)0.01 *0.24 (0.02, 0.47)0.04 *
DLCO
Unadjusted34−0.0003 (−0.002, 0.001)0.650.001 (0.0003, 0.002)0.007 *0.23 (0.05, 0.41)0.01 *
Model 134−0.0001 (−0.002, 0.002)0.93−0.001 (−0.002, −0.00003)0.04 *−0.22 (−0.46, 0.01)0.06
Model 234−0.0001 (−0.002, 0.002)0.91−0.001 (−0.002, −0.00004)0.04 *−0.22 (−0.45, 0.01)0.06
1 Calculated as the sum of the severity scores for centrilobular, panlobular, and paraseptal emphysema. 2 Per 0.01 change. * p-value < 0.05. ADC, apparent diffusion coefficient; HU, Hounsfield units; pAO2, partial pressure of oxygen; SD, standard deviation. Unadjusted: (weighted). Model 1: adjusted for age, sex, race/ethnicity, cigarette smoking status (weighted). Model 2: Model 1 + %-predicted FEV1 (weighted). Generalized linear models were used, and participants were weighted on the inverse ratio of probability of selection.
Table 5. Regional associations between percent emphysema or pulmonary emphysema subtype severity and pAO2 measures.
pAO2 MeanpAO2 SDpAO2 %Negative
Exposureβ (95% CI)pβ (95% CI)pβ (95% CI)p
%emphysema, log-transformed 1
Unadjusted (n = 54)0.0001 (−0.003, 0.003)0.940.0006 (−0.002, 0.003)0.610.43 (−0.44, 1.30)0.33
Model 1 (n = 54)0.0008 (−0.002, 0.004)0.590.00002 (−0.002, 0.002)0.990.15 (−0.71, 1.01)0.73
Model 2 (n = 53)0.001 (−0.002, 0.004)0.39−0.0004 (−0.003, 0.002)0.74−0.05 (−0.92, 0.81)0.90
Visual emphysema severity (%), log-transformed 1,2
Unadjusted (n = 50)−0.0007 (−0.005, 0.004)0.730.006 (0.002, 0.009)0.001 *1.61 (0.36, 2.86)0.01 *
Model 1 (n = 50)−0.0005 (−0.005, 0.004)0.800.005 (0.002, 0.008)0.003 *1.46 (0.29, 2.63)0.01 *
Model 2 (n = 49)0.0009 (−0.004, 0.005)0.690.003 (0.0001, 0.007)0.04 *0.87 (−0.38, 2.11)0.17
Severity scores of pulmonary emphysema subtypes, log-transformed 1,3
Unadjusted (n = 50)
CLE severity0.003 (−0.004, 0.009)0.38−0.0006 (−0.006, 0.005)0.82−0.42 (−2.31, 1.48)0.67
PLE severity0.001 (−0.005, 0.008)0.680.002 (−0.002, 0.007)0.330.96 (−0.84, 2.76)0.30
PSE severity−0.006 (−0.01, 0.002)0.130.008 (0.002, 0.01)0.005 *2.29 (0.22, 4.37)0.03 *
Model 1 (n = 50)
CLE severity0.003 (−0.004, 0.009)0.39−0.0001 (−0.005, 0.005)0.97−0.20 (−2.02, 1.62)0.83
PLE severity0.001 (−0.005, 0.007)0.760.002 (−0.002, 0.007)0.291.31 (−0.46, 3.08)0.15
PSE severity−0.004 (−0.01, 0.003)0.240.006 (0.0002, 0.01)0.04 *1.53 (−0.54, 3.60)0.15
Model 2 (n = 49)
CLE severity0.004 (−0.003, 0.01)0.29−0.001 (−0.006, 0.004)0.69−0.56 (−2.42, 1.30)0.56
PLE severity0.0009 (−0.005, 0.007)0.770.003 (−0.002, 0.007)0.281.33 (−0.44, 3.09)0.14
PSE severity−0.003 (−0.01, 0.005)0.500.004 (−0.002, 0.01)0.170.69 (−1.45, 2.83)0.53
1 Continuous exposure variables (i.e., %emphysema, pulmonary emphysema subtype severity scores) were log-transformed to achieve approximately normal distributions of residuals. 2 Calculated as the sum of the severity scores for centrilobular, panlobular, and paraseptal emphysema. 3 Pulmonary emphysema subtypes are adjusted for each other. * p-value < 0.05. CLE, centrilobular emphysema; PLE, panlobular emphysema; PSE, paraseptal emphysema. Mixed models with a random intercept, variance component (VC) structure, and Kenward-Roger’s. approximation of the degrees of freedom were used. Participants were weighted on the inverse ratio of probability of selection. Pulmonary emphysema subtypes were qualitatively assessed at the baseline MESA COPD exam and scored from 0–100. Two participants were excluded due to non-physiological results. Unadjusted: (weighted). Model 1: adjusted for age, sex, race/ethnicity, and cigarette smoking status (weighted). Model 2: Model 1 + %-predicted FEV1 (weighted).
Publisher’s Note: MDPI stays neutral with regard to jurisdictional claims in published maps and institutional affiliations.

