Article

Visual Evaluation of Ultrafast MRI in the Assessment of Residual Breast Cancer after Neoadjuvant Systemic Therapy: A Preliminary Study Association with Subtype

1
Department of Diagnostic Imaging and Nuclear Medicine, Kyoto University Graduate School of Medicine, 54 Shogoin-Kawaharacho, Kyoto 606-8507, Japan
2
Department of Diagnostic Radiology, Kansai Electric Power Hospital, 2-1-7, Fukushima, Osaka 553-0003, Japan
3
Institute for Advancement of Clinical and Translational Science (iACT), Kyoto University Hospital, 4 Shogoin-Kawaharacho, Kyoto 606-8507, Japan
4
Department of Translational Medicine, Diagnostic Radiology, Lund University, Skåne University Hospital, 205-02 Malmo, Sweden
5
Department of Diagnostic Radiology, Kyoto Katsura Hospital, Yamadahirao-cho, Kyoto 615-8256, Japan
6
MR Application Predevelopment, Siemens Healthcare GmbH, Allee am Roethelheimpark 2, 91052 Erlangen, Germany
7
Department of Diagnostic Pathology, Kyoto University Hospital, 54 Shogoin-Kawaharacho, Kyoto 606-8507, Japan
8
Department of Breast Surgery, Kyoto University Graduate School of Medicine, 54 Shogoin-Kawaharacho, Kyoto 606-8507, Japan
*
Author to whom correspondence should be addressed.
Tomography 2022, 8(3), 1522-1533; https://doi.org/10.3390/tomography8030125
Submission received: 15 May 2022 / Revised: 7 June 2022 / Accepted: 9 June 2022 / Published: 10 June 2022
(This article belongs to the Section Cancer Imaging)

Abstract

:
The purpose of this study was to investigate the diagnostic performance of ultrafast DCE (UF-DCE) MRI after the completion of neoadjuvant systemic therapy (NST) in breast cancer. In this study, MR examinations of 55 post-NST breast cancers were retrospectively analyzed. Residual tumor sizes were measured in the 20th phase of UF-DCE MRI, early and delayed phases of conventional DCE MRI, and high spatial-resolution CE MRI (UF, early, delayed, and HR, respectively). The diagnostic performance for the detection of residual invasive cancer was calculated by ROC analysis. The size difference between MRI and pathological findings was analyzed using the Wilcoxon signed-rank test with the Bonferroni correction. The overall AUC was highest for UF (0.86 and 0.88 for readers 1 and 2, respectively). The difference in imaging and pathological sizes for UF (5.7 ± 8.2 mm) was significantly smaller than those for early, delayed, and HR (p < 0.01). For luminal subtype breast cancer, the size difference was significantly smaller for UF and early than for delayed (p < 0.01). UF-DCE MRI demonstrated higher AUC and specificity for the more accurate detection of residual cancer and the visualization of tumor extent than conventional DCE MRI.

1. Introduction

Neoadjuvant systemic therapy (NST) is a well-established treatment for breast cancer that can downstage the tumor for less-invasive surgery and provide information on response to chemotherapy [1]. Pathological CR (pCR) after NST is an important prognostic factor, especially in triple-negative breast cancer (TNBC) and HER2-enriched breast cancer (HER2+BC) [2].
In previous studies, surgery was considered unnecessary in patients whose cancer had disappeared after NST [3,4]. However, early attempts to avoid surgery resulted in increased local recurrence because the determination of clinical CR (cCR) based on palpation and conventional imaging modalities [3,5] was not as accurate as the determination of cCR based on MRI [6]. Recently, a trial for non-surgical treatment started enrolling Stage I or II HER2+BC or TNBC patients, in whom CR after NST was determined by image-guided biopsy [7].
Because pCR can only be confirmed after surgery, cCR is used as an alternative for preoperative treatment planning. Although a biopsy is often useful, it sometimes fails to sample the viable portion of a heterogeneous tumor, whereas DCE MRI can evaluate the entire residual lesion. Meanwhile, the performance of MRI for the prediction of pCR has an unsatisfactory accuracy of around 74% [8]. Furthermore, enhancing scarring or inflammatory tissue is sometimes misdiagnosed as residual cancer [9]. The improved accuracy of MRI in predicting pCR may lead to the establishment of non-surgical treatment options for breast cancer patients.
Ultrafast DCE (UF-DCE) MRI is an emerging protocol with high temporal and spatial resolution. It can capture the inflow of breast lesions, which is useful for distinguishing cancer tissue with fast initial enhancement from benign or normal breast tissue with slow enhancement. UF-DCE MRI provided improved conspicuity of cancer in the very early phase, before the enhancement of benign or normal parenchyma was observed [10,11,12,13,14,15]. In the post NAC status, the residual tumor is enhanced weaker than before, which overlaps the slow enhancement of post-treatment inflammation or scarring and causes overestimation of residual tumor. We hypothesized that UF-DCE MRI may perform better in distinguishing rapidly enhancing viable cancer tissue from gradually enhancing scarring or inflammatory tissue after NST compared with conventional DCE MRI (Figure 1).
Recently, some studies investigated the use of UF-DCE MRI to assess the breast cancer response to NST. Kim et al., found an association between UF-DCE MRI-derived parameters and pCR among triple-negative breast cancer patients [16]. According to one study, evaluating the diagnostic performance of UF-DCE MRI to detect residual cancer after NST, UF-DCE MRI was more challenging than evaluating conventional DCE MRI [17]. Image findings after NST may differ among breast cancer subtypes, which may affect the diagnostic performance of UF-DCE MRI. Therefore, the present study aimed to determine the value of UF-DCE MRI for evaluating the post-NST status of breast cancer in association with the subtype.

2. Materials and Methods

2.1. Patients and MRI Setting

This retrospective study was approved by our institutional review board, with a waiver of the requirement for informed consent.
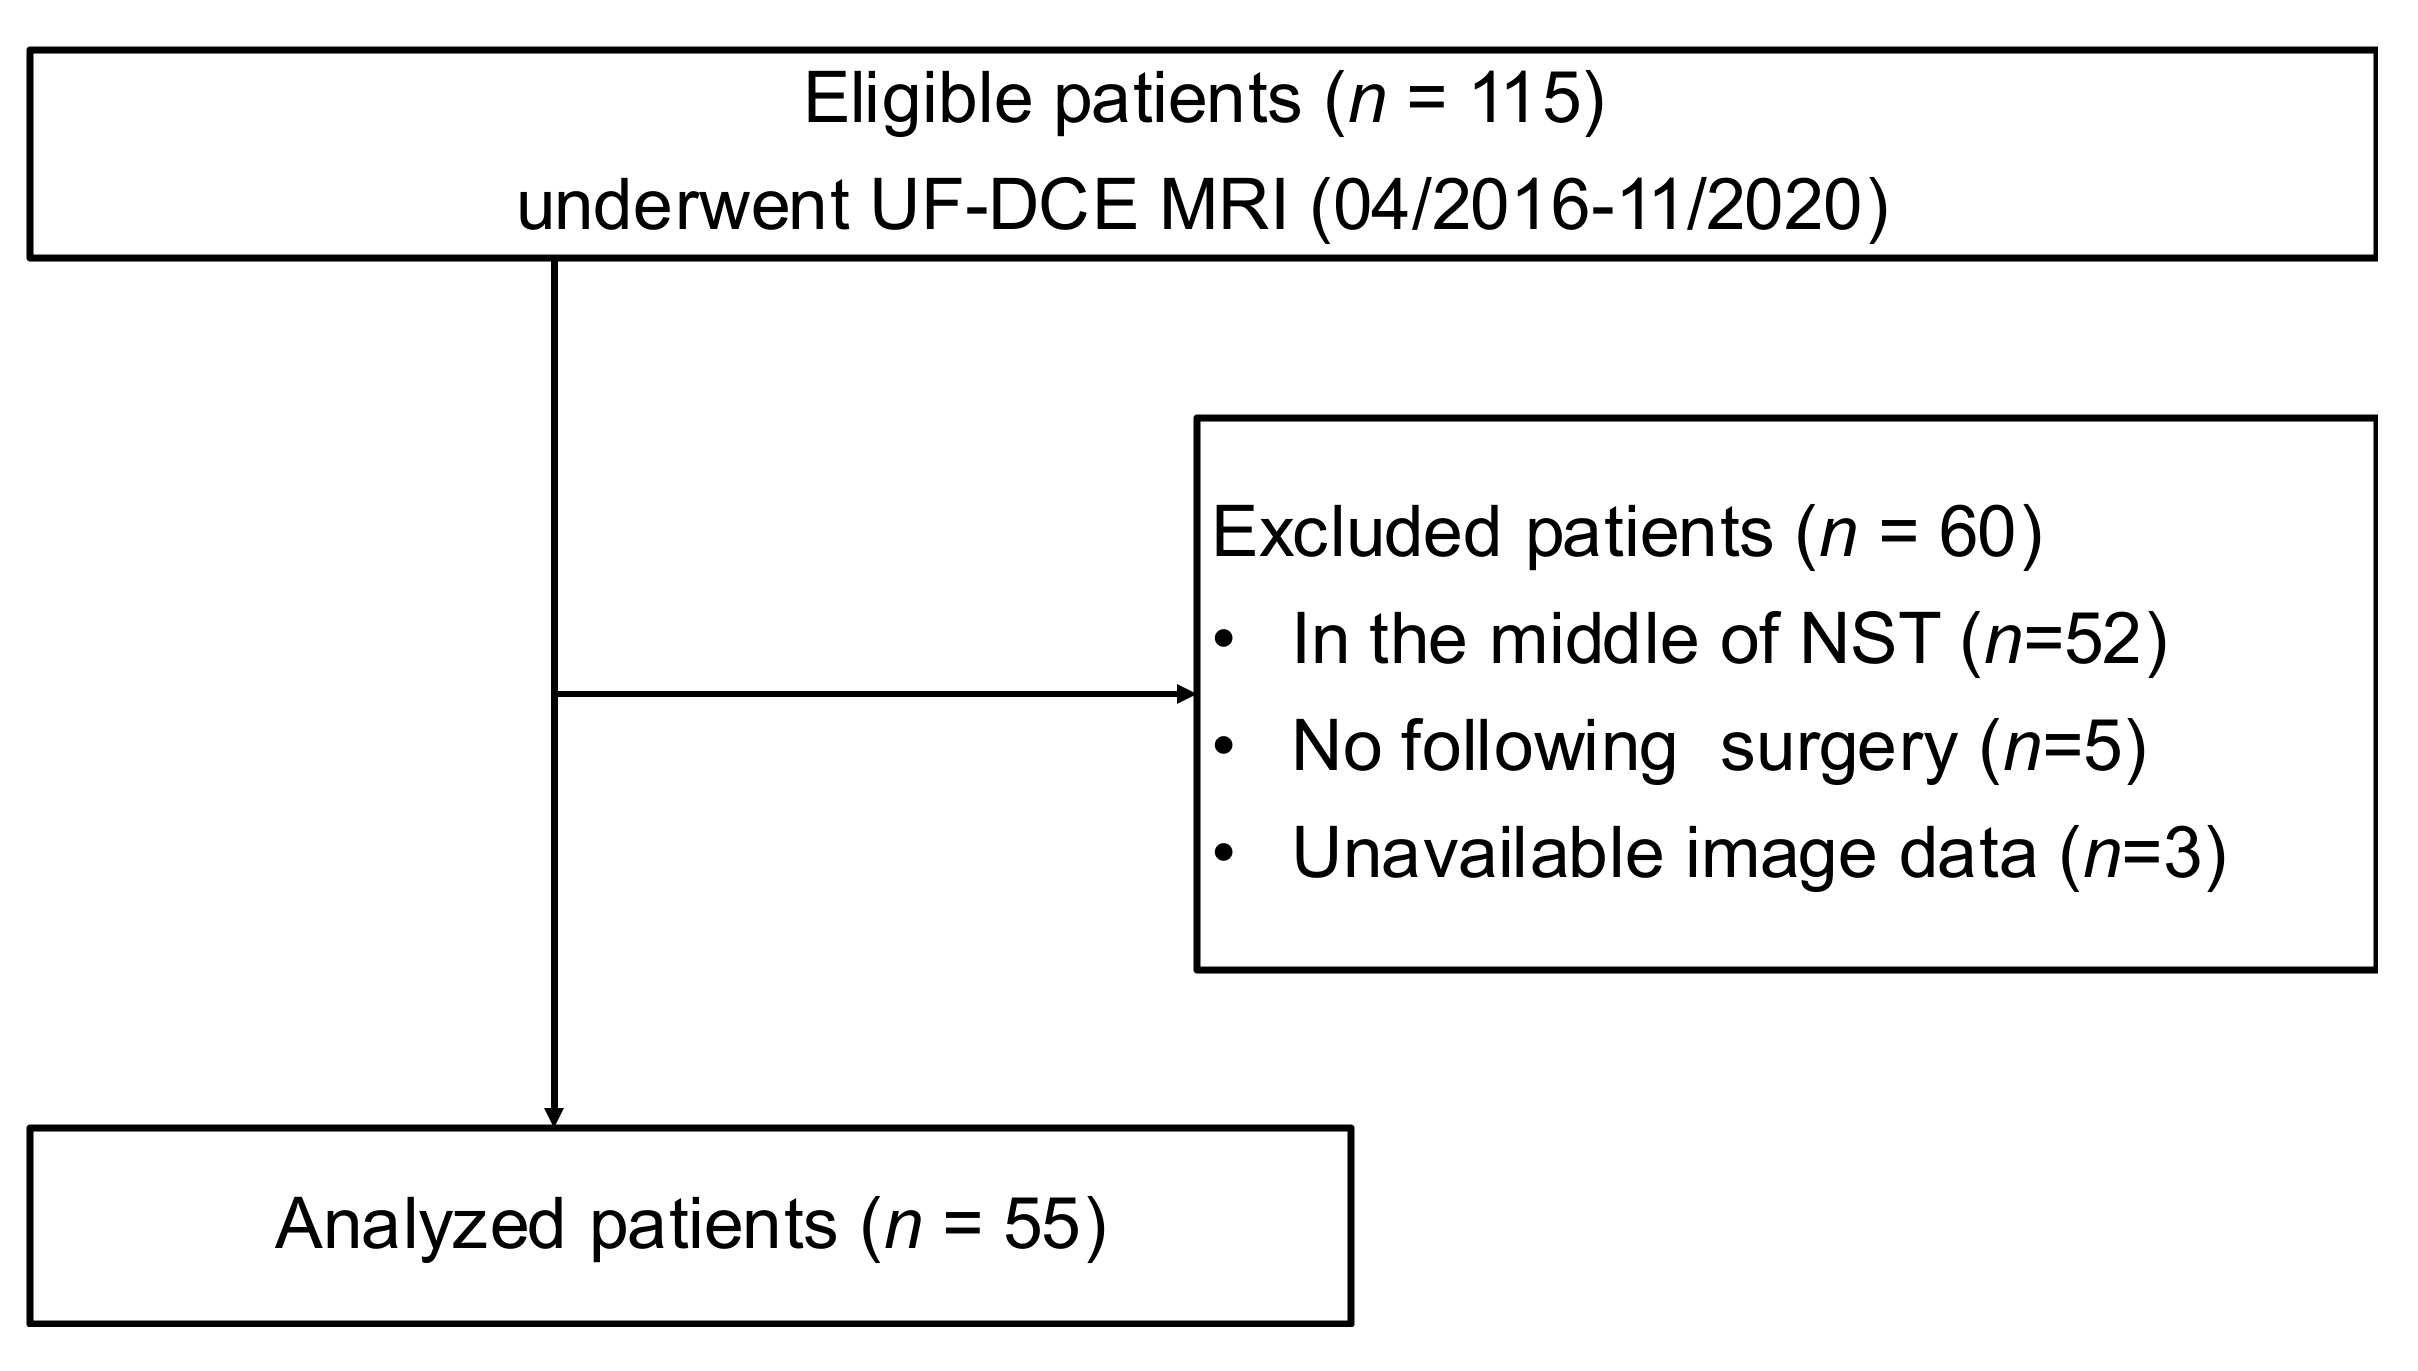
A search of our MRI database identified 115 consecutive breast MR scans for NST evaluation using the UF-DCE protocol from April 2016 to October 2020. From these, 60 scans were excluded for the following reasons: in the middle of NST (n = 52), no surgery (n = 5), and unavailable image data (n = 3). Consequently, 55 female patients (mean age, 49.7 years; range, 26–77 years) who underwent NST for invasive breast cancer and pre-surgical DCE MRI with the UF-DCE protocol were enrolled (Figure 2).
All MRI examinations were performed using a 3T scanner (MAGNETOM Prisma and Skyra; Siemens Healthineer, Erlangen, Germany) with 16- or 18-channel dedicated breast coil. Gadobutrol (Gadovist; Bayer, Berlin, Germany) was intravenously infused at a dose of 0.1 mL/kg and a rate of 2.0 mL/s, followed by 20 mL of saline at the same rate. The DCE MRI protocols were as follows: pre-contrast; UF-DCE MRI, 15 s before to 60 s after contrast injection; 2 s preparation time followed by 3.7 s/phase × 20 phases; early phase of DCE MRI, 60–120 s after contrast injection (early); high spatial-resolution contrast-enhanced MRI, 120–300 s after contrast injection (HR); and delayed phase of DCE MRI, 300–360 s after contrast injection (delayed) (Figure 3). UF-DCE MRI was performed using a prototype based on a 3D gradient-echo volumetric interpolated breath-hold examination sequence with a compressed sensing reconstruction (acceleration, 16.5; iteration number, 30). The images for the 20th phase of UF-DCE MRI (UF), early, delayed, and HR were evaluated. Table 1 summarizes the sequence parameters.

2.2. Image Evaluation

Two independent radiologists, reader 1 (M.H., a board-certified breast radiologist for 10 years) and reader 2 (M.K., a board-certified breast radiologist for 20 years), evaluated the residual enhancing area on the UF, early, delayed, and HR images, in that order. The readers were allowed to refer to the pre-NST MR images. The tumor size and morphology on the pre-NST MR images and patterns of shrinkage were evaluated. The tumor size was defined as the maximum length of the tumor on the axial plane. When no enhancing area was observed, the tumor was considered CR (size = 0). The pattern of shrinkage was classified as “concentric” or “non-concentric”. Concentric shrinkage included simple concentric shrinkage and concentric shrinkage to small foci of <5 mm after NST [18]. The two readers reviewed discordant cases together until they reached a consensus.

2.3. Histopathological Assessment

Tumor subtypes were obtained from histopathology reports on core needle biopsies performed before NST. Estrogen receptor (ER) expression was defined as ≥1% positive cells on immunohistochemical (IHC) examination or Allred score ≥ 3. HER2 positivity was defined as 3+ score on IHC examination or determined by in situ hybridization in cases with 2+ score on IHC examination. ER-positive cancers were classified as luminal subtype; ER-negative and HER2-positive cancers were classified as HER2+BC; and cancers with neither ER nor HER2 positivity were classified as TNBC. Pathological responses were obtained from histopathology reports on surgical specimens, with pCR defined as non-invasive cancer, allowing in situ carcinoma.

2.4. Statistical Analysis

Statistical analyses were performed with R (version 4.0.3; The R Foundation for Statistical Computing, Vienna, Austria) or MedCalc (version 15.1.4; MedCalc, Mariakerke, Belgium). The Wilcoxon rank-sum test and Fisher’s exact test were used to compare variables (patient age, tumor subtype, morphology, size, and shrinkage pattern) between the pCR and non-pCR groups. A value of p < 0.05 was considered statistically significant. The inter-reader agreement for the presence of a residual lesion on each protocol was evaluated by kappa statistics. The kappa values were assessed as follows [19]: ≤0.2, slight agreement; 0.21–0.40, fair agreement; 0.41–0.60, moderate agreement; 0.61–0.80, substantial agreement; and 0.81–0.99, almost perfect agreement. ROC analysis was performed to determine the AUC of each protocol for the presence of a residual lesion. The DeLong method with the Bonferroni correction was performed for pairwise comparisons of ROC curves using easy ROC, a web tool for ROC analysis [20]. The significance level after the Bonferroni correction was defined as p < 0.05/3 = 0.0167. The inter-reader agreement for the lesion diameter was evaluated by intraclass correlation coefficient (ICC) calculation. The ICCs were assessed as follows [21]: <0.50, poor agreement; 0.50–0.75, moderate agreement; 0.75–0.90, good agreement; and >0.90, excellent agreement. The size of the residual lesion on each protocol was compared with that in the surgical specimen, and the difference between the imaging and pathological sizes on each protocol was compared using the Wilcoxon signed-rank test with the Bonferroni correction. The absolute value of “imaging size minus pathological size” was determined to be the “difference”. If the pathological lesion size was <1 mm, it was calculated as 1 mm. The significance level after the Bonferroni correction was defined as p < 0.05/3 = 0.0167. The average values of the two readers were used for the analysis.

3. Results

A total of 55 lesions in 55 patients were evaluated, of which 33 lesions achieved pCR. The patient characteristics are summarized in Table 2. Among the patients, 33 received anthracycline and taxane-based chemotherapy, 15 received anti-HER2 therapy with chemotherapy, and 3 received endocrine therapy with CDK4/6 inhibitor. The remaining four patients were treated with other regimens. The mean interval between MRI and surgery was 14.5 days (range, 1–48 days).
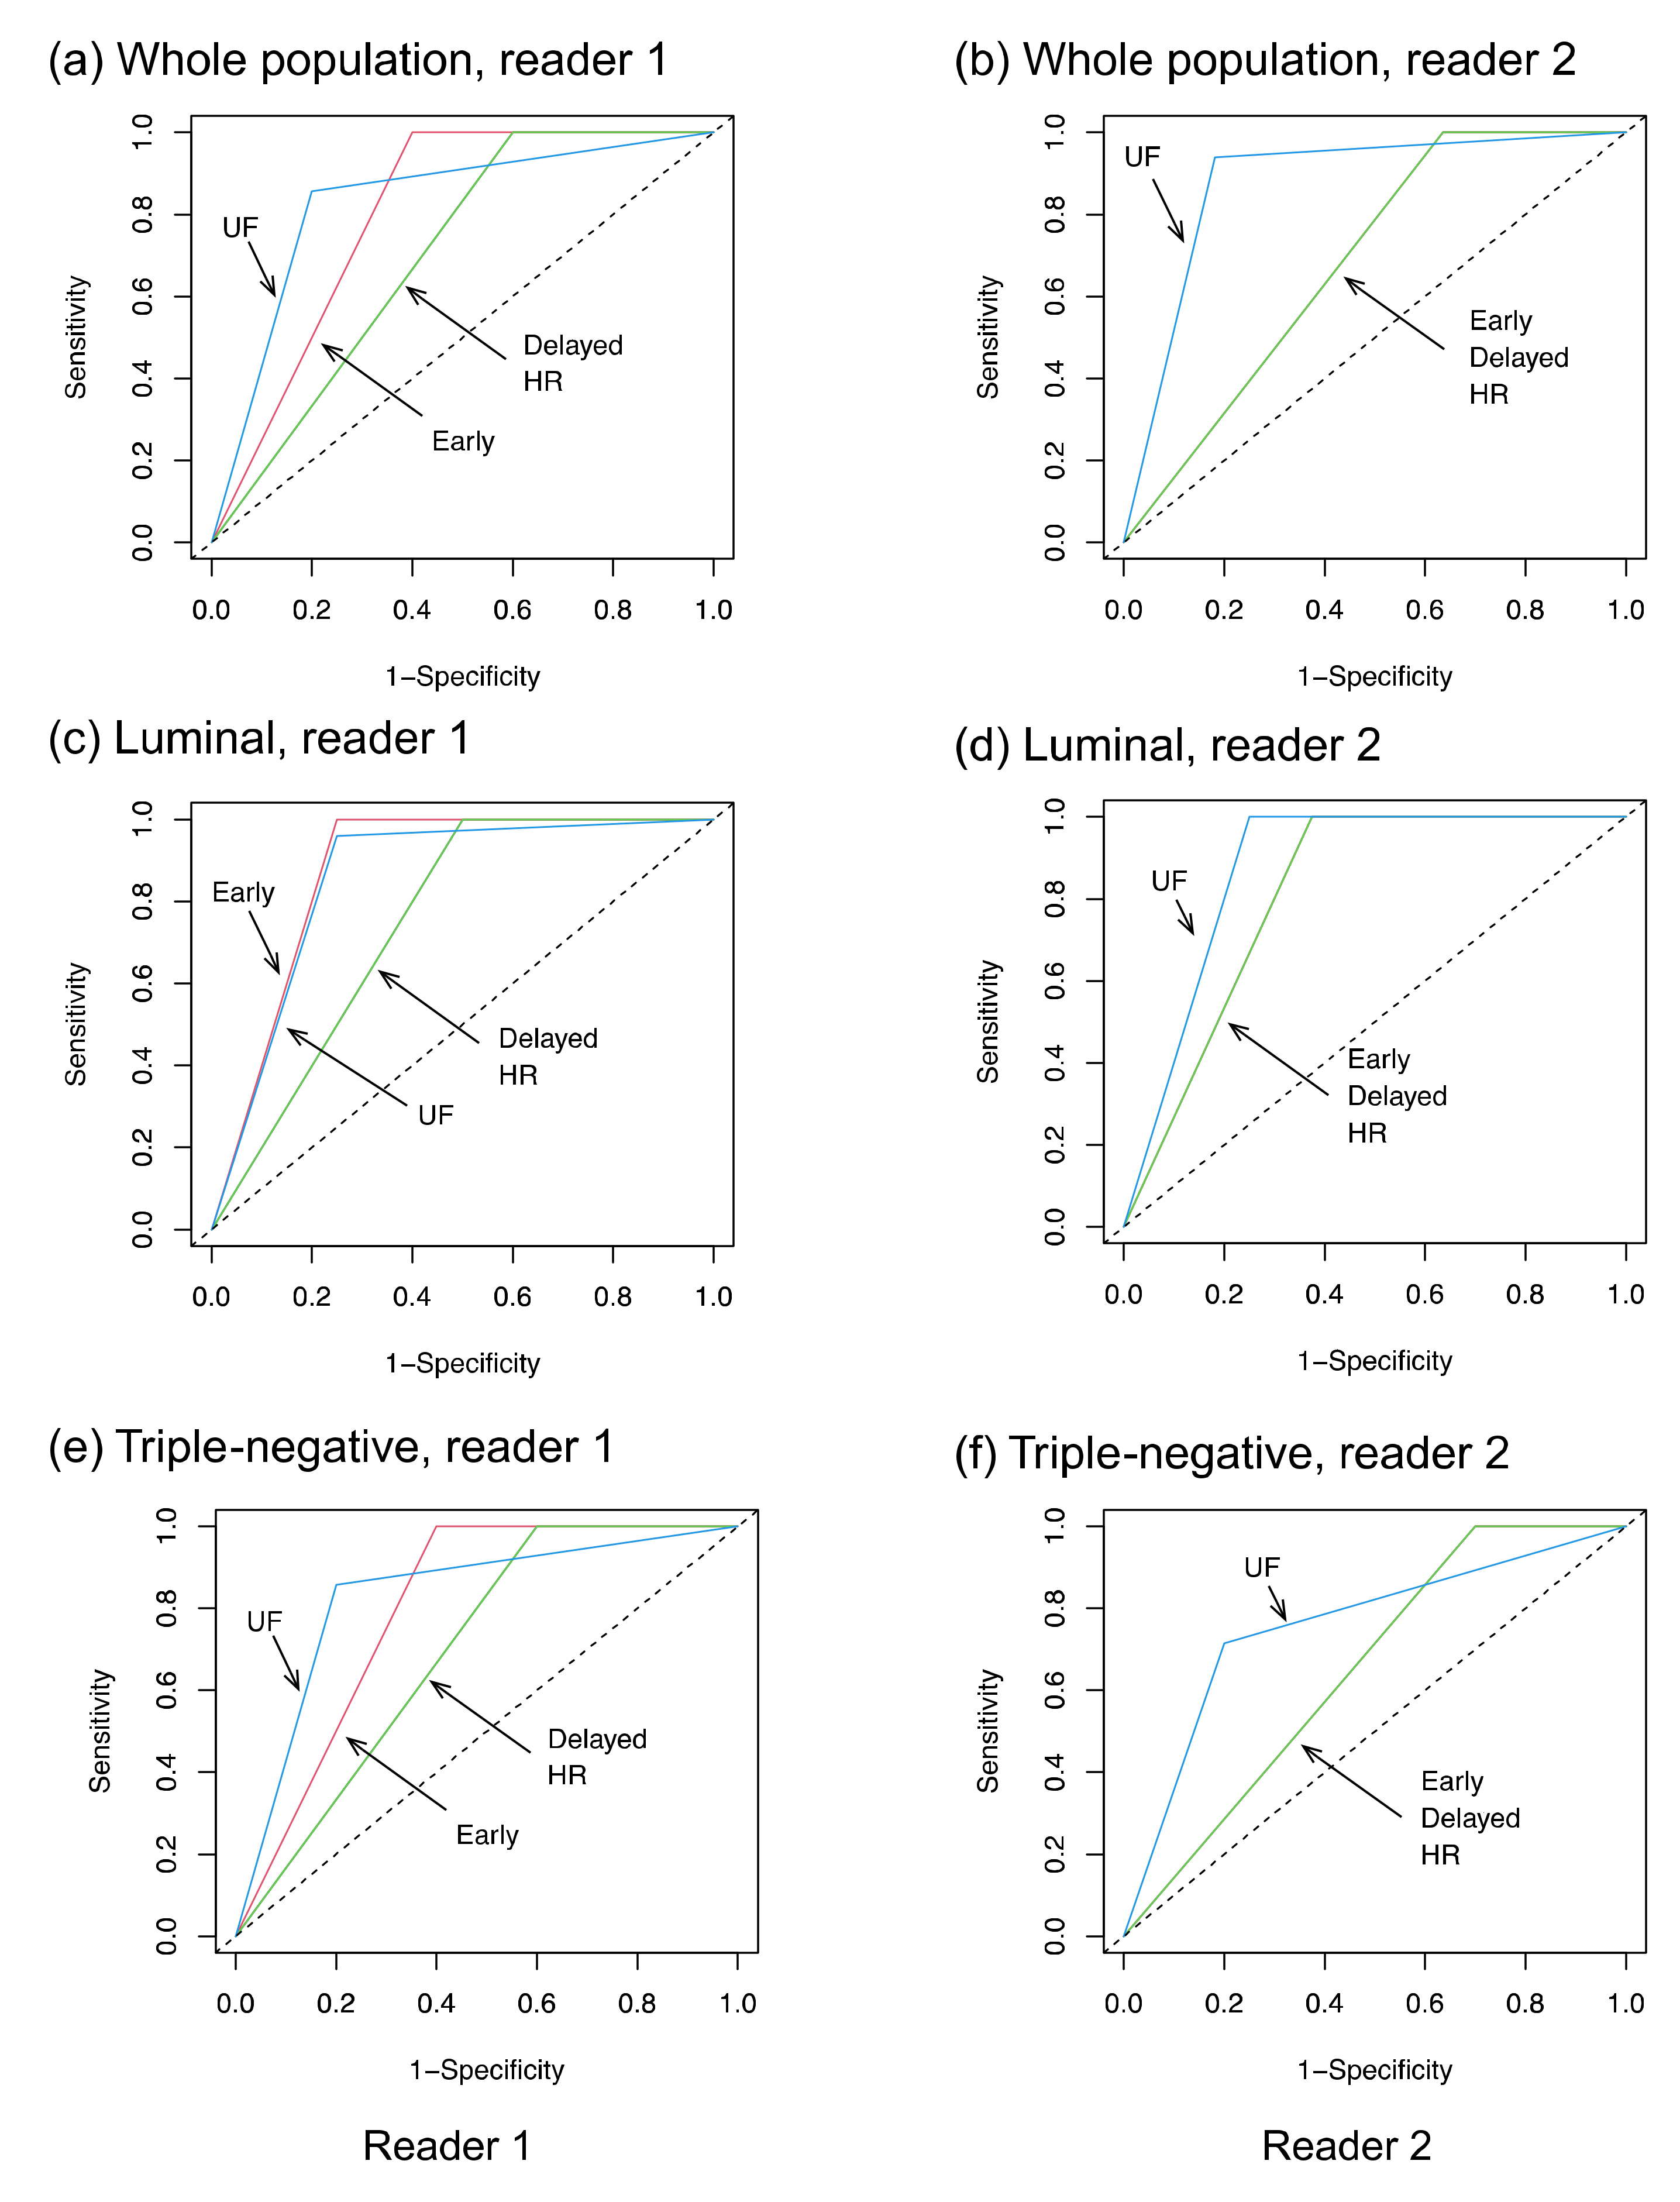
The inter-reader agreement for the presence or absence of a residual lesion was better for UF (kappa = 0.81) than for early, delayed, and HR (kappa = 0.64, 0.68, and 0.52, respectively). Table 3 summarizes the diagnostic performances. The overall AUC on UF (0.86 and 0.88 for reader 1 and reader 2, respectively) was higher than those on early, delayed, and HR (0.80, 0.70, and 0.70 for reader 1, and 0.68, 0.68, and 0.68 for reader 2, respectively) (Figure 4). There was a significant difference between UF and early, delayed, or HR as rated by reader 2. A sub-analysis by subtype revealed no significant difference in terms of AUC, but the specificity on UF (0.80 for both readers) tended to be higher than those on early, delayed, and HR (0.60, 0.40, and 0.40 for reader 1, and 0.30, 0.30, and 0.30 for reader 2, respectively) among TNBC cases. The false-negative cases on UF were one luminal subtype (reader 1, 1 mm of invasive cancer), one HER2+BC (reader 1, 6 mm of invasive cancer), and two TNBC (reader 2, 20 mm of invasive cancer; readers 1 and 2, 5 mm of invasive cancer). All false-negative cases were masses on pre-NST MRI, and all but one of these cases showed a concentric shrinkage pattern.
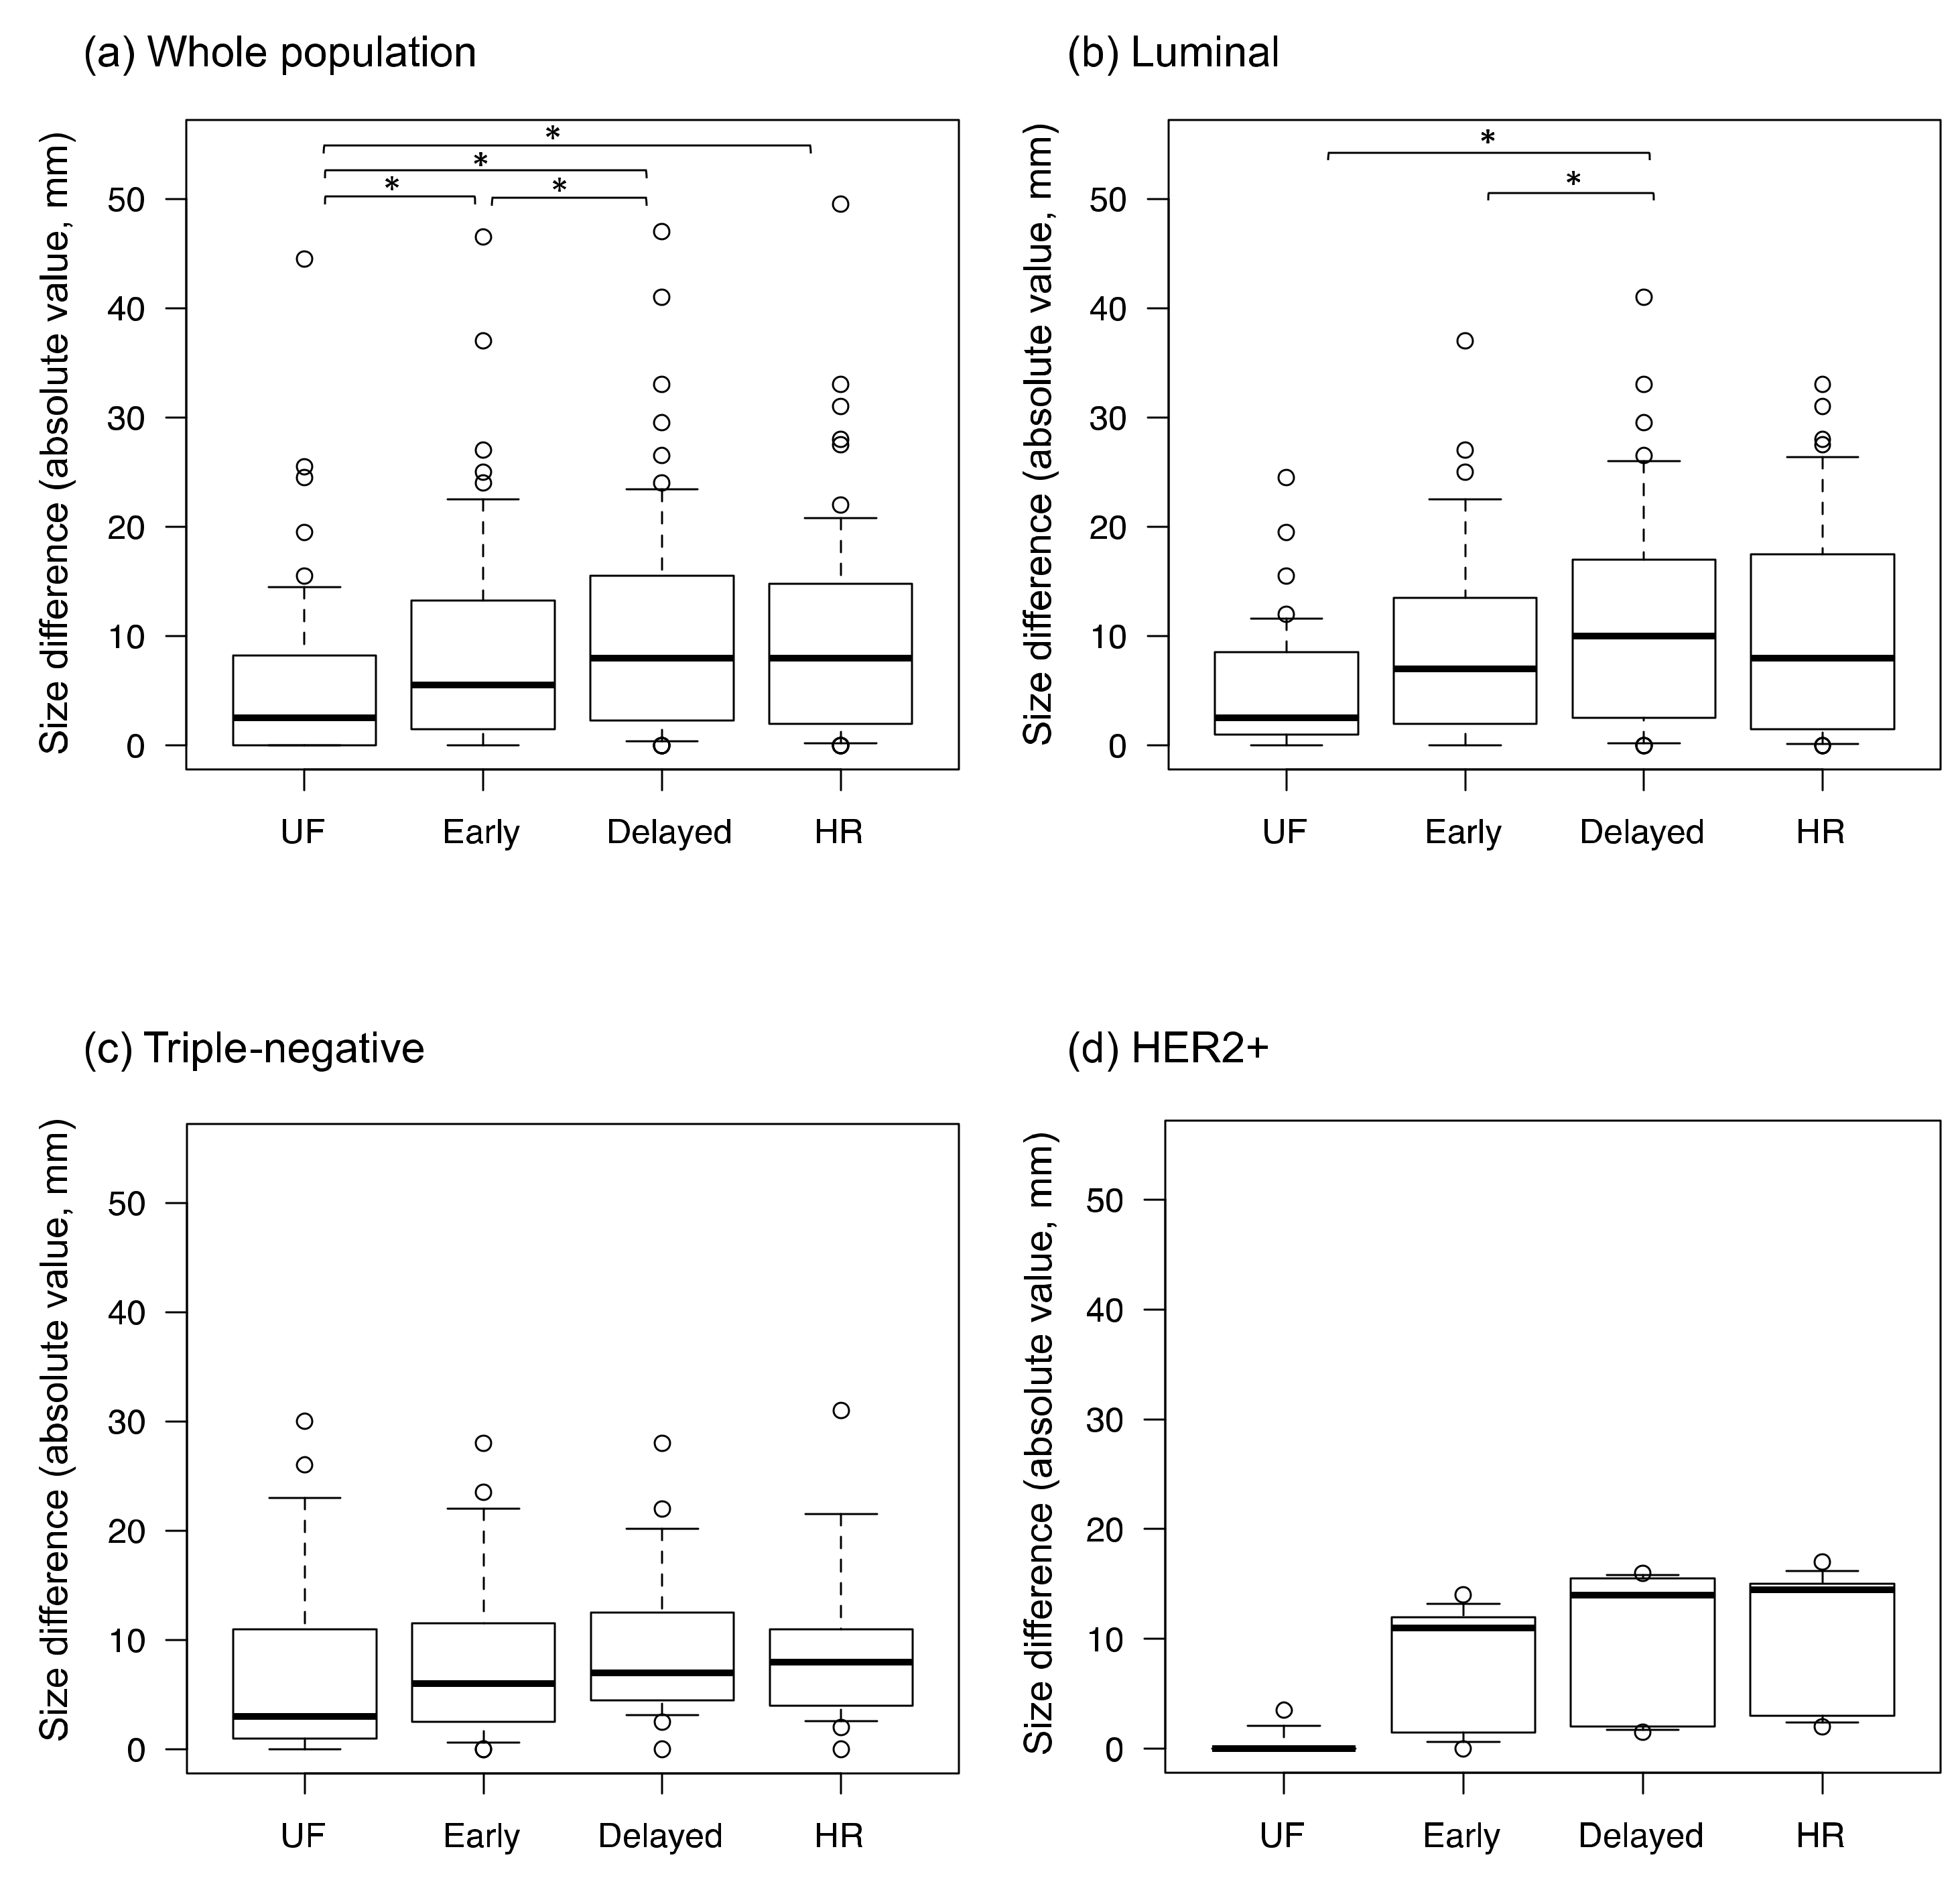
The inter-reader agreement for lesion diameter was excellent on all protocols (ICC: 0.92–0.98). The differences for imaging size compared with pathological size, calculated as the imaging size on each protocol minus the pathological size, are shown in Figure 5. The absolute size differences between the imaging and pathological findings are shown in Figure 6. The difference between the imaging and pathological sizes on UF (5.7 ± 8.2 mm) was significantly smaller than those on early, delayed, and HR (8.9 ± 9.9 mm, 10.6 ± 10.4 mm, and 10.1 ± 26.7 mm, respectively, p < 0.01). Among the luminal subtype cancers, the size difference was significantly smaller on UF and early (5.5 ± 5.9 mm and 9.4 ± 9.5 mm, respectively) than on delayed (11.4 ± 10.6 mm, p < 0.01).
Representative cases are shown in Figure 7 and Figure 8.

4. Discussion

The present results show the potential of UF-DCE MRI for evaluating the post-NST status of breast cancer. With the use of UF-DCE MRI, higher AUC and specificity can be obtained with equivalent sensitivity for the detection of residual cancer than conventional DCE MRI. The final phase of UF-DCE MRI may be an appropriate time to capture the enhancement of residual invasive cancer. The short scanning time is another benefit of UF-DCE MRI for post-NST evaluation.
The present findings differ from those in a previous report that argued the need to observe late enhancement for pCR prediction [22]. The discrepancy may be due to the different definitions of pCR, with in situ lesions allowed or disallowed. A previous study found no significant difference between a residual ductal carcinoma in situ (DCIS) population and a non-residual invasive or in situ disease population in terms of 61-month disease-free survival and 5-year overall survival [23]. A systematic review further found no significant difference in local recurrence rates for DCIS patients who underwent surgery and postoperative radiotherapy between those with clear margins and those with involved margins [24]. These results suggest that residual DCIS can be acceptable after surgery. Kim and colleagues compared the diagnostic performances of the conventional early and delayed phases for the determination of pCR and found a higher AUC in the early phase [25]. Our findings are noteworthy in that UF-DCE MRI can be useful for the detection of invasive disease.
Another study compared ultrafast and standard DCE MRI for the evaluation of breast cancer after NST [17] and found that UF-DCE MRI had higher specificity, which is consistent with the present results. Improved specificity should be an advantage of UF-DCE MRI. Meanwhile, UF-DCE MRI was found to have a lower AUC in the same study. This difference from the present results may partly arise from differences in the treatment regimens, UF-DCE MRI protocols, and contrast agents. A recent study evaluated the functional tumor volume (FTV) in TNBC patients and revealed that FTV at 1 min after injection provided better discrimination between pCR and non-pCR than FTV at 2.5 min after injection [26]. We further demonstrated that UF-DCE MRI can visualize invasive lesions more accurately than conventional DCE MRI, consistent with a previous study [17]. The evaluation of the extent of residual cancer is important for determining the appropriate surgical approach [27]. DCE MRI is the most accurate imaging modality for evaluation of tumor size after NST [28], but the optimal timing of the scan remains to be determined. UF-DCE MRI may be a promising candidate for the measurement of residual invasive cancer.
The sub-analysis by subtype revealed that for the luminal subtype, UF-DCE MRI can significantly reduce the size error for imaging findings relative to pathological findings compared with conventional DCE MRI. A previous study found that the difference in lesion size between DCE MRI and pathological findings was greater for the luminal subtype than for TNBC or HER+BC [29]. Therefore, the use of UF-DCE MRI may improve the size evaluation for luminal subtype cancers after NST.
The de-escalation of surgery is discussed for patients showing CR after NST. In a study on 121 post-NST patients, patients with radiological CR (n = 28) did not undergo surgery but did receive radiotherapy. The patients in this “no surgery” group showed better overall survival and disease-free survival than patients who did not achieve radiological CR and underwent wide-local excision or mastectomy [30]. Because breast surgery affects women’s mental health [31], breast preservation with minimal surgical intervention is preferable. Although MRI-based CR requires confirmation by a biopsy [32], the accurate prediction of pCR using UF-DCE MRI may be helpful in selecting cohorts for de-escalated surgical management.
The limitations of the present study include the retrospective single-site study design and the small number of patients. Future studies including a sufficient number of cases are needed to clarify the use of UF-DCE MRI in the evaluation of treatment response in each subtype, especially TNBC and HER2+BC. Quantitative variables such as maximum slope or time to enhancement were not included. However, qualitative assessments involving the placement of a region of interest are often difficult on shrunken cancer lesions after NST.
In conclusion, UF-DCE MRI demonstrated higher AUC for the more accurate detection of residual cancer and the visualization of tumor extent compared with conventional DCE MRI. UF-DCE MRI may be a promising method for evaluating the post-NST status of breast cancer.

Author Contributions

Conceptualization, M.H. and M.K.; methodology, M.H. and M.K.; software, M.H.; formal analysis, M.H., M.K. and M.I.; investigation, M.H. and M.K.; resources, M.K., M.D.N., Y.Y., M.T. and Y.N.; data curation, M.H., M.K., M.I., R.O., A.O., A.O.K. and K.K.M.; writing—original draft preparation, M.H. and M.K.; writing—review and editing, M.H., M.K., M.I., R.O., A.O., A.O.K., K.K.M., Y.Y., M.T. and Y.N.; visualization, M.H., M.I. and M.K.; supervision, M.T. and Y.N.; project administration, M.K.; and funding acquisition, M.K. All authors have read and agreed to the published version of the manuscript.

Funding

This work was supported by a Grant-in-Aid for Scientific Research “Tumor vascularity and tumor-related vessels using ultrafast DCE MRI of the Breast” (Grant Number JP18K07673).

Institutional Review Board Statement

The study was conducted in accordance with the Declaration of Helsinki, and approved by the Institutional Review Board of Kyoto University hospital (protocol code R0610 approved on 19 August 2016).

Informed Consent Statement

Patient consent was waived due to the retrospective design.

Data Availability Statement

Not applicable.

Conflicts of Interest

M.D.N. is an employee of Siemens Healthcare. The funder had no role in the design of the study; in the collection, analyses, or interpretation of data; in the writing of the manuscript; or in the decision to publish the results. The remaining authors have no conflict of interest to declare.

References

  1. Asaoka, M.; Gandhi, S.; Ishikawa, T.; Takabe, K. Neoadjuvant Chemotherapy for Breast Cancer: Past, Present, and Future. Breast Cancer 2020, 14, 1178223420980377. [Google Scholar] [CrossRef] [PubMed]
  2. Cortazar, P.; Zhang, L.; Untch, M.; Mehta, K.; Costantino, J.P.; Wolmark, N.; Bonnefoi, H.; Cameron, D.; Gianni, L.; Valagussa, P.; et al. Pathological complete response and long-term clinical benefit in breast cancer: The CTNeoBC pooled analysis. Lancet 2014, 384, 164–172. [Google Scholar] [CrossRef] [Green Version]
  3. Van la Parra, R.F.D.; Kuerer, H.M. Selective elimination of breast cancer surgery in exceptional responders: Historical perspective and current trials. Breast Cancer Res. 2016, 18, 28. [Google Scholar] [CrossRef] [PubMed] [Green Version]
  4. Kuerer, H.M.; Vrancken Peeters, M.-J.T.F.D.; Rea, D.W.; Basik, M.; De Los Santos, J.; Heil, J. Nonoperative Management for Invasive Breast Cancer After Neoadjuvant Systemic Therapy: Conceptual Basis and Fundamental International Feasibility Clinical Trials. Ann. Surg. Oncol. 2017, 24, 2855–2862. [Google Scholar] [CrossRef]
  5. Mauriac, L.; MacGrogan, G.; Avril, A.; Durand, M.; Floquet, A.; Debled, M.; Dilhuydy, J.M.; Bonichon, F.; Institut Bergonié Bordeaux Groupe Sein (IBBGS). Neoadjuvant chemotherapy for operable breast carcinoma larger than 3 cm: A unicentre randomized trial with a 124-month median follow-up. Ann. Oncol. 1999, 10, 47–52. [Google Scholar] [CrossRef]
  6. Scheel, J.R.; Kim, E.; Partridge, S.C.; Lehman, C.D.; Rosen, M.A.; Bernreuter, W.K.; Pisano, E.D.; Marques, H.S.; Morris, E.A.; Weatherall, P.T.; et al. MRI, clinical examination, and mammography for preoperative assessment of residual disease and pathologic complete response after neoadjuvant chemotherapy for breast cancer: ACRIN 6657 trial. Am. J. Roentgenol. 2018, 210, 1376–1385. [Google Scholar] [CrossRef]
  7. Heil, J.; Kuerer, H.M.; Pfob, A.; Rauch, G.; Sinn, H.P.; Golatta, M.; Liefers, G.J.; Peeters, M.J.V. Eliminating the breast cancer surgery paradigm after neoadjuvant systemic therapy: Current evidence and future challenges. Ann. Oncol. 2020, 31, 61–71. [Google Scholar] [CrossRef] [Green Version]
  8. Santos, J.F.D.L.; Cantor, A.; Amos, K.D.; Forero, A.; Golshan, M.; Horton, J.K.; Hudis, C.A.; Hylton, N.M.; McGuire, K.; Meric-Bernstam, F.; et al. Magnetic resonance imaging as a predictor of pathologic response in patients treated with neoadjuvant systemic treatment for operable breast cancer. Translational Breast Cancer Research Consortium trial 017. Cancer 2013, 119, 1776–1783. [Google Scholar] [CrossRef] [Green Version]
  9. Sener, S.F.; Sargent, R.E.; Lee, C.; Manchandia, T.; Do, V.L.; Olimpiadi, Y.; Zaremba, N.; Alabd, A.; Nelson, M.; Lang, J.E. MRI does not predict pathologic complete response after neoadjuvant chemotherapy for breast cancer. J. Surg. Oncol. 2019, 120, 903–910. [Google Scholar] [CrossRef]
  10. Mann, R.M.; van Zelst, J.C.M.; Vreemann, S.; Mus, R.D.M. Is Ultrafast or Abbreviated Breast MRI Ready for Prime Time? Curr. Breast Cancer Rep. 2019, 11, 9–16. [Google Scholar] [CrossRef] [Green Version]
  11. Pineda, F.D.; Medved, M.; Wang, S.; Fan, X.; Schacht, D.V.; Sennett, C.; Oto, A.; Newstead, G.M.; Abe, H.; Karczmar, G.S. Ultrafast Bilateral DCE-MRI of the Breast with Conventional Fourier Sampling: Preliminary Evaluation of Semi-quantitative Analysis. Acad. Radiol. 2016, 23, 1137–1144. [Google Scholar] [CrossRef] [PubMed] [Green Version]
  12. Goto, M.; Sakai, K.; Yokota, H.; Kiba, M.; Yoshida, M.; Imai, H.; Weiland, E.; Yokota, I.; Yamada, K. Diagnostic performance of initial enhancement analysis using ultra-fast dynamic contrast-enhanced MRI for breast lesions. Eur. Radiol. 2019, 29, 1164–1174. [Google Scholar] [CrossRef] [PubMed]
  13. Yamaguchi, K.; Nakazono, T.; Egashira, R.; Fukui, S.; Baba, K.; Hamamoto, T.; Irie, H. Maximum slope of ultrafast dynamic contrast-enhanced MRI of the breast: Comparisons with prognostic factors of breast cancer. Jpn J. Radiol. 2021, 39, 246–253. [Google Scholar] [CrossRef] [PubMed]
  14. Onishi, N.; Sadinski, M.; Gibbs, P.; Gallagher, K.M.; Hughes, M.C.; Ko, E.S.; Dashevsky, B.Z.; Shanbhag, D.D.; Fung, M.M.; Hunt, T.M.; et al. Differentiation between subcentimeter carcinomas and benign lesions using kinetic parameters derived from ultrafast dynamic contrast-enhanced breast MRI. Eur. Radiol. 2020, 30, 756–766. [Google Scholar] [CrossRef] [PubMed]
  15. Kataoka, M.; Honda, M.; Ohashi, A.; Yamaguchi, K.; Mori, N.; Goto, M.; Fujioka, T.; Mori, M.; Kato, Y.; Satake, H.; et al. Ultrafast Dynamic Contrast-enhanced MRI of the Breast: How Is It Used? Magn. Reason. Med. Sci. 2022, 21, 83–94. [Google Scholar] [CrossRef] [PubMed]
  16. Kim, J.H.; Park, V.Y.; Shin, H.J.; Kim, M.J.; Yoon, J.H. Ultrafast dynamic contrast-enhanced breast MRI: Association with pathologic complete response in neoadjuvant treatment of breast cancer. Eur. Radiol. 2022, 1–11. [Google Scholar] [CrossRef]
  17. Kato, E.; Mori, N.; Mugikura, S.; Sato, S.; Ishida, T.; Takase, K. Value of ultrafast and standard dynamic contrast-enhanced magnetic resonance imaging in the evaluation of the presence and extension of residual disease after neoadjuvant chemotherapy in breast cancer. Jpn J. Radiol. 2021, 39, 791–801. [Google Scholar] [CrossRef]
  18. Fukuda, I. Pattern of Tumor shrinkage during neoadjuvant chemotherapy is associated with Prognosis in low-grade luminal early. Breast Cancer 2018, 286, 49–57. [Google Scholar] [CrossRef] [Green Version]
  19. Viera, A.J.; Garrett, J.M. Understanding interobserver agreement: The kappa statistic. Fam. Med. 2005, 37, 360–363. [Google Scholar]
  20. Goksuluk, D.; Korkmaz, S.; Zararsiz, G.A.; Karaagaoglu, E. easyROC: An Interactive Web-tool for ROC Curve Analysis Using R Language Environment. R J. 2016, 8, 213. [Google Scholar] [CrossRef] [Green Version]
  21. Koo, T.K.; Li, M.Y. A Guideline of Selecting and Reporting Intraclass Correlation Coefficients for Reliability Research. J. Chiropr. Med. 2016, 15, 155–163. [Google Scholar] [CrossRef] [PubMed] [Green Version]
  22. Santamaría, G.; Bargalló, X.; Fernández, P.L.; Farrús, B.; Caparrós, X.; Velasco, M. Neoadjuvant Systemic Therapy in Breast Cancer: Association of Contrast-enhanced MR Imaging Findings, Diffusion-weighted Imaging Findings, and Tumor Subtype with Tumor Response. Radiology 2017, 283, 663–672. [Google Scholar] [CrossRef] [PubMed]
  23. Jones, R.L.; Lakhani, S.R.; Ring, A.E.; Ashley, S.; Walsh, G.; Smith, I.E. Pathological complete response and residual DCIS following neoadjuvant chemotherapy for breast carcinoma. Br. J. Cancer 2006, 94, 358–362. [Google Scholar] [CrossRef] [PubMed] [Green Version]
  24. Goodwin, A.; Parker, S.; Ghersi, D.; Wilcken, N. Post-operative radiotherapy for ductal carcinoma in situ of the breast. Cochrane Database Syst. Rev. 2013, CD000563. [Google Scholar] [CrossRef] [Green Version]
  25. Kim, S.-Y.; Cho, N.; Park, I.-A.; Kwon, B.R.; Shin, S.U.; Lee, S.H.; Chang, J.M.; Moon, W.K. Dynamic contrast-enhanced breast MRI for evaluating residual tumor size after neoadjuvant chemotherapy. Radiology 2018, 289, 327–334. [Google Scholar] [CrossRef]
  26. Ms, B.C.M.; Abdelhafez, A.H.; Adrada, B.E.; Candelaria, R.P.; Mohamed, R.M.; Boge, M.; Le-Petross, H.; Arribas, E.; Lane, D.L.; Spak, D.A.; et al. Functional Tumor Volume by Fast Dynamic Contrast-Enhanced MRI for Predicting Neoadjuvant Systemic Therapy Response in Triple-Negative Breast Cancer. J. Magn. Reason. Imaging 2021, 54, 251–260. [Google Scholar] [CrossRef]
  27. Gonzalez, V.; Sandelin, K.; Karlsson, A.; Åberg, W.; Löfgren, L.; Iliescu, G.; Eriksson, S.; Arver, B. Preoperative MRI of the breast (POMB) influences primary treatment in breast cancer: A prospective, randomized, multicenter study. World J. Surg. 2014, 38, 1685–1693. [Google Scholar] [CrossRef]
  28. Marinovich, M.L.; Macaskill, P.; Irwig, L.; Sardanelli, F.; Mamounas, E.; Von Minckwitz, G.; Guarneri, V.; Partridge, S.C.; Wright, F.C.; Choi, J.H.; et al. Agreement between MRI and pathologic breast tumor size after neoadjuvant chemotherapy, and comparison with alternative tests: Individual patient data meta-analysis. BMC Cancer 2015, 15, 662. [Google Scholar] [CrossRef] [Green Version]
  29. McGuire, K.P.; Toro-Burguete, J.; Dang, H.; Young, J.; Soran, A.; Zuley, M.; Bhargava, R.; Bonaventura, M.; Johnson, R.; Ahrendt, G. MRI staging after neoadjuvant chemotherapy for breast cancer: Does tumor biology affect accuracy? Ann. Surg. Oncol. 2011, 18, 3149–3154. [Google Scholar] [CrossRef]
  30. Apte, A.; Marsh, S.; Chandrasekharan, S.; Chakravorty, A. Avoiding breast cancer surgery in a select cohort of complete responders to neoadjuvant chemotherapy: The long-term outcomes. Ann. Med. Surg. 2021, 66, 102380. [Google Scholar] [CrossRef]
  31. Figueiredo, M.I.; Cullen, J.; Hwang, Y.-T.; Rowland, J.H.; Mandelblatt, J.S. Breast cancer treatment in older women: Does getting what you want improve your long-term body image and mental health? J. Clin. Oncol. 2004, 22, 4002–4009. [Google Scholar] [CrossRef] [PubMed] [Green Version]
  32. Hylton, N.M. Residual Disease after Neoadjuvant Therapy for Breast Cancer: Can MRI Help? Radiology 2018, 289, 335–336. [Google Scholar] [CrossRef] [PubMed]
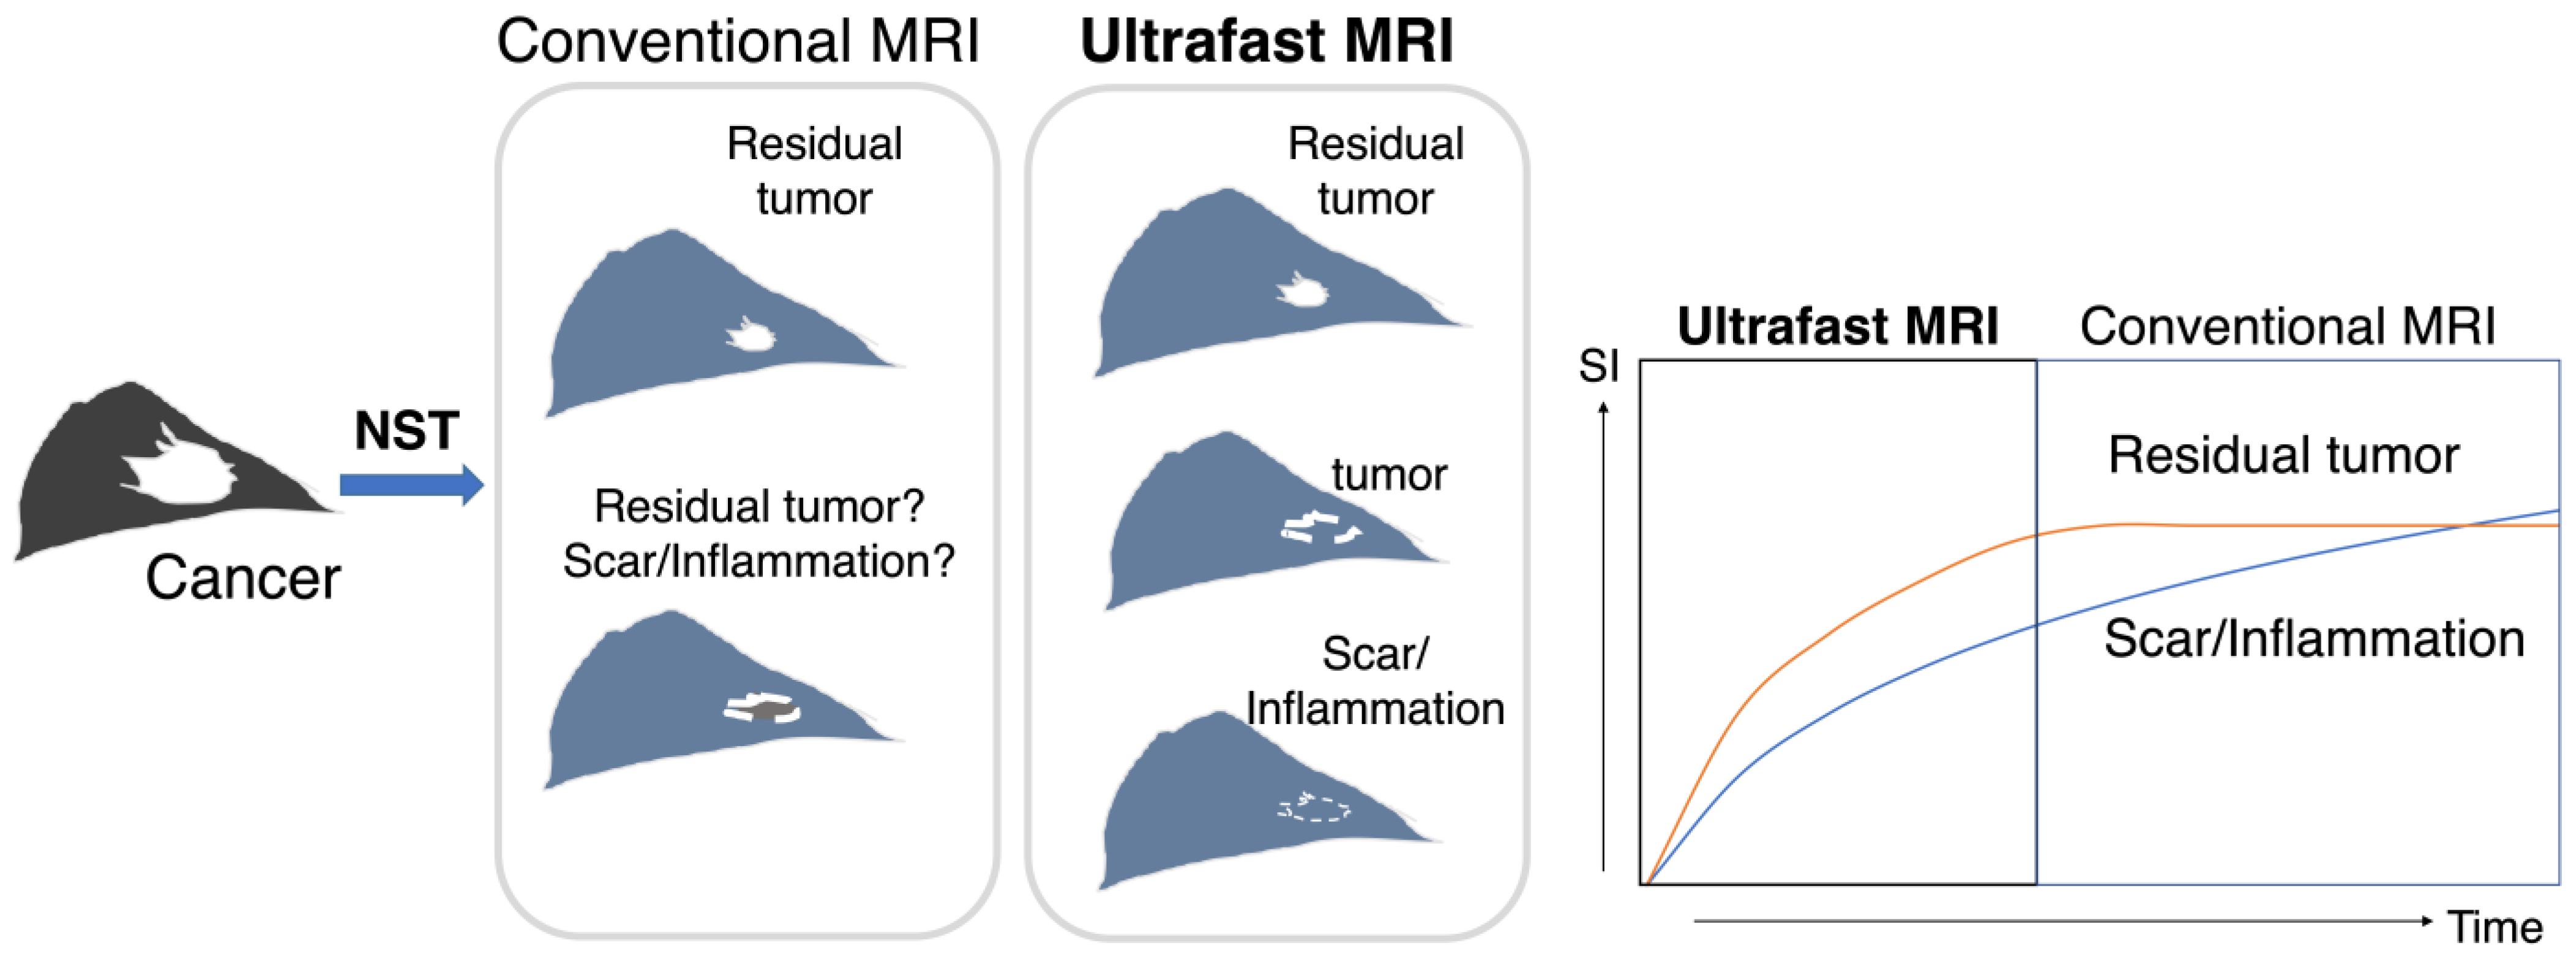
Figure 1. A schema of the study design/hypothesis. This schema shows the treatment course of NST, imaging evaluation, surgery, and the final comparison of post-NST image with surgical specimen. Both residual tumor and scarring/inflammation were enhanced on conventional DCE MRI, while UF-DCE MRI may differentiate the hypervascular viable residual tumor from slow-enhancing scarring/inflammation. NST: neoadjuvant systemic treatment; SI: signal intensity.
Tomography 08 00125 g001
Figure 2. The flow diagram of the case collection and selection procedure. UF-DCE MRI: ultrafast DCE MRI; NST: neoadjuvant systemic treatment.
Tomography 08 00125 g002
Figure 3. The timing of each acquisition.
Tomography 08 00125 g003
Figure 4. The ROC curves. UF: the 20th phase of ultrafast-DCE MRI; early: the early phase; HR: high spatial-resolution; and delayed: delayed phase.
Tomography 08 00125 g004
Figure 5. The size differences between the imaging and pathological findings. The values were calculated as the residual lesion size on each protocol minus the pathological lesion size. UF: the 20th phase of ultrafast-DCE MRI; early: the early phase; HR: the high spatial-resolution; delayed: the delayed phase; and HER2+: the estrogen receptor-negative and human epidermal growth factor receptor-2-positive. The dots on the boxplots are outliers.
Tomography 08 00125 g005
Figure 6. The absolute values of the size differences between the imaging and pathological findings. UF: the 20th phase of ultrafast-DCE MRI; early: the early phase; HR: high spatial-resolution; delayed: the delayed phase; and HER2+: estrogen receptor-negative and human epidermal growth factor receptor-2-positive. * represents a statistically significant difference. The dots on the boxplots are outliers.
Tomography 08 00125 g006
Figure 7. The images of a patient with triple-negative breast cancer after neoadjuvant chemotherapy. Pathological evaluation was CR. No enhancing area was detected on the ultrafast-DCE MR image (a), while enhancing foci were observed in the early phase (b), the delayed phase (c), and the high spatial-resolution (d) images (arrows).
Tomography 08 00125 g007
Figure 8. The images of a patient with luminal subtype breast cancer after neoadjuvant endocrine therapy in combination with CDK4/6 inhibitor. In the pathological findings, 12 mm of invasive cancer remained. In the MRI findings, the lesion was evaluated as being slightly smaller on the ultrafast DCE MR image (9.5 mm) (a) but larger in the early phase (21.5 mm) (b), the delayed phase (24 mm) (c), and the high spatial-resolution (24.5 mm) (d) images (arrows).
Tomography 08 00125 g008
Table 1. The MRI sequence parameters.
UFEarly, DelayedHR
OrientationAxialAxialCoronal
SequenceVIBE without FSVIBE with FSVIBE with FS
TR, ms4.803.844.61
TE, ms2.461.431.80
FOV, mm2360 × 360330 × 330330 × 330
Matrix384 × 269384 × 346512 × 461
Thickness, mm2.510.8
Slices60144176
Temporal resolution, s3.6560146
UF, ultrafast dynamic contrast-enhanced MRI; HR, high-resolution contrast-enhanced MRI; TR, repetition time; TE, echo time; FOV, field of view; FS, fat suppression; and VIBE, volumetric interpolated breath-hold examination.
Table 2. The patient characteristics.
VariablesnOverall, n = 55 1Non-pCR, n = 22 1pCR, n = 33 1p-Value 2
Age (years)5549.7 ± 11.748.6 ± 9.750.5 ± 12.90.8
Subtype55 0.007
Luminal 33 (60%)8 (36%)25 (76%)
HER2+ 5 (9.1%)4 (18%)1 (3.0%)
TN 17 (31%)10 (45%)7 (21%)
pre-NST size (mm)54 340.5 ± 23.728.9 ± 19.848.5 ± 23.0<0.001
Morphology54 3 0.5
mass 43 (80%)19 (86%)24 (75%)
NME 11 (20%)3 (14%)8 (25%)
Shrink pattern54 3 0.004
CR 5 (9.3%)5 (23%)0 (0%)
CS 24 (44%)12 (55%)12 (38%)
non-CS 17 (31%)4 (18%)13 (41%)
SD 8 (15%)1 (4.5%)7 (22%)
Data in columns 2 and 3 are the number of patients with the percentage in parentheses. 1 Mean ± SD or n (%). 2 Wilcoxon rank sum test or Fisher’s exact test. 3 One patient was excluded because pre-NST MRI was not available. pCR, pathological complete response; luminal, estrogen receptor (ER)-positive; HER2+, ER-negative and human epidermal growth factor receptor-2-positive; TN, triple-negative; NST, neoadjuvant systemic treatment; NME, non-mass enhancement; CR, complete response on MRI; CS, concentric shrinkage; and SD, stable disease on MRI.
Table 3. The diagnostic performances for the detected residual lesion across the two readers.
PopulationProtocolReaderAUCSensitivitySpecificityPPVNPV
AllUF10.86 (0.77–0.96)0.91 (0.76–0.98)0.82 (0.60–0.95)0.88 (0.71–0.98)0.86 (0.65–0.96)
20.88 (0.79–0.97)0.94 (0.80–0.99)0.82 (0.60–0.95)0.89 (0.72–0.99)0.90 (0.70–0.97)
Early10.80 (0.69–0.90)1.00 (0.89–NA)0.59 (0.36–0.79)0.79 (0.59–NA)1.00 (0.77–1.00)
20.68 (0.58–0.78)1.00 (0.89–NA)0.36 (0.17–0.59)0.70 (0.46–NA)1.00 (0.67–1.00)
Delayed10.70 (0.60–0.81)1.00 (0.89–NA)0.49 (0.21–0.64)0.72 (0.49–NA)1.00 (0.70–1.00)
20.68 (0.58–0.78)1.00 (0.89–NA)0.36 (0.17–0.59)0.70 (0.46–NA)1.00 (0.67–1.00)
HR10.70 (0.60–0.81)1.00 (0.89–NA)0.41 (0.21–0.64)0.72 (0.49–NA)1.00 (0.70–1.00)
20.68 (0.58–0.78)1.00 (0.89–NA)0.36 (0.17–0.59)0.70 (0.46–NA)1.00 (0.67–1.00)
LuminalUF10.86 (0.69–1.02)0.96 (0.80–1.00)0.75 (0.35–0.97)0.92 (0.68–1.00)0.86 (0.50–0.98)
20.88 (0.71–1.03)1.00 (0.86-NA)0.75 (0.35–0.97)0.93 (0.69–NA)1.00 (0.60–NA)
Early10.88 (0.71–1.04)1.00 (0.86-NA)0.75 (0.35–0.97)0.93 (0.61–NA)1.00 (0.60–1.00)
20.81 (0.63–0.99)1.00 (0.86-NA)0.63 (0.25–0.92)0.89 (0.62–NA)1.00 (0.56–1.00)
Delayed10.75 (0.56–0.94)1.00 (0.86-NA)0.50 (0.16–0.84)0.86 (0.54–NA)1.00 (0.50–1.00)
20.81 (0.63–0.99)1.00 (0.86-NA)0.63 (0.25–0.92)0.89 (0.62–NA)1.00 (0.56–1.00)
HR10.75 (0.56–0.94)1.00 (0.86–NA)0.50 (0.16–0.84)0.86 (0.54–NA)1.00 (0.50–1.00)
20.81 (0.63–0.99)1.00 (0.86-NA)0.63 (0.25–0.92)0.89 (0.62–NA)1.00 (0.56–1.00)
TNUF10.83 (0.64–1.02)0.86 (0.42–1.00)0.80 (0.44–0.98)0.75 (0.37–0.99)0.89 (0.49–0.99)
20.76 (0.53–0.98)0.71 (0.29–0.96)0.80 (0.44–0.98)0.71 (0.33–0.96)0.80 (0.40–0.98)
Early10.80 (0.64–0.96)1.00 (0.59–NA)0.60 (0.26–0.88)0.63 (0.29–NA)1.00 (0.55–1.00)
20.65 (0.50–0.80)1.00 (0.59–NA)0.30 (0.07–0.65)0.50 (0.14–NA)1.00 (0.38–1.00)
Delayed10.82 (0.54–0.86)1.00 (0.59–NA)0.40 (0.12–0.74)0.54 (0.20–NA)1.00 (0.45–1.00)
20.65 (0.50–0.80)1.00 (0.59–NA)0.30 (0.07–0.65)0.50 (0.14–NA)1.00 (0.38–1.00)
HR10.82 (0.54–0.86)1.00 (0.59–NA)0.40 (0.12–0.74)0.54 (0.20–NA)1.00 (0.45–1.00)
20.65 (0.50–0.80)1.00 (0.59–NA)0.30 (0.07–0.65)0.50 (0.14–NA)1.00 (0.38–1.00)
HER2+UF10.501.00 (0.03–NA)0.00 (NA–0.60)0.20 (NA)NA (0.00–1.00)
21.001.00 (0.03–NA)1.00 (0.40–NA)1.00 (0.14–NA)1.00 (0.09–NA)
Early10.631.00 (0.03–NA)0.25 (0.01–0.81)0.25 (0.01–NA)1.00 (0.03–1.00)
20.631.00 (0.03–NA)0.25 (0.01–0.81)0.25 (0.01–NA)1.00 (0.03–1.00)
Delayed10.631.00 (0.03–NA)0.25 (0.01–0.81)0.25 (0.01–NA)1.00 (0.03–1.00)
20.501.00 (0.03–NA)0.00 (NA–0.60)0.20 (NA)NA (0.00–1.00)
HR10.631.00 (0.03–NA)0.25 (0.01–0.81)0.25 (0.01–NA)1.00 (0.03–1.00)
20.501.00 (0.03–NA)0.00 (NA–0.60)0.20 (NA)NA (0.00–1.00)
The numbers in parentheses are the 95% confidence interval. Luminal, estrogen receptor (ER)-positive; HER2+, ER-negative and human epidermal growth factor receptor-2-positive; TN, triple-negative; UF, ultrafast dynamic contrast-enhanced MRI; HR, high-resolution contrast-enhanced MRI; AUC, the area under the ROC curve; PPV, the positive predictive value; NPV, the negative predictive value; and NA, not applicable.
Publisher’s Note: MDPI stays neutral with regard to jurisdictional claims in published maps and institutional affiliations.