Deep Learning-Based Diagnosis of Femoropopliteal Artery Steno-Occlusion Using Maximum Intensity Projection Images of CT Angiography
Abstract
1. Introduction
2. Materials and Methods
2.1. Subjects
2.2. Dataset Construction
2.3. Image Pre-Processing
2.4. Model Design
- I.
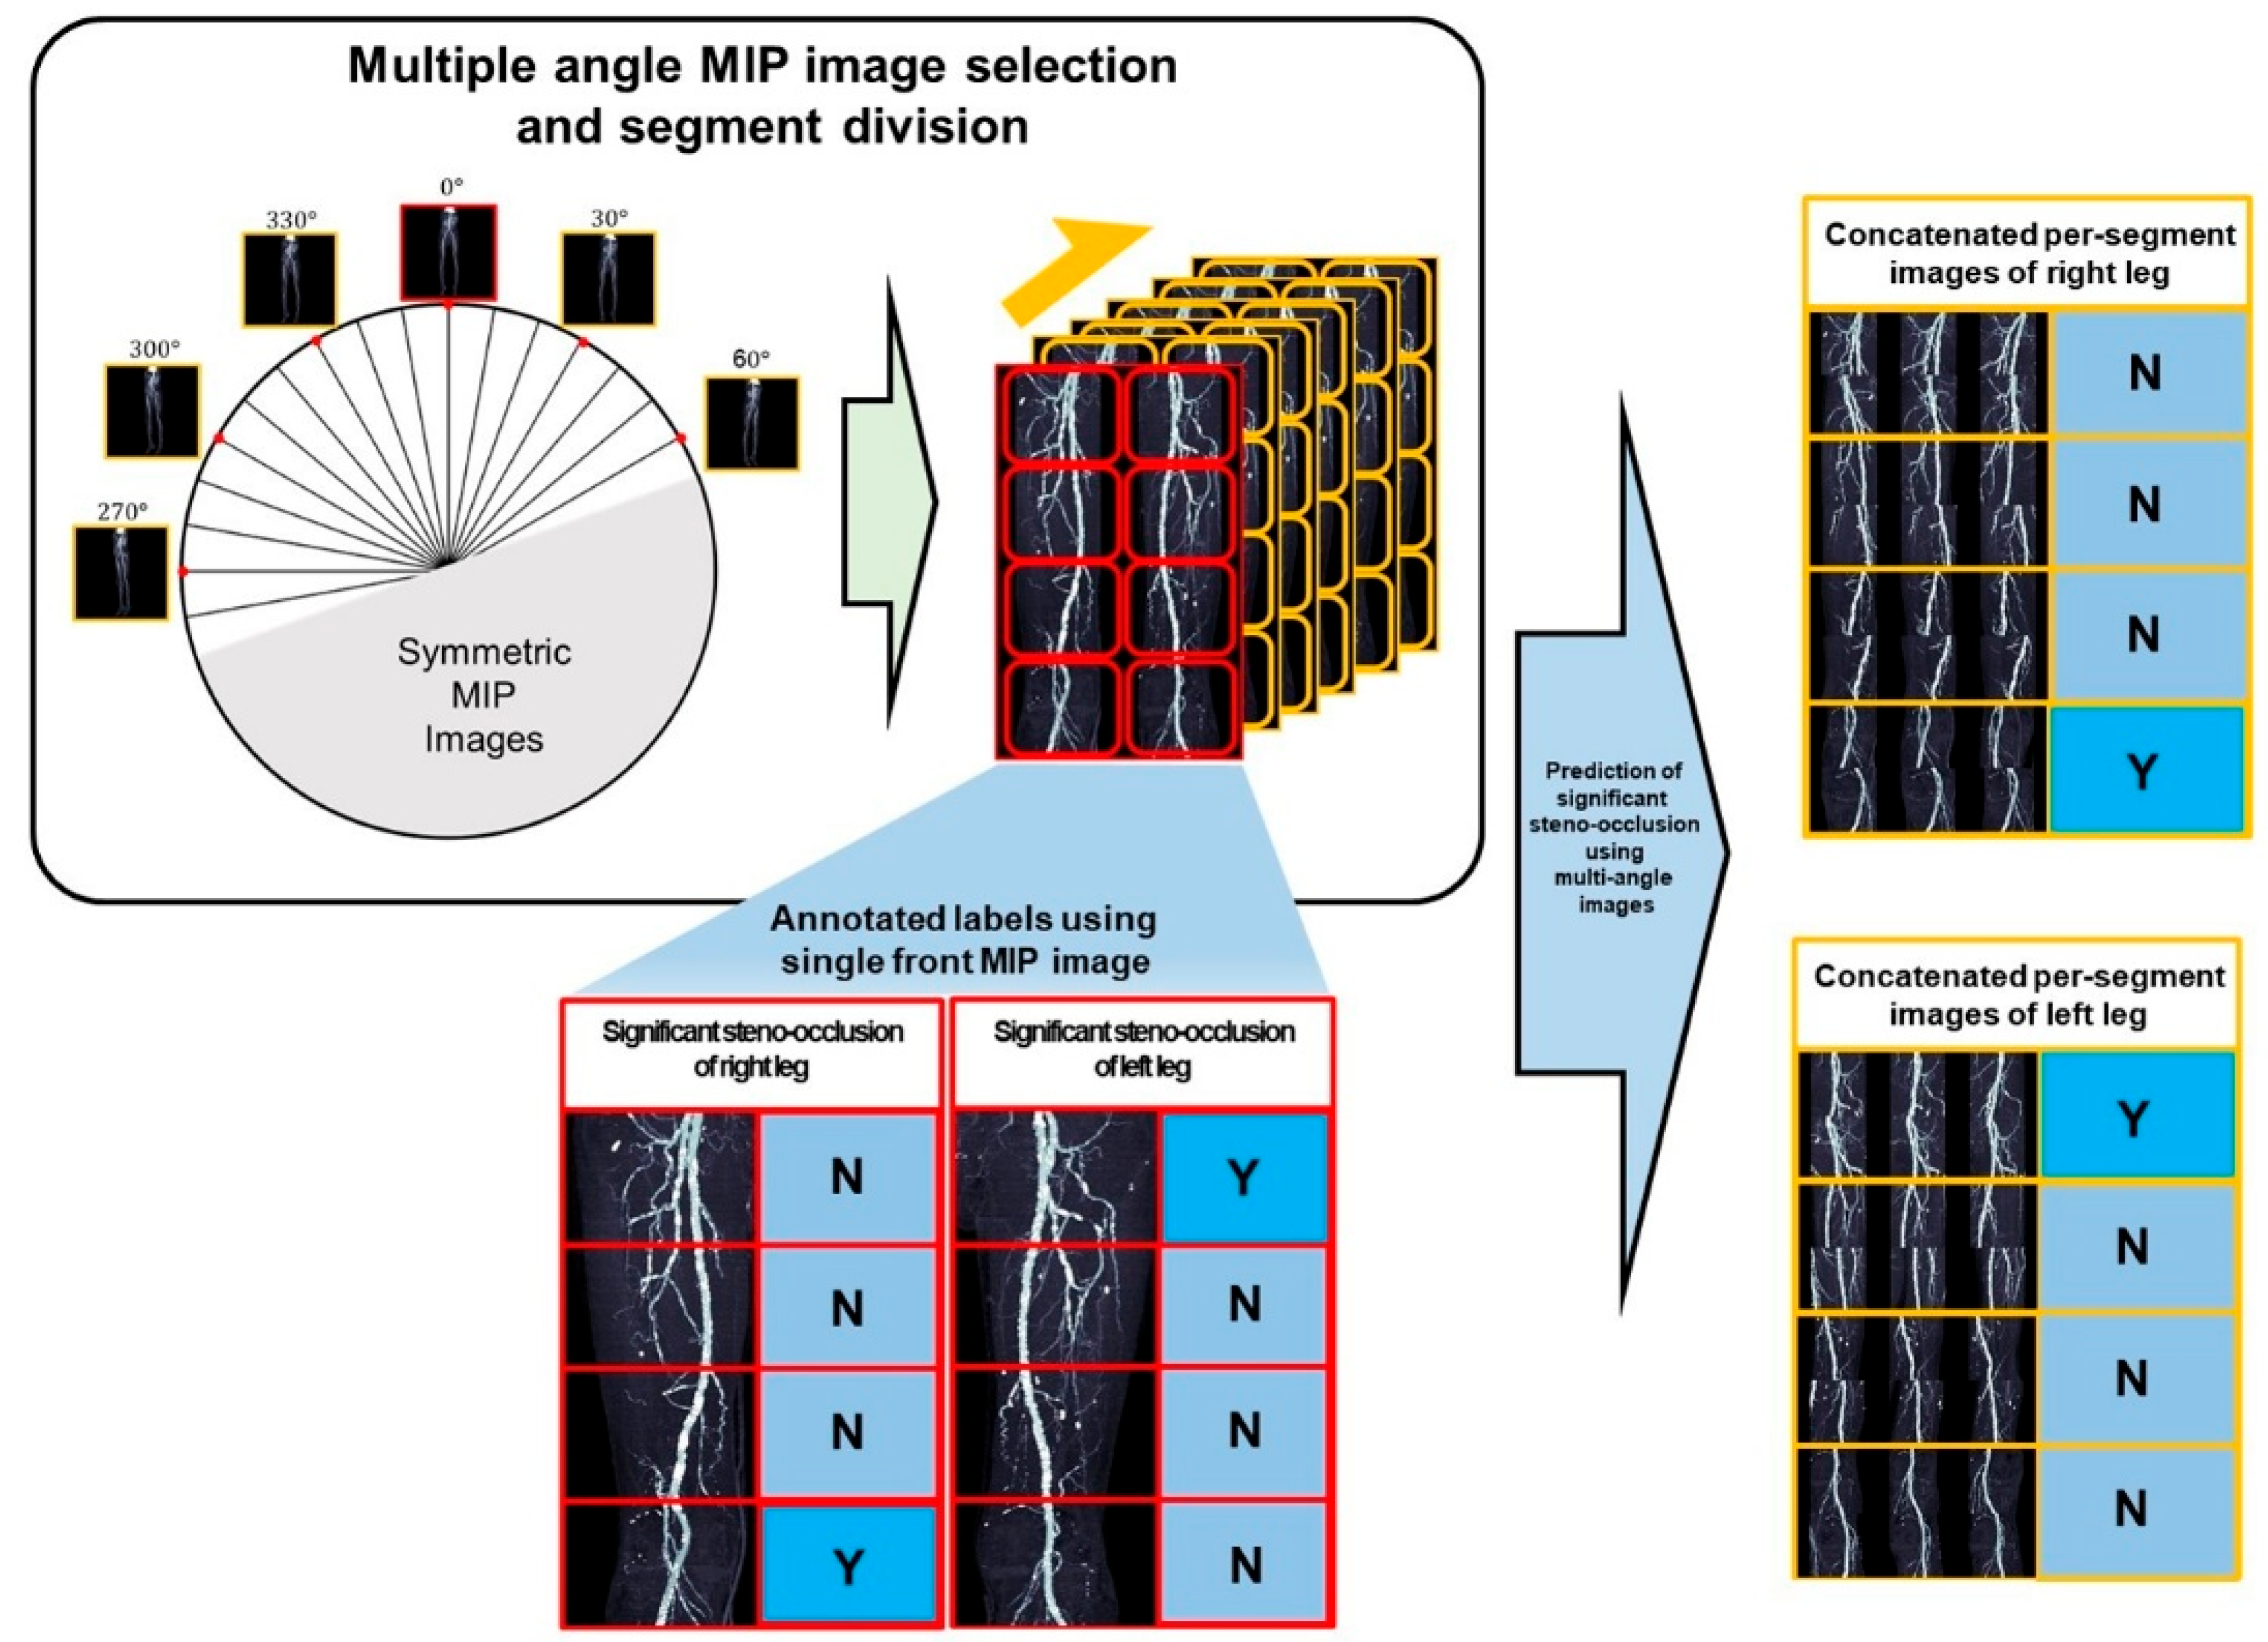
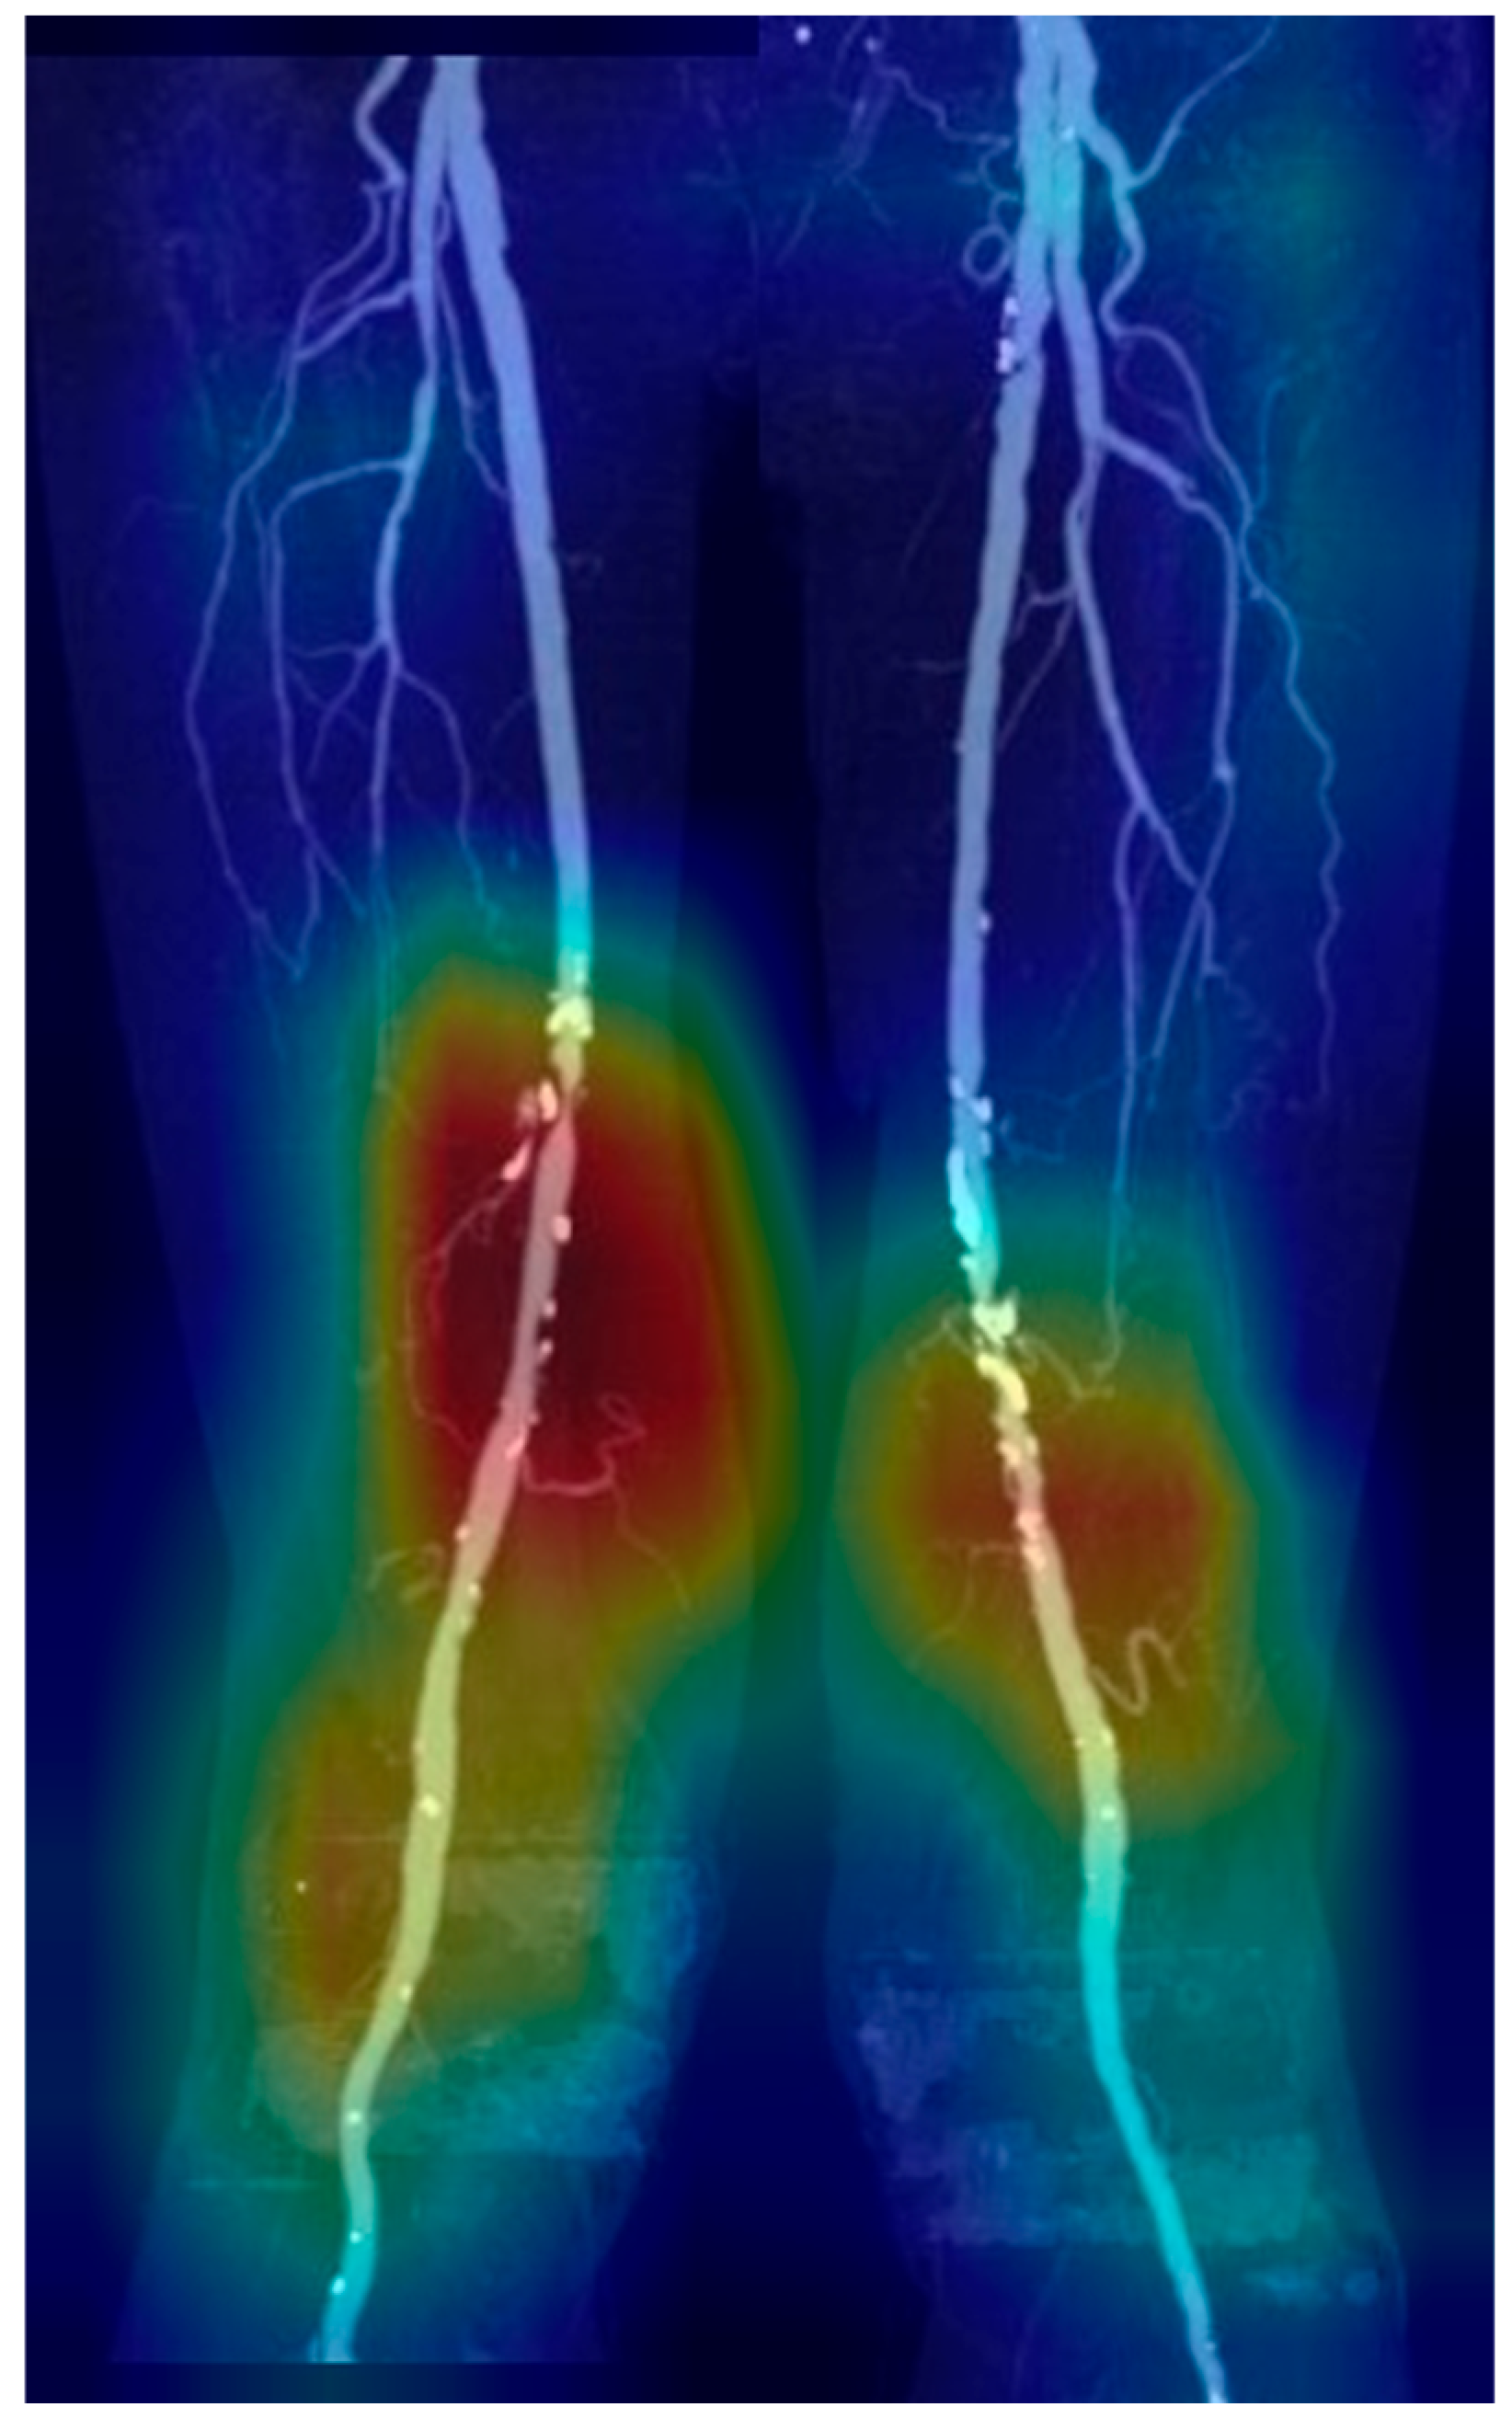
- Screening with a single AP projection MIP image:
- II.
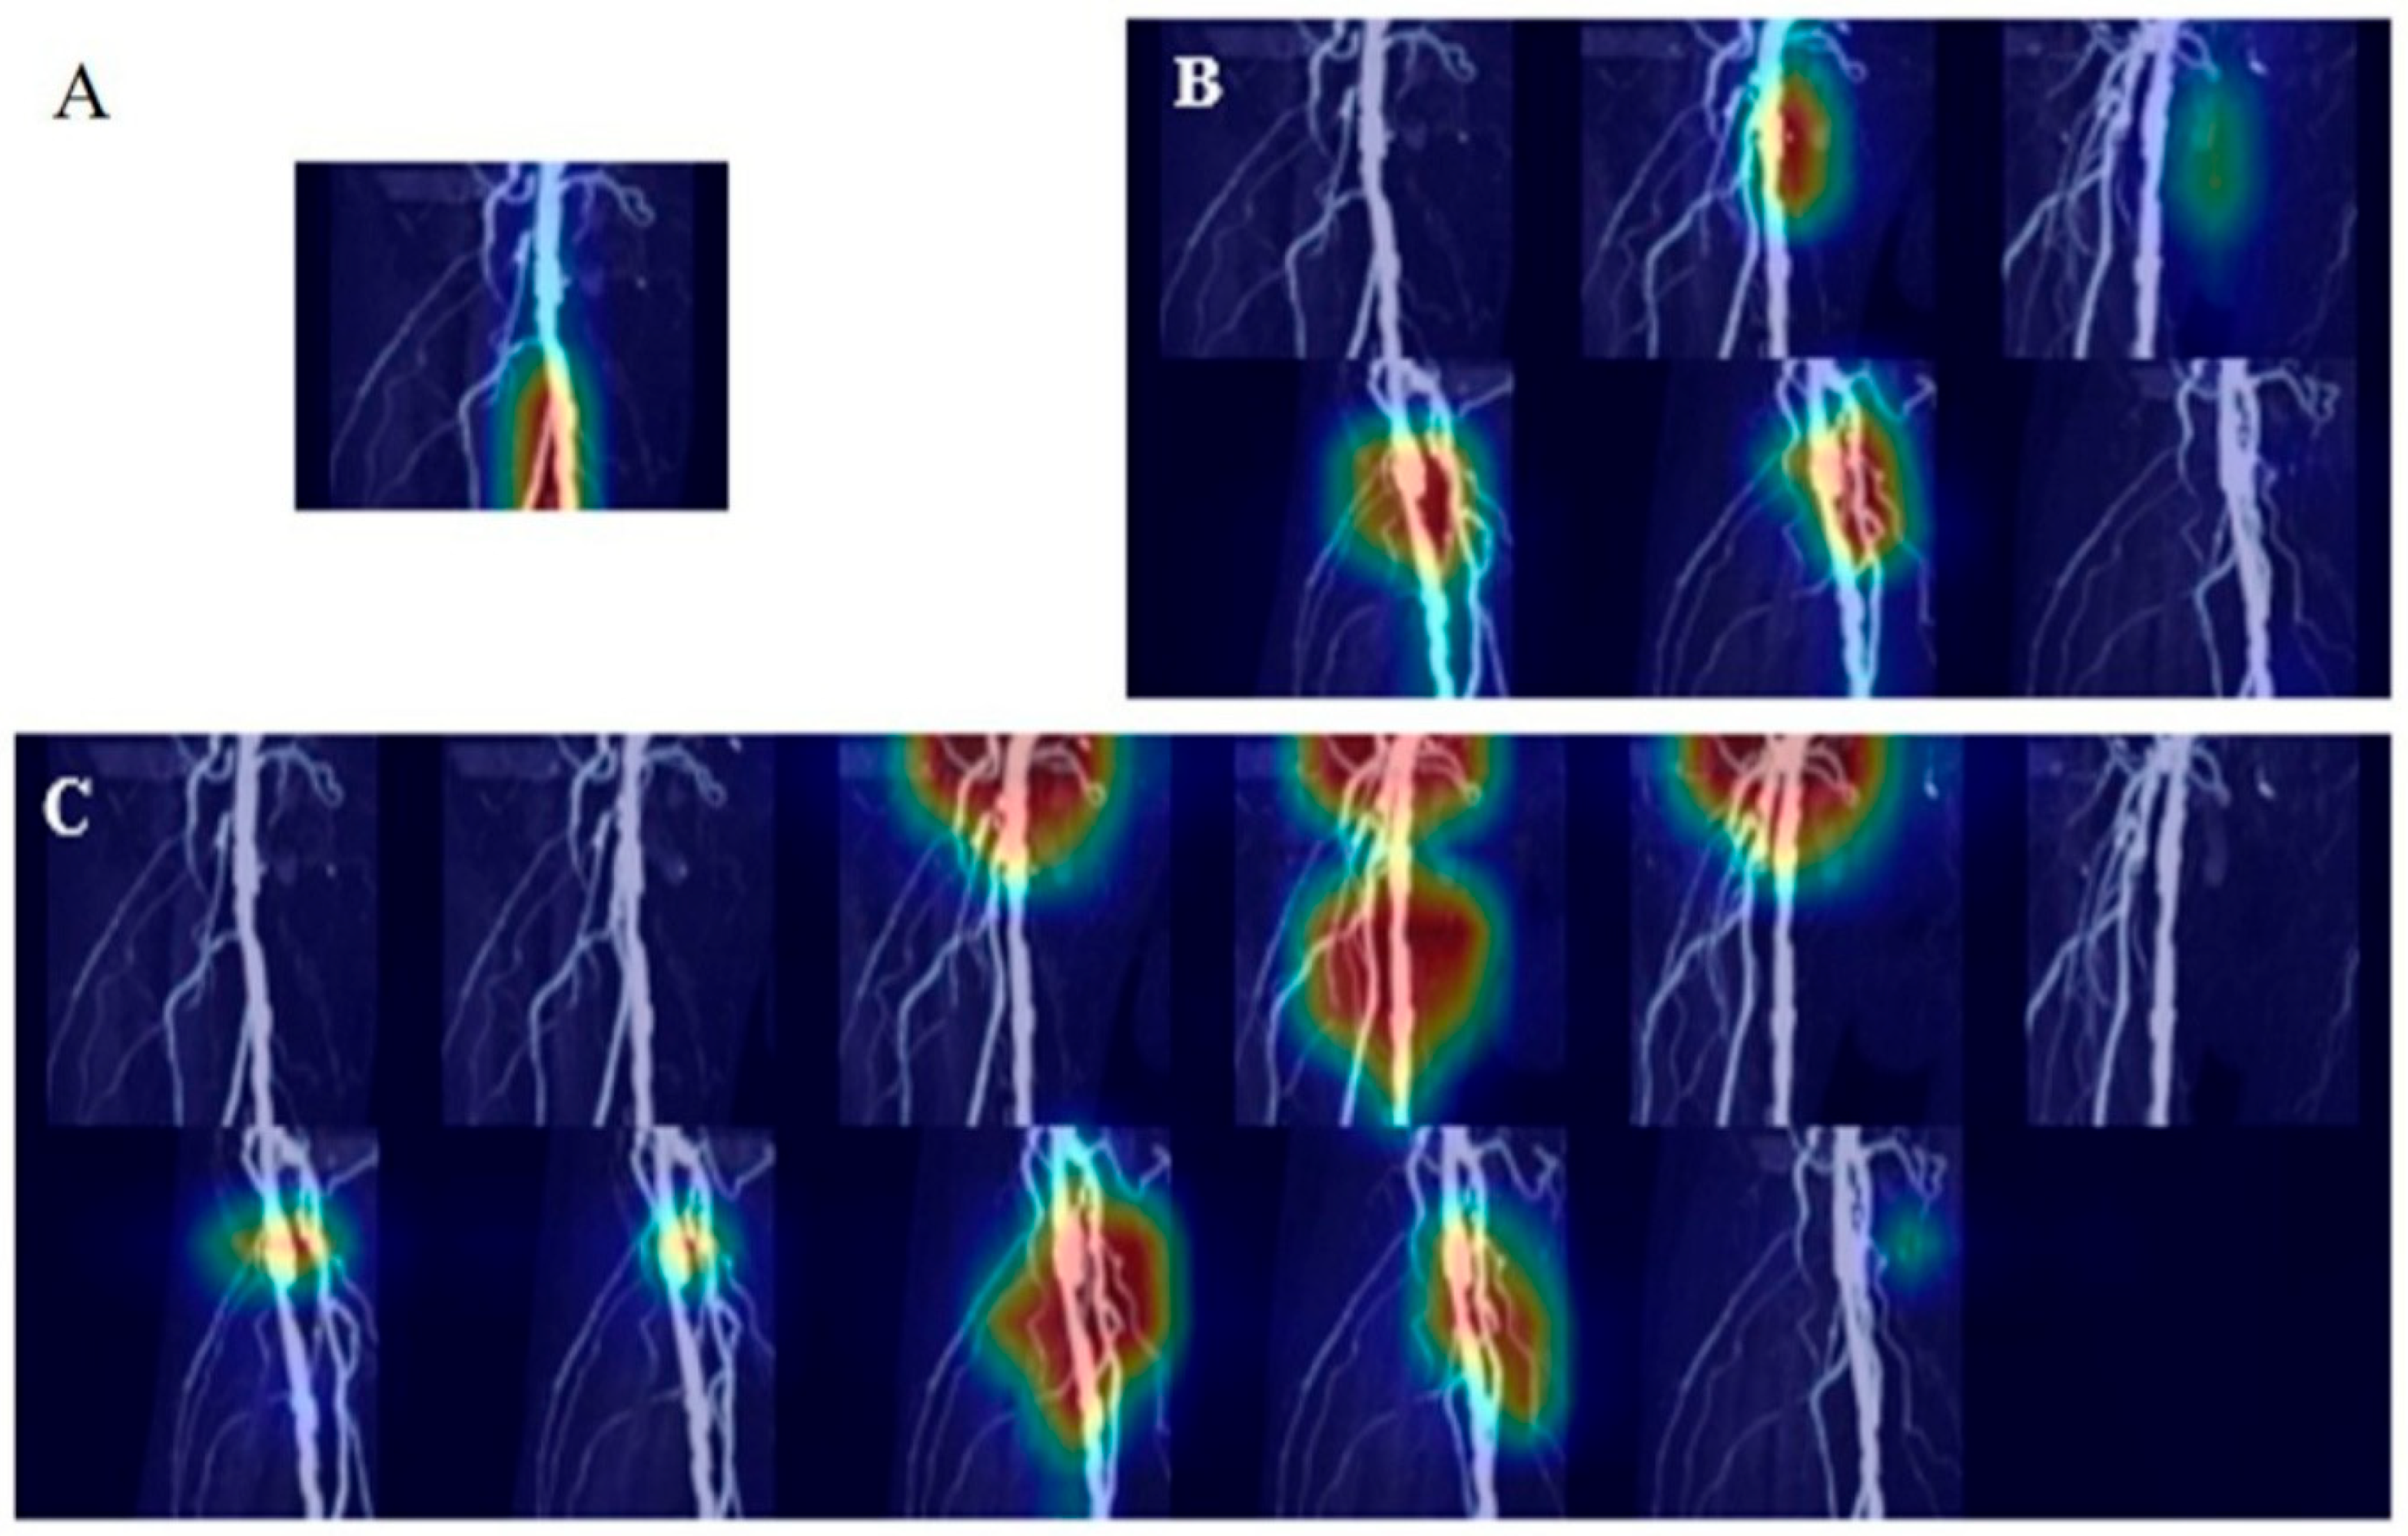
- Four-segment rotational comprehensive analysis—Per-segment analysis:
- III.
- Subgroup analyses by calcium group, age and sex:
2.5. Deep Learning
2.6. Statistical Analyses
3. Results
- I.
- Screening with a single AP projection MIP Image
- II.
- Four-segment rotational comprehensive analysis—Per-segment analysis
- III.
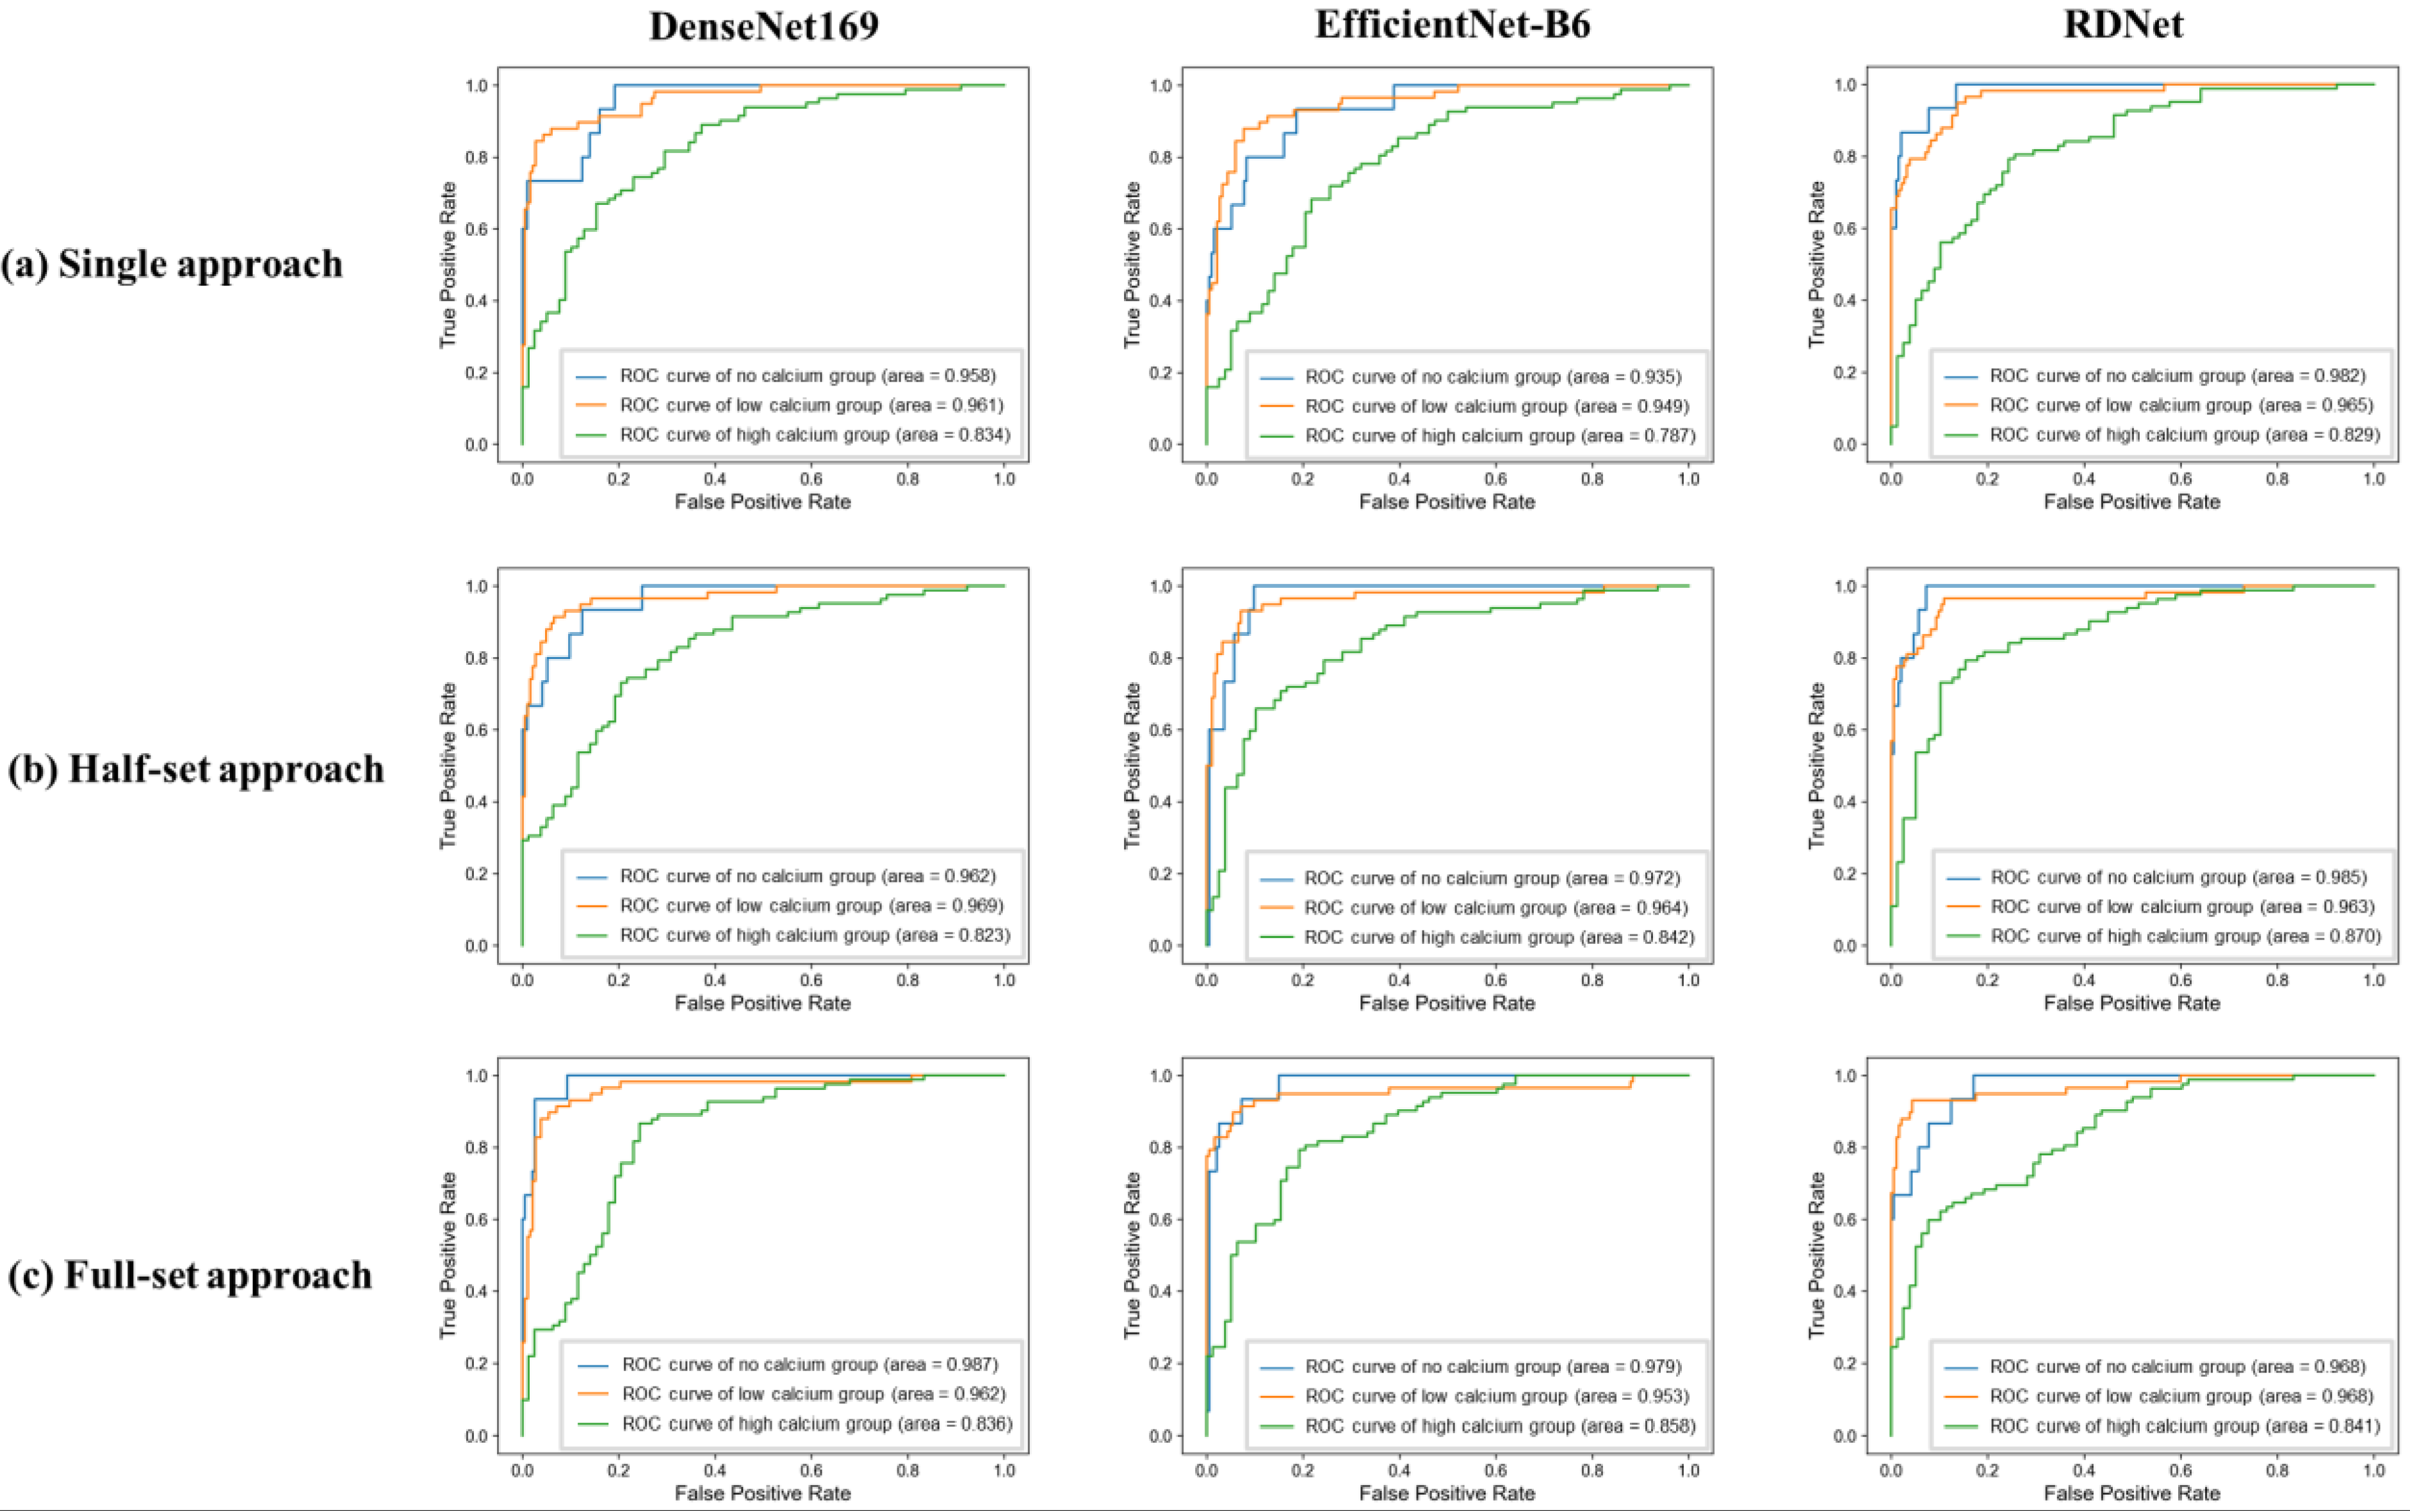
- Subgroup analyses by calcium group, age and sex
4. Discussion
Supplementary Materials
Author Contributions
Funding
Institutional Review Board Statement
Informed Consent Statement
Data Availability Statement
Conflicts of Interest
References
- Hirsch, A.T.; Haskal, Z.J.; Hertzer, N.R.; Bakal, C.W.; Creager, M.A.; Halperin, J.L.; Hiratzka, L.F.; Murphy, W.R.C.; Olin, J.W.; Puschett, J.B.; et al. ACC/AHA 2005 guidelines for the management of patients with peripheral arterial disease (lower extremity, renal, mesenteric, and abdominal aortic): Executive summary. A collaborative report from the American Association for Vascular Surgery/Society for Vascular Surgery, Society for Cardiovascular Angiography and Interventions, Society for Vascular Medicine and Biology, Society of Interventional Radiology, and the ACC/AHA Task Force on Practice Guidelines (Writing Committee to Develop Guidelines for the Management of Patients With Peripheral Arterial Disease). J. Am. Coll. Cardiol. 2006, 47, 1239–1312. [Google Scholar] [PubMed]
- Song, P.; Rudan, D.; Zhu, Y.; Fowkes, F.J.I.; Rahimi, K.; Fowkes, F.G.R.; Rudan, I. Incidence and prevalence of peripheral arterial disease in South Korea: Retrospective analysis of national claims data. JMIR Public Health Surveill. 2022, 8, e34908. [Google Scholar]
- Song, P.; Rudan, D.; Zhu, Y.; Fowkes, F.J.I.; Rahimi, K.; Fowkes, F.G.R.; Rudan, I. Global, regional, and national prevalence and risk factors for peripheral artery disease in 2015: An updated systematic review and analysis. Lancet Glob. Health 2019, 7, e1020–e1030. [Google Scholar] [CrossRef] [PubMed]
- Olinic, D.-M.; Stanek, A.; Tătaru, D.-A.; Homorodean, C.; Olinic, M. Acute limb ischemia: An update on diagnosis and management. J. Clin. Med. 2019, 8, 1215. [Google Scholar] [CrossRef] [PubMed]
- Mishra, A.; Jain, N.; Bhagwat, A. CT angiography of peripheral arterial disease by 256-slice scanner: Accuracy, advantages and disadvantages compared to digital subtraction angiography. Vasc. Endovasc. Surg. 2017, 51, 247–254. [Google Scholar] [CrossRef] [PubMed]
- Wallace, A.; Pershad, Y.; Saini, A.; Alzubaidi, S.; Naidu, S.; Knuttinen, G.; Oklu, R. Computed tomography angiography evaluation of acute limb ischemia. Vasa 2018, 48, 57–64. [Google Scholar] [CrossRef] [PubMed]
- Fleischmann, D.; Lammer, J. Peripheral CT angiography for interventional treatment planning. Eur. Radiol. Suppl. 2006, 16, M58–M64. [Google Scholar] [CrossRef] [PubMed]
- Chetlen, A.L.; Chan, T.L.; Ballard, D.H.; Frigini, L.A.; Hildebrand, A.; Kim, S.; Brian, J.M.; Krupinski, E.A.; Ganeshan, D. Addressing burnout in radiologists. Acad. Radiol. 2018, 26, 526–533. [Google Scholar] [CrossRef] [PubMed]
- Anwer, A.M.O.A.; Karacan, H.; Enver, L.; Cabuk, G. Machine learning applications for vascular stenosis detection in computed tomography angiography: A systematic review and meta-analysis. Neural Comput. Appl. 2024, 36, 17767–17786. [Google Scholar] [CrossRef]
- Dai, L.; Zhou, Q.; Zhou, H.; Zhang, H.; Cheng, P.; Ding, M.; Xu, X.; Zhang, X. Deep learning-based classification of lower extremity arterial stenosis in computed tomography angiography. Eur. J. Radiol. 2021, 136, 109528. [Google Scholar] [CrossRef] [PubMed]
- Nguyen, T.-T.; Folle, L.; Bayer, T. Detection of femoropopliteal arterial steno-occlusion at MR angiography: Initial experience with artificial intelligence. Eur. Radiol. Exp. 2024, 8, 30. [Google Scholar] [CrossRef]
- Vainio, T.; Mäkelä, T.; Arkko, A.; Savolainen, S.; Kangasniemi, M. Leveraging open dataset and transfer learning for accurate recognition of chronic pulmonary embolism from CT angiogram maximum intensity projection images. Eur. Radiol. Exp. 2023, 7, 33. [Google Scholar] [CrossRef] [PubMed]
- Salvi, A.; Shah, R.; Higgins, L.; Menon, P.G. Vision Transformers for AI-Driven Classification of Peripheral Artery Disease from Maximum Intensity Projections of Runoff CT Angiograms. In Proceedings of the 2022 IEEE International Conference on Bioinformatics and Biomedicine (BIBM), Las Vegas, NV, USA, 6–8 December 2022. [Google Scholar]
- Zhou, C.; Cao, S.; Li, M. Coordinate-aware three-dimensional neural network for lower extremity arterial stenosis classification in CT angiography. Heliyon 2024, 10, e34309. [Google Scholar] [CrossRef] [PubMed]
- Norgren, L.; Hiatt, W.R.; Dormandy, J.A.; Nehler, M.R.; Harris, K.A.; Fowkes, F.G.R.; Tasc II Working Group. Inter-Society Consensus for the Management of Peripheral Arterial Disease (TASC II). J. Vasc. Surg. 2007, 45, S5–S67. [Google Scholar] [CrossRef] [PubMed]
- Koo, B.-J.; Won, J.-H.; Choi, H.-C.; Na, J.-B.; Kim, J.-E.; Park, M.-J.; Jo, S.-H.; Park, H.-O.; Lee, C.-E.; Kim, M.-J.; et al. Automatic plaque removal using dual-energy computed tomography angiography: Diagnostic accuracy and utility in patients with peripheral artery disease. Medicina 2022, 58, 1435. [Google Scholar] [CrossRef] [PubMed]


| Dataset | Internal Dataset | Temporal Validation Dataset | p-Value | |
|---|---|---|---|---|
| Number of cases | 642 | 76 | ||
| Sex | 0.699 | |||
| - Male | 472 (73.5%) | 58 (76.3%) | ||
| - Female | 170 (26.5%) | 18 (23.7%) | ||
| Age | 0.418 | |||
| - Mean age ± Standard deviation | 68.2 ± 13.5 | 70.1 ± 13.3 | ||
| - Range | 16–98 | 20–96 | ||
| - Distribution | 0.840 | |||
| - ≤30 s | 20 (3.1%) | 2 (2.6%) | ||
| - 40 s | 40 (6.2%) | 2 (2.6%) | ||
| - 50 s | 82 (12.8%) | 9 (11.8%) | ||
| - 60 s | 180 (28.0%) | 19 (25.0%) | ||
| - 70 s | 185 (28.8%) | 25 (32.9%) | ||
| - 80 s | 119 (18.5%) | 17 (22.4%) | ||
| - 90 s | 16 (2.5%) | 2 (2.6%) | ||
| Conventional angiography (within 1 month) | 230 (35.82%) | 22 (28.6%) | 0.289 | |
| Significant steno-occlusion distribution by segment count | 0.752 | |||
| - No segment | (0/8) | 336 (52.3%) | 35 (46.1%) | |
| - At least one segment | (≥1/8) | 306 (47.7%) | 41 (53.9%) | |
| - One segment | (1/8) | 55 (8.6%) | 11 (14.5%) | |
| - Two segments | (2/8) | 57 (8.9%) | 5 (6.6%) | |
| - Three segments | (3/8) | 48 (7.5%) | 5 (6.6%) | |
| - Four segments | (4/8) | 35 (5.5%) | 4 (5.3%) | |
| - Five segments | (5/8) | 33 (5.1%) | 4 (5.3%) | |
| - Six segments | (6/8) | 33 (5.1%) | 4 (5.3%) | |
| - Seven segments | (7/8) | 24 (3.7%) | 5 (6.6%) | |
| - All eight segments | (8/8) | 21 (3.3%) | 3 (3.9%) | |
| Significant steno-occlusion distribution by location | 0.897 | |||
| - Rt. proximal SFA | 129 (20.1%) | 17 (22.4%) | ||
| - Rt. mid SFA | 156 (24.3%) | 24 (31.6%) | ||
| - Rt. distal SFA | 169 (26.3%) | 25 (32.9%) | ||
| - Rt. PopA | 124 (19.3%) | 15 (19.7%) | ||
| - Lt. proximal SFA | 140 (21.8%) | 16 (21.1%) | ||
| - Lt. mid SFA | 148 (23.1%) | 25 (31.6%) | ||
| - Lt. distal SFA | 163 (25.4%) | 18 (23.7%) | ||
| - Lt. PopA | 124 (19.3%) | 16 (21.1%) | ||
| Calcium degree | 0.304 | |||
| - No calcium | 264 (41.1%) | 26 (34.2%) | ||
| - Low calcium | 253 (39.4%) | 30 (39.5%) | ||
| - High calcium | 125 (19.5%) | 20 (26.3%) | ||
| Dataset | Deep Learning Model | Accuracy | Sensitivity | Specificity | PPV | NPV | F1-Score | AUC |
|---|---|---|---|---|---|---|---|---|
| Internal test set | DenseNet169 | 80.1% ± 3.8% | 0.850 ± 0.070 | 0.701 ± 0.083 | 0.856 ± 0.028 | 0.705 ± 0.097 | 0.851 ± 0.032 | 0.874 ± 0.024 |
| EfficientNet-B6 | 74.9% ± 8.0% | 0.754 ± 0.162 | 0.746 ± 0.152 | 0.865 ± 0.056 | 0.643 ± 0.161 | 0.793 ± 0.089 | 0.855 ± 0.048 | |
| RDNet | 82.6% ± 3.5% | 0.873 ± 0.072 | 0.732 ± 0.078 | 0.872 ± 0.029 | 0.750 ± 0.114 | 0.870 ± 0.029 | 0.886 ± 0.031 | |
| Temporal validation dataset | DenseNet169 | 77.6% | 0.900 | 0.639 | 0.735 | 0.852 | 0.809 | 0.881 |
| EfficientNet-B6 | 76.3% | 0.750 | 0.778 | 0.789 | 0.737 | 0.769 | 0.835 | |
| RDNet | 77.6% | 0.925 | 0.611 | 0.725 | 0.880 | 0.813 | 0.890 |
| Dataset | Approach | Deep Learning Model | Accuracy | Sensitivity | Specificity | PPV | NPV | F1-Score |
|---|---|---|---|---|---|---|---|---|
| Internal test set | Single | DenseNet169 | 87.8% ± 0.3% | 0.898 ± 0.054 | 0.872 ± 0.018 | 0.687 ± 0.054 | 0.965 ± 0.021 | 0.777 ± 0.031 |
| EfficientNet-B6 | 85.5% ± 2.4% | 0.879 ± 0.039 | 0.849 ± 0.043 | 0.648 ± 0.090 | 0.956 ± 0.017 | 0.742 ± 0.046 | ||
| RDNet | 87.9% ± 2.1% | 0.951 ± 0.052 | 0.857 ± 0.041 | 0.679 ± 0.071 | 0.981 ± 0.020 | 0.789 ± 0.028 | ||
| Half | DenseNet169 | 88.1% ± 2.8% | 0.950 ± 0.028 | 0.864 ± 0.041 | 0.641 ± 0.089 | 0.986 ± 0.008 | 0.763 ± 0.058 | |
| EfficientNet-B6 | 90.2% ± 2.4% | 0.920 ± 0.031 | 0.897 ± 0.035 | 0.696 ± 0.077 | 0.979 ± 0.004 | 0.791 ± 0.051 | ||
| RDNet | 89.3% ± 3.7% | 0.952 ± 0.022 | 0.879 ± 0.048 | 0.669 ± 0.138 | 0.986 ± 0.008 | 0.780 ± 0.089 | ||
| Full | DenseNet169 | 87.9% ± 2.4% | 0.948 ± 0.027 | 0.861 ± 0.035 | 0.636 ± 0.074 | 0.986 ± 0.005 | 0.760 ± 0.053 | |
| EfficientNet-B6 | 90.0% ± 1.1% | 0.923 ± 0.035 | 0.894 ± 0.015 | 0.686 ± 0.069 | 0.979 ± 0.006 | 0.786 ± 0.052 | ||
| RDNet | 89.6% ± 1.5% | 0.936 ± 0.025 | 0.887 ± 0.022 | 0.676 ± 0.087 | 0.982 ± 0.010 | 0.783 ± 0.054 | ||
| Temporal validation dataset | Single | DenseNet169 | 84.7% | 0.890 | 0.832 | 0.645 | 0.957 | 0.748 |
| EfficientNet-B6 | 87.3% | 0.858 | 0.879 | 0.707 | 0.948 | 0.776 | ||
| RDNet | 86.8% | 0.897 | 0.859 | 0.685 | 0.960 | 0.777 | ||
| Half | DenseNet169 | 89.3% | 0.865 | 0.903 | 0.753 | 0.951 | 0.805 | |
| EfficientNet-B6 | 89.1% | 0.832 | 0.912 | 0.763 | 0.941 | 0.796 | ||
| RDNet | 89.0% | 0.845 | 0.905 | 0.753 | 0.945 | 0.796 | ||
| Full | DenseNet169 | 88.7% | 0.897 | 0.883 | 0.724 | 0.962 | 0.801 | |
| EfficientNet-B6 | 89.5% | 0.897 | 0.894 | 0.743 | 0.962 | 0.813 | ||
| RDNet | 89.0% | 0.877 | 0.894 | 0.739 | 0.955 | 0.802 |
| Dataset | Deep Learning Model | Approach | p-Value | |||||
|---|---|---|---|---|---|---|---|---|
| Single | Half | Full | All * | Single-Half † | Single-Full † | Half-Full † | ||
| Internal test set | DenseNet169 | 0.946 ± 0.013 | 0.961 ± 0.007 | 0.957 ± 0.009 | 0.002 | 0.005 | 0.049 | 0.25 |
| EfficientNet-B6 | 0.930 ± 0.009 | 0.959 ± 0.011 | 0.957 ± 0.014 | <0.001 | <0.001 | <0.001 | 0.72 | |
| RDNet | 0.957 ± 0.015 | 0.964 ± 0.013 | 0.964 ± 0.009 | 0.30 | 0.25 | 0.25 | 1.00 | |
| Temporal validation dataset | DenseNet169 | 0.939 | 0.949 | 0.957 | - | - | - | - |
| EfficientNet-B6 | 0.925 | 0.940 | 0.949 | - | - | - | - | |
| RDNet | 0.940 | 0.959 | 0.954 | - | - | - | - | |
| Dataset | Approach | Deep Learning Model | Threshold | |||
|---|---|---|---|---|---|---|
| Five | Six | Seven | Eight | |||
| Internal test set | Single | DenseNet169 | 95.4% ± 0.0% | 89.2% ± 1.2% | 74.8% ± 2.8% | 54.1% ± 2.4% |
| EfficientNet-B6 | 92.8% ± 0.8% | 86.6% ± 2.0% | 71.1% ± 2.5% | 50.5% ± 1.0% | ||
| RDNet | 94.8% ± 2.0% | 90.2% ± 2.0% | 76.3% ± 0.7% | 53.6% ± 0.3% | ||
| Half | DenseNet169 | 95.9% ± 0.7% | 90.7% ± 1.3% | 76.3% ± 4.0% | 61.3% ± 6.0% | |
| EfficientNet-B6 | 93.8% ± 2.2% | 88.7% ± 3.1% | 75.8% ± 7.2% | 64.4% ± 7.6% | ||
| RDNet | 93.9% ± 2.4% | 88.7% ± 1.8% | 72.8% ± 5.5% | 63.0% ± 3.9% | ||
| Full | DenseNet169 | 92.3% ± 1.3% | 85.5% ± 3.5% | 72.6% ± 3.4% | 57.2% ± 4.0% | |
| EfficientNet-B6 | 93.3% ± 0.7% | 90.2% ± 1.6% | 77.8% ± 2.9% | 63.4% ± 3.1% | ||
| RDNet | 96.4% ± 0.7% | 91.2% ± 0.6% | 79.9% ± 2.3% | 60.9% ± 1.9% | ||
| Temporal validation dataset | Single | DenseNet169 | 93.00% | 88.20% | 75.00% | 53.10% |
| EfficientNet-B6 | 92.10% | 84.60% | 73.20% | 50.40% | ||
| RDNet | 93.90% | 82.90% | 69.30% | 53.50% | ||
| Half | DenseNet169 | 94.70% | 90.80% | 76.30% | 56.10% | |
| EfficientNet-B6 | 93.40% | 86.40% | 71.90% | 53.90% | ||
| RDNet | 93.40% | 86.40% | 71.90% | 53.90% | ||
| Full | DenseNet169 | 93.90% | 88.20% | 75.00% | 57.90% | |
| EfficientNet-B6 | 95.60% | 86.00% | 73.20% | 56.10% | ||
| RDNet | 95.60% | 89.50% | 75.40% | 59.60% | ||
| Approach | No Calcium | Low Calcium | High Calcium | p-Value * | ||||||
|---|---|---|---|---|---|---|---|---|---|---|
| DenseNet169 | EfficientNet-B6 | RDNet | DenseNet169 | EfficientNet-B6 | RDNet | DenseNet169 | EfficientNet-B6 | RDNet | ||
| Single | 0.958 | 0.935 | 0.982 | 0.961 | 0.949 | 0.965 | 0.834 | 0.787 | 0.829 | <0.001 |
| Half | 0.962 | 0.972 | 0.985 | 0.969 | 0.964 | 0.963 | 0.823 | 0.842 | 0.870 | <0.001 |
| Full | 0.987 | 0.979 | 0.968 | 0.962 | 0.953 | 0.968 | 0.836 | 0.858 | 0.841 | <0.001 |
Disclaimer/Publisher’s Note: The statements, opinions and data contained in all publications are solely those of the individual author(s) and contributor(s) and not of MDPI and/or the editor(s). MDPI and/or the editor(s) disclaim responsibility for any injury to people or property resulting from any ideas, methods, instructions or products referred to in the content. |
© 2025 by the authors. Licensee MDPI, Basel, Switzerland. This article is an open access article distributed under the terms and conditions of the Creative Commons Attribution (CC BY) license (https://creativecommons.org/licenses/by/4.0/).
Share and Cite
Hong, W.; Kang, J.; Kim, S.E.; Jeong, T.; Yoon, C.J.; Lee, I.J.; Kwon, L.M.; Cho, B.-J. Deep Learning-Based Diagnosis of Femoropopliteal Artery Steno-Occlusion Using Maximum Intensity Projection Images of CT Angiography. Tomography 2025, 11, 104. https://doi.org/10.3390/tomography11090104
Hong W, Kang J, Kim SE, Jeong T, Yoon CJ, Lee IJ, Kwon LM, Cho B-J. Deep Learning-Based Diagnosis of Femoropopliteal Artery Steno-Occlusion Using Maximum Intensity Projection Images of CT Angiography. Tomography. 2025; 11(9):104. https://doi.org/10.3390/tomography11090104
Chicago/Turabian StyleHong, Wonju, Jaewoong Kang, So Eui Kim, Taikyeong Jeong, Chang Jin Yoon, In Jae Lee, Lyo Min Kwon, and Bum-Joo Cho. 2025. "Deep Learning-Based Diagnosis of Femoropopliteal Artery Steno-Occlusion Using Maximum Intensity Projection Images of CT Angiography" Tomography 11, no. 9: 104. https://doi.org/10.3390/tomography11090104
APA StyleHong, W., Kang, J., Kim, S. E., Jeong, T., Yoon, C. J., Lee, I. J., Kwon, L. M., & Cho, B.-J. (2025). Deep Learning-Based Diagnosis of Femoropopliteal Artery Steno-Occlusion Using Maximum Intensity Projection Images of CT Angiography. Tomography, 11(9), 104. https://doi.org/10.3390/tomography11090104


