Abstract
Background: The discovery of novel antibody–drug conjugates for low-expression human epidermal growth factor receptor 2 (HER2-low) breast cancer highlights the inadequacy of the conventional binary classification of HER2 status as either negative or positive. Identification of HER2-low breast cancer is crucial for selecting patients who may benefit from targeted therapies. This study aims to determine whether qualitative and quantitative magnetic resonance imaging (MRI) features can effectively reflect low-HER2-expression breast cancer. Methods: Pre-treatment breast MRI images from 232 patients with pathologically confirmed breast cancer were retrospectively analyzed. Both clinicopathologic and MRI features were recorded. Qualitative MRI features included Breast Imaging Reporting and Data System (BI-RADS) descriptors from dynamic contrast-enhanced MRI (DCE-MRI), as well as intratumoral T2 hyperintensity and peritumoral edema observed in T2-weighted imaging (T2WI). Quantitative features were derived from diffusion kurtosis imaging (DKI) using multiple b-values and included statistics such as mean, median, 5th and 95th percentiles, skewness, kurtosis, and entropy from apparent diffusion coefficient (ADC), Dapp, and Kapp histograms. Differences in clinicopathologic, qualitative, and quantitative MRI features were compared across groups, with multivariable logistic regression used to identify significant independent predictors of HER2-low breast cancer. The discriminative power of MRI features was assessed using receiver operating characteristic (ROC) curves. Results: HER2 status was categorized as HER2-zero (n = 60), HER2-low (n = 91), and HER2-overexpressed (n = 81). Clinically, estrogen receptor (ER), progesterone receptor (PR), hormone receptor (HR), and Ki-67 levels significantly differed between the HER2-low group and others (all p < 0.001). In MRI analyses, intratumoral T2 hyperintensity was more prevalent in HER2-low cases (p = 0.009, p = 0.008). Mass lesions were more common in the HER2-zero group than in the HER2-low group (p = 0.038), and mass shape (p < 0.001) and margin (p < 0.001) significantly varied between the HER2 groups, with mass shape emerging as an independent predictive factor (HER2-low vs. HER2-zero: p = 0.010, HER2-low vs. HER2-over: p = 0.012). Qualitative MRI features demonstrated an area under the curve (AUC) of 0.763 (95% confidence interval [CI]: 0.667–0.859) for distinguishing HER2-low from HER2-zero status. Quantitative features showed distinct differences between HER2-low and HER2-overexpression groups, particularly in non-mass enhancement (NME) lesions. Combined variables achieved the highest predictive accuracy for HER2-low status, with an AUC of 0.802 (95% CI: 0.701–0.903). Conclusions: Qualitative and quantitative MRI features offer valuable insights into low-HER2-expression breast cancer. While qualitative features are more effective for mass lesions, quantitative features are more suitable for NME lesions. These findings provide a more accessible and cost-effective approach to noninvasively identifying patients who may benefit from targeted therapy.
1. Introduction
Breast cancer is one of the most common malignancies affecting women worldwide [1]. A key therapeutic target and prognostic marker in breast cancer is the human epidermal growth factor receptor 2 (HER2) [2,3]. Traditionally, HER2 status is classified as either positive or negative based on immunohistochemistry (IHC) and fluorescence in situ hybridization (FISH) testing. HER2-positive patients benefit from targeted therapies [3], while HER2-negative patients lack such options [4,5]. However, the development of novel antibody–drug conjugates has introduced a new treatment pathway for HER2-low breast cancers, a subset of HER2-negative patients constituting around 50% of the breast cancer population, which improves the overall survival of HER2-low patients [6]. Furthermore, low HER2 expression has distinct biological behaviors and clinical outcomes compared with zero HER2 expression, highlighting the limitations of the conventional binary classification [7,8]. This underscores the need to redefine HER2 status into three categories: HER2-zero, HER2-low, and HER2-overexpression.
Magnetic resonance imaging (MRI) has proven valuable for its noninvasive, high-resolution capabilities in differentiating HER2-positive from HER2-negative breast cancer [9,10,11]. For example, ELIAS et al. demonstrated a correlation between HER2-positive breast cancer and rapid kinetics on dynamic contrast-enhanced MRI (DCE-MRI) [12]. Similarly, Li et al. developed a machine learning model based on DCE-MRI to predict HER2-positive status, achieving an area under the receiver operator characteristic (ROC) curve (AUC) of 0.713 [13]. However, the rising need to identify HER2-low status poses a new diagnostic challenge for MRI.
Few studies have focused on the imaging characteristics of HER2-low breast cancers, and most rely on advanced techniques like radiomics and deep learning [14,15,16]. For example, Bian et al. developed a multiparametric MRI radiomics model that differentiated HER2-low from HER2-negative breast cancers [14], while Guo et al. used deep learning to predict HER2 status and patient prognosis [15]. Despite their promise, these models are complex and have limited clinical applications due to their interpretative challenges. A simpler, more practical imaging method is needed to accurately reflect HER2 expression levels.
Our previous studies and other studies have found value in both qualitative and quantitative MRI analyses for the differential diagnosis of breast cancer [17,18,19]. Qualitative analysis provides anatomical insights into tumors and surrounding tissue morphology, while quantitative histogram features, particularly from diffusion techniques, are straightforward to obtain and interpret. Our previous study found background parenchymal enhancement to be valuable in the differential diagnosis of molecular subtypes of breast cancer, especially triple-negative breast cancer [20]. Moreover, our research showed that diffusion-based histogram parameters based on multi-b-value diffusion imaging could distinguish HER2 statuses [21].
This study aims to explore the potential of both qualitative and quantitative MRI features in reflecting low-HER2-expression breast cancer, particularly in the context of mass and non-mass enhancement (NME) lesions. We investigate the utility of Breast Imaging Reporting and Data System (BI-RADS) descriptors, intratumoral T2 hyperintensity, and peritumoral edema in qualitative analyses and diffusion kurtosis imaging (DKI) histogram metrics in quantitative analysis.
2. Materials and Methods
2.1. Patients
This retrospective study included 246 consecutive patients treated at the Fudan University Shanghai Cancer Center between January 2018 and December 2019. The inclusion criteria were as follows: (1) histopathologically confirmed breast cancer based on surgical specimens; (2) availability of complete pre-treatment MRI scans, including T1-weighted imaging (T1WI), T2-weighted imaging (T2WI), dynamic contrast-enhanced MRI (DCE-MRI), and multi-b-value DKI sequences, all performed within one month before surgery; and (3) available pathological assessment of HER2 expression. To ensure the accuracy of imaging assessments, fourteen patients were excluded due to poor-quality MRI images with severe motion and breathing artifacts or visible biopsy marks. Ultimately, 232 patients were included in the study. A flowchart of the patient selection process is shown in Figure 1.
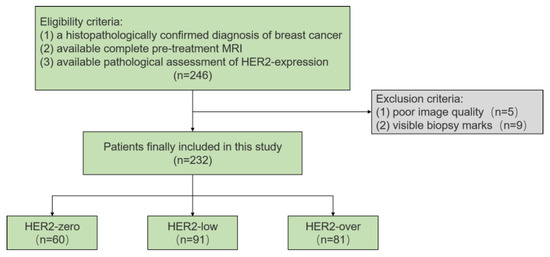
Figure 1.
Flowchart of the study.
The study protocol adhered to the Declaration of Helsinki and was approved by the ethical review committee of the Fudan University Shanghai Cancer Center, with a waiver for informed consent (NCT04461990).
2.2. Histopathological Analysis
Histopathological analysis was performed on surgical specimens. HER2 expression was determined using IHC scores, evaluated by expert pathologists following the 2018 guidelines from the American Society of Clinical Oncology and the College of American Pathologists [22]. Tumors with an IHC score of 2+ were further assessed using FISH. Based on the results, HER2 expression was classified into three categories: HER2-zero (IHC score of 0), HER2-low (IHC score of 1+ or 2+ with a negative FISH result), and HER2-overexpression (IHC score of 3+ or 2+ with a positive FISH result). Estrogen receptor (ER) and progesterone receptor (PR) positivity were defined using a cutoff value of 1%, and Ki-67 expression was categorized into high and low groups based on the median value.
2.3. Imaging Acquisition
Breast MRI examinations were performed using a 3T MRI scanner (MAGNETOM Skyra; Siemens Healthcare, Erlangen, Germany) with a dedicated 16-channel phased array bilateral breast coil. Patients were scanned in the prone position, and the sequences included axial T1WI, axial fast spin–echo fat-suppressed T2WI, axial DCE-MRI, and axial multi-b-value DKI. DCE-MRI comprised one pre-contrast phase and five post-contrast phases, while DKI was performed before contrast injection using four b-values (0, 800, 1400, and 2000 s/mm2). Detailed parameters for each sequence are provided in Table S1.
2.4. Imaging Analysis
2.4.1. Qualitative MRI Analysis
Two experienced breast radiologists (Y.Y.S., with 5 years of experience, and C.Y., with 15 years of experience) independently reviewed all MRI data, blinded to the clinical and histopathological information. In cases of disagreement, a third radiologist (Y.J.G., with 30 years of experience in breast cancer imaging) made the final decision.
The following qualitative tumor features were recorded based on the American College of Radiology BI-RADS [23]: (1) fibroglandular tissue (FGT); (2) background parenchymal enhancement (BPE); (3) multifocal or multicentric lesions; (4) intratumoral T2 hyperintensity; (5) peritumoral edema; (6) lesion type; (7) lesion size; (8) shape, margin, and internal enhancement pattern of mass lesions; and (9) distribution and internal enhancement pattern of NME lesions. For multifocal or multicentric lesions, the largest lesion was analyzed.
2.4.2. Quantitative MRI Analysis
Quantitative analysis included conventional apparent diffusion coefficient (ADC) values derived from the mono-exponential model, as well as and values from the DKI model. All DKI images were processed using a workstation (Body Diffusion Toolbox, version 0.2.2, Siemens Healthcare).
DKI is an extension of the commonly used diffusion weighted imaging (DWI) sequence in clinical practice. Traditionally, an ADC map is derived from the DWI sequence using the mono-exponential model. In this study, ADC, , and were derived from the DKI sequence. ADC was calculated using the conventional b-values (0 and 800 s/mm2) based on the mono-exponential model, which is commonly used in clinical practice. and were calculated using all b-values (0, 800, 1400, 2000 s/mm2) based on the extended fitting model. The specific equations used are as follows:
For the ADC:
where is the signal intensity at a given b value and is the signal intensity at b = 0.
For and , all b-values (0, 800, 1400, 2000) were fitted using the following equation:
where is the signal intensity at a specified b value, is the signal intensity at b = 0. is the apparent kurtosis coefficient, which is a unitless parameter that indicates the deviation of the water motion from the Gaussian distribution. is similar to the ADC, adjusted for the Gaussian diffusion behavior of water molecules.
For each case, two radiologists manually delineated the volume of interest (VOI) layer by layer around the outer edge of the lesion on the ADC maps, avoiding areas of hemorrhage, necrosis, large vessels, and cysts. Both radiologists were trained and standardized in the VOI delineation process. These VOIs were then applied to the and maps. Quantitative tumor features obtained from the VOIs included the mean, median, 5th and 95th percentiles, skewness, kurtosis, and entropy. To ensure consistency in manual VOI delineation, an inter-observer reliability analysis was conducted using the intraclass correlation coefficient (ICC).
2.5. Statistical Analysis
Statistical analyses were conducted using SPSS 20.0 software. Categorical data were presented as proportions and analyzed using the chi-squared test or Fisher’s exact test. Continuous data were presented as medians with quartiles or means with standard deviations, depending on the normality of the distribution, and analyzed using the Mann–Whitney U test or Kruskal–Wallis test. All statistical tests were two-sided, with p-values < 0.05 considered statistically significant. Variables with p-values < 0.1 in univariate analysis were included in multivariate logistic regression analysis. Diagnostic performance was evaluated using receiver operating characteristic (ROC) analysis, and the area under the curve (AUC), along with sensitivity and specificity, was calculated. For inter-observer variability, categorical data were determined by kappa coefficients and continuous data by ICC, respectively. Kappa and ICC values were interpreted as follows: <0.2 (slight agreement), 0.21–0.40 (fair agreement), 0.41–0.60 (moderate agreement), 0.61–0.80 (good agreement), and 0.81–0.99 (excellent agreement).
3. Results
3.1. Clinicopathologic Characteristics
Among the 232 patients included in the study, 60 (25.9%) had HER2-zero breast cancer, 91 (39.2%) had HER2-low breast cancer, and 81 (34.9%) had HER2-overexpression breast cancer. Of these, 145 patients presented with solitary lesions, while 87 had multifocal or multicentric lesions. The majority of the cancers were invasive ductal carcinoma (230 cases), with one case of invasive lobular carcinoma and one case of metaplastic carcinoma.
Regarding clinicopathologic features, the HER2-low group showed significantly higher positive rates for ER, PR, and hormone receptor (HR) status than the HER2-zero and HER2-overexpression groups. Additionally, based on the median Ki-67 level of 40%, a higher proportion of HER2-low cases had low Ki-67 expression compared with the other groups. There were no significant differences in lesion size among the groups. Table 1 summarizes the clinicopathological features of all patients.

Table 1.
Clinicopathological characteristics of patients according to HER2 expression levels.
3.2. Qualitative MRI Features According to HER2 Expression Levels
Significant differences were observed in the intratumoral T2 hyperintensity and lesion types between HER2-low expression and the other groups. Intratumoral T2 hyperintensity was more frequently observed in HER2-low breast cancer than in HER2-zero and HER2-overexpressing cancers (p = 0.009 and p = 0.008, respectively). Additionally, mass lesions were more common in the HER2-zero group, while NME and mass with NME lesions were more prevalent in the HER2-overexpression group (Table 2).
Table 2.
Qualitative MRI features according to HER2 expression levels.
To further explore these findings, lesion types were categorized based on the presence of NME into mass or NME-related lesions. For mass lesions, HER2-low breast cancers were more likely to have irregular shapes than the other two groups (p < 0.001 and p = 0.009, respectively). HER2-low breast cancers also more frequently showed non-circumscribed margins than HER2-zero cancers (p < 0.001). However, no significant differences were found in the qualitative MRI features for NME-related lesions (Table 2).
In multivariate analysis, the qualitative MRI features with a p-value < 0.1 from the univariate analysis—intratumoral T2 hyperintensity, mass shape, and mass margin—were included (Table S2). The results showed that irregular shape remained an independent predictor of HER2-low breast cancer when compared with HER2-zero (odds ratio [OR] = 3.91, 95% confidence interval [CI]: 1.38–11.05, p = 0.010) and HER2-overexpression (OR = 2.23, 95% CI: 1.29–8.10, p = 0.012). The AUC for distinguishing HER2-low from HER2-zero was 0.763 (95% CI: 0.667–0.859), and for HER2-low from HER2-overexpression, the AUC was 0.663 (95% CI: 0.550–0.775). Representative cases of the qualitative MRI features for HER2-zero, HER2-low, and HER2-overexpression are illustrated in Figure 2.
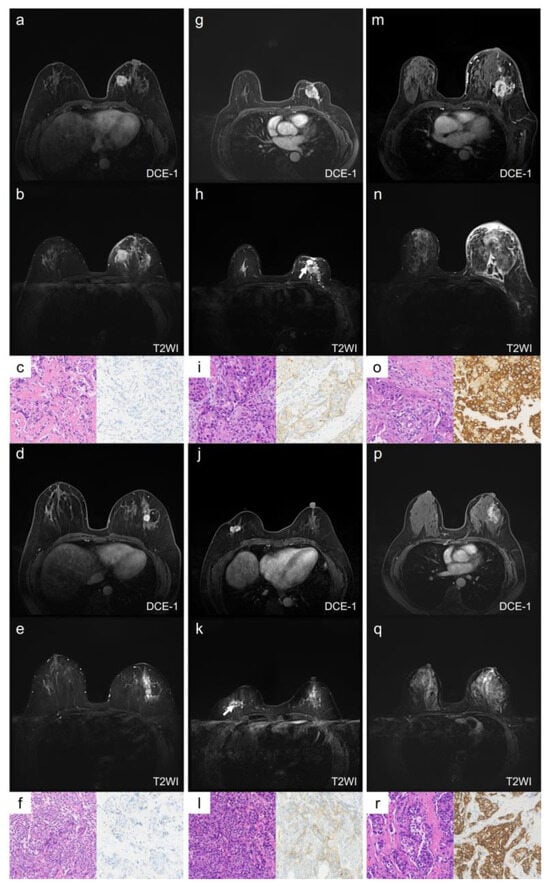
Figure 2.
Representative images of qualitative MRI features in HER2-zero, HER2-low, and HER2-overexpression breast cancer. Case 1 (a–c) and Case 2 (d–f) show HER2-zero breast cancer, Case 3 (g–i) and Case 4 (j–l) show HER2-low breast cancer, and Case 5 (m–o) and Case 6 (p–r) show HER2-overexpression breast cancer. Case 1 (a–c): A 59-year-old female with HER2-zero expression breast cancer. The lesion is located in the left breast, has a rounded shape with circumscribed margins, and shows no NME (a). There is no intratumoral hyperintensity on T2WI (b). The HE staining image (×20, (c) left) shows invasive ductal carcinoma, and the IHC result (×20, (c) right) shows an HER2 score of 0. Case 2 (d–f): A 51-year-old female with HER2-zero expression breast cancer. The lesion is located in the left breast, has a rounded shape with circumscribed margins, and shows no NME (d). There is no intratumoral hyperintensity on T2WI (e). The HE staining image (×20, (f) left) shows invasive ductal carcinoma, and the IHC result (×20, (f) right) shows an HER2 score of 0. Case 3 (g–i): A 67-year-old female with low-HER2-expression breast cancer. The lesion is located in the left breast, has an irregular shape and uncircumscribed margins, and shows no NME (g). There is an intratumoral hyperintensity area (arrow) on T2WI (h). The HE staining image (×20, (i) left) shows invasive ductal carcinoma, and the IHC result (×20, (i) right) shows an HER2 score of 1+. Case 4 (j–l): A 59-year-old female with low-HER2-expression breast cancer. The lesion is located in the right breast, has an irregular shape and uncircumscribed margins, and shows no NME (j). There is an intratumoral hyperintensity area (arrow) on T2WI (k). The HE staining image (×20, (l) left) shows invasive ductal carcinoma, and the IHC result (×20, (l) left right) shows an HER2 score of 1+. Case 5 (m–o): A 61-year-old female with HER2-overexpression breast cancer. The lesion is located in the left breast, has an irregular shape and uncircumscribed margins, and shows NME (m). There is no intratumoral hyperintensity on T2WI (n). The HE staining image (×20, (o) left) shows invasive ductal carcinoma, and the IHC result (×20, (o) right) shows an HER2 score of 3+. Case 6 (p–r): A 55-year-old female with HER2-overexpression breast cancer. The lesion is located in the left breast, and shows as an NME lesion (p). There is no intratumoral hyperintensity on T2WI (q). The HE staining image (×20, (r) left) shows invasive ductal carcinoma, and the IHC result (×20, (r) right) shows an HER2 score of 3+. NME: non-mass enhancement; DCE-1: enhancement during the first phase.
3.3. Quantitative Diffusion Features by HER2 Expression Levels
The histogram analysis of quantitative diffusion parameters revealed significant differences between the HER2-low and HER2-overexpression groups (Table 3). Specifically, the HER2-low group had lower ADCmean, ADCmedian, ADC5%, Dmean, Dmedian, and D5% values than the HER2-overexpression group (all p < 0.05). Conversely, the HER2-low group had significantly higher Kmean, Kmedian, K95%, and Kentropy values (all p < 0.05).
Table 3.
Quantitative MRI features between HER2-low and other groups.
Further analysis of these quantitative features was conducted separately for mass and NME-related lesions. Significant differences in the diffusion parameters between HER2-low and HER2-overexpressing groups persisted for NME-related lesions (Figure 3, Table S3), but no significant differences were observed for mass lesions (Table S4).
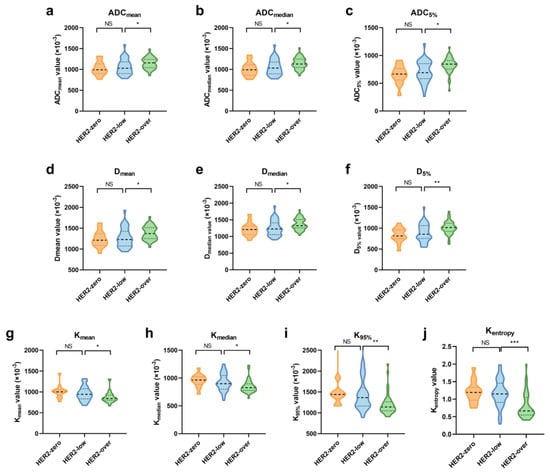
Figure 3.
Violin graph of significant quantitative MRI features in NME-related lesions among the HER2-zero, -low, and -overexpression groups. (a–c) Histogram features of ADC; (d–f) histogram features of Dapp; (g–j) histogram features of Kapp. Significance levels: *: p < 0.05, **: p < 0.01, ***: p < 0.001; NS: not significant.
ROC analysis was performed to assess the diagnostic performance of quantitative diffusion features in distinguishing HER2-low from HER2-overexpressing cancers for NME-related lesions (Table 4). The AUC values for individual histogram parameters ranged from 0.666 to 0.786. When combining variables (CombinedADC, CombinedD, CombinedK, CombinedAll), the AUC values ranged from 0.681 to 0.802, with the CombinedAll model showing the best predictive performance (AUC = 0.802). The Delong test revealed that the AUC for CombinedAll was significantly higher than that for CombinedADC (p = 0.029) and CombinedD (p = 0.003) but not significantly different from that for CombinedK (p = 0.54).
Table 4.
ROC analysis of quantitative MRI features differentiating HER2-low and HER2-overexpression breast cancer in NME-related lesions.
3.4. Reliability of Qualitative and Quantitative Features Analysis
The kappa coefficients for qualitative MRI features ranged from 0.820 to 0.957, indicating excellent agreement. The ICCs for ADC, Dapp, and Kapp were 0.811–0.883, 0.773–0.858, and 0.761–0.892, respectively, reflecting good–excellent agreement (Table S5).
4. Discussion
This study explored whether qualitative and quantitative MRI features can differentiate between HER2-zero, -low, and -overexpression breast cancers, utilizing a simple and convenient imaging method. The findings indicate that qualitative and quantitative MRI features have distinct advantages depending on the lesion type. For mass lesions, combining qualitative features like intratumoral T2 hyperintensity and mass shape allowed for effective discrimination between HER2-low and HER2-zero breast cancers, with an AUC of 0.763. In contrast, for NME lesions, where qualitative features had limited utility, quantitative features (using the CombinedAll model) distinguished HER2-low from HER2-overexpression cancers with an AUC of 0.802.
The development of HER2-targeted therapies has transformed treatment options for HER2-negative breast cancer, with HER2-low breast cancer patients now showing significant therapeutic benefits. Thus, accurately identifying HER2-low breast cancers from the traditional HER2 dichotomy is crucial for choosing appropriate treatment strategies. The features identified in this study can be detected through routine imaging, providing a more accessible and cost-effective approach to select patients who may benefit from targeted therapy. Furthermore, we discovered appropriate assessment methods for different lesion types, which have rarely been discussed in previous studies. Our findings contribute to the noninvasive preoperative assessment of low-HER2-expression breast cancer, and have significant implications for the precise diagnosis and targeted treatment of breast cancer.
A key finding in the qualitative analysis was that low-HER2-expression breast cancer had the highest proportion of intratumoral T2 hyperintensity. A possible explanation is that HER2-low breast cancers are more aggressive. Intratumoral T2 hyperintensity is typically considered a sign of necrosis, which results from tumor cell proliferation exceeding the vascular supply, leading to hypoxia in the tumor’s central region [24]. This feature is often associated with aggressive tumor behavior. The presence of T2 hyperintensity in HER2-low tumors could indicate their aggressive nature. Previous research has shown that HER2-low breast cancers are more aggressive, with the lowest pathological complete response rates to neoadjuvant therapy [7].
Another notable finding was the variation in lesion types across the HER2 expression groups. While studies have shown a link between HER2-positive breast cancer and NME, few have investigated low-HER2-expression breast cancer. Earlier studies suggested that the intraductal components of HER2-positive breast cancer are associated with the NME imaging phenotype [25,26]. Our results corroborate this, showing that the proportion of NME increases with HER2 expression levels. However, in our NME lesion analysis, the qualitative features on DCE-MRI had limited discriminatory value for HER2-low cancers. Conversely, for mass lesions, irregular shape emerged as an independent predictor of HER2-low breast cancer. This irregular shape may be linked to the higher positivity rates of ER and PR in HER2-low tumors in our study, consistent with findings by Szep et al., who noted that irregular masses are often associated with ER/PR-positive tumors [27].
While qualitative MRI features may not be highly informative for NME lesions, our study suggests that multi-b-value DKI histograms can effectively quantify HER2 expression levels in such lesions. This may indicate that our analysis of lesion distribution and internal enhancement patterns was insufficient to distinguish HER2-low breast cancer, and more refined analyses, such as those for quantitative features, are needed to better differentiate HER2-low breast cancer in NME lesions. Our analysis revealed that, in NME lesions, the mean, median, 5th percentile, ADC, and Dapp values increased with HER2 expression levels, achieving statistical significance when comparing HER2-low with HER2-overexpressing tumors. The increase in HER2 expression may have two opposing effects on tissue: promoting cell proliferation, which restricts water diffusion, and inducing angiogenesis. This enhances diffusion by increasing vascular endothelial growth factor [28]. Our results suggest that, as HER2 levels rise, the angiogenic effects outweigh the cell proliferation effects, and this can be detected through ADC and Dapp measurements.
The AUC analysis further demonstrated that Kapp had the highest diagnostic efficacy among the diffusion parameters, and combining ADC, Dapp, and Kapp improved the discriminatory ability for HER2-low and HER2-overexpression breast cancers. This suggests that Kapp may serve as a promising imaging biomarker for distinguishing HER2 expression levels. Multi-b-value DKI allows for the quantification of tissue microstructure complexity, reflected by higher Kapp values [29]. In this study, several Kapp histogram parameters were significantly elevated in HER2-low compared with HER2-overexpressing breast cancers, suggesting greater heterogeneity in HER2-low tumors. Since high heterogeneity is often associated with poor treatment response, future research could explore the role of DKI in assessing therapeutic outcomes.
This study has several limitations. First, it was a single-center retrospective study, and the sample size was relatively small. Although the data were derived from a consecutively collected group of patients and the fact that we controlled the selection criteria and the data collection process to ensure quality and reliability, selection bias may still exist. Further multicenter, large-sample studies are needed to validate the discriminatory performance of these MRI features. Second, the use of quantitative analysis led to the requirement of manual VOI drawing. While this method is simpler than radiomics analysis, it was more time-consuming than acquiring qualitative features. Future studies may benefit from utilizing automatic segmentation techniques to improve efficiency. Third, all images were acquired using the same instrument. While this allowed for consistent data acquisition, further research is necessary to assess whether the results hold across different imaging devices and parameters to improve the generalizability of the findings. Finally, the relatively short follow-up period in this study prevented us from evaluating the impact of MRI features on treatment response or long-term outcomes. However, this remains an important area for future research to explore the clinical relevance of MRI features in monitoring treatment efficacy and long-term patient prognosis.
5. Conclusions
In conclusion, our study demonstrates that qualitative and quantitative MRI features are valuable tools for noninvasively distinguishing HER2-low breast cancer, each showing unique strengths depending on the lesion type. For mass lesions, qualitative features such as irregular shape and intratumoral T2 hyperintensity are indicative of HER2-low expression. For NME lesions, quantitative features provide better discriminatory power, particularly when combined. These findings offer new insights into the noninvasive identification of HER2-low breast cancer in clinical practice, providing a more accessible and cost-effective approach to select patients who may benefit from targeted therapy.
Supplementary Materials
The following supporting information can be downloaded at: https://www.mdpi.com/article/10.3390/tomography11030031/s1, Table S1: Sequence parameters of MRI scanning; Table S2: Multivariate logistic regression analysis in mass lesions between HER2-low and other groups; Table S3: Quantitative MRI features in NME-related lesions between HER2-low and other groups; Table S4: Quantitative MRI features in mass lesions between HER2-low and other groups; Table S5: Interobserver Agreement Analysis.
Author Contributions
Conceptualization, Y.G., C.Y. and J.G.; methodology, X.Z. and J.Z.; validation, Y.G. and C.Y.; formal analysis, Y.S.; data curation, Q.B. and C.F.; writing—original draft preparation, Y.S.; writing—review and editing, S.W., J.D., S.S. and J.W.; visualization, Y.S.; supervision, Y.G.; funding acquisition, Y.G. and C.Y. All authors have read and agreed to the published version of the manuscript.
Funding
This research was funded by National Natural Science Foundation of China, grant number 82071878 and 82271957.
Institutional Review Board Statement
The study was conducted in accordance with the Declaration of Helsinki and approved by the Ethical committee of Fudan University Shanghai Cancer Center (NCT04461990) in 21 August 2020.
Informed Consent Statement
Patient consent was waived due to the retrospective nature of our study.
Data Availability Statement
The datasets presented in this article are not readily available because the data are part of an ongoing study.
Conflicts of Interest
Author Caixia Fu was employed by the company Siemens Healthcare. The remaining authors declare that the research was conducted in the absence of any commercial or financial relationships that could be construed as a potential conflict of interest.
References
- Sung, H.; Ferlay, J.; Siegel, R.L.; Laversanne, M.; Soerjomataram, I.; Jemal, A.; Bray, F. Global Cancer Statistics 2020: GLOBOCAN Estimates of Incidence and Mortality Worldwide for 36 Cancers in 185 Countries. CA Cancer J. Clin. 2021, 71, 209–249. [Google Scholar] [CrossRef] [PubMed]
- Wulfkuhle, J.D.; Berg, D.; Wolff, C.; Langer, R.; Tran, K.; Illi, J.; Espina, V.; Pierobon, M.; Deng, J.; DeMichele, A.; et al. Molecular Analysis of Her2 Signaling in Human Breast Cancer by Functional Protein Pathway Activation Mapping. Clin. Cancer Res. 2012, 18, 6426–6435. [Google Scholar] [CrossRef] [PubMed]
- Marchio, C.; Annaratone, L.; Marques, A.; Casorzo, L.; Berrino, E.; Sapino, A. Evolving Concepts in Her2 Evaluation in Breast Cancer: Heterogeneity, Her2-Low Carcinomas and Beyond. Semin. Cancer Biol. 2021, 72, 123–135. [Google Scholar] [CrossRef] [PubMed]
- Hamilton, E.; Shastry, M.; Shiller, S.M.; Ren, R. Targeting HER2 Heterogeneity in Breast Cancer. Cancer Treat. Rev. 2021, 100, 102286. [Google Scholar] [CrossRef]
- Dieci, M.V.; Miglietta, F. Her2: A Never Ending Story. Lancet Oncol. 2021, 22, 1051–1052. [Google Scholar] [CrossRef]
- Zhu, S.; Lu, Y.; Fei, X.; Shen, K.; Chen, X. Pathological Complete Response, Category Change, and Prognostic Significance of HER2-Low Breast Cancer Receiving Neoadjuvant Treatment: A Multicenter Analysis of 2489 Cases. Br. J. Cancer 2023, 129, 1274–1283. [Google Scholar] [CrossRef]
- Zhang, G.; Ren, C.; Li, C.; Wang, Y.; Chen, B.; Wen, L.; Jia, M.; Li, K.; Mok, H.; Cao, L.; et al. Distinct Clinical and Somatic Mutational Features of Breast Tumors with High-, Low-, or Non-Expressing Human Epidermal Growth Factor Receptor 2 Status. BMC Med. 2022, 20, 142. [Google Scholar] [CrossRef]
- Dai, L.-J.; Ma, D.; Xu, Y.-Z.; Li, M.; Li, Y.-W.; Xiao, Y.; Jin, X.; Wu, S.-Y.; Zhao, Y.-X.; Wang, H.; et al. Molecular Features and Clinical Implications of the Heterogeneity in Chinese Patients with HER2-Low Breast Cancer. Nat. Commun. 2023, 14, 5112. [Google Scholar] [CrossRef]
- Mann, R.M.; Kuhl, C.K.; Kinkel, K.; Boetes, C. Breast MRI: Guidelines from the European Society of Breast Imaging. Eur. Radiol. 2008, 18, 1307–1318. [Google Scholar] [CrossRef]
- Malhaire, C.; Selhane, F.; Saint-Martin, M.-J.; Cockenpot, V.; Akl, P.; Laas, E.; Bellesoeur, A.; Eddine, C.A.; Bereby-Kahane, M.; Manceau, J.; et al. Exploring the Added Value of Pretherapeutic MR Descriptors in Predicting Breast Cancer Pathologic Complete Response to Neoadjuvant Chemotherapy. Eur. Radiol. 2023, 33, 8142–8154. [Google Scholar] [CrossRef]
- Mann, R.M.; Cho, N.; Moy, L. Breast MRI: State of the Art. Radiology 2019, 292, 520–536. [Google Scholar] [CrossRef]
- Elias, S.G.; Adams, A.; Wisner, D.J.; Esserman, L.J.; Veer, L.J.V.; Mali, W.P.; Gilhuijs, K.G.; Hylton, N.M. Imaging Features of Her2 Overexpression in Breast Cancer: A Systematic Review and Meta-Analysis. Cancer Epidemiol. Biomark. Prev. 2014, 23, 1464–1483. [Google Scholar] [CrossRef] [PubMed]
- Li, C.; Song, L.; Yin, J. Intratumoral and Peritumoral Radiomics Based on Functional Parametric Maps from Breast DCE-MRI for Prediction of HER-2 and Ki-67 Status. J. Magn. Reson. Imaging 2021, 54, 703–714. [Google Scholar] [CrossRef]
- Bian, X.; Du, S.; Yue, Z.; Gao, S.; Zhao, R.; Huang, G.; Guo, L.; Peng, C.; Zhang, L. Potential Antihuman Epidermal Growth Factor Receptor 2 Target Therapy Beneficiaries: The Role of MRI-Based Radiomics in Distinguishing Human Epidermal Growth Factor Receptor 2-Low Status of Breast Cancer. J. Magn. Reson. Imaging 2023, 58, 1603–1614. [Google Scholar] [CrossRef]
- Guo, Y.; Xie, X.; Tang, W.; Chen, S.; Wang, M.; Fan, Y.; Lin, C.; Hu, W.; Yang, J.; Xiang, J.; et al. Noninvasive identification of HER2-low-positive status by MRI-based deep learning radiomics predicts the disease-free survival of patients with breast cancer. Eur. Radiol. 2023, 34, 899–913. [Google Scholar] [CrossRef] [PubMed]
- Ramtohul, T.; Djerroudi, L.; Lissavalid, E.; Nhy, C.; Redon, L.; Ikni, L.; Djelouah, M.; Journo, G.; Menet, E.; Cabel, L.; et al. Multiparametric Mri and Radiomics for the Prediction of Her2-Zero, -Low, and -Positive Breast Cancers. Radiology 2023, 308, e222646. [Google Scholar] [CrossRef] [PubMed]
- Goto, M.; Le Bihan, D.; Sakai, K.; Yamada, K. The Diffusion MRI Signature Index is Highly Correlated with Immunohistochemical Status and Molecular Subtype of Invasive Breast Carcinoma. Eur. Radiol. 2022, 32, 4879–4888. [Google Scholar] [CrossRef]
- Çelebi, F.; Agacayak, F.; Ozturk, A.; Ilgun, S.; Ucuncu, M.; Iyigun, Z.E.; Ordu, Ç.; Pilanci, K.N.; Alco, G.; Gultekin, S.; et al. Usefulness of Imaging Findings in Predicting Tumor-Infiltrating Lymphocytes in Patients with Breast Cancer. Eur. Radiol. 2019, 30, 2049–2057. [Google Scholar] [CrossRef]
- Chen, P.; Zhao, S.; Guo, W.; Shao, G. Dynamic Contrast-Enhanced Magnetic Resonance Imaging Features and Apparent Diffusion Coefficient Value of HER2-Positive/HR-Negative Breast Carcinoma. Quant. Imaging Med. Surg. 2023, 13, 4816–4825. [Google Scholar] [CrossRef]
- You, C.; Zhang, Y.; Chen, Y.; Hu, X.; Hu, D.; Wu, J.; Gu, Y.; Peng, W. Evaluation of Background Parenchymal Enhancement and Histogram-Based Diffusion-Weighted Image in Determining the Molecular Subtype of Breast Cancer. J. Comput. Assist. Tomogr. 2021, 45, 711–716. [Google Scholar] [CrossRef]
- You, C.; Li, J.; Zhi, W.; Chen, Y.; Yang, W.; Gu, Y.; Peng, W. The Volumetric-Tumour Histogram-Based Analysis of Intravoxel Incoherent Motion and Non-Gaussian Diffusion MRI: Association with Prognostic Factors in HER2-Positive Breast Cancer. J. Transl. Med. 2019, 17, 182. [Google Scholar] [CrossRef] [PubMed]
- Wolff, A.C.; Hammond, M.E.H.; Allison, K.H.; Harvey, B.E.; Mangu, P.B.; Bartlett, J.M.S.; Bilous, M.; Ellis, I.O.; Fitzgibbons, P.; Hanna, W.; et al. Human Epidermal Growth Factor Receptor 2 Testing in Breast Cancer: American Society of Clinical Oncology/College of American Pathologists Clinical Practice Guideline Focused Update. J. Clin. Oncol. 2018, 36, 2105–2122. [Google Scholar] [CrossRef]
- Morris, E.A.; Comstock, C.E.; Lee, C.H.; Lehman, C.D.; Ikeda, D.M.; Newstead, G.M. Acr Bi-Rads® Magnetic Resonance Imaging. ACR BI-RADS® Atlas, Breast Imaging Reporting Data System 5. 2013. Available online: https://www.acr.org/Clinical-Resources/Clinical-Tools-and-Reference/Reporting-and-Data-Systems/BI-RADS (accessed on 1 March 2025).
- Dietzel, M.; Baltzer, P.A.; Vag, T.; Herzog, A.; Gajda, M.; Camara, O.; Kaiser, W.A. The Necrosis Sign in Magnetic Resonance-Mammography: Diagnostic Accuracy in 1,084 Histologically Verified Breast Lesions. Breast J. 2010, 16, 603–608. [Google Scholar] [CrossRef]
- Koh, J.; Park, A.Y.; Ko, K.H.; Jung, H.K. Can Enhancement Types on Preoperative Mri Reflect Prognostic Factors and Surgical Outcomes in Invasive Breast Cancer? Eur. Radiol. 2019, 29, 7000–7008. [Google Scholar] [CrossRef]
- Seyfettin, A.; Dede, I.; Hakverdi, S.; Asig, B.D.U.Z.E.L.; Temiz, M.; Karazincir, S. MR Imaging Properties of Breast Cancer Molecular Subtypes. Eur. Rev. Med. Pharmacol. Sci. 2022, 26, 3840–3848. [Google Scholar] [CrossRef]
- Szep, M.; Pintican, R.; Boca, B.; Perja, A.; Duma, M.; Feier, D.; Fetica, B.; Eniu, D.; Dudea, S.M.; Chiorean, A. Multiparametric MRI Features of Breast Cancer Molecular Subtypes. Medicina 2022, 58, 1716. [Google Scholar] [CrossRef]
- Suo, S.; Zhang, D.; Cheng, F.; Cao, M.; Hua, J.; Lu, J.; Xu, J. Added Value of Mean and Entropy of Apparent Diffusion Coefficient Values for Evaluating Histologic Phenotypes of Invasive Ductal Breast Cancer with MR Imaging. Eur. Radiol. 2019, 29, 1425–1434. [Google Scholar] [CrossRef] [PubMed]
- Wang, K.; Cheng, J.; Wang, Y.; Wu, G. Renal Cell Carcinoma: Preoperative Evaluate the Grade of Histological Malignancy Using Volumetric Histogram Analysis Derived from Magnetic Resonance Diffusion Kurtosis Imaging. Quant. Imaging Med. Surg. 2019, 9, 671–680. [Google Scholar] [CrossRef] [PubMed]
Disclaimer/Publisher’s Note: The statements, opinions and data contained in all publications are solely those of the individual author(s) and contributor(s) and not of MDPI and/or the editor(s). MDPI and/or the editor(s) disclaim responsibility for any injury to people or property resulting from any ideas, methods, instructions or products referred to in the content. |
© 2025 by the authors. Licensee MDPI, Basel, Switzerland. This article is an open access article distributed under the terms and conditions of the Creative Commons Attribution (CC BY) license (https://creativecommons.org/licenses/by/4.0/).